The Asian Productivity Organization (APO) was established in 1961 as an intergovernmental organization to promote productivity in Asia and the Pacific regions. It performs roles as a think tank, catalyst, regional advisor, institution builder, and clearing house for productivity information. The APO promotes modern productivity skills, techniques and experiences in agriculture, industry, and services. It has 18 member countries and its headquarters is in Tokyo, Japan. The APO aims to create a paradigm shift for productivity enhancement that improves environmental quality and leads to competitive advantage, while sustaining improved quality of human life.
Lean Is A Philosophy That Seeks To Eliminate Waste In All Aspects Of A Firm’s Production Activities: Human Relations, Vendor Relations, Technology, And The Management Of Materials And Inventory.
Here is my definition of Toyota Production System based on my 30 years experience working for Toyota Manufacturing and helping companies all over the World with Lean Transformation.
Overview on the Toyota production system principles, techniques and theories.
The presentation include:
-Lean Manufacturing Principles
-Productivity Measurement, Analysis and Improvement
-Effect & Elimination of the Manufacturing 7-Wastes
-Lean Improvement Techniques
-Lean Management for Making Improvement & Gaining Sustainability
Circular economy as strategy for sustainable development and business innovationMichael Søgaard Jørgensen
Critical introduction to circular economy and how possiiblities and limitations for application in Danish businesses' strategies are analysed in a Danish research project
Presentation on Kaizen, continuous Improvement which includes Introduction, benefits, 5"s" about Kaizen and its implementation on Toyota with 7 Principles in Production system. with Meaningful Conclusion in brief.
kaizen presentation in 5th national kaizen competition at CICU ludhiana-Punj...Aman Deep Singh
A small award winning Presentation....from M/S Perfect Industries, C65,Focal Point .Ludhiana..India--Mob no: -+91 75083-37007.Best Kaizen in New Product Design-------Thanks to the honorable JUdgES......
“Lean” is a management philosophy based on the Toyota Production System (TPS). With Lean Manufacturing, you will be able to enhance value for your customers by improving and smoothing the process flow and eliminating waste. Simply put, with Lean, you will be able to increase productivity and create greater customer value with less resources.
By teaching this presentation, managers and employees will have a better understanding of the Lean principles and approach to eliminating waste, and will be more forthcoming to lead and participate in the Lean implementation process.
LEARNING OBJECTIVES
1. Acquire knowledge on the key concepts and principles of Lean
2. Describe the common Lean methods and tools for waste elimination and value creation
3. Describe the key roles in Lean deployment
4. Define the success factors for sustaining a Lean culture
CONTENTS
1. Introduction to Lean Manufacturing
2. Key Concepts of Lean
3. Lean Methods & Tools
4. Lean Roles
5. Sustaining a Lean Culture
To download this presentation, visit:
https://www.oeconsulting.com.sg/training-presentations
"Global outlook for borates", presentation by Gary Goldberg, President & Chief Executive Officer, Rio Tinto Minerals, Industrial Minerals Congress, Miami, Florida, March 22 - 24, 2010
International Journal of Engineering Research and Development (IJERD)IJERD Editor
journal publishing, how to publish research paper, Call For research paper, international journal, publishing a paper, IJERD, journal of science and technology, how to get a research paper published, publishing a paper, publishing of journal, publishing of research paper, reserach and review articles, IJERD Journal, How to publish your research paper, publish research paper, open access engineering journal, Engineering journal, Mathemetics journal, Physics journal, Chemistry journal, Computer Engineering, Computer Science journal, how to submit your paper, peer reviw journal, indexed journal, reserach and review articles, engineering journal, www.ijerd.com, research journals,
yahoo journals, bing journals, International Journal of Engineering Research and Development, google journals, hard copy of journal
Innovate uk Horizons Sustainable Economy Framework,Innovate UK
Horizons is a practical tool that helps you to work out just that. It defines the environmental limits and social conditions necessary for a sustainable economy.
Use it to develop and test your strategy, inform commercial decisions, and drive new innovation.
Infinite Industries is a South Africa based upcycling business that converts unrecyclable plastics into building materials. With an new business pipeline of more than R150 million they are looking to expand. This is your opportunity to get in early on a growing start with some serious environment impact credentials.
APPLICATION IN FORM - I FOR PRIOR ENVIRONMENTAL CLEARANCEzubeditufail
APPLICATION IN FORM - I FOR PRIOR ENVIRONMENTAL CLEARANCE IN RESPECT OF THE
PROPOSED KHAIRAGURA OPENCAST EXPANSION COAL
MINING PROJECT NEAR KHAIRAGURA VILLAGE,
TIRIYANI MANDAL, ADILABAD DISTRICT, A.P.
DEPARTMENT OF ENVIRONMENT
THE SINGARENI COLLIERIES COMPANY LIMITED
(A Government Company)
KOTHAGUDEM COLLIERIES-507101 (A.P)
JANUARY 2013
Environmental and Social Management Framework (ESMF) - Karachi Neighborhood I...zubeditufail
Directorate of Urban Policy & Strategic Planning, Planning & Development Department, Government of Sindh
Karachi Neighborhood Improvement Project
Environmental and Social Management Framework (ESMF)
February 2017
Guiding Principles and Recommendations for Responsible Business Operations in and around Key Biodiversity Areas (KBAs)
A collaborative project of the KBA Partnership coordinated by IUCN
Draft 2 for public consultation
2 December 2016
For any query about this document or the project, please contact Giulia Carbone, Deputy Director, Global Business and Biodiversity Programme, IUCN (Giulia.carbone@iucn.org).
A global standard_for_the_identification_of_key_biodiversity_areas_final_webzubeditufail
A Global Standard for the Identification of Key Biodiversity Areas
Version 1.0
Prepared by the IUCN Species Survival Commission and IUCN World Commission on Protected Areas in association with the IUCN Global Species Programme
23 March 2016
WRI’s brand new “Food Service Playbook for Promoting Sustainable Food Choices” gives food service operators the very latest strategies for creating dining environments that empower consumers to choose sustainable, plant-rich dishes. This research builds off our first guide for food service, now with industry experience and insights from nearly 350 academic trials.
"Understanding the Carbon Cycle: Processes, Human Impacts, and Strategies for...MMariSelvam4
The carbon cycle is a critical component of Earth's environmental system, governing the movement and transformation of carbon through various reservoirs, including the atmosphere, oceans, soil, and living organisms. This complex cycle involves several key processes such as photosynthesis, respiration, decomposition, and carbon sequestration, each contributing to the regulation of carbon levels on the planet.
Human activities, particularly fossil fuel combustion and deforestation, have significantly altered the natural carbon cycle, leading to increased atmospheric carbon dioxide concentrations and driving climate change. Understanding the intricacies of the carbon cycle is essential for assessing the impacts of these changes and developing effective mitigation strategies.
By studying the carbon cycle, scientists can identify carbon sources and sinks, measure carbon fluxes, and predict future trends. This knowledge is crucial for crafting policies aimed at reducing carbon emissions, enhancing carbon storage, and promoting sustainable practices. The carbon cycle's interplay with climate systems, ecosystems, and human activities underscores its importance in maintaining a stable and healthy planet.
In-depth exploration of the carbon cycle reveals the delicate balance required to sustain life and the urgent need to address anthropogenic influences. Through research, education, and policy, we can work towards restoring equilibrium in the carbon cycle and ensuring a sustainable future for generations to come.
Natural farming @ Dr. Siddhartha S. Jena.pptxsidjena70
A brief about organic farming/ Natural farming/ Zero budget natural farming/ Subash Palekar Natural farming which keeps us and environment safe and healthy. Next gen Agricultural practices of chemical free farming.
Artificial Reefs by Kuddle Life Foundation - May 2024punit537210
Situated in Pondicherry, India, Kuddle Life Foundation is a charitable, non-profit and non-governmental organization (NGO) dedicated to improving the living standards of coastal communities and simultaneously placing a strong emphasis on the protection of marine ecosystems.
One of the key areas we work in is Artificial Reefs. This presentation captures our journey so far and our learnings. We hope you get as excited about marine conservation and artificial reefs as we are.
Please visit our website: https://kuddlelife.org
Our Instagram channel:
@kuddlelifefoundation
Our Linkedin Page:
https://www.linkedin.com/company/kuddlelifefoundation/
and write to us if you have any questions:
info@kuddlelife.org
Artificial Reefs by Kuddle Life Foundation - May 2024
APO Green Productivity - Chapter Presentation
1. L0: APO & GP / 1Asian Productivity Organization, Tokyo
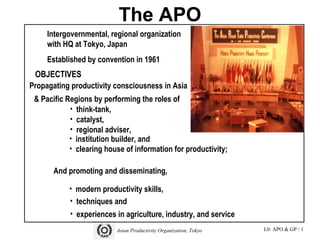
The APO
Asian Productivity Organization, Tokyo 3
Propagating productivity consciousness in Asia
& Pacific Regions by performing the roles of
• think-tank,
• catalyst,
• regional adviser,
• institution builder, and
• clearing house of information for productivity;
And promoting and disseminating,
• modern productivity skills,
• techniques and
• experiences in agriculture, industry, and service
Intergovernmental, regional organization
with HQ at Tokyo, Japan
Established by convention in 1961
OBJECTIVES
2. L0: APO & GP / 2Asian Productivity Organization, Tokyo
APO Member Countries
• APO is non-political, non profit making and non discriminatory body
• APO has 18 Member Countries
Bangladesh
Republic of China
Fiji
Hong Kong
India
Nepal
Pakistan
Philippines
Singapore
Sri Lanka
Thailand
Vietnam
Indonesia
Iran
Japan
Republic of Korea
Malaysia
Mongolia
• Membership open to all governments which are ESCAP members
3. L0: APO & GP / 3Asian Productivity Organization, Tokyo
Sustained
Improvement in
Quality of Human
Life
Development
Environmental Quality
PP, CP, WM etc
Productivity
(TQM, 5S, etc)
Occupational
Health and Safety
(OHS)
Socio-Economic
To create paradigm shift amongst the stakeholders for productivity
enhancement that is in harmony with the environment, leading to
(international) competitive advantage for a sustained improvement in the
quality of life
Environment
Department Mission
The Environment Department was established through a special grant from the
Official Development Assistance (ODA) to promote Green Productivity (GP)
and other Environmental Projects
Global
(Improvements/benefits)
Special Program for the Environment (SPE)
4. L0: APO & GP / 4Asian Productivity Organization, Tokyo
MANILA DECLARATION ONMANILA DECLARATION ON
GREEN PRODUCTIVITYGREEN PRODUCTIVITY
The declaration was signed on 6 December
1996 at Manila, Philippines at the APO
World Conference on Green Productivity.
The Conference declared:
Environmental Protection should
be promoted without sacrificing
Productivity.
Environmental Protection should
be promoted without sacrificing
Productivity.
APO World Conference on Green Productivity, 1996
5. L0: APO & GP / 5Asian Productivity Organization, Tokyo
APO GP Programs
Promotion Mission
Demonstration
Program
Dissemination
Assistance
1
2
3
International
Cooperation
Technical Information
& Advisory Services
6. L0: APO & GP / 6Asian Productivity Organization, Tokyo
International Cooperation
APO
ILO
CIDAUS-AEP
USEPA
UNEP-IE CDG
7. L0: APO & GP / 7Asian Productivity Organization, Tokyo
CHAPTER
8. L0: APO & GP / 8Asian Productivity Organization, Tokyo
Economic Activity and Environment
ECONOMIC ACTIVITY
Production
Patterns
Consumption
Patterns
Natural resources drawn from
the environment
Impact of resource extraction,
use and disposal
Trade
ENVIRONMENT
Drives Drives
9. L0: APO & GP / 9Asian Productivity Organization, Tokyo
Average annual growth between
1990 to 1996, for East Asia and
the Pacific, has been 14.5%.
Industry in East Asia has
increased its share of total output
from 32% to 45% and in South
Asia from 21% to 28% between
1965 to 1996.
In South Asia the value added
(as a % of GDP) by agriculture
has fallen from 38% in 1980 to
28% in 1996 while industrial
output has increased from 25% to
28% in the same period.
Exports of services from
developing countries grew at an
average annual rate of 12% in the
1990s, twice as fast as those from
industrial regions.
Some facts about Asian economic growth
ProductionProduction
IndustryIndustry
AgricultureAgriculture
ServicesServices
Production Patterns
10. L0: APO & GP / 10Asian Productivity Organization, Tokyo
Consumption Pattern
•Consumers boycotts of products based on environmentally and
socially
damaging practices include e.g., use of tropical timber, textiles
produced under unsafe / exploitative social conditions, metal finishing
done with toxic metals. Boycotts against products of oil companies
causing damage to eco-sensitive areas and indigenous people have also
been intensive.
•Important trends are emerging among consumers in North America,
Europe and Japan. Over 80% of Americans are concerned about the
environmental and social consequences of a materialistic society.
•The Government of Japan launched the ECO ASIA initiative, to draw up
a long term perspective for sustainable development for the Asia-Pacific
region upto 2025. This found a common Asia-Pacific “eco-
consciousness.”
•Green consumer movement has waned since the late 1980s in Europe.
Between 1992-1995 willingness to buy eco-friendly products has fallen
from 69-58% in Britain and 75-50% in Germany. Main reason is
confusion due to proliferation of labels and false claims. Active demand
still exists however in some areas such as organic produce, fair trade
coffee, tea and bananas, organic cotton.
11. L0: APO & GP / 11Asian Productivity Organization, Tokyo
Industry and Environmental Degradation
Resource extraction of raw
materials through mining,
logging, water extraction,
energy generation.
Resource demand during
distribution, use and disposal
of goods and services.
Resource utilization during
manufacture leading to
emissions, wastewater and
solid waste generation.
Costs of environmental
damage
12. L0: APO & GP / 12Asian Productivity Organization, Tokyo
Trade and Environment
•Trade is becoming increasingly globalized as well as liberalized.
•International trade liberalization has been crucial for the success of
Asian economies. Trade expansion has led to rapid growth in
export-oriented industries, urbanization, construction boom.
•Patterns of international trade have changed markedly. Focus of trade from
the Asian region has been primarily on resource-intensive and labor
intensive goods to the North.
•Such growth has had wide ranging benefits, improved living standards, provided
technological capabilities and financial resources. However, this outward-looking
export based growth has in the aggregate generated new and increased
environmental pressures.
•From an economic perspective, both trade liberalization and environmental
protection are inherently important. There is a need is to combine both these aspects
to promote sustainable economic development.
13. L0: APO & GP / 13Asian Productivity Organization, Tokyo
One of the most important events in international trade is
the completion of negotiations of the Uruguay Round in 1993.
Implications for developing countries are strong given that:
(I) gains of US$ 230 billion per annum are likely to accrue to world
economy. Of this less than 30% gains will accrue to the South i.e., the
developing countries;
(II) possible economic losses to developing countries importing food because
of decreases in allowable European and North American agricultural subsidies.
(III) Multifibre Agreement will be phased out in 2004 thus removing quotas on exports of textiles
and clothing which would be favorable for a number of developing countries.
Trade restrictions, protectionist barriers, non - tariff trade barriers such as ecolabels have
environmental and economic implications for developing countries and sustainable trade .
In this context, the need to strengthen policy compatibility between trade liberalization and
environmental protection has never been more crucial particularly for developing countries. This
alone will ensure their survival in international trade. Role of WTO will be crucial in integrating trade
and its environmental implications and in promoting and simulating trade in sustainable goods and
services
Trade and Developing Countries
14. L0: APO & GP / 14Asian Productivity Organization, Tokyo
Importance of SME‘s
PROS CONS
Important Source of
Employment for low wage
earners
Pose difficult pollution abatement
problems
Flexible, React quickly to
needs and demand
Specific pollution per unit of product
greater than large scale units
Talent for innovation Limited technical and Financial
resources at their disposal
•A SME enterprise employ less than 100 people and has capital less than US
$ 1,00,000
•SMEs makeup 90% of number of enterprises in Asia
•Account for more than 50% of the Total Industrial Sector output in India
and China and 10 to 25% in most other Asian countries
•Provide employment to about 50% workforce
•Contribute 50% of GDP
•Provide about 35% exports
15. L0: APO & GP / 15Asian Productivity Organization, Tokyo
Environmental issues from 1960s
1970s - Industrial production was rapidly rising with a 7% annual
growth in manufacturing. Negative environmental impacts of this boom
were perceived as localized problems of air, water and land pollution.
1980s - Increasing global population; consumption patterns became
more resource demanding; environmental problems transcended
local and regional boundaries; recognition of regional and global
impacts of development; acid rain, global warming, ozone layer
depletion being recognized as serious issues; trade increased with
dependence of developed economies for non-renewable resources on
developing economies.
1990s - Sustainable development, environmental and social soundness
began to be recognized as issues of governance. Role of environment
and development in international trade have become issues of
international polity and diplomacy. Emergence of a New Order with
sustainable development as the need of the hour.
16. L0: APO & GP / 16Asian Productivity Organization, Tokyo
Landmark milestones from 1960s
1960s 1970s 1980s 1990s
RachelCarson’sbook“SilentSpring”
Originoftheconceptof“LimitsofGrowth”
ThePopulationBombTheorybyEhrlich&
Ehrlich
TheGlobal2000Report1980
WCED’sReport“OurCommonFuture”
EarthSummitatRioandtheAgenda21
InternationalFactor10Club
UnitedNationsConferencesonEnvironment,
Population,HumanSettlements
17. L0: APO & GP / 17Asian Productivity Organization, Tokyo
Global Environmental Issues
Population ( in billion)
Megacities (population
8 million )
*Food
Fisheries (in million tons)
Water Use (in cubic km.)
Rainforest cover
CO2 emissions (in billion
tons of carbon)
Ozone Layer ( conc. of
CFCs in parts per billion)
1950 1972 1997
2.5 3.8 5.8
2.0 9.0 25.0
1980 2450 2770
19 58 91
1300 2600 4200
100 85 70
1.6 4.9 7.0
- 1.4 3.0
18. L0: APO & GP / 18Asian Productivity Organization, Tokyo
Regional Scenario
Pollution
Environmental
Degradation
Resource Depletion
Biodiversity
19. L0: APO & GP / 19Asian Productivity Organization, Tokyo
Regional Scenario - Pollution
• Air
Pollution
• Forest Fire
Hazard
• Marine
Pollution
• Toxic
wastes
• Solid
wastes
20. L0: APO & GP / 20Asian Productivity Organization, Tokyo
Regional Scenario - Environmental Degradation
Only 15% of the total
land area is considered
arable.
South-East Asia has
the highest absolute
deforestation rates.
35% of productive
land in Asia is now
desertified.
21. L0: APO & GP / 21Asian Productivity Organization, Tokyo
Regional scenario - Resource Depletion
•Water scarcity:
Fresh-water
availability of
below 1,000
cubic metres
per capita per
year indicates
water scarcity.
India is
projected to fall
into the water-
stress category
before 2025.
•Fossil fuel and
energy demand:
The region
accounted for
about 41% of
world coal
consumption in
1993.
declining availability
of fresh water
deteriorating water
quality
depletion of non-
renewable fuel and
mineral resources
declining availability
of fresh water
deteriorating water
quality
depletion of non-
renewable fuel and
mineral resources
22. L0: APO & GP / 22Asian Productivity Organization, Tokyo
Only 10-30% of
natural habitats
are left in many
countries in the
region.
Regional Scenario - Biodiversity
Genetic erosion
Loss of biodiversity
Species extinction
Natural ecosystem loss
Genetic erosion
Loss of biodiversity
Species extinction
Natural ecosystem loss
23. L0: APO & GP / 23Asian Productivity Organization, Tokyo
Asian Productivity Organization, Tokyo 6
CHINA--- 10% OF ANNUAL GDP
INDIA--- > 5% OF GDP
ASIAN REGION - 5% OF ANNUAL GDP
World Bank estimates in 1992 -
East Asiancountries would spend up to $ 20 billiona
year during the 1990s to clean up environmental
damage brought about by rapid industrializationand
population growth.
Estimated worldwide
expenditurefor purchasing and
maintaining end-of-pipe
technologies is over US$ 3
BILLION.
JAPAN --- 1% OF GDP
in 1995.
COST OF ENVIRONMENTAL DAMAGE
24. L0: APO & GP / 24Asian Productivity Organization, Tokyo
4.5 Trillion Yen Environmental Damage in 1995
Cost incurred by Japan from the loss by damaging the
environment in 1995 was calculated as 4.5 trillion yen in real
terms which was about 1% of GDP.
25. L0: APO & GP / 25Asian Productivity Organization, Tokyo
Public Concern
Societal demand for a cleaner
environment and a better “quality of
life” is increasing.
Public concern is being expressed as:
protests/law suits
consumer boycotts of products
willingness to pay a premium for
eco-friendly products
Stop
thePollution
Incidences Cause Result
Love Canal Episode, USA Toxic Waste Poisioning
Minamata Mercury Poisioning
Bhopal gas Tragedy MIC Gas release
Bangladesh Wells
Arsenic Poisioning of the Ground
water
Rivers like Ganges, Yamuna,
Yangtze, Irrawady etc.
Industrial wastewater & domestic
sewage discharge
PUBLIC
PROTEST
26. L0: APO & GP / 26Asian Productivity Organization, Tokyo
International treaties and
conventions to address global issues
IMPACT
Basel Convention
Montreal Protocol
Climate Change Convention
Convention on Biodiversity
Convention to Combat Desertification
Basel Convention
Montreal Protocol
Climate Change Convention
Convention on Biodiversity
Convention to Combat Desertification
Phase out of:
hazardous materials
lead in petrol
CFCs in refrigeration
GHG emitting processes
Biodiversity conservation
promotion
Phase out of:
hazardous materials
lead in petrol
CFCs in refrigeration
GHG emitting processes
Biodiversity conservation
promotion
International Environmental Treaties and Conventions
27. L0: APO & GP / 27Asian Productivity Organization, Tokyo
“development that meets the needs
of the present generation
without compromising the ability of
the future generations to
meet their needs.” ………..Our
Common Future, 1987.
“development that meets the needs
of the present generation
without compromising the ability of
the future generations to
meet their needs.” ………..Our
Common Future, 1987.
Sustainable Development
Agenda 21, is a 300 page plan for achieving sustainable development in
the 21st century. It was adopted in the first international Earth Summit,
at the United Nations Conference on Environment and Development
(UNCED) held in Rio de Janeiro, Brazil, on 14 June 1992
Agenda 21, is a 300 page plan for achieving sustainable development in
the 21st century. It was adopted in the first international Earth Summit,
at the United Nations Conference on Environment and Development
(UNCED) held in Rio de Janeiro, Brazil, on 14 June 1992
Sustainable Development and Agenda 21
28. L0: APO & GP / 28Asian Productivity Organization, Tokyo
Response to Agenda 21
Countries set up their own Local
Agenda 21 plans.
Formation of the World Business
Council of
Sustainable Development
(WBCSD), 1992
Formation of Malaysian Business
Council of Sustainable
Development, 1992
WBCSD’s Declaration for
sustainable development stressed
on eco-efficiency in production -
More for Less
29. L0: APO & GP / 29Asian Productivity Organization, Tokyo
Corporate response
Corporate responses to Agenda 21 have been
in the form of a number of voluntary initiatives.
These include agreements, programs, standards
and codes of conduct.
Predominant among them are:
Responsible Care
Environmental Stewardship
Corporate Environmental Policy and Reporting
Certification such as ISO 14000, SA 8000
30. L0: APO & GP / 30Asian Productivity Organization, Tokyo
Eco-efficiency, Factor 4 and 10
Eco-efficiency emphasizes economics, in addition to environmental improvement.
It is concerned with resource productivity, that is,
maximizing the value added per unit of resource input.
The Wuppertal Institute in Germany coined the term
Factor 4 to show that it is possible to quadruple resource
productivity given the present state of technology.
Rising levels of consumption and a doubling of the world's
population over the next 40-50 years would require a factor 4
increase in food production, a factor 6 increase in energy use
and at least a factor 8 growth in income.
The Factor 10 Club, an international body of senior government, non-government,
industry, and academic leaders believes that within one generation, nations can
achieve a ten-fold increase in the efficiency with which they use resources.
Resource
Efficiency
31. L0: APO & GP / 31Asian Productivity Organization, Tokyo
I gnore
Dilution and Dispersion
Treatm ent
Prevention
GP
1990s
1980s
1970s
1960s
1950s
Environmental Management trends
32. L0: APO & GP / 32Asian Productivity Organization, Tokyo
Pollution Prevention and Source Reduction
End -of Pipe
Treatment Costs
•Source Reduction
•Waste Minimization
•Pollution Prevention
•Cleaner Production
Profits
Profits
33. L0: APO & GP / 33Asian Productivity Organization, Tokyo
Beyond Pollution Prevention
Pollution Prevention
Source reduction
End-Of-Pipe
treatment
Holistic, integrated
strategy to enable
sustainable development
By considering pollution prevention separately
form other manufacturing needs such as
productivity and quality improvements, most
pollution prevention programs fail to develop the
vital synergies and working relationships with
manufacturers that are essential to drive both
pollution prevention and manufacturing
competitiveness…...
The US Congress, Office of Technology
34. L0: APO & GP / 34Asian Productivity Organization, Tokyo
Resource Efficiency
Sustainable
Development
Resource efficiency is one of the
key issues in sustainable
development.
•Sustainability thus emerges as a crucial
component of any successful paradigm to
guide development in the new Millennium.
•Requires a new emphasis on the nature
and size of inputs to development,
especially energy, resource, chemical and
other material input.
Related terms and concepts that are
emerging include:
Eco-efficiency
Eco-sustainability
Eco-design
Product Life-Cycle
Green Productivity
Related terms and concepts that are
emerging include:
Eco-efficiency
Eco-sustainability
Eco-design
Product Life-Cycle
Green Productivity
Resource Efficiency and Sustainability
35. L0: APO & GP / 35Asian Productivity Organization, Tokyo
Traditional focus of productivity
was ensuring cost effectiveness
through cost reduction.
The quality drive and customer
satisfaction was the next focus
Programs to improve productivity
by influencing the internal
organization of an industry emerged.
The most popular have been Kaizen,
TQM, TPM etc.
ProductivityProductivity
The next step required integration of
"Environment" into these productivity
improvement programs.
The next step required integration of
"Environment" into these productivity
improvement programs.
Quality
Cost
Environment
Productivity Practices
36. L0: APO & GP / 36Asian Productivity Organization, Tokyo
TQM
TPM
5 -S & KAIZEN
ENVIRONMENT MANAGEMENT
GREEN PRODUCTIVITY
EVOLUTION OF GREEN PRODUCTIVITY
37. L0: APO & GP / 37Asian Productivity Organization, Tokyo
Productivity improvement means
improvement in QCDMS:
Q= Quality
Higher Quality that meets or exceeds customer
requirements
C= Cost
Lower Cost
D= Delivery
Timely Delivery as desired by the customer
M= Morale
Boosting morale of all concerned
S= Safety
Thinking and improving safety of each and every
aspect of the product and process
38. L0: APO & GP / 38Asian Productivity Organization, Tokyo
From Productivity To Green Productivity
Profitability and Environmental Protection
Integration of Productivity
and Environmental Management
Sustainability and Quality of Life
39. L0: APO & GP / 39Asian Productivity Organization, Tokyo
40. L0: APO & GP / 40Asian Productivity Organization, Tokyo
41. L0: APO & GP / 41Asian Productivity Organization, Tokyo
42. L0: APO & GP / 42Asian Productivity Organization, Tokyo
43. L0: APO & GP / 43Asian Productivity Organization, Tokyo
44. L0: APO & GP / 44Asian Productivity Organization, Tokyo
45. L0: APO & GP / 45Asian Productivity Organization, Tokyo
46. L0: APO & GP / 46Asian Productivity Organization, Tokyo
CHAPTER
47. L0: APO & GP / 47Asian Productivity Organization, Tokyo
What is productivity?What is productivity?
As an integrated conceptAs an integrated concept
Output x SatisfactionOutput x Satisfaction
PRODUCTIVITY =PRODUCTIVITY =
Input x SacrificesInput x Sacrifices
•• as objectiveas objective Social conceptSocial concept
•• as a meansas a means Technical conceptTechnical concept
48. L0: APO & GP / 48Asian Productivity Organization, Tokyo
Three Guiding Principles ofThree Guiding Principles of
Productivity MovementProductivity Movement
Principle of Increase in EmploymentPrinciple of Increase in Employment
•• Improved productivityImproved productivity increases employmentincreases employment
Principle of Labor-Management CooperationPrinciple of Labor-Management Cooperation
•• In improving productivity,In improving productivity, labor and managementlabor and management
must cooperatemust cooperate in discussing the measuresin discussing the measures
Principle of Fair DistributionPrinciple of Fair Distribution
•• TheThe fruitsfruits of productivity improvement must beof productivity improvement must be
distributed fairlydistributed fairly amongamong key stakeholderskey stakeholders
Productivity Principles
49. L0: APO & GP / 49Asian Productivity Organization, Tokyo
Multi-Factor Productivity
MULTI - FACTOR PRODUCTIVITY AND GP
Raw materials productivity = Output (value or unit or value added)
Raw material used
Labour productivity = Output
number of employees (number
of hours worked)
Variables for quantification of GP that can be factored in are:
water, energy, materials (chemicals, auxiliaries, packaging etc.),
technology, capital.
50. L0: APO & GP / 50Asian Productivity Organization, Tokyo
Ecological Principles Guiding GP
1. SUSTAINABLE USE OF NATURAL
RESOURCES
2. PROTECTION OF ECOLOGICAL
BALANCE
3. PROTECT PLANT AND ANIMAL
SPECIES AND THEIR
ENVIRONMENT
51. L0: APO & GP / 51Asian Productivity Organization, Tokyo
Relationship between Productivity & Environment
52. L0: APO & GP / 52Asian Productivity Organization, Tokyo
Resource Efficiency & Productivity
ABSORPTION CAPACITY
Users of
Industrial
Products
Environmental
Pollution and
Resource
Exhaustion
1900 2000
Unlimited
Capacity
Limited
Capacity
COST
Raw Material
Labor
Facility
+
Environment
Resource
53. L0: APO & GP / 53Asian Productivity Organization, Tokyo
GP ensures profitability and enhances
Quality of Life
Green Productivity (GP) is a strategy for
enhancing productivity and environmental
performance for overall socio-economic
development. It is the application of appropriate
productivity and environmental management
tools, techniques, technologies to reduce the
environmental impact of organization’s
activities, goods and services.
Ensures profitability
Enhances Quality of Life
Reduces environmental
impact
54. L0: APO & GP / 54Asian Productivity Organization, Tokyo
TRIPLE FOCUS OF GP
Environment
(Sustainable Development)
Quality
(Voice of Customer )
Profitability
(Factor Inputs)
55. L0: APO & GP / 55Asian Productivity Organization, Tokyo
GP
Environmental
Compliance
Environmental
Compliance
Pollution Prevention
Source reduction
End-of-pipe controls
Pollution Prevention
Source reduction
End-of-pipe controls
Integrated people based
approach
Integrated people based
approach
production-environment
integration
team work
safe and healthy working
conditions.
production-environment
integration
team work
safe and healthy working
conditions.
Information driven
improvement
Information driven
improvement
measurement
reporting
disclosure
measurement
reporting
disclosure
Productivity
improvement
Productivity
improvement
Continuous
improvement cycle
Continuous
improvement cycle
Distinguishing characteristics of GP
56. L0: APO & GP / 56Asian Productivity Organization, Tokyo
Conventional Versus GP Practices
RAW MATERIAL PRODUCTION PROCESS
PRODUCT
WASTES
GASEOUS
LIQUID
SOLID
TREATMENT
&/DISPOSAL
RAW MATERIAL PRODUCTION PROCESS PRODUCT
REMAINDER LESS
WASTES
GASEOUS
LIQUID
SOLID
TREATMENT
&/DISPOSAL
RECYCLE/
REUSE
BY- PRODUCT
CONVENTIONAL PRACTICES
GP PRACTICES
57. L0: APO & GP / 57Asian Productivity Organization, Tokyo
GREEN PRODUCTIVITY MULTI SECTOR COVERAGE
GREEN PRODUCTIVITY
SMEs form the backbone of
the production-consumption
process. They play a crucial role
in the sustainability of development
Industry
(Large
Enterprises)
Services CommunityAgriculture
SMEs SMEs SMEs
SMEsSMEsSMEs
58. L0: APO & GP / 58Asian Productivity Organization, Tokyo
GUIDING PRINCIPLES OF GP
Accountability
Polluter Pays
Precautionary Approach
Profitability
Competitive Advantage
People-Building
59. L0: APO & GP / 59Asian Productivity Organization, Tokyo
ECOLOGICAL PRINCIPLES GUIDING GP
•ACCOUNTABILITY
•POLLUTER PAYS
•PRECAUTIONARY APPROACH
60. L0: APO & GP / 60Asian Productivity Organization, Tokyo
PRODUCTIVITY PRINCIPLES GUIDING GP
•Profitability
Competitive Advantage
People-Building
61. L0: APO & GP / 61Asian Productivity Organization, Tokyo
Green
Productivity
EXTERNAL FORCES
Green
Productivity
External Forces
Internal Forces
GreenProductivity
GreenProductivity
Regulations
Customer
requirement
Consumer
Demand
Market
Opportunities
Market
Image
Evolving global
and industrial
standards
Resource Pricing and
Availability
DRIVING FORCES OF GREEN PRODUCTIVITY
62. L0: APO & GP / 62Asian Productivity Organization, Tokyo
Driving Forces of Green Productivity
INTERNAL FORCES
Internal
Efficiency Worker Health
and Safety
63. L0: APO & GP / 63Asian Productivity Organization, Tokyo
GPGP
Consumer
Producer
Sustainable
production practices
Sustainable
consumption practices
Increased profitability
lower costs of production
reduced waste treatment and
disposal costs
improved market image
improved worker health and
safety
Increased profitability
lower costs of production
reduced waste treatment and
disposal costs
improved market image
improved worker health and
safety
Superior quality products
improved environmental quality
improved health and safety
better quality of life
Superior quality products
improved environmental quality
improved health and safety
better quality of life
SOCIETY
SOCIETY
Manifold Benefits of GP
64. L0: APO & GP / 64Asian Productivity Organization, Tokyo
GPGP
SOCIETY
SOCIETY
Quality of Life
Quality of Life
BUSINESS
BUSINESS
To supply goods
and services
produced in a
sustainable manner
Products
PUSH DEMAND
for environmentally friendly
products
PULL ON
THE MARKET
PUSH
to improve resource
efficiency and hence
profitability
GP enhances Quality of Life
65. L0: APO & GP / 65Asian Productivity Organization, Tokyo
Overview and Methodological Framework of GP Methodology
Guiding Principles of GP
GP Methodology
GP TechniquesGP Tools
66. L0: APO & GP / 66Asian Productivity Organization, Tokyo
Introduction to GP Methodology
The Vicious Cycle of Bad Quality
67. L0: APO & GP / 67Asian Productivity Organization, Tokyo
Introduction to GP Methodology
The Conversion Process
68. L0: APO & GP / 68Asian Productivity Organization, Tokyo
KAIZEN Vs. Innovation
Introduction to GP Methodology
69. L0: APO & GP / 69Asian Productivity Organization, Tokyo
Continuous Improvement Through PDCA
Introduction to GP Methodology
70. L0: APO & GP / 70Asian Productivity Organization, Tokyo
Commitment and Involvement of Top Management
The top management plays a critical role in the success of theThe top management plays a critical role in the success of the
GP ProgrammeGP Programme
•Identify Team Leader
•Review objectives and Targets
•Review and approve the implementation
plan
•Identify barriers for implementation and
means to overcome
•Incorporate appropriate changes in
management system for continuous
improvement
71. L0: APO & GP / 71Asian Productivity Organization, Tokyo
Attitudinal barriers
Information related
barriers
Technical
Financial barriers
Barriers
Barriers to Commitment of Top Management
72. L0: APO & GP / 72Asian Productivity Organization, Tokyo
• Awareness programs
• Visits to Industries that have
successfully implemented GP
Means of achieving commitment of
Top Management
73. L0: APO & GP / 73Asian Productivity Organization, Tokyo
Getting StartedGetting Started
PlanningPlanningPlanning
Generation and
Evaluation
of GP Options
Generation and
Evaluation of
GP Options
Generation and
Evaluation of
GP Options
Sustaining GPSustaining GP
Monitoring and
Review
Monitoring and
Review
Implementation
of GP Options
Implementation of
GP Options
Implementation of
GP Options
I
II
III
IV
V
VI
Overview of GP Methodology
74. L0: APO & GP / 74Asian Productivity Organization, Tokyo
Team Formation
•Team Should be dynamic and involving in
nature
•Member should be drawn as per need analysis
• Can be a core team and sub-teams in large
organizations
•Core team to supervise the overall GP program
and sub team to assist core team on specific tasks.
•A dynamic, open minded and versatile person
should be a Team Leader
75. L0: APO & GP / 75Asian Productivity Organization, Tokyo
For a Large Organization For an SME
Sub
Team 1
Sub
Team 2
Sub
Team 4
External
Consultant
External
Consultant
Top
Management
Core
Team
Overlap of the circles indicate the extent of common interaction
Dept. 1 Dept 2 Dept 4 Note: In the case of SMEs Top
Management will have more
participation in the Core Team
Note: In large organizations, finance, administration
section, utilities and stores are also depts.
Core
Team
Top
Management
A Sample GP Team for an SME
76. L0: APO & GP / 76Asian Productivity Organization, Tokyo
Hides
receiving
and Storage
Pickling /
Tanning
Liming /
Deliming
Soaking
and
Unhairing
Finishing
Product
Storage and
Inspection
Lime Storage
1
2
3
4
5
6
material
Administrative
block
Laboratories,
Utilities
Pollution
ControlFacility
Illustration of Walk-through for a Tannery
Walk-through Survey
77. L0: APO & GP / 77Asian Productivity Organization, Tokyo
Information CollectionInformation Collection
Walk-Through
Review Existing Documents
One-to-one meetings
Organized Information
easy to access, update and use
Carry out Updates
Information Collection
78. L0: APO & GP / 78Asian Productivity Organization, Tokyo
Organizational
Employee information
Organizational and
Reporting structure
Production
Technologies,
processes, equipment,
efficiencies
Resource
Material Inventories
Supplier Information
Fuel type and
requirements
Materials
and Product
Packaging and
disposal
Supply chain
requirements
Balance sheets and income-
expenditure cash flows
Unit costs of labor, water, steam,
fuel, electricity, raw materials
Financial
Waste collection/conveyance
system
Waste treatment and
disposal operations
Environmental Impacts of
Operations
Environmental
Material Inventories,
MSDSs, consumption
patterns, properties
Service
Review Existing Documents
79. L0: APO & GP / 79Asian Productivity Organization, Tokyo
One way to avoid such occurrences is by having one-to-one meetings and
asking the right questions to the right people so as to ensure that the answers
obtained are valid and reliable
Documented
information (such as in
operating or do-how
manuals)
Actual practices in
operations on the
shopfloor
GP
Team
Production
personnel
Based on norms /
guidelines
No
communication
Different than
One-to-One Meetings to aid
Information Collection
80. L0: APO & GP / 80Asian Productivity Organization, Tokyo
Collection Of Field Data
Estimating Water Consumption
Install Water Meter
• Cost / investment
• Needed time period to order,
procure, install and test
• Could get damaged during use
Using Available Information
• Amount of fabric processed in a batch
• Number of batches in a day
• Ratio of fabric to water (Material Liquor
Ratio)
• Wastewater measured by bucket and
timer
• Moisture in fabric was accounted for
using calculations based on weight of
fabric before and after dyeing processConclusion:
Same purpose achieved in lesser amount of time, easily and
without any major investments
81. L0: APO & GP / 81Asian Productivity Organization, Tokyo
Assigning Cost to Waste Streams:
A Way to Set Objectives and Targets
Cost components typically associated in waste
streams are:
• Cost of raw materials in the waste
• Cost of product in the waste
• Cost of treatment of waste to comply with
regulatory requirements
• Cost of waste transportation
• Cost of waste disposal
$
82. L0: APO & GP / 82Asian Productivity Organization, Tokyo
Identification of Problems and Causes
Process
Water
Chemicals
Energy
Labor
Costs
Waste Generation
Production
Capacity Utilization
Product Quality
Market demand
Problems could be with the
And, causes could be
so many...!!
How to identify?
WHERE DO WE STAND ?
83. L0: APO & GP / 83Asian Productivity Organization, Tokyo
Baseline information on
production, environmental
performance, etc.
MC Panel
Buffing /
Polishing
Raw
Material
Storage
solutions,
metal
Plating Section
Finished product
storage
Proposed ETP
Drain piping
Bad Practice
Bad Practice
No
drains
Drains
High water
consumption
Office
Spillage
Water
Solid waste
Energy
Eco-Map to
identify focus
areas
Plant level
comparison with
norms
Detailed
Process Flow
Diagram
Plant level
Material / Energy
BalanceUnit level Comparison
with production norms
Detailed Unit
level Material /
Energy Balance
Identification of
Problems
Identification of Problems
84. L0: APO & GP / 84Asian Productivity Organization, Tokyo
Problem 1
Cause 1 Cause 2 Cause 3
Cause 1
Problem 1 Problem 2 Problem 3
Problem 1
Problem 2 Problem 3 Problem 4
?
?
?
Why?
How?
Common
Causes?
Common
Problems?
Problem 5
Identification of Causes
85. L0: APO & GP / 85Asian Productivity Organization, Tokyo
Problem Severity Frequency Cost
implications
for
resolving
the problem
Cost of
Inaction
(waste
stream
costing)
Score
(1- 10
scale)
10 is top
priority
Productivity
Material
Consumption
High Always High High 9
Product Quality Medium 82% success Moderate Moderate
to High
6
Housekeeping High Always Minimal Moderate 10
Environment
Legal
Compliance
Medium
to High
Occasionally
on air,
always on
effluents
High High 7
Business
No. of Rejects
from Customer
Minimal 5% Minimal High 4
Prioritizing Problems to set
Objectives and Targets
86. L0: APO & GP / 86Asian Productivity Organization, Tokyo
Setting Objectives and Targets
Objectives and Targets should
be SMART:
SSpecific,
MMeasurable,
AAttainable,
RRelevant and
TTrackable
87. L0: APO & GP / 87Asian Productivity Organization, Tokyo
Generation of GP Options
Review existing GP options
Generate new GP options
Generation of GP Options
Review existing GP options
Generate new GP options
Collect Option
specific Information
Collect Option
specific Information
Screening of GP
Options
Screening of GP
Options
Evaluation of GP
Options
Evaluation of GP
Options
Hierarchy of Tasks in Generation and
Evaluation of GP Options
88. L0: APO & GP / 88Asian Productivity Organization, Tokyo
Reviewing options
already implemented or
thought of in the past.
Reviewing options
already implemented or
thought of in the past.
Generating
New GP
Options
Generating
New GP
Options
Ways of Generation of GP Options
XX
Reviewing GP Options
89. L0: APO & GP / 89Asian Productivity Organization, Tokyo
Generation of New GP Options
Process
M
odification
Equipm
entChange
Material Substitution
End-of-pipe
Housekeeping GP
Options
Brainstorming
Ishikawa diagram
Reuse/recycle
GP Techniques
GP Tools
Process Optimization
Technological
Change
90. L0: APO & GP / 90Asian Productivity Organization, Tokyo
To Evaluation
Section
• Economical
• Technically
sound
• High returns
SCREENSCREEN
• High Cost
• High Risk
• Complicated
Technology
GP Options
Screening of GP Options
91. L0: APO & GP / 91Asian Productivity Organization, Tokyo
Technical Feasibility
Short term / Long term
Cost / Returns
Risk
Quantity
Scale of implementation
Cumulative Impacts
Evaluation of Options
92. L0: APO & GP / 92Asian Productivity Organization, Tokyo
GP Options
New Equipment
New Material / chemical
Change of Supplier
Modification in existing process
Change in operating practices
Suppliers, Installation space,
Cost (capital, operating),
personpower requirement
Suppliers, Installation space,
Cost (capital, operating),
personpower requirement
Suppliers, Quantity, Cost, effects
on other processes, safety sheets,
transport
Suppliers, Quantity, Cost, effects
on other processes, safety sheets,
transport
New Suppliers, reliability, costs,
effect on market, other clients of
the new supplier
New Suppliers, reliability, costs,
effect on market, other clients of
the new supplier
Installation, fabrication,
commissioning requirements,
costs
Installation, fabrication,
commissioning requirements,
costs
Effects of new practice, changes
due to new practice, time
scheduling
Effects of new practice, changes
due to new practice, time
scheduling
Option Specific Information required
Collection of Option Specific Information
93. L0: APO & GP / 93Asian Productivity Organization, Tokyo
GUIDELINE OF IMPLEMENTATION PLAN
•STATING OBJECTIVES AND TARGETS
•NATURE OF OPTIONS/REUSE, PROCESS
CHANGE ETC.
•ACTION NEEDED FOR IMPLEMENTATION
•RESPONSIBLE PERSON OR DEPARTMENT
•TIMING AND WAY OF IMPLEMENTATION
94. L0: APO & GP / 94Asian Productivity Organization, Tokyo
Implementation of Selected Options
• Trial and small scale implementation
• Regular meetings and trouble shooting sessions
• Follow-up and Accountability
• Allocate resources and schedule the pilot
implementation
• Management support needed
• Review and refinement of options
95. L0: APO & GP / 95Asian Productivity Organization, Tokyo
Training, Awareness Building and Developing Competence
• Assessing training needs
• Selecting suitable programs, methods and material
• Preparing a training plan (5W1H))
• Implementing training programs
• Tracking and recording training programs
• Evaluating training effectiveness
• Improving training program as needed
96. L0: APO & GP / 96Asian Productivity Organization, Tokyo
Ways of Training and Development
• Off-the-Job Training (Seminars & Lectures)
• On-the-Job Training
• Video presentations and Posters
• Operation Manuals and work instructions
• Field Visits
97. L0: APO & GP / 97Asian Productivity Organization, Tokyo
Monitoring and Evaluation of Results
• Parameters affecting the end results
• Performance indicators for the end result
• Appraise the performance of the option
against the targets
98. L0: APO & GP / 98Asian Productivity Organization, Tokyo
$$
Effectivity of GP
Financial Viability
G P
Management Review
99. L0: APO & GP / 99Asian Productivity Organization, Tokyo
Corrective Actions
Internal
External
Update GP documents
Incorporate Changes into Organization’s
system of management
100. L0: APO & GP / 100Asian Productivity Organization, Tokyo
• Prices
• Products
• Markets/ Competition
• Availability of Resources
• Regulations
• Technology
Identification of New / Additional Problem
Areas for Continuous Improvement
101. L0: APO & GP / 101Asian Productivity Organization, Tokyo
Brainstorming
Idea 1
Supporting
Idea 1
Extension
to Idea 1
Opposing
Idea 1
Idea 2
Idea 3
based on 1
and 2
Supporting
Idea 3
Supporting
Idea 3
Idea 4
102. L0: APO & GP / 102Asian Productivity Organization, Tokyo
Flow Charts
103. L0: APO & GP / 103Asian Productivity Organization, Tokyo
LoadingLoading
ScouringScouring
BleachingBleaching
DyeingDyeing
Freshwater,
Alkali
Freshwater,
Sodium
Hypochlorite
Freshwater,
Chemicals
Dyes
NaOH 50 kg/day
water 60000 L/day
NaOCl 50 kg/day
water 50000 L/day
Liquid discharge
Liquid discharge
Liquid discharge
Air emission vapour
DewateringDewatering Liquid discharge
DryingDrying
FinishingFinishing
Liquid discharge
Chemicals
NaOCl 50 kg/day
water 50000 L/day
BOD 400 mg/L
pH 9.3
BOD 200 mg/L
pH 6.3
BOD 350 mg/L
COD 800 mg/L
pH 8
Temp 80 °C
Liquid discharge
BOD 650 mg/L
pH 10
These operations are conducted in batches and each process batch
comprises certain operations such as washes etc. Fill and draw technique is
used. There are about 4 batches a day for each process, i.e. 4 discharges /
day
Indicates wastewater sampling location
to Quality Control
250 kg of
raw fabric
Quality check
Loop for redyeing
Process Flow Diagram (PFD)
104. L0: APO & GP / 104Asian Productivity Organization, Tokyo
NN
ETP
Finished
Product Storage
Raw
Material Storage
Manufacturing Process Line
Prod. Capacity 10,000 product items per day
Administrative
Block
Quality Control
and Final Packaging
Proposed Production line of capacity 10,000 product items per day
Utilities
Laboratories
Toilet Block
30m
Stack for
emissions
CentralHighway05
Main
Entrance
100m 100.5m 101m
Municipal
Water
Supply
EntryExit
0 5
metres
Scale
101.5
m
Plant Layout
105. L0: APO & GP / 105Asian Productivity Organization, Tokyo
Eco-maps
MC Panel
Buffing /
Polishing
Raw
Material
Storage
solutions,
metal
Plating Section
Finished product
storage
Proposed ETP
Drain piping
Bad Practice
Bad Prac tice
No
d rains
Drains
High water
consumption
Office
Spillage
Water
Solid waste
Energy
106. L0: APO & GP / 106Asian Productivity Organization, Tokyo
MC Panel
Buffing /
Polishing
Raw
Material
Storage
solutions,
metal
Plating Section
Finished product
storage
Proposed ETP
Bad Practice
Bad
Practice
Office
Water
Solid waste
Energy
Solid waste
f rom buf f ing
spills over to
material
storage
Practice
Area of material and solid waste
spillage. Chokes the d rains lead ing
to ETP
Drain lines
to ETP
Eco-maps to identify problem areas
107. L0: APO & GP / 107Asian Productivity Organization, Tokyo
Concentration Diagrams
Plating
bath 1
Plating
bath 2
Recovery
tank
Filter
Work Jobs
Cleaning
area
Location of spillage during each monitoring
Problem Area
108. L0: APO & GP / 108Asian Productivity Organization, Tokyo
Checksheets
No. of instances lights were kept
on by the customer while leaving
the room
Number of instances water was
left running by the customers
Number of customers who
demand daily change of room
linens, towels…(unused)
Number in a week
109. L0: APO & GP / 109Asian Productivity Organization, Tokyo
Checklists
Monitoring and Maintenance
Changing equipment, processes and
operations
Checklists could be developed
on the following activities:
110. L0: APO & GP / 110Asian Productivity Organization, Tokyo
Using Checklists as pointers to generate new GP Options
Materials and Inventory
Meeting environmental compliance
Training and Human Resource Development
111. L0: APO & GP / 111Asian Productivity Organization, Tokyo
ProcessInputs Outputs
Wastes
Raw materials
Energy
Water
Chemicals
Air emissions
Effluents
Solid waste
Heat losses
Off-spec products
Byproducts
Products,
Useful
byproducts
Material Balance
112. L0: APO & GP / 112Asian Productivity Organization, Tokyo
Steps in developing a Material Balance
1. Determining Inputs
Recording raw material procurement, water and energy usage,
2. Quantifying Outputs
Accounting for wastewater, gaseous emissions, solid wastes,
energy
3. Selecting a Tie compound
4. Preparing a preliminary material balance
5. Evaluating and refining material balance
Preliminary
material balance
Refined
material balance
OutputsInputs
Steps in Developing Material balance
113. L0: APO & GP / 113Asian Productivity Organization, Tokyo
Tie Compounds
Tie compounds could be
specific to the industry. They
should be a measure of
economic or environmental
importance
• Examples of Tie
Compounds
Water in textile industry
Heavy metals in
electroplating industry
Estimation Procedure
In material balance, it is not
always necessary to carry out
measurements of inputs and
outputs.
Instead estimation procedures
could be used as shown in the
example given below in this
handout.
Considerations in Developing Material balance
114. L0: APO & GP / 114Asian Productivity Organization, Tokyo
DESIZING
BLEACHING
DYEING
FINISHING
Grey fabric : 500 kg
Desizing agent: 4 kg
Wetting agent: 4 kg
LP Steam: 45 kg
Water: 447 kg
Total: 1000 kg.
Desized Fabric : 950 kg
Drain : 50 kgl
Total: 1000 kg.
Bleached Fabric**: 900
kg
Wastewater 30 C:
24947.10 kg
Vapour loss 80 C: 350
kg
Condensate***: 7600 kg
Total: 33797.10 kg
Bleached Fabric: 500 kg
Filtered water: 10000 kg
Soft Water: 2200 kg
LP Steam: 2500 kg
Dye: 10 kg
Sodium Carbonate: 31 kg
Sodium Nitrite: 3.5 kg
Wetting agent: 20 kg
Sulfuric acid: 1 kg
Total : 13765.5 kg
Dyed Fabric (90%
pickup): 900 kg
Wastewater 50C:
14215.50 kg
Vapor (60 C): 150 kg
Total: 15265.50 kg
Desized Fabric: 950 kg
Water 30 C: 24000 kg
LP Steam: 1200 kg
HP Steam: 7600 kg
NaOH : 32.1 kg
Wetting agent: 2.4 kg
Peroxide (100%): 6.0 kg
Sodium Hydrosulphite:
4.2 kg
Peroxide stabilizer: 2.4 kg
Total: 33797.10 kg
Material Balance-
Illustration from a textile
dyeing mill
115. L0: APO & GP / 115Asian Productivity Organization, Tokyo
Process
Steam
Type Quantity
---------- ----------
Electricity
Quantity kW
Fuel Consumption
Item Quantity
Coal -
Oil -
Any other -
Products
Item Heat Content Qty.
P1
P2
Energy Losses
Item Heat Content Qty.
1
2
Wastewater
Item Heat Content Qty.
Process
Condensate
Cooling
Energy Balance
117. L0: APO & GP / 117Asian Productivity Organization, Tokyo
Boiler
House
Material Balance:
Condensate Water: 20 tons
Make up water: 60 tons
Fuel: 6 tons
Air (13% excess): 69.53
tons
Total: 175.55 tons
Material Balance:
Steam: 72 tons
Blowdown: 8 tons
Flue gases: 75.55 tons
Total: 175.55 tons
Energy Balance:103 kcal
Condensate 95C: 1900
Make up 60C: 4800
Fuel 60C# : 180
Heat combustion*: 62250
Air (30 C)^: 501
Total:68431
# Cp for fuel is assumed to
be 0.5 kcal/kg C
* Calorific value 10375 kcal
/ kg fuel
^ Cp for fuel = 0.24 kcal /
kg C
INPUT OUTPUT
Energy Balance: 103 kcal
Steam: 50112
Blowdown (160C)^: 1488
Flue gases (231 C)#: 4608
Losses: 12223
Total: 68431
^Saturated temperature at
7.5 bar
# Cp for gas = 0.264 kcal /
kg C
Material and Energy
Balance
Illustration from a
textile dyeing mill
118. L0: APO & GP / 118Asian Productivity Organization, Tokyo
Cause-Effect Analysis
Ishikawa (Fishbone) Diagram
119. L0: APO & GP / 119Asian Productivity Organization, Tokyo
Right First
Time (RFT)
is Low
Dye ing
equipment not
well maintained
No regular
preventive
maintenance
program
Dyeing
ope ration n ot
proper
Liquor ratio not
always maintained
Scoured and
Bleached Fabr ic
of poor quality
Poor water quality
Input materials
to d yeing of
poo r quality
Poor water
quality
Errors in the
preparation of
recipe
High impurities in
the dyes
Shelf-life of
auxiliaries
exceeded
Improper fabric
storage
Ishikawa Diagram - Illustration for a Textile Industry
120. L0: APO & GP / 120Asian Productivity Organization, Tokyo
Pareto Diagram
Pareto Analysis
0
20
40
60
80
100
120
140
A B C D E F
Raw Material
%
% of total
% Cumulative
121. L0: APO & GP / 121Asian Productivity Organization, Tokyo
Control Chart
122. L0: APO & GP / 122Asian Productivity Organization, Tokyo
Spider Web Diagram
Spider web Chart
0
20
40
60
80
60% Water conservation
30% Minimisation of solid
w aste
30% Reuse of process liquor
% Time taken
% target achieved
123. L0: APO & GP / 123Asian Productivity Organization, Tokyo
Failure Mode Effect Analysis
`
GP Option
Problems
leading to failure
Detection
Likelihood of
occurrence
Cost liability
due to failure
Risk Priority
Number
Corrective
Measure
`
Direct reuse of dyebath
Shades not matching
with standard
9
8
8
576
Restrict reuse only
for disperse dyebaths
Restrict reuse only
for disperse dyebaths
Shades not matching
with standard
9
3
8
216
124. L0: APO & GP / 124Asian Productivity Organization, Tokyo
Cost Benefit Analysis
Costs incurredBenefits obtained
Profitability Analysis
GP
• Simple payback;
• Net Present Value;
• Internal Rate of Return
125. L0: APO & GP / 125Asian Productivity Organization, Tokyo
Combined Scour-Bleach in a Cotton Textile Unit in Egypt
Example of CBA when there is no Capital Investment
126. L0: APO & GP / 126Asian Productivity Organization, Tokyo
Example of CBA when there is Capital Investment
Capital Costs
Saveall Equipment $345,985
Saveall and White Water Pump
Materials $374,822
Piping, Electrical, Instruments
and Structural
Installation $397,148
Engineering $211,046
Contingency $140,403
Equipment Life 15 years
Borrowing Rate of
Interest 15%
Total Capital Costs $1,469,404
Annual Savings * $350,670
Financial Indicators
Simple Payback period 4.19 years
Net Present Value -
Years 1-15 $359,544
Internal Rate of Return
- Years 1-15 21%
*Annual operating cash flow before
interest and taxes
White Water / Fiber Reuse in Pulp and Paper Industry
127. L0: APO & GP / 127Asian Productivity Organization, Tokyo
Benchmarking
Norms
/best
practices Actual
practice
To compare operating practices
with norms prevalent in the
industry the Benchmarking tool
could be used:
internal i.e., between functions, departments or a similar organization as a
means of improving performance;
competitive i.e., comparison across industries within a given sector aimed
at establishing best practice through identification of gaps in performance.
This can be done on product, functional, departmental or on a company-
wide basis.
comparative i.e., across all business sectors aimed at establishing best
practice in all areas of operation (this type of benchmarking is restricted to
common processes or technologies (sector non-specific) across business sectors)
128. L0: APO & GP / 128Asian Productivity Organization, Tokyo
Comparison With Norms to Identify Problem Areas
For knit fabric industry the following
norms are used:
Energy consumption 70 MJ / Kg of
fabric
Dye consumption 4 g/Kg of
fabric
Water consumption 120 L/Kg of
fabric
129. L0: APO & GP / 129Asian Productivity Organization, Tokyo
0
5
10
15
20
25
kWh/kgProduct
Thermal Energy 7.5 7.7 14.2 6.3
Electrical
Energy
14 6.7 7.4 7.5
Total Energy 21.5 14.4 21.6 13.7
Factory A Factory B Factory C BAT
Benchmarking of Energy Consumption
130. L0: APO & GP / 130Asian Productivity Organization, Tokyo
Decision Matrix
GP OptionsGP Options
Sieve Method to eliminate the most
unsuitable
Sieve Method to eliminate the most
unsuitable
Weighted Sum Method to rank the GP options to select
the most suitable option
Weighted Sum Method to rank the GP options to select
the most suitable option
Most Suitable GP Option
131. L0: APO & GP / 131Asian Productivity Organization, Tokyo
CHAPTER 5
132. L0: APO & GP / 132Asian Productivity Organization, Tokyo
Resource
Conservation
Waste
Prevention
Training /
Awareness
Product
Improvement
Waste
Management
Organization of the GP Techniques
133. L0: APO & GP / 133Asian Productivity Organization, Tokyo
• Operating procedures
and process specifications
• Scheduling Operations
• Equipment operation procedures
• Maintenance procedures
• Material and product handling and storage
• Safety considerations for staff
• Comparison with resource and energy
consumption norms
CHECK
!
Improved Operating Procedures
134. L0: APO & GP / 134Asian Productivity Organization, Tokyo
Glycerin losses in
process were high
High COD wastewater
Improvement in Operating Procedure of Glycerin
Increase in productivity by 32 per cent.
Daily glycerin yield increased by 5 per cent i.e., an additional
6 kilograms.
Reduced chemical oxygen demand (COD) of wastewater.
Example of Improved Operating Procedures
135. L0: APO & GP / 135Asian Productivity Organization, Tokyo
Advantages of Waste Segregation
• Ease in end-of-pipe treatment of a non-compatible
pollutant stream
• Increased possibility of recycling / reusing a waste
stream
Electroplating
wastewater
Chromium
rinse waterNickel
Rinsewater
Degreasing
wastewater Possible
chromium
recovery
Possible
Nickel recovery
Waste Stream Segregation
136. L0: APO & GP / 136Asian Productivity Organization, Tokyo
Good Housekeeping
137. L0: APO & GP / 137Asian Productivity Organization, Tokyo
• Seiri - Organization
• Seiton - Neatness
• Seiso - Cleaning
• Seiketsu - Standardization
• Shitsuke - Discipline
Stratification Management
Treating the causes
Stratification Management
Treating the causes
Functional LayoutFunctional Layout
Inspection Sites
Achieving zero grime, zero
dirt
Inspection Sites
Achieving zero grime, zero
dirt
Visual management
Colour management
Visual management
Colour management
Changing behavioral patternsChanging behavioral patterns
The 5S Technique
138. L0: APO & GP / 138Asian Productivity Organization, Tokyo
7 Wastes
139. L0: APO & GP / 139Asian Productivity Organization, Tokyo
Preventive and Productive Maintenance
The Preventive Maintenance comprises of the following active items:
• Cleaning
• Lubrication
• Inspection of protective coating
• Replacement of parts & overhauls
Design of a Cost Effective Maintenance System:
These are the following steps in designing a cost-effective maintenance
system:
Classification and identification of equipment
Collection of information
Selection of maintenance policies
Preparation of preventive maintenance program
Preparation of corrective maintenance guidelines
Organizing for maintenance
140. L0: APO & GP / 140Asian Productivity Organization, Tokyo
Product
Waste
Raw materials
Separation EquipmentSeparation EquipmentHeat
Recovery
Heat
Recovery
By ProductMaterial
balance
Cause and Effect Analysis
Cost-benefit analysis
Brainstorming
Process 2Process 2Process 1Process 1
Recovery
Recycle, Reuse and Recovery
141. L0: APO & GP / 141Asian Productivity Organization, Tokyo
When Product specifications change
reactor is washed with alcoholRaw
materials
Batch
Reactor
Batch
Reactor
Energy
Phenol
Formaldehyde
Washing of
Batch
Reactor
Washing of
Batch
Reactor
Alcohol
Phenol Formaldehyde resin
50% Alcohol and water to waste
treatment
On-site
Distillation
kettle
On-site
Distillation
kettle
Phenol Formaldehyde
resin waste to reuse or disposal
100% alcohol
recycled to
washing process
Manufacturing Process
Washing of
Batch
Reactor
Washing of
Batch
Reactor
On-Site Recovery and Recycle
Phenol Formaldehyde resin
50% Alcohol and water to
waste treatment to recycling
On-site Recovery and Recycle
142. L0: APO & GP / 142Asian Productivity Organization, Tokyo
Raw
materials
Residual Waste to
nearby facility for
off-site recycling
Off-site
waste
processor
Off-site
waste
processor
Metal
Finishing
Industry
Metal
Finishing
Industry
Heat
Recovery
Heat
Recovery
Metal bearing
Waste Heat
Energy
Recover metals
from wastes
Residual
waste to
treatment
Recycle back to
original industry or
sell to another buyer
Off-site Recovery and Recycling
143. L0: APO & GP / 143Asian Productivity Organization, Tokyo
Energy
Conversion
Boiler efficiency,
Quality of Fuel used,
Maintenance
Energy
Transfer
Insulation of Steam piping,
Jackets for hot fluid pipes to
prevent losses
Energy
Utilization
Equipment efficiency, Maintenance,
Energy
Recovery
Waste heat
exchangers,
Energy Conservation
144. L0: APO & GP / 144Asian Productivity Organization, Tokyo
Better and safer
Product
Raw
materials
By-Product
Use of improved catalyst
for enhancing the product
yield
Process 2Process 2Process 1Process 1
Separation EquipmentSeparation EquipmentHeat
Recovery
Heat
Recovery
Waste
Treatment
Plant
Waste
Treatment
Plant
Substitute toxic material
with non-toxic
- improved health and safety
Non-toxic waste residues,
safe for disposal
Non-toxic wastes,
easy to treat
Input Material Changes
145. L0: APO & GP / 145Asian Productivity Organization, Tokyo
Industry sector: Paint manufacture
Size: SME
Push Factor: Pressure from the Western European market, stricter legislation,
community pressure,worker health and safety.
Measures: replacing solvent-based paints in its product range with solvent-free,
water-soluble or aqueous dispersion paints; reusing paint wastes generated during
application through use of air filters.
Productivity benefits: Improved working conditions; increased sales; improved
market position; improved community image; superior product quality.
Economic benefits: Investment of HUF 50-60 million and 10 to 30% higher costs for
eco-friendly product development. Turnover increased from HUF 830 million in 1994
to HUF 1,300 million in 1995 and exports from HUF 16 million to HUF 80 million.
Environmentalbenefits: Waste recovery and reuse, regulatory compliance and
improved worker health and safety.
Input Material Changes
Dunalakk Paint Producing and Servicing Ltd., Hungary
146. L0: APO & GP / 146Asian Productivity Organization, Tokyo
Product with
slightly changed
specifications
Raw
materials
Change from wet to
more efficient dry
process
Process 2Process 2Process 1Process 1
Heat
Recovery
Heat
Recovery
Waste
Treatment
Plant
Waste
Treatment
Plant
Substantial reduction
of wastewater
Reduced load on
treatment plant due
to dry process
Process / Equipment Changes
147. L0: APO & GP / 147Asian Productivity Organization, Tokyo
Industry: Textile printing and finishing
Size: Medium Scale
Push Factor: Inferior product quality and health and safety concerns for the
workers.
Measures: Modification of the acid ageing process during dyeing using azoic
dyes. Control charting used to identify and implement minimization of usage of
toxic substances like acetic acid during dyeing.
Productivity Benefits: Product quality improved extensively; Improved worker
health and safety.
Economic Benefits: Reduction of acetic acid procurement costs by over
$33,280 annually. Total savings in chemical costs approx . $78,520 while
wastewater treatment costs have been saved by $200,000.
Environmental Benefits: Effluent quality improved. Reduction in air emissions
Example of Process/ Equipment Changes
Print Works, Massachusetts, USA
148. L0: APO & GP / 148Asian Productivity Organization, Tokyo
Manufacturing
Processes
Manufacturing
Processes
Waste
Treatment Plant
Waste
Treatment Plant
Raw
Materials
Products
Waste
On-site Waste Recovery
and Recycling
By-Products
Waste
Disposal
Waste
Disposal
Residues
Off-site Waste
RecyclingGP Technique Intervention
Pollution Control
149. L0: APO & GP / 149Asian Productivity Organization, Tokyo
• Industrial Boiler emissions
• Acid Bath Fumes
• ChemicalOdours
• Gravitational settlers
• Cyclonic collectors
• Bag filters
• Wet scrubbers
• Electrostatic precipitators
• Adsorption towers
• Adsorption columns
Techniques for Air
Emission Control
Particulates
Gaseous pollutants
Air Emission Control
150. L0: APO & GP / 150Asian Productivity Organization, Tokyo
Domestic
Effluent
Domestic
Effluent
Process
Effluent
Process
Effluent
Effluent from
Utilities (e.g.
cooling etc.)
Effluent from
Utilities (e.g.
cooling etc.)
Equalization /
Neutralization
Equalization /
Neutralization
ClariflocculationClariflocculation
Biological treatment
aerobic / anaerobic
Biological treatment
aerobic / anaerobic
Tertiary treatmentTertiary treatment
Selective segregation for
recovery / detoxification Heat Recovery
Thickener /
Filtration
Thickener /
Filtration
DisposalDisposal
Return
effluent
For recycling
Degritting /
screening and
equalization
Optional
Optional
Wsatewater Management
151. L0: APO & GP / 151Asian Productivity Organization, Tokyo
Industry sector: Food Processing ( dessicated coconut production)
Size: Medium scale
Push Factor: Serious environmental non- compliance due to very high levels of
Biological and Chemical Oxygen Demand (BOD and COD).
Measures: Utilization of 80,000 liters of wasted coconut water through a recovery
process to produce a commercial drink; improvement of operational practices.
Productivity benefits: Profitability due to new by-product; Increase in production of
dessicated coconut.
Economic benefits: Annual savings of US $ 370,000 due to increased production;
treatment cost savings of US $ 3700 per year.
Environmental benefits: Regulatory compliance possible due to reduction in
effluent BOD by 50%.
Example of Wastewater Management
Peter Paul Philippines Corporation, Philippines
152. L0: APO & GP / 152Asian Productivity Organization, Tokyo
Product
Raw materials
Industrial ProcessesIndustrial Processes
Energy
ETP
AEC
Industrial Solid WasteIndustrial Solid Waste
ETP
Sludge
APC
Sludge
Process Residuals
/ Still bottoms / sludge
Hazardous and non-hazardous
Non-process Solid Waste
e.g. packaging
Process Liquid Waste
Process
Gaseous
Emission
ETP Effluent Treatment Plant
APC Air Emission Control
Sources of Solid Waste Generation
Solid Waste Management
153. L0: APO & GP / 153Asian Productivity Organization, Tokyo
Design for Environment
CONVENTIONAL PRODUCT
DESIGN
DESIGN FOR ENVIRONMENT
Reduction in production cost
Achieve higher performance
Lower production costs
through efficient resource
utilization
Improve product
performance
Reduce
environmental
impact
154. L0: APO & GP / 154Asian Productivity Organization, Tokyo
New Concept Development
Dematerialization
Shared use of the product
Integration of functions
Functional optimization of
product components
Selection of Low impact Materials
Non-hazardous materials
Non-exhaustible materials
Low energy content materials
Recycled materials
Recyclable materials
Reduction
Reduction in weight
Reduction in transport volume
Optimization of Production Techniques
Alternative production techniques
Fewer production techniques
Low/clean energy consumption
Low generation of waste
Few/clean production consummables
Efficient Distribution
System
Less/clean packing
Efficient transport mode
Efficient logistics
Reduction of the Environmental
Impact in the User stage
Low energy consumption
Clean energy source
Few consummables needed during
use
Clean consumables during use
No energy / auxiliary material
wastage
- +
Optimize Initial Lifetime
Reliability and durability
Easy maintenance and repair
Modular product structure
Classic design
User taking care of product
Optimize End-of-Life system
Reuse of product
Remanufacturing / refurbishing
Recycling of materials
Clean incineration
Design for Environment Strategies
Design for Environment (DFE)
155. L0: APO & GP / 155Asian Productivity Organization, Tokyo
Design for Environment - Illustration from SONY
Cabinet for a new line of speakers is
made out of recycled tetrapak cartons;
Better sound quality.
Reduced the number of materials used;
Plastic parts marked with the symbol of
plastic to assist recyclers in identifying the
parts;
Water based lacquers for finishing;
Snap and slide connections to facilitate
easy disassembly;
Only a small part of the TV cannot be
recycled.
“take back” label part of every
SONY monitor sold in Germany.
Take Back
DfE for TV sets
DfE for monitors
DfE for loudspeaker
cabinets
156. L0: APO & GP / 156Asian Productivity Organization, Tokyo
Life-Cycle Assessment
Goal definition
and Scope
Goal definition
and Scope
Inventory
analysis
Process flow
chart; data
collection;
system boundary
defined and data
processing
Inventory
analysis
Process flow
chart; data
collection;
system boundary
defined and data
processing
Impact
Assessment
Classification
and
characterization
of effects of
resource use;
valuation
Impact
Assessment
Classification
and
characterization
of effects of
resource use;
valuation
Improvement
Assessment
Reporting;
evaluation of
the need and
opportunities to
reduce impact
Improvement
Assessment
Reporting;
evaluation of
the need and
opportunities to
reduce impact
157. L0: APO & GP / 157Asian Productivity Organization, Tokyo
Life-Cycle Assessment - Illustration from Japan
Renewable
reduced
resources Base Materials UTILIZATION
Durable, repairable
and necessary products
MANUFACTURING
using clean technology
MINIMAL WASTE
Cycle1: Waste prevention, long life products
Cycle 2: Waste reduction, recycling of useful
material
Establishment of the Life Cycle Assessment Society of Japan in 1995
with the support of the Keidanren and the Ministry of International Trade
and Industry. Almost all industries have assisted in its activities.
The basic premise is that product design should take LCA and
environmental advantage into account and life cycle engineering approach
should be adopted to maintain sustainable development.
158. L0: APO & GP / 158Asian Productivity Organization, Tokyo
Green Purchasing
GREEN
PURCHASING
Consideration of product cycle
Green Purchasing is at two levels
Procurement of safer
eco-friendly materials, technology
etc.by the producers
Consumers seeking ecofriendly
products
Three basic principles of Green Purchasing
Management policies and practices regarding
Green Purchasing
Availability of eco-related information to evaluate products
manufacturers and distributors
159. L0: APO & GP / 159Asian Productivity Organization, Tokyo
GP Techniques, Cost and Level of Effort
Cost
and
Level
of
Effort
Process and Equipment Change
GP Techniques
GP Techniques, Cost and Level of Efforts
Design for Environment
Input Material Changes
Resource Conservation
Recycle, Reuse and Recovery
Improved Operating Procedures
Housekeeping (5S) and 7 Wastes
Pollution Control