Download as PDF, PPTX
![Page 8
Sketches
• Store a “summary” of the dataset
• Querying the sketch is “almost” as good as querying the dataset
• Example: frequent items in a stream
– Initialize associative array A of size k-1
– Process: for each j
- if j is in keys(A), A[j] += 1
- else if |keys(A)| < k - 1, A[j] = 1
- else
– for each l in keys(A),
» A(l) -=1 ;
» if A(l) = 0, remove l;
– done](https://image.slidesharecdn.com/apacheconbigdata2015-datasciencefromthetrenches-150930142053-lva1-app6892/75/Apache-con-big-data-2015-Data-Science-from-the-trenches-8-2048.jpg)
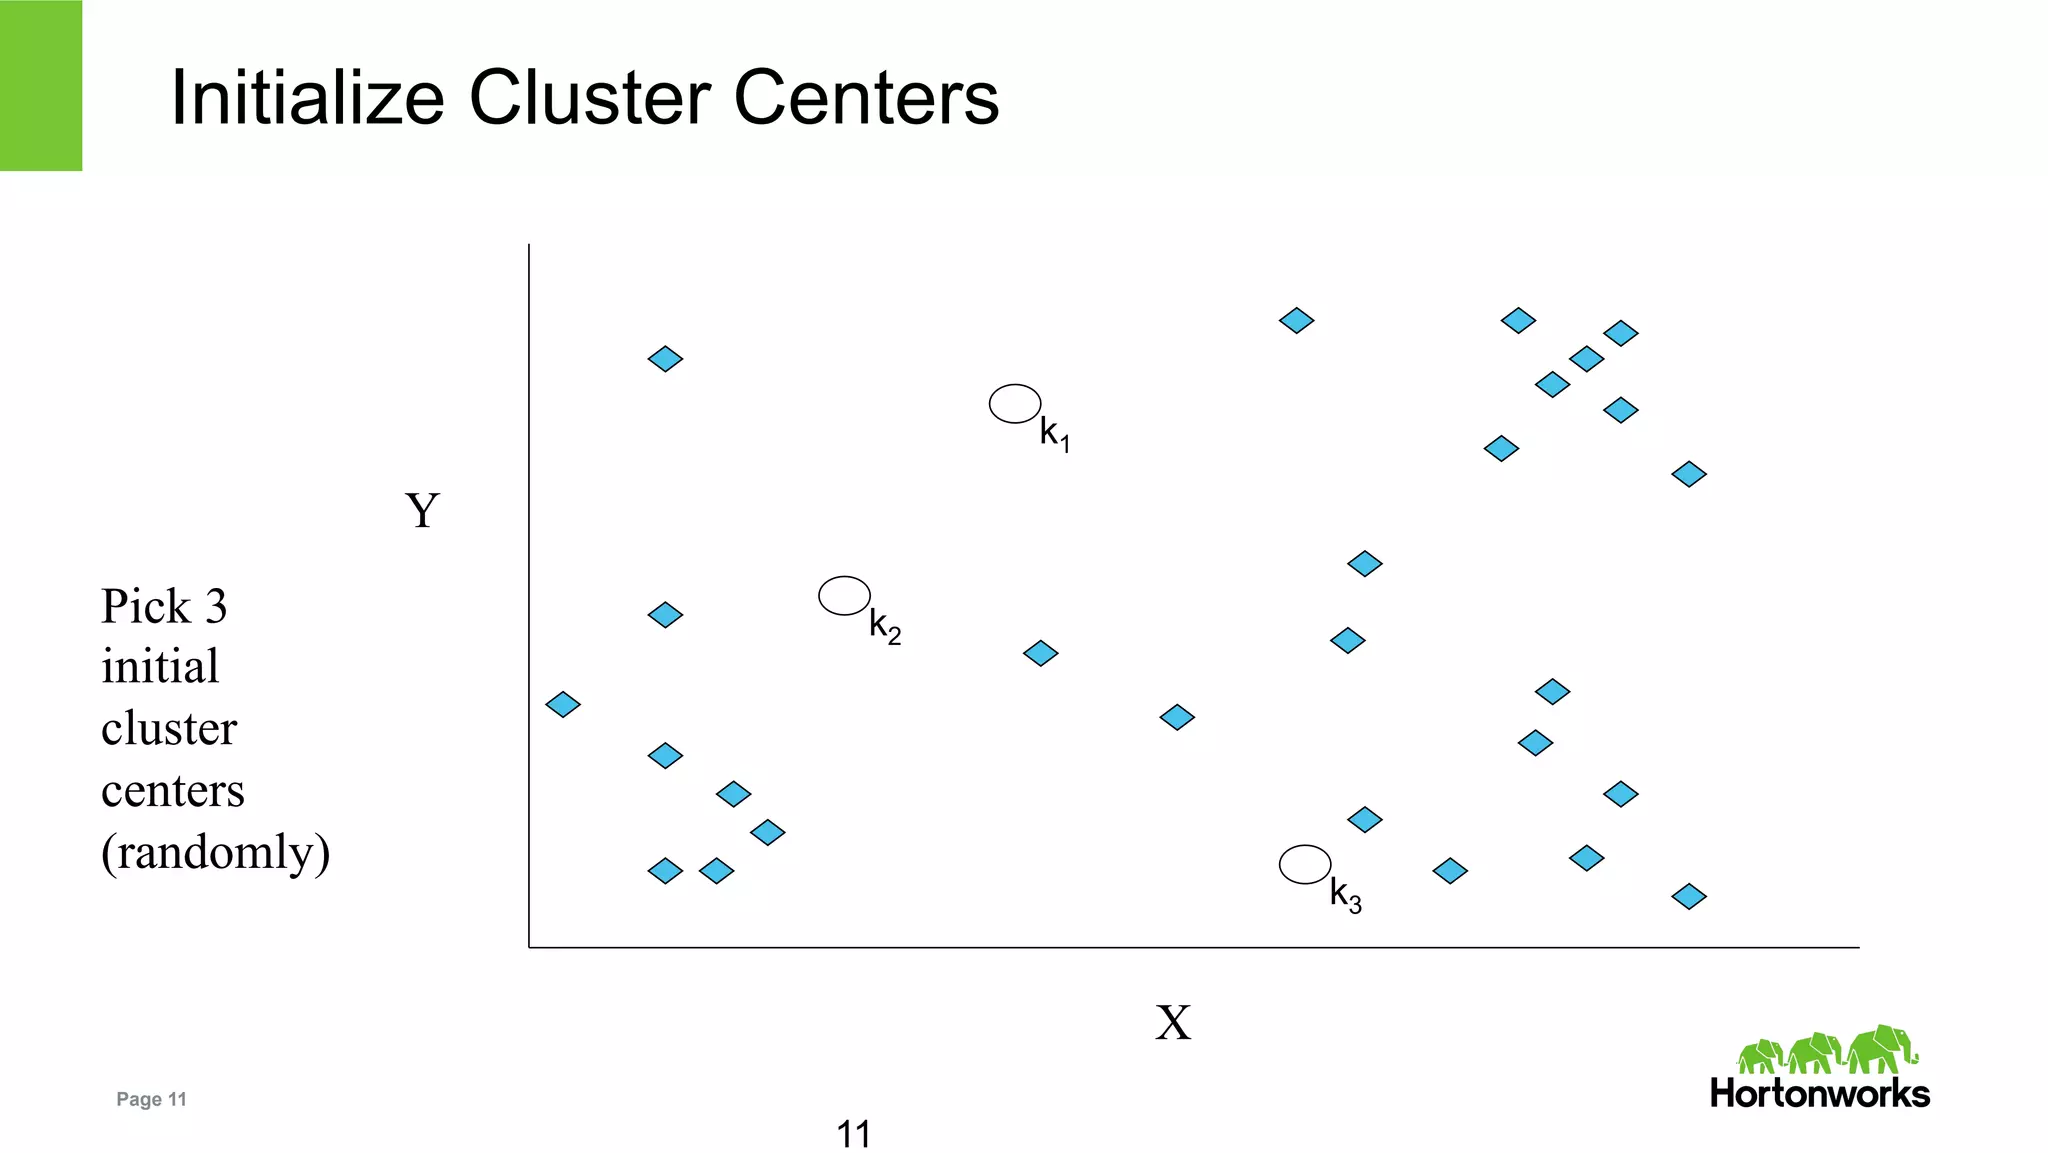
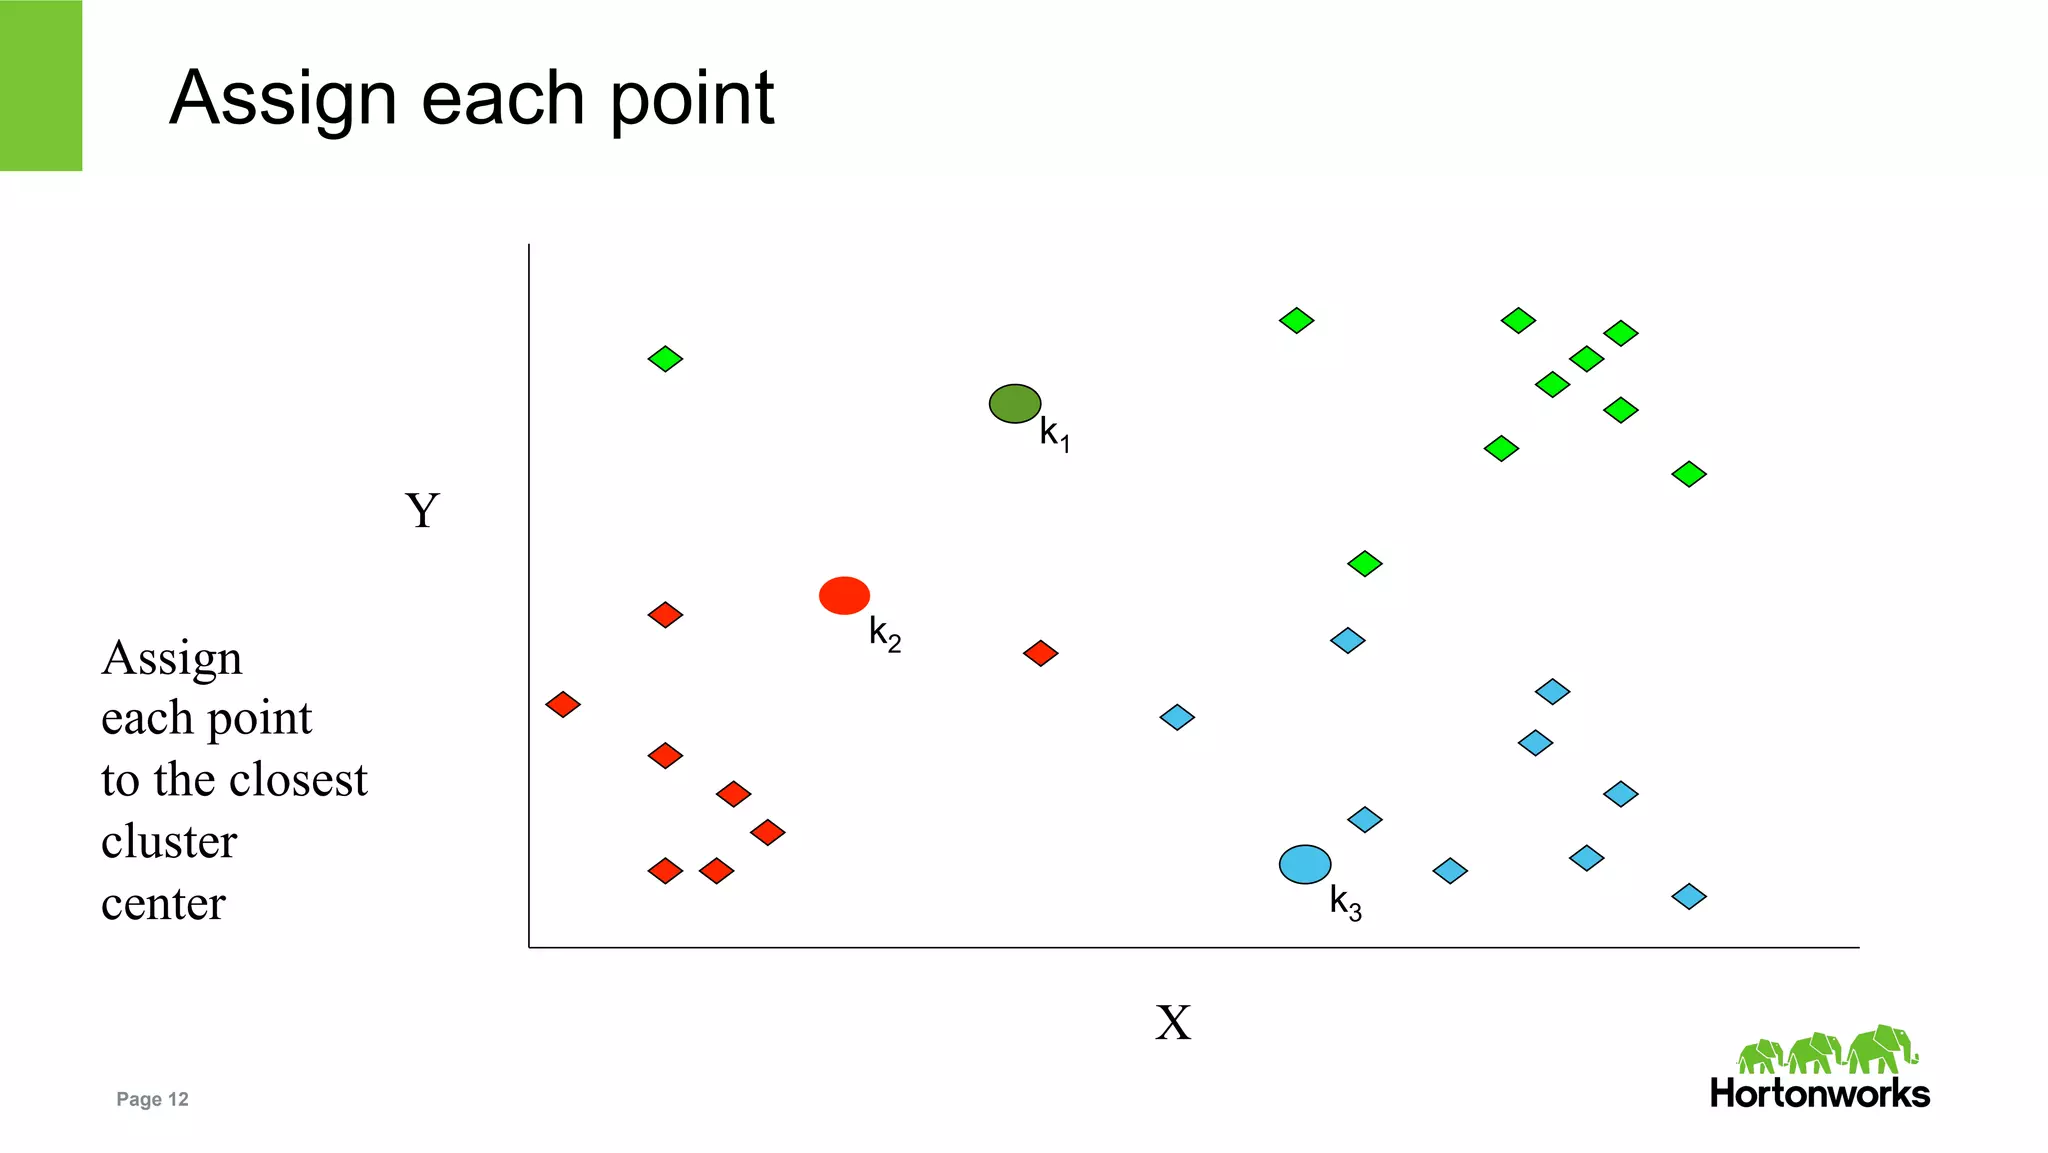
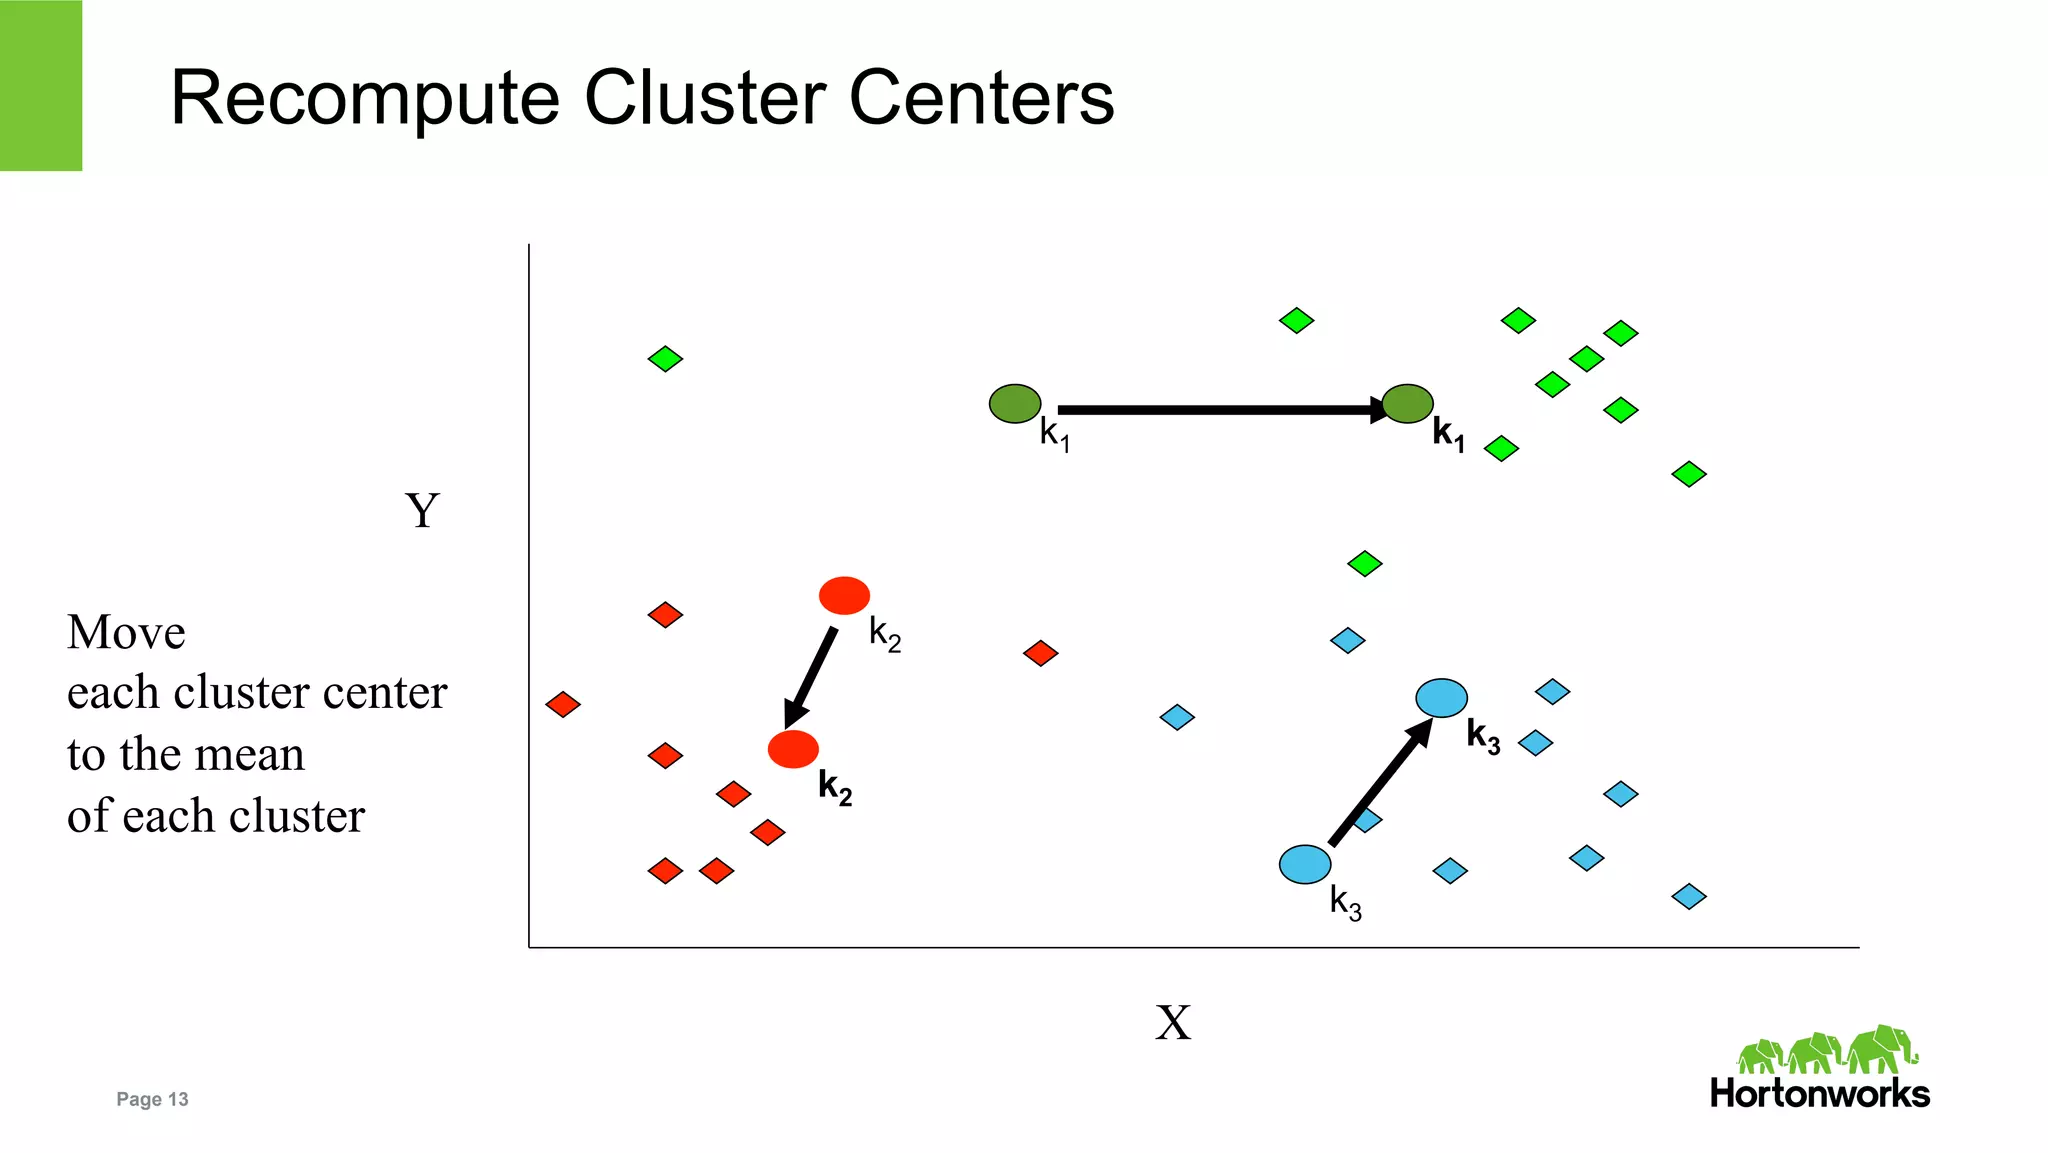
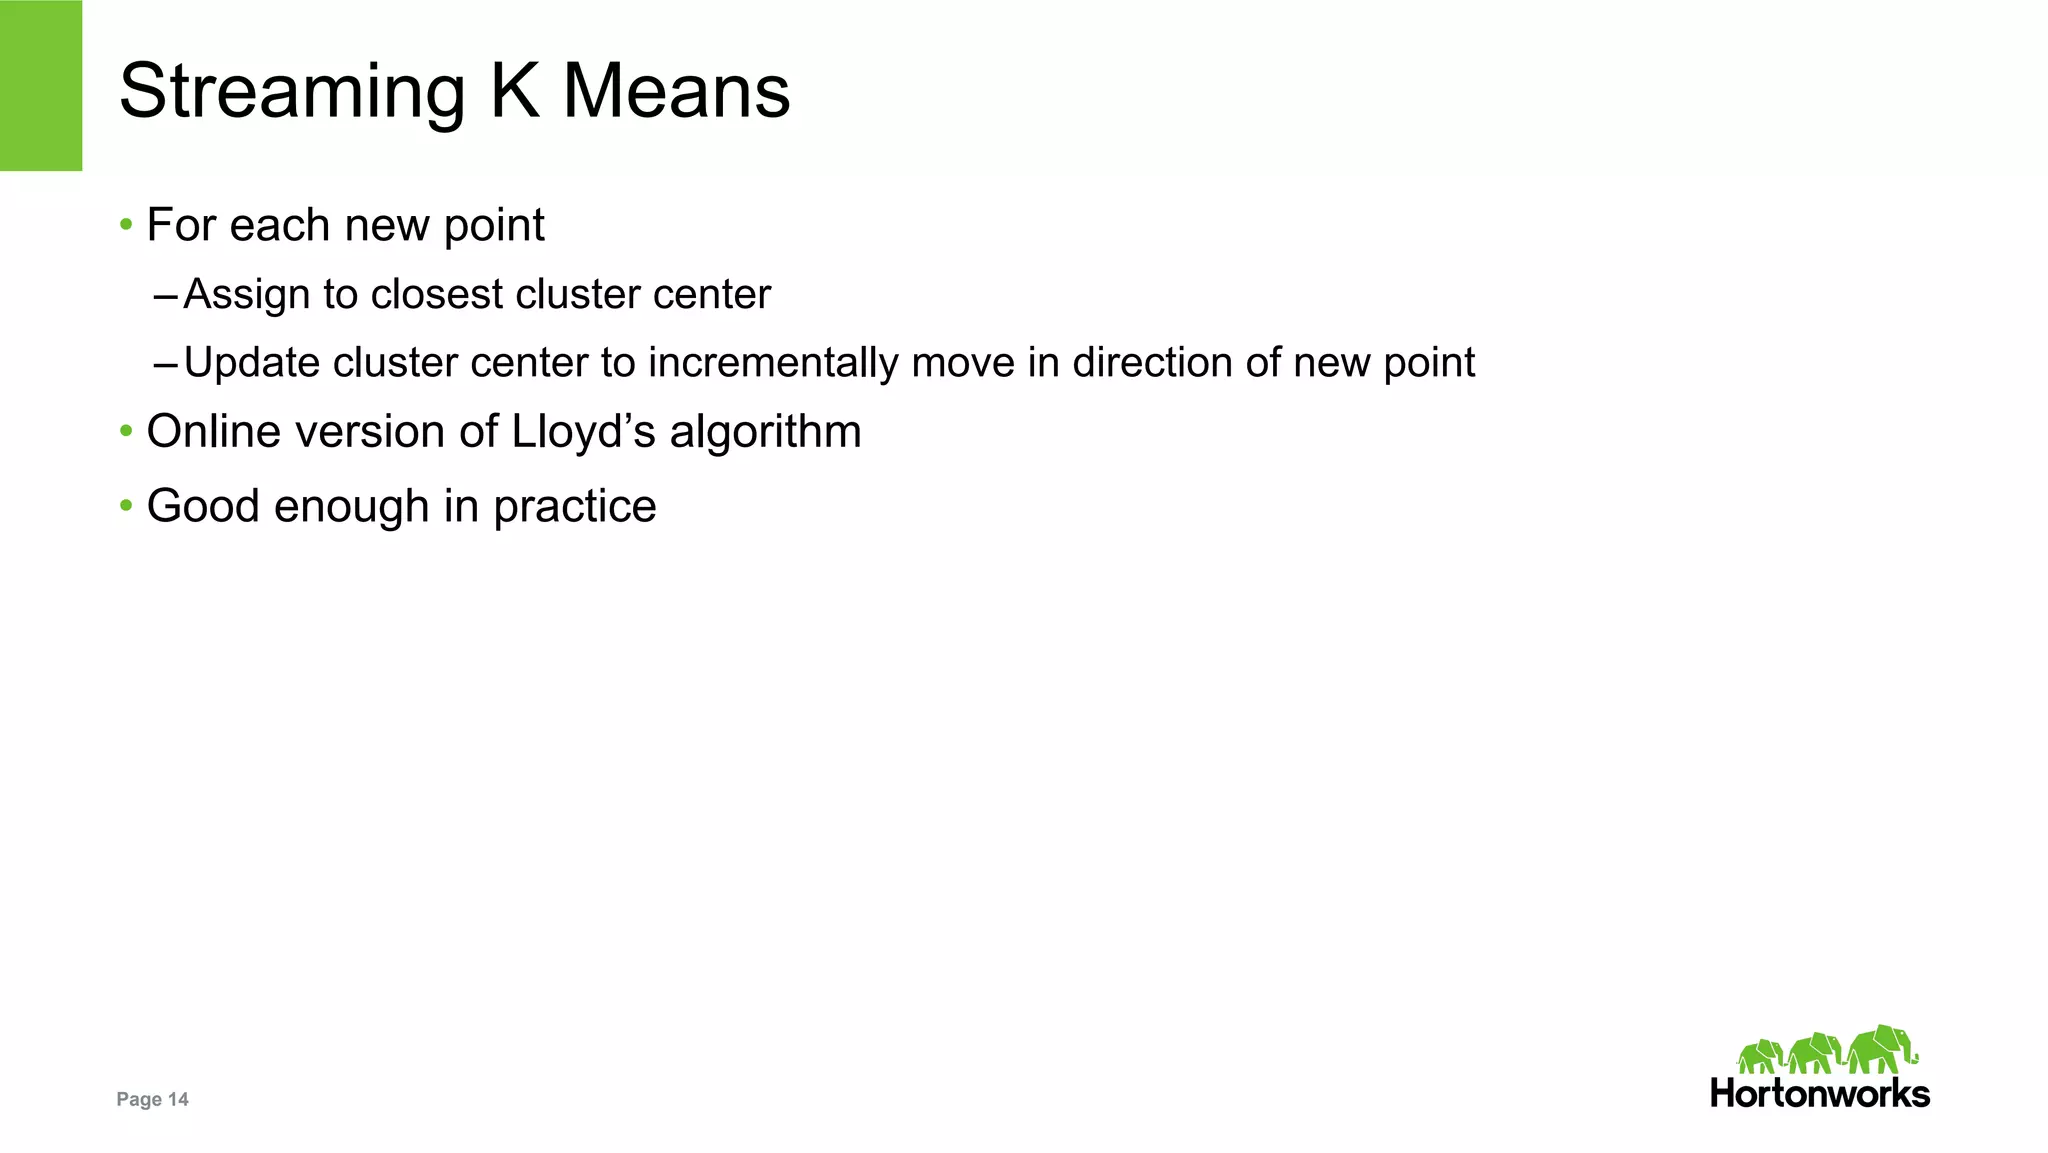
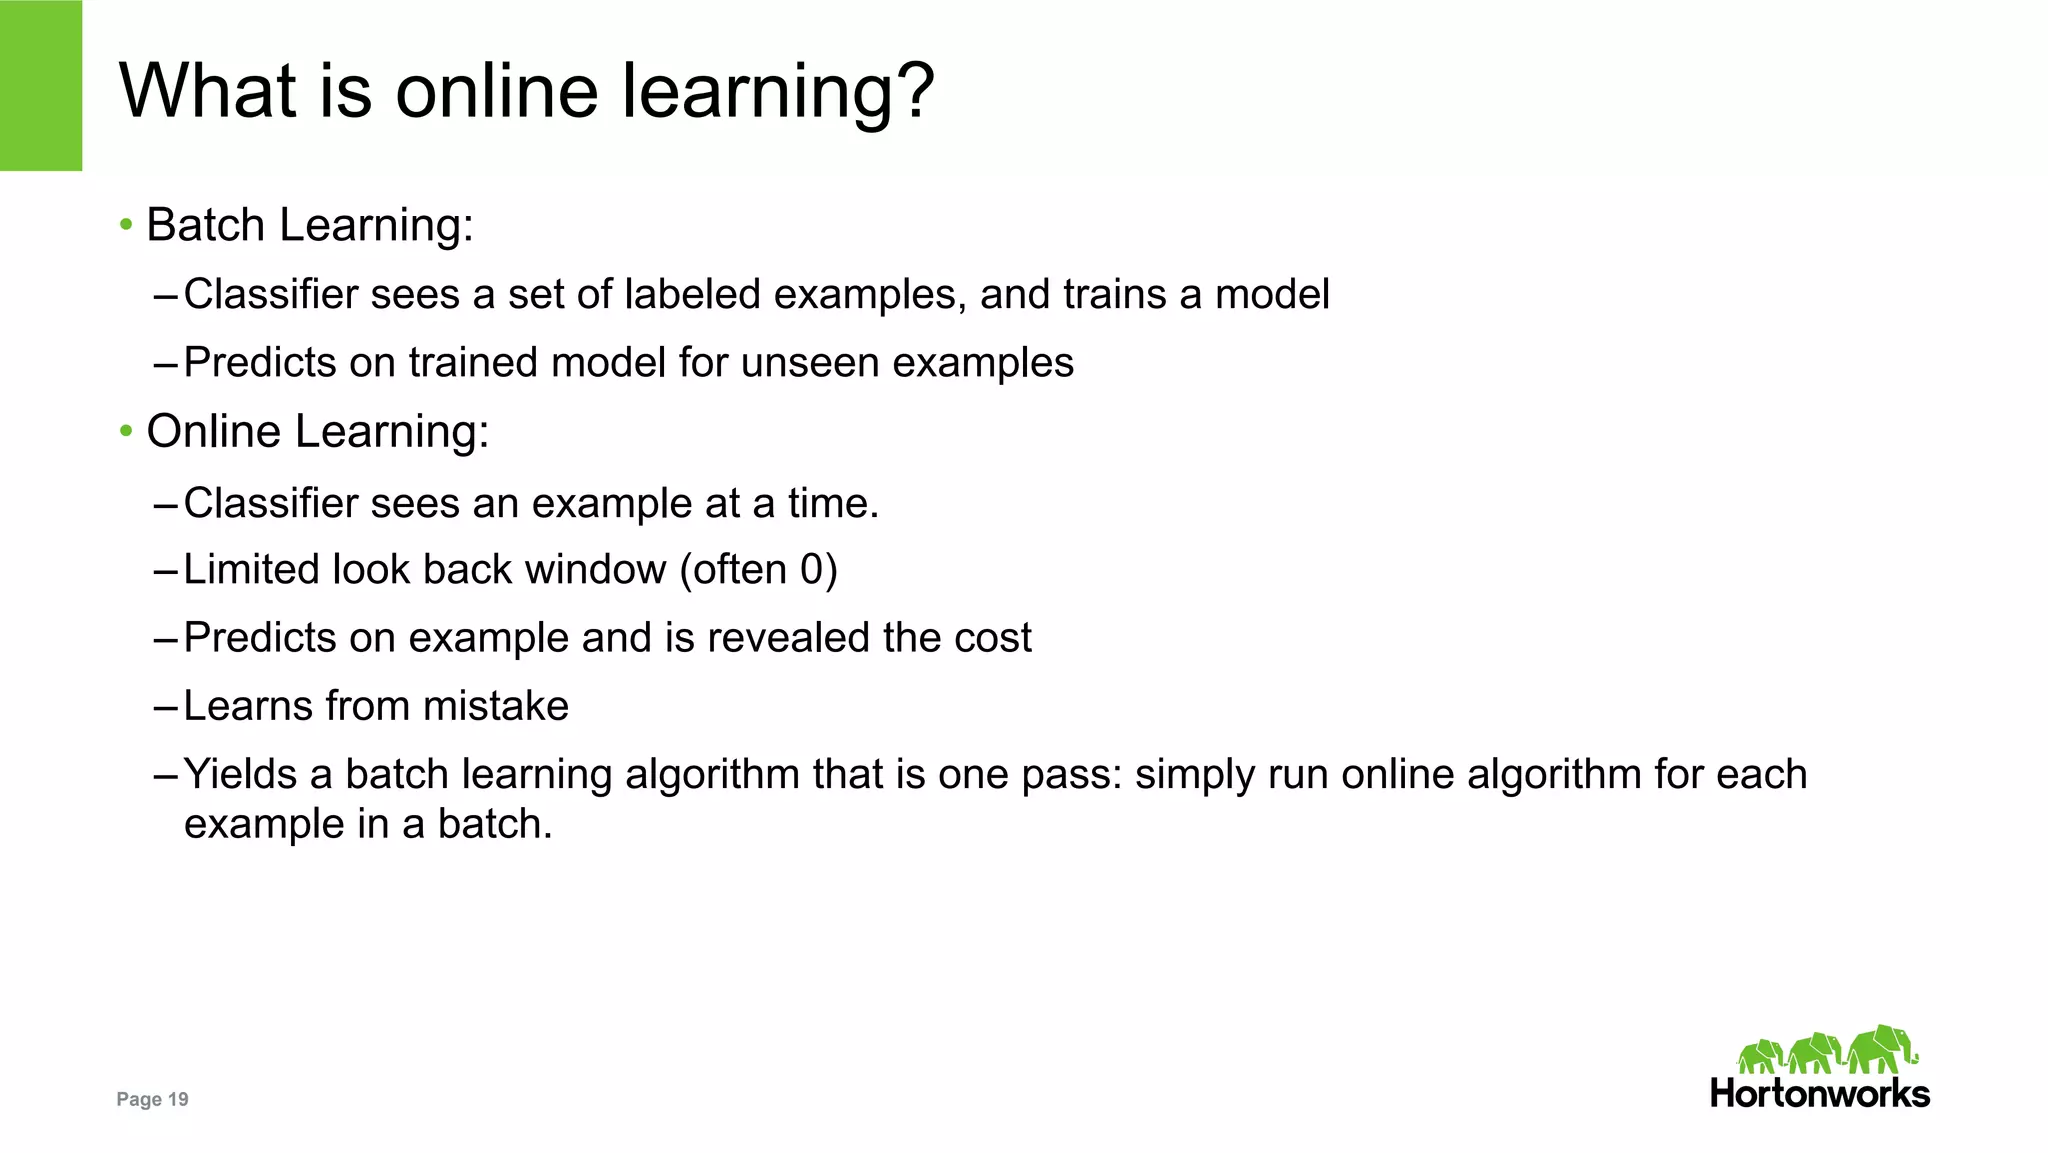
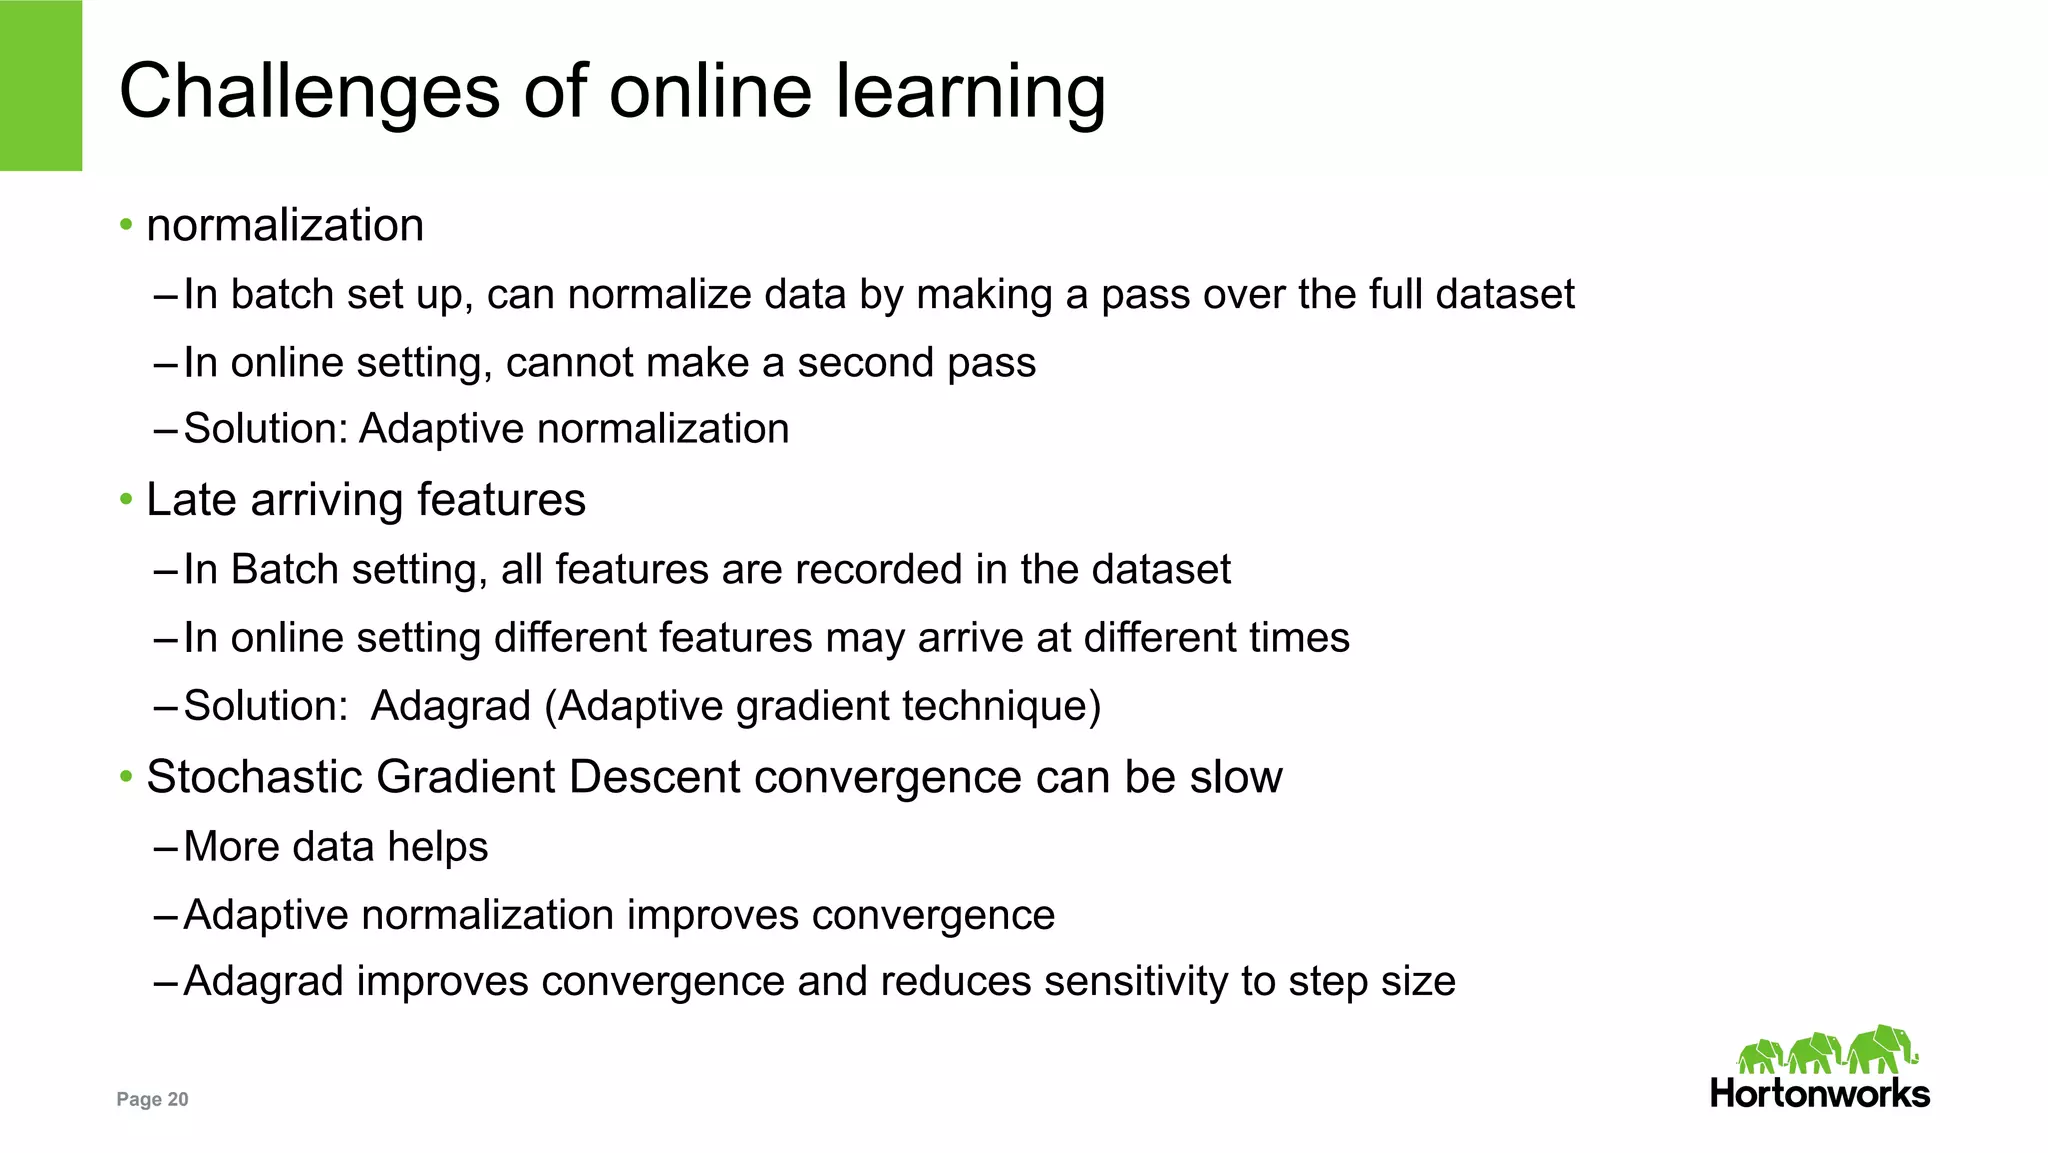
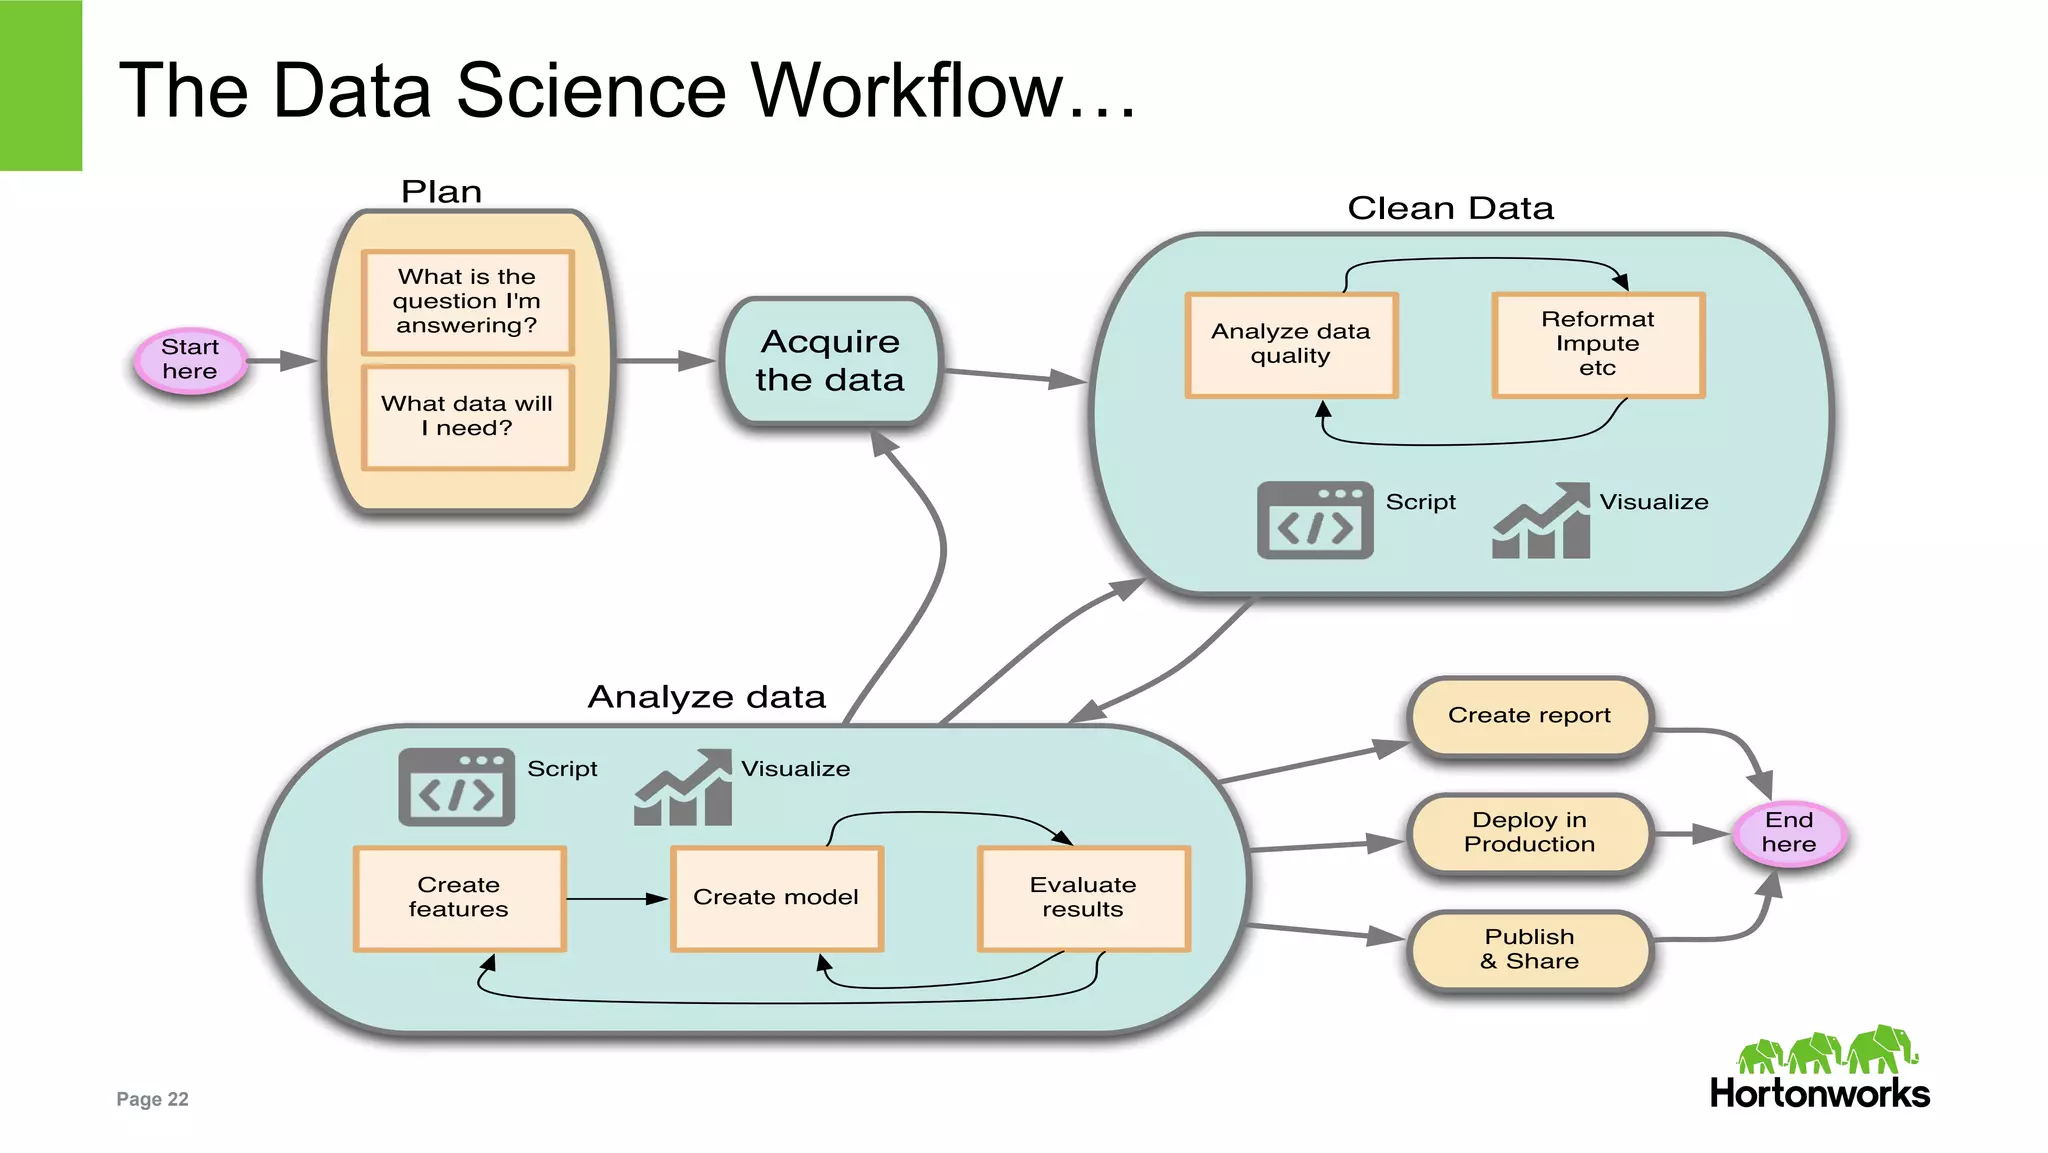
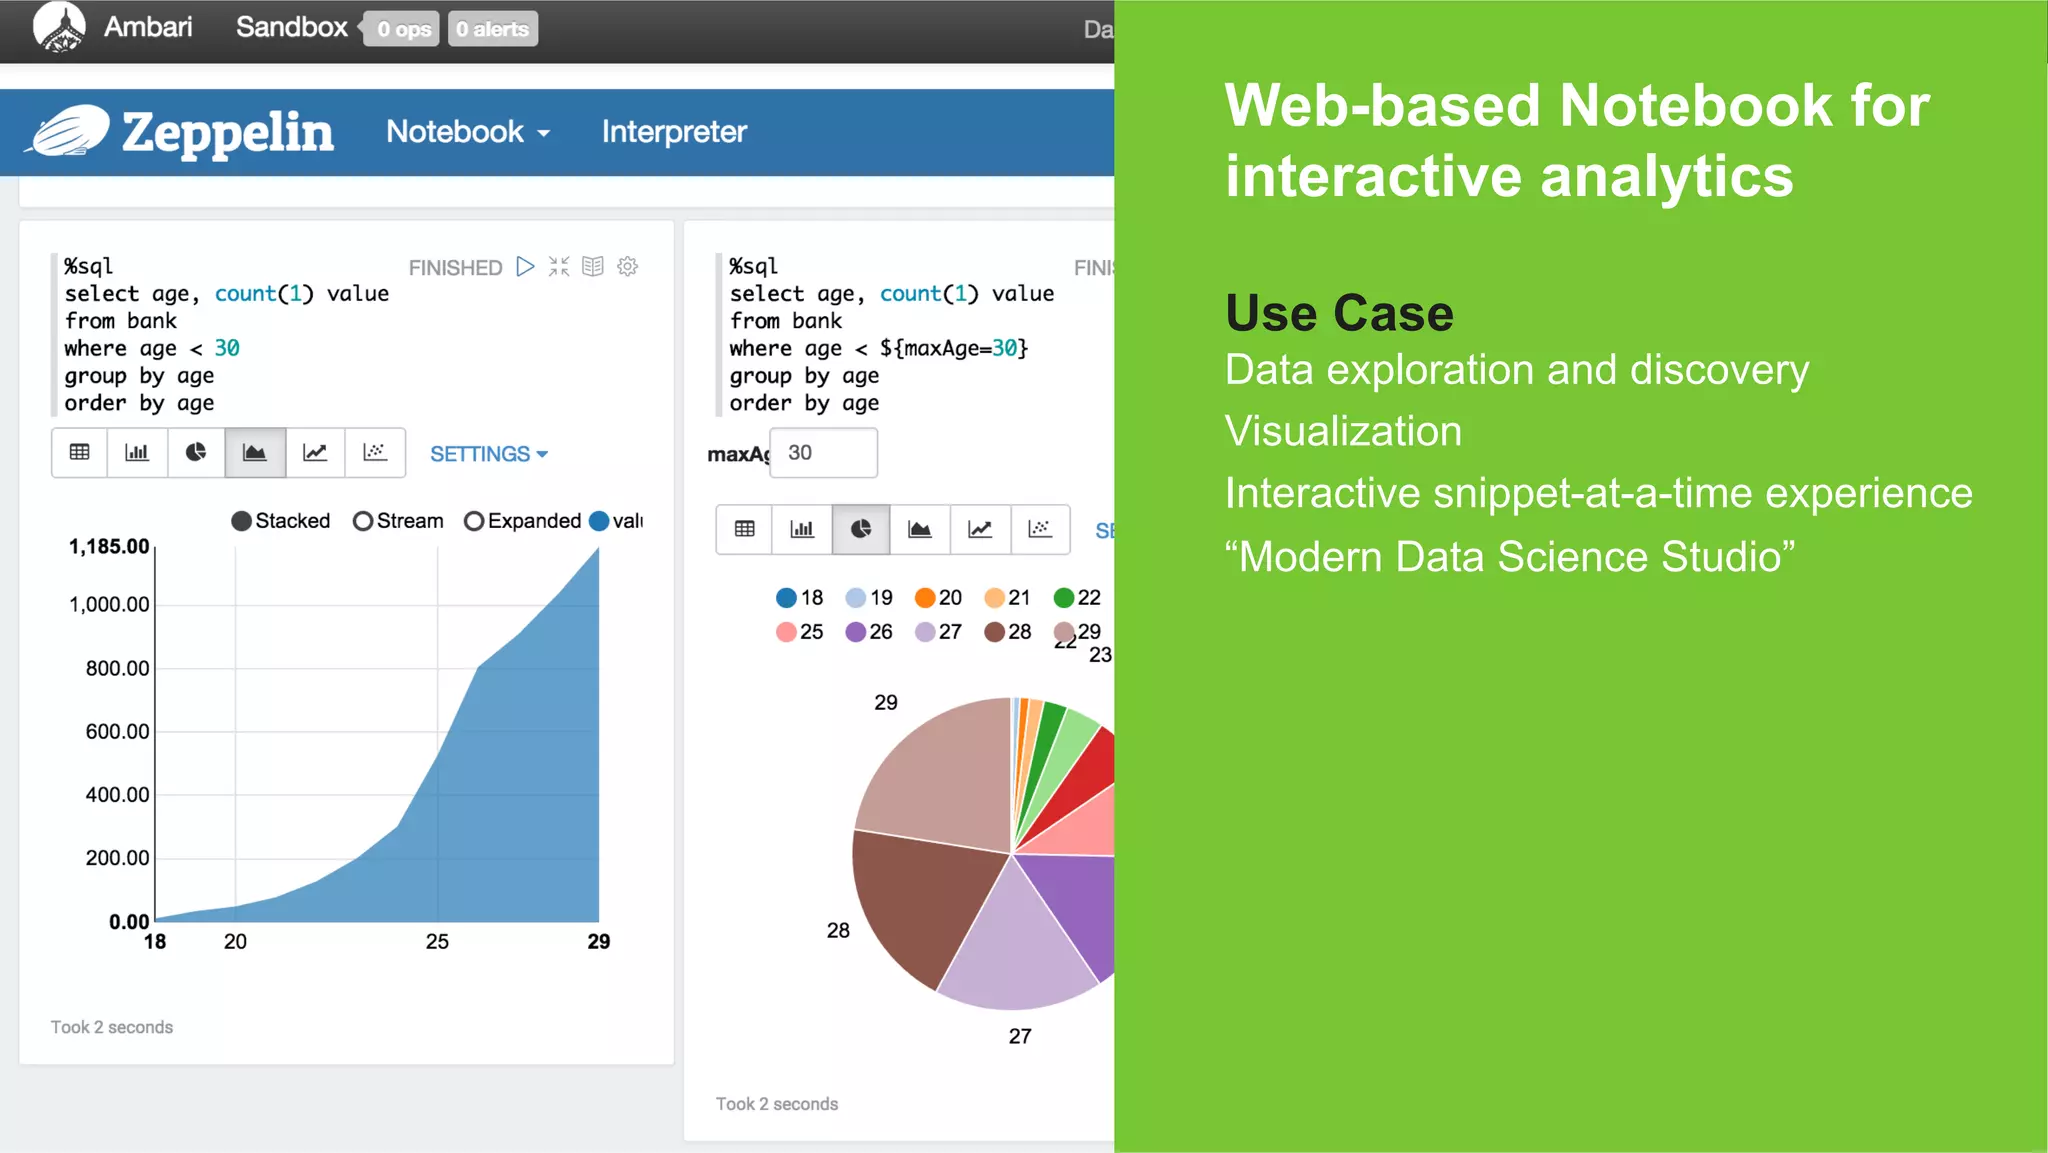
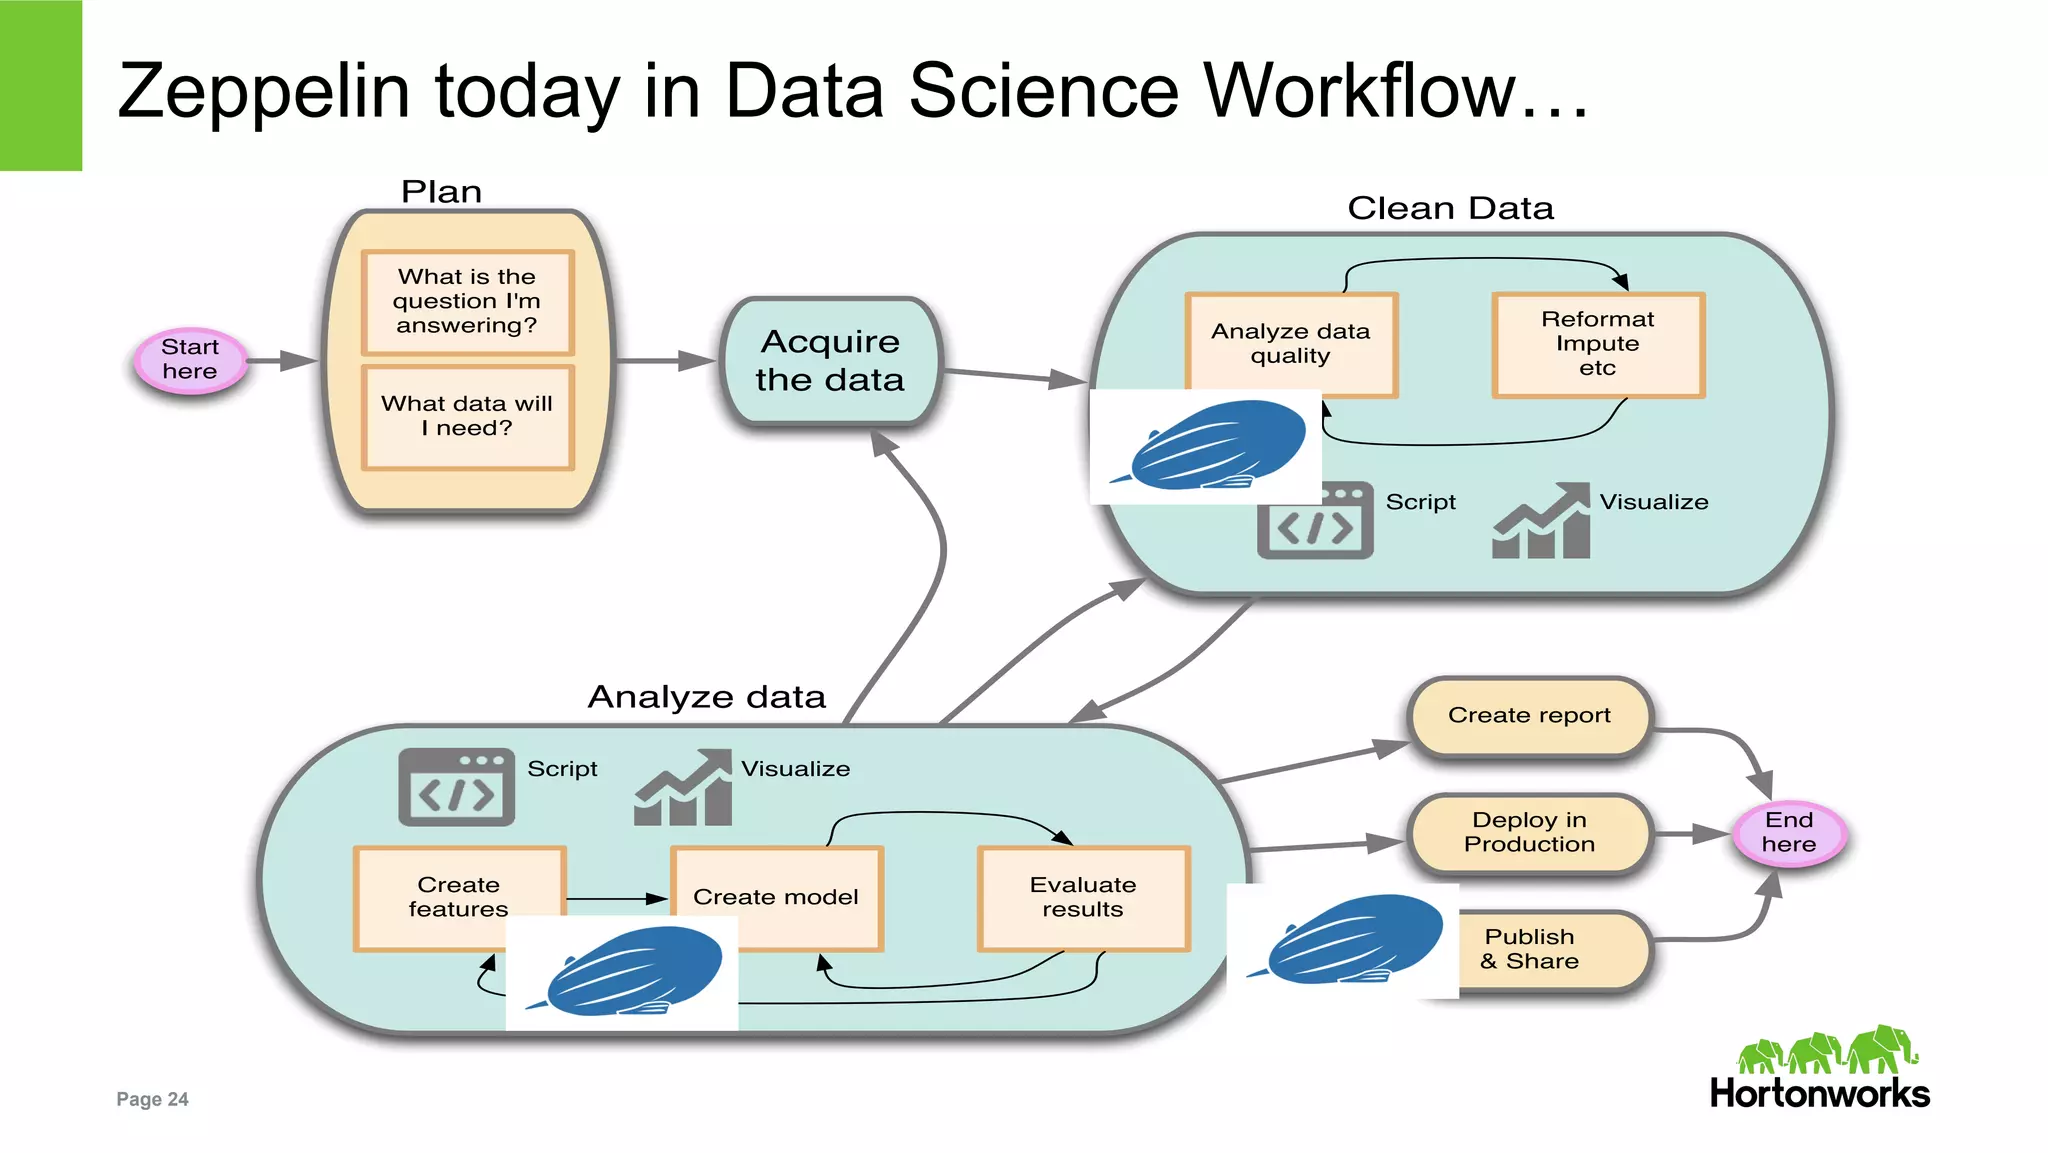
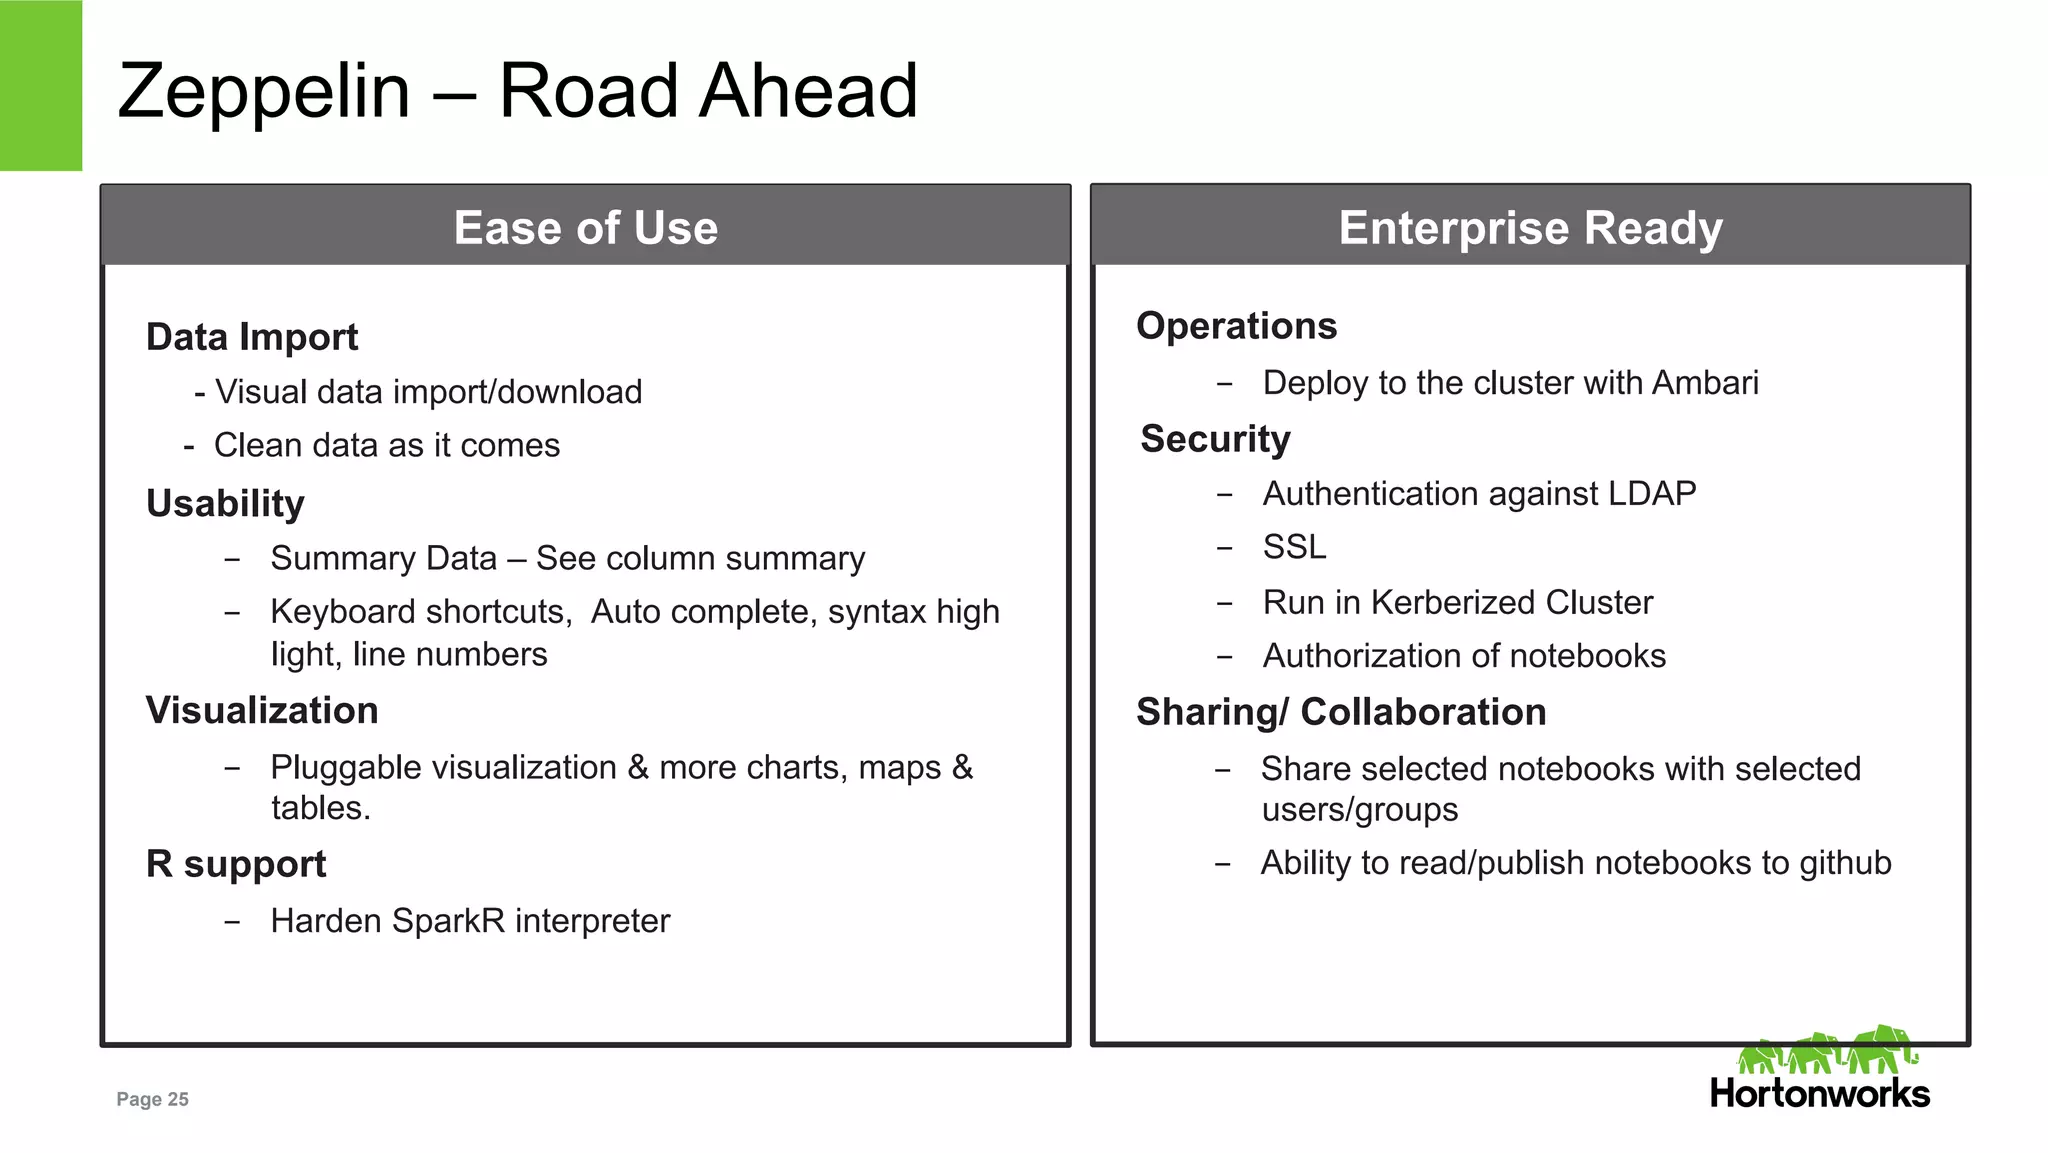

The document outlines key challenges and methodologies in data science, including online learning, clustering, and co-training. It discusses problems such as click prediction in search advertising, entity resolution, and login risk detection while emphasizing the importance of efficient and adaptable algorithms. Additionally, it introduces Apache Zeppelin as a tool for interactive analytics in the data science workflow, highlighting its capabilities and future developments.