This document describes an experiment that measures heart rate and blood pressure in response to cold stimulus. Baseline heart rate and blood pressure are recorded, then the subject submerges their foot in ice water while continuous measurements are taken. This causes heart rate and blood pressure to increase through activation of the sympathetic nervous system. Maximum and rebound heart rates are analyzed to understand the body's response to stress and its ability to maintain homeostasis. The experiment demonstrates how vital signs change acutely in a "fight or flight" situation and the role of the autonomic nervous system in regulating physiological responses.
Methods of measurement of blood pressure in children.
Steps for accurate measurement and how to plot the measurement on charts and compare it with the normal blood pressure percentile with example.
Blood pressure is the pressure of circulating blood on the walls of blood vessels. Most of this pressure is due to work done by the heart by pumping blood through the circulatory system. Used without further specification, "blood pressure" usually refers to the pressure in large arteries of the systemic circulation.
The pressure of the blood in the circulatory system, often measured for diagnosis since it is closely related to the force and rate of the heartbeat and the diameter and elasticity of the arterial walls.
Vital signs
The four main vital signs routinely monitored by medical professionals and health care providers include the following:
Body temperature.
Pulse rate.
Respiration rate (rate of breathing)
Blood pressure
Vital signs provide important information about patients’ clinical condition and inform any required interventions
Inadequate response to deterioration is the most common cause of reported critical incidents
Nurses’ compliance with observation protocols can be poor, particularly at night
Peaks in observation frequency suggests the timing of observation is often driven by ward routines
Electronic vital signs devices and early warning score charts may increase vital signs measurements, but further research is needed
Control of blood pressure & the benefit of exerciseShazia Akram
Biology iGCSE, A level
Cambridge/edexel curriculum
Concise notes to understand how exercise has an affect on blood pressure. Includes brief mention about heart disease and treatment with stenting/CABG. Includes brief discussion about lifestyle factors.
Available in PDF and PPT versions.
Can i take this opportunity to thank everyone from whom iv
20.2 Blood Flow, Blood Pressure, and Resistance Get This Book!.docxfelicidaddinwoodie
20.2 Blood Flow, Blood Pressure, and Resistance
Get This Book!
Page by: OpenStax
Summary
By the end of this section, you will be able to:
· Distinguish between systolic pressure, diastolic pressure, pulse pressure, and mean arterial pressure
· Describe the clinical measurement of pulse and blood pressure
· Identify and discuss five variables affecting arterial blood flow and blood pressure
· Discuss several factors affecting blood flow in the venous system
Blood flow refers to the movement of blood through a vessel, tissue, or organ, and is usually expressed in terms of volume of blood per unit of time. It is initiated by the contraction of the ventricles of the heart. Ventricular contraction ejects blood into the major arteries, resulting in flow from regions of higher pressure to regions of lower pressure, as blood encounters smaller arteries and arterioles, then capillaries, then the venules and veins of the venous system. This section discusses a number of critical variables that contribute to blood flow throughout the body. It also discusses the factors that impede or slow blood flow, a phenomenon known as resistance.
As noted earlier, hydrostatic pressure is the force exerted by a fluid due to gravitational pull, usually against the wall of the container in which it is located. One form of hydrostatic pressure is blood pressure, the force exerted by blood upon the walls of the blood vessels or the chambers of the heart. Blood pressure may be measured in capillaries and veins, as well as the vessels of the pulmonary circulation; however, the term blood pressure without any specific descriptors typically refers to systemic arterial blood pressure—that is, the pressure of blood flowing in the arteries of the systemic circulation. In clinical practice, this pressure is measured in mm Hg and is usually obtained using the brachial artery of the arm.
Components of Arterial Blood Pressure
Arterial blood pressure in the larger vessels consists of several distinct components (Figure): systolic and diastolic pressures, pulse pressure, and mean arterial pressure.
Systolic and Diastolic Pressures
When systemic arterial blood pressure is measured, it is recorded as a ratio of two numbers (e.g., 120/80 is a normal adult blood pressure), expressed as systolic pressure over diastolic pressure. The systolic pressure is the higher value (typically around 120 mm Hg) and reflects the arterial pressure resulting from the ejection of blood during ventricular contraction, or systole. The diastolic pressure is the lower value (usually about 80 mm Hg) and represents the arterial pressure of blood during ventricular relaxation, or diastole.
Systemic Blood Pressure
The graph shows the components of blood pressure throughout the blood vessels, including systolic, diastolic, mean arterial, and pulse pressures.
Pulse Pressure
As shown in Figure, the difference between the systolic pressure and the diastolic pressure is the pulse pressure. For example, an indivi ...
The force of circulating blood on the walls of the arteries. Blood pressure is taken using two measurements: systolic (measured when the heart beats, when blood pressure is at its highest) and diastolic (measured between heart beats, when blood pressure is at its lowest).A blood pressure measurement is a test that measures the force (pressure) in your arteries as your heart pumps. Blood pressure is measured as two numbers: Systolic blood pressure (the first and higher number) measures pressure inside your arteries when the heart beats.
Cardiac output as you know is made up of heart rate and stroke volume. At rest, these are relatively constant however with exercise the heart beats faster, and more blood is pumped out with each beat. These factors both contribute to a rise in BP, as would any other factor that caused the heart to speed up
this is a detailed study on blood pressure measurement on clinical watching , methods , equipment's , common problems ,and all major aspects of blood pressure measurement is mentioned in detail .
please comment
thank you
1. Computer
Heart Rate and Blood Pressure
10
as Vital Signs
Since the earliest days of medicine heart rate has been recognized as a vital sign—an indicator of
health, disease, excitement, and stress. Medical personnel use the heart rate to provide clues as to
the presence of many medical conditions. Reflex changes in heart rate are one of the body’s most
basic mechanisms for maintaining proper perfusion to the brain and other tissues. Low blood
volume caused by bleeding or dehydration results in the heart beating faster as it attempts to
maintain adequate blood pressure. Excitement, stress, and anxiety activate the nervous system,
which may also speed the heart rate and raise blood pressure.
By the second half of the 19th century a non-invasive method for measuring blood pressure had
been invented. Called a sphygmomanometer, this instrument is still in use today allowing us to
measure this important vital sign.
Blood pressure is a measure of the changing fluid pressure within the circulatory system. It
varies from a peak pressure produced by contraction of the left ventricle, to a low pressure,
which is maintained by closure of the aortic valve and elastic recoil of the arterial system. The
peak pressure is called systole, and the pressure that is maintained even while the left ventricle is
relaxing is called diastole.
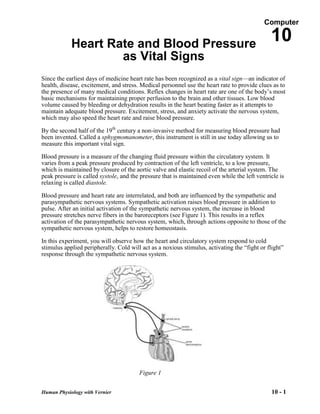
Blood pressure and heart rate are interrelated, and both are influenced by the sympathetic and
parasympathetic nervous systems. Sympathetic activation raises blood pressure in addition to
pulse. After an initial activation of the sympathetic nervous system, the increase in blood
pressure stretches nerve fibers in the baroreceptors (see Figure 1). This results in a reflex
activation of the parasympathetic nervous system, which, through actions opposite to those of the
sympathetic nervous system, helps to restore homeostasis.
In this experiment, you will observe how the heart and circulatory system respond to cold
stimulus applied peripherally. Cold will act as a noxious stimulus, activating the ―fight or flight‖
response through the sympathetic nervous system.
Figure 1
Human Physiology with Vernier 10 - 1
2. Heart Rate and Blood Pressure as Vital Signs
OBJECTIVES
In this experiment, you will
Obtain graphical representation of heart rate and blood pressure.
Compare heart rate and blood pressure before and after exposure to cold stimulus.
Observe an example of sympathetic nervous system activation (―fight or flight response‖).
MATERIALS
Computer Vernier Blood Pressure Sensor
Vernier computer interface ice water bath
Logger Pro Towel
Vernier Hand-Grip Heart Rate Monitor or saline solution in dropper bottle
Vernier Exercise Heart Rate Monitor (only for use with Exercise HR Monitor)
PROCEDURE
Part I Baseline Blood Pressure Determination
1. Connect the Blood Pressure Sensor to Channel 1 of the Vernier computer interface. There are
two rubber tubes connected to the pressure cuff. One tube has a black Luer-lock connector at
the end and the other tube has a bulb pump attached. Connect the Luer-lock connector to the
stem on the Blood Pressure Sensor with a gentle half turn if it is not already attached.
2. Open the file ―10a Heart Rate and BP‖ from the Human Physiology with
Vernier folder.
3. Attach the Blood Pressure cuff firmly around the upper arm, approximately
2 cm above the elbow. The two rubber hoses from the cuff should be
positioned over the biceps muscle (brachial artery) and not under the arm
(see Figure 2).
4. Have the subject sit quietly in a chair with forearms resting on his/her lap,
or on a table surface. The person having his or her blood pressure
measured must remain still during data collection; there should be no
movement of the arm or hand during measurements.
Figure 2
5. Click to begin data collection. Immediately begin to pump until the
cuff pressure reaches at least 160 mm Hg. Stop pumping. The cuff will slowly deflate and the
pressure will fall. During this time, the systolic, diastolic, and mean arterial pressures and the
pulse will be calculated by the software. These values will be displayed on the computer
screen. When the cuff pressure drops below 50 mm Hg, the program will stop calculating
blood pressure. At this point, you can terminate data collection by clicking . Release
the pressure from the cuff, but do not remove it.
6. Enter the systolic, diastolic, and mean arterial pressures in Table 1.
Part II Heart Rate and Blood Pressure Response to Cold
7. Connect the receiver module of the Heart Rate Monitor to Channel 2 of the Vernier computer
interface. Open the file ―10b Heart Rate and BP‖ from the Human Physiology with
Vernierfolder.
Human Physiology with Vernier 10 - 2
3. Heart Rate and Blood Pressure as Vital Signs
8. Set an ice water bath on the floor, next to the subject’s feet.
9. Prepare to collect data.
a. Sit in a chair.
b. Prepare to submerge your foot in the ice water bath by removing your shoe and sock.
c. Position your foot adjacent to the ice water bath, but do not put it in the bath yet.
10. Set up the Heart Rate Monitor. Follow the directions for your type of Heart Rate Monitor.
Using a Hand-Grip Heart Rate Monitor
a. The receiver and one of the handles are marked with a
white alignment arrow as shown in Figure 3. Locate
these two arrows.
b. Have the subject grasp the handles of the Hand-Grip
Heart Rate Monitor so that their fingers are in the
reference areas indicated in Figure 4. Hold the handles
vertically.
c. Have someone else hold the receiver near the handles
so that the two alignment arrows are pointing in the
same direction and are at approximately the same Figure 3 Figure 4
height as shown in Figure 3.Note: The receiver must
stay within 60 cm of the handles during data collection.
11. With the subject sitting quietly, click to begin data collection.
a. At 40 s, instruct the subject to submerge his/her foot in the ice water bath.
b. Immediately pump the bulb pump of the Blood Pressure Sensor until the cuff pressure
reaches at least 160 mm Hg. Stop pumping.
c. At 70 s instruct the subject to remove his/her foot from the ice water bath.
d. As data collection continues, the cuff will slowly deflate and the pressure will fall. During
this time, the systolic, diastolic, and mean arterial pressures will be calculated by the
software. When the cuff pressure drops below 50 mm Hg, the program will stop
calculating blood pressure.
e. The subject should remain seated and allow data collection to continue for the full 240 s
data-collection period.
12. Enter the systolic, diastolic, and mean arterial pressures in Table 2.
13. Click and drag over the area of the heart rate graph where the resting (―baseline‖) heart rate
is displayed (15–40 s). Click the Statistics button, . The Statistics box will appear with the
statistics calculated for the selected region. Record the mean resting heart rate, to the nearest
whole number, in Table 3.
Human Physiology with Vernier 10 - 3
4. Heart Rate and Blood Pressure as Vital Signs
14. Move the statistics brackets to highlight the region of the graph beginning at 40 s (when the
foot was immersed in the ice water bath) and ending at the first peak (see Figure 6). Record
the maximum heart rate value to the nearest whole number in Table 3. In the corresponding
Time column record (to the nearest whole number) the x value displayed at the lower left
corner of the graph.
Figure 6 Figure 7
15. Move the Statistics brackets to enclose the region of the graph beginning at the first peak and
ending at the lowest point in the valley that follows (see Figure 7). Record the minimum
heart rate value to the nearest whole number as the Rebound heart rate in Table 3. Record the
x value in the corresponding Time column.
Human Physiology with Vernier 10 - 4
5. Heart Rate and Blood Pressure as Vital Signs
DATA
Table 1–Baseline Blood Pressure
Systolic pressure Diastolic pressure Mean arterial pressure
(mm Hg) (mm Hg) (mm Hg)
107 59 73
Table 2–Blood Pressure Response to Cold
Systolic pressure Diastolic pressure Mean arterial pressure
(mm Hg) (mm Hg) (mm Hg)
144 69 94
Table 3
Heart rate Time
Condition
(bpm) (s)
Resting heart rate 75 72
Maximum heart rate 108 72
Rebound heart rate 75 21
DATA ANALYSIS
1. Describe the trends that occurred in the systolic pressure, diastolic pressure, mean arterial
pressure, and heart rate with cold stimulus. How might these responses be useful in a ―fight
or flight‖ situation?
The diastolic pressure &
2. As a vital sign, blood pressure is an indicator of general health. A high blood pressure
(140/90 or higher) increases the risk of cardiovascular disease and strokes. Collect the
systolic and diastolic pressures for the class and calculate the average for each. Rate the class
average blood pressure using the follow scale:
Blood Pressure Category
140/90 or higher High
120–139/80–89 Pre-hypertension
119/79 or below Normal
Human Physiology with Vernier 10 - 5
6. Heart Rate and Blood Pressure as Vital Signs
Our classes blood pressure is normal.
Human Physiology with Vernier 10 - 6
7. Heart Rate and Blood Pressure as Vital Signs
3. How long after immersion did your heart rate reach its maximum value? Explain the
physiologic mechanism that led to the change in temperature the foot went through.
20 seconds after.
4. Describe the changes in heart rate that occurred after the maximum value. How can you
explain the minimum heart rate value? How would you explain the heart rate variations seen
in the remainder of the experiment?
It was a change of 33 beats per minute. The minimum heart rate is when the heart beats less. The
more activity you did, or the more the experiment changed the heart rate value changed,
5. How long after the maximum heart rate did it take to arrive at your rebound heart rate? What
can you say about the relative speed of physiologic response to a stimulus vs. the speed of
mechanisms that are designed to maintain homeostasis?
It took 51s to arrive at our rebound heart rate. They depend on each other since without the
physiological response there wouldn’t be movement.
6. If the heart rate is too slow there is inadequate blood pressure to maintain perfusion to the
brain. This can lead to loss of consciousness (fainting). Keeping in mind the autonomic
nervous system responses that you observed in this experiment, explain the sequence of
events that results in a severely frightened person fainting.
-The first step in sequence would have to be a person being frightened, then heart rate
decreases causing a person to lose consciousness or more commonly known as fainting.
Human Physiology with Vernier 10 - 7