1. Experiments
Experiment 1-
DATA
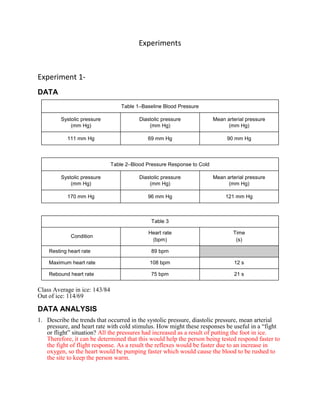
Table 1–Baseline Blood Pressure
Systolic pressure Diastolic pressure Mean arterial pressure
(mm Hg) (mm Hg) (mm Hg)
111 mm Hg 69 mm Hg 90 mm Hg
Table 2–Blood Pressure Response to Cold
Systolic pressure Diastolic pressure Mean arterial pressure
(mm Hg) (mm Hg) (mm Hg)
170 mm Hg 96 mm Hg 121 mm Hg
Table 3
Heart rate Time
Condition
(bpm) (s)
Resting heart rate 89 bpm
Maximum heart rate 108 bpm 12 s
Rebound heart rate 75 bpm 21 s
Class Average in ice: 143/84
Out of ice: 114/69
DATA ANALYSIS
1. Describe the trends that occurred in the systolic pressure, diastolic pressure, mean arterial
pressure, and heart rate with cold stimulus. How might these responses be useful in a “fight
or flight” situation? All the pressures had increased as a result of putting the foot in ice.
Therefore, it can be determined that this would help the person being tested respond faster to
the fight of flight response. As a result the reflexes would be faster due to an increase in
oxygen, so the heart would be pumping faster which would cause the blood to be rushed to
the site to keep the person warm.
2. 2. As a vital sign, blood pressure is an indicator of general health. A high blood pressure
(140/90 or higher) increases the risk of cardiovascular disease and strokes. Collect the
systolic and diastolic pressures for the class and calculate the average for each. Rate the class
average blood pressure using the follow scale:
Blood Pressure Category
140/90 or higher High
120–139/80–89 Pre-hypertension
119/79 or below Normal
Normal
114/69
Category: Normal
Ice
170/ 96
Category: High
3. How long after immersion did your heart rate reach its maximum value? Explain the
physiologic mechanism that led to this change in heart rate.
15 seconds after immersion was when the heart reached its’ maximum value; the cold
temperature was the stimulus and the response was the increased heart rate to help the body
warm the foot as a survival instinct.
4. Describe the changes in heart rate that occurred after the maximum value. How can you
explain the minimum heart rate value? How would you explain the heart rate variations seen
in the remainder of the experiment?
It started to decrease but never reached the original resting heart- rate. This was due to the
cold stimulus as the foot rested in the water. The Minimum heart rate value was the rebound
after the heart accelerated due to the drop in temperature rapidly. When the heart rate started
to go back up we saw that it remained because the subject was not found in a stressful
environment, or the heart gone higher if unknown things were causing the subject to become
stressed.
5. How long after the maximum heart rate did it take to arrive at your rebound heart rate? What
can you say about the relative speed of physiologic response to a stimulus vs. the speed of
mechanisms that are designed to maintain homeostasis?
3. It took 21 seconds after the experiment started to arrive at the rebound. Therefore it was
faster for the body to react to the cold rather than return to its normal heart rate that it started.
6. If the heart rate is too slow there is inadequate blood pressure to maintain perfusion to the
brain. This can lead to loss of consciousness (fainting). Keeping in mind the autonomic
nervous system responses that you observed in this experiment, explain the sequence of
events that results in a severely frightened person fainting.
Before the subject is scared his/ her heart will beat at a normal or resting heart rate.
However, if the person is severely scared you could see an immediate increase in the heart rate
itself. Therefore, if we see the heart rate gets to high we could see an immediate reaction as to
fainting or problems with heart. This could cause an increase in blood pressure due to frightening
of so said person and could leave the subject with issues of cardiovascular disease and strokes.
Experiment 2
1. Describe the trends that occurred in the systolic pressure, diastolic pressure, mean arterial
pressure and pulse with exercise. Assume that the stroke volume increased from 75 mL/beat to
100 mL/beat. Use this information and the change in pulse with exercise to calculate the change
in cardiac output (stroke volume × heart rate) that occurred per minute.
2. Pulse pressure is the difference between systolic pressure (peak pressure during active
contraction of the ventricles) and diastolic pressure (the pressure that is maintained even while
the left ventricle is relaxing). Describe the change in pulse pressure seen with exercise. Which
component of the blood pressure is most responsible for this change?
4. 3. A change in pulse pressure can be seen in a variety of medical conditions. What
would you expect to happen to the pulse pressure in the following examples?
(a) In atherosclerosis there is a hardening of the arterial walls.
As result this would cause high pulse pressure
(b) A damaged aortic valve does not seal properly and allows blood to flow back
into the ventricle during diastole.
The pulse pressure would increase because the systolic pressure would increase
and the diastolic pressure would decrease making the difference between the two
smaller and the amount bigger.
4. Normal resting heart rates range from 55−100 beats per minute. What was
your/the subject’s resting heart rate? How much did your/the subject’s heart rate
increase above resting rate with exercise? What percent increase was this?
Our subjects resting heart rate was 89 bpm, then it increased to 138 bpm which
means it went up by 49 bpm. This is a 64.4% increase
5. How does your/the subject’s maximum heart rate compare with other students in
your group/class? Is this what you expected?
The heart rate compared about the same with the other groups. I expected it to be
around the same with everyone since we all had to do the same things.
6. Recovery time has been shown to correlate with degree of physical fitness. How
does your/the subject’s recovery rate compare to that of your classmates? Is this
what you expected?
The recovery rate all depends on the fitness of the people so other groups were
different than ours. It was expected because it’s how you recover from exercising.
5. 7. Congestive heart failure is a condition in which the strength of contraction with
each beat may be significantly reduced. For example, the ventricle may pump only
half the usual volume of blood with each beat. Would you expect a person with
congestive heart failure to have a faster or slower heart rate at rest? With exercise?
A person with the heart problem would have a slower heart rate rest because the
heart isn’t pumping as fast. With exercise the heart rate will increase because the
heart needs to pump more blood to regulate itself.
8. Medications are available which can slow the heart or speed it up. If a patient
complains of feeling poorly and has a heart rate of 120 beats per minute, should
you administer a medicine to slow the rate?
Yes because 120 beats per minute is too fast and if it slows down then the person
may start to feel somewhat better.