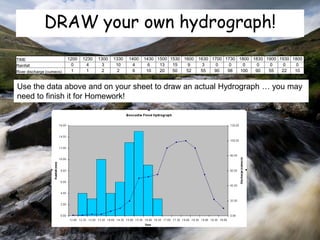
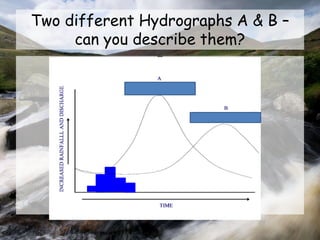
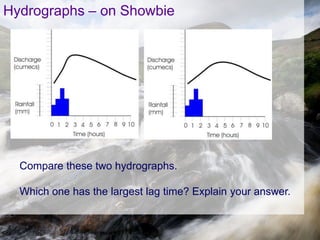
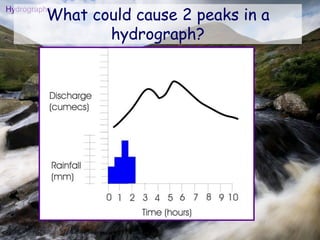
The document provides rainfall and river discharge data over time and asks the student to draw a hydrograph based on the data. It also asks the student to compare two sample hydrographs labeled A and B to identify which has the largest lag time between rainfall and peak discharge. Finally, it prompts the student to consider factors that could cause a hydrograph to have two peaks, such as additional rainfall after an initial event.