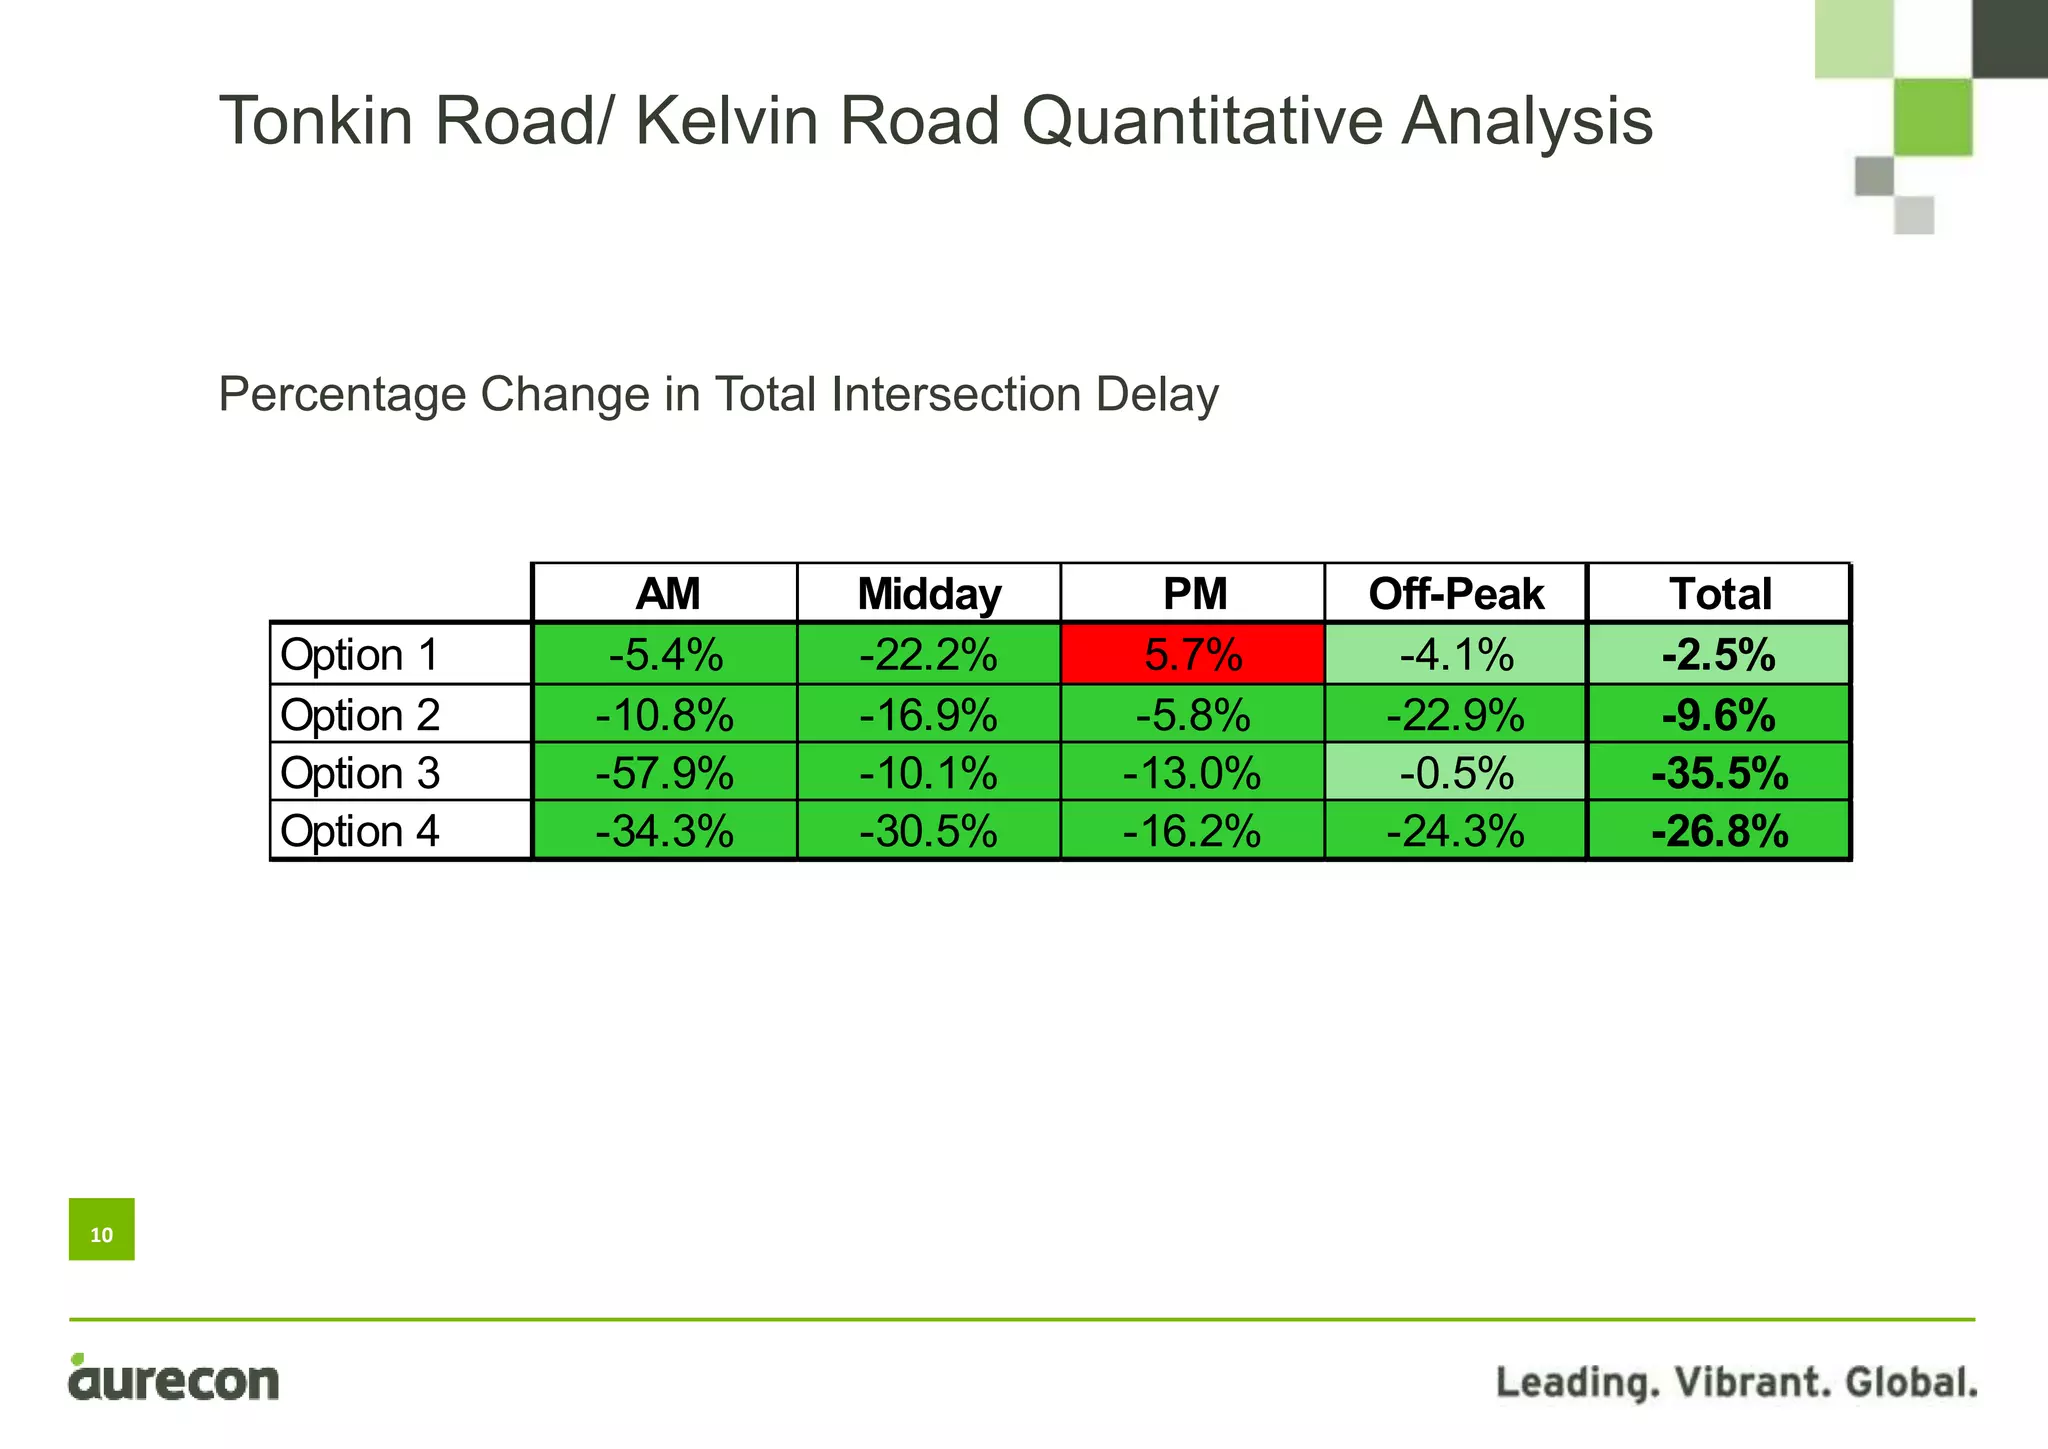
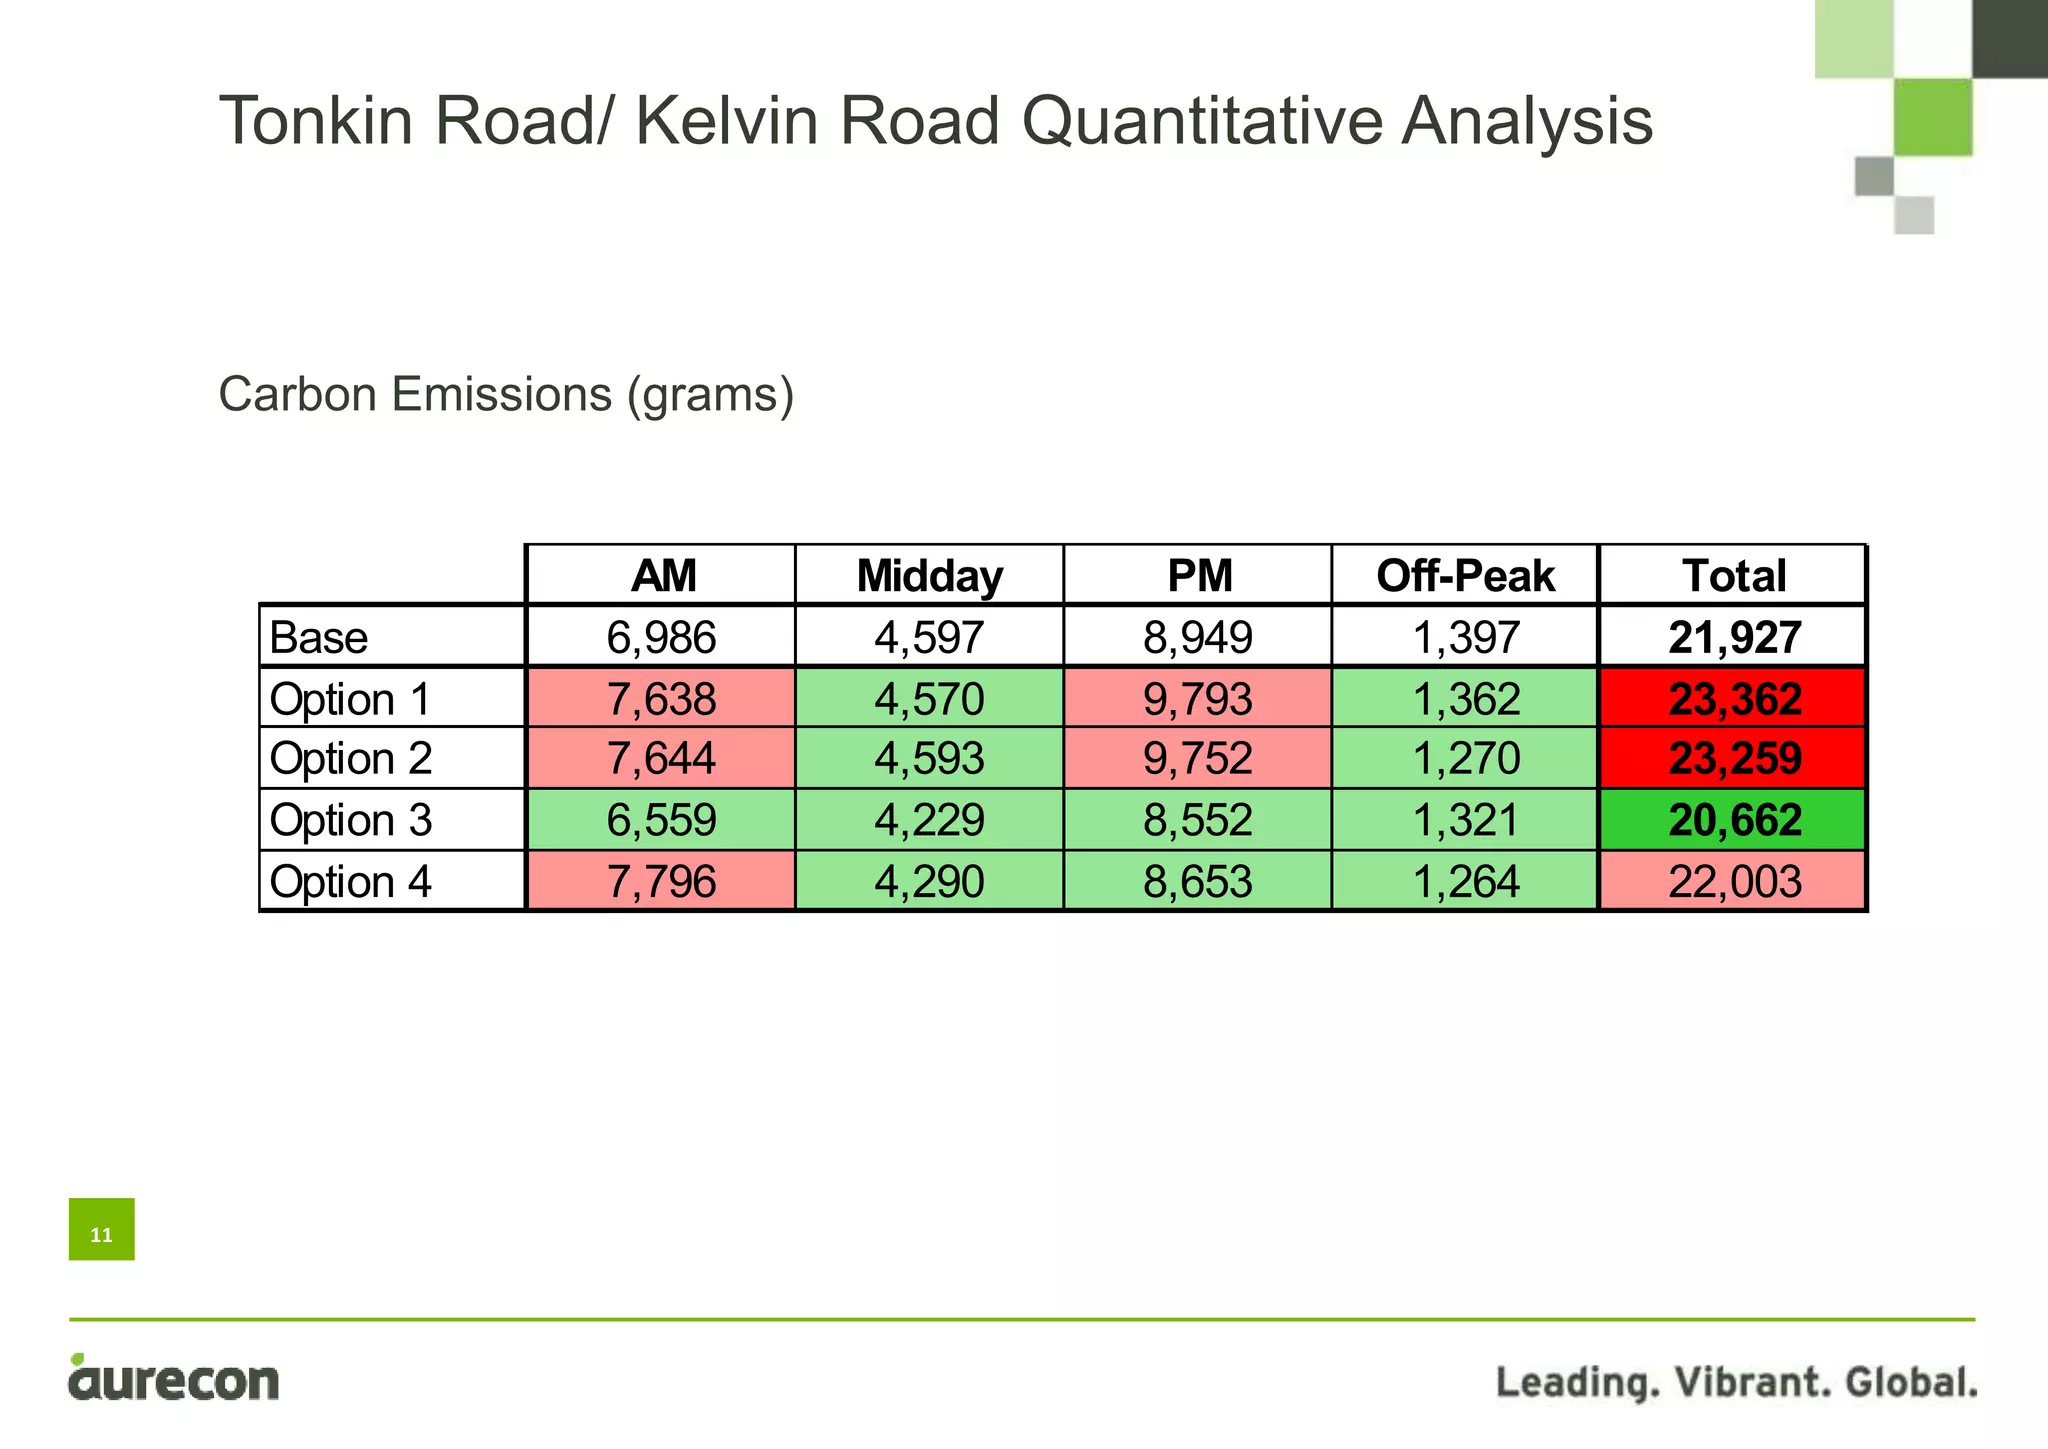
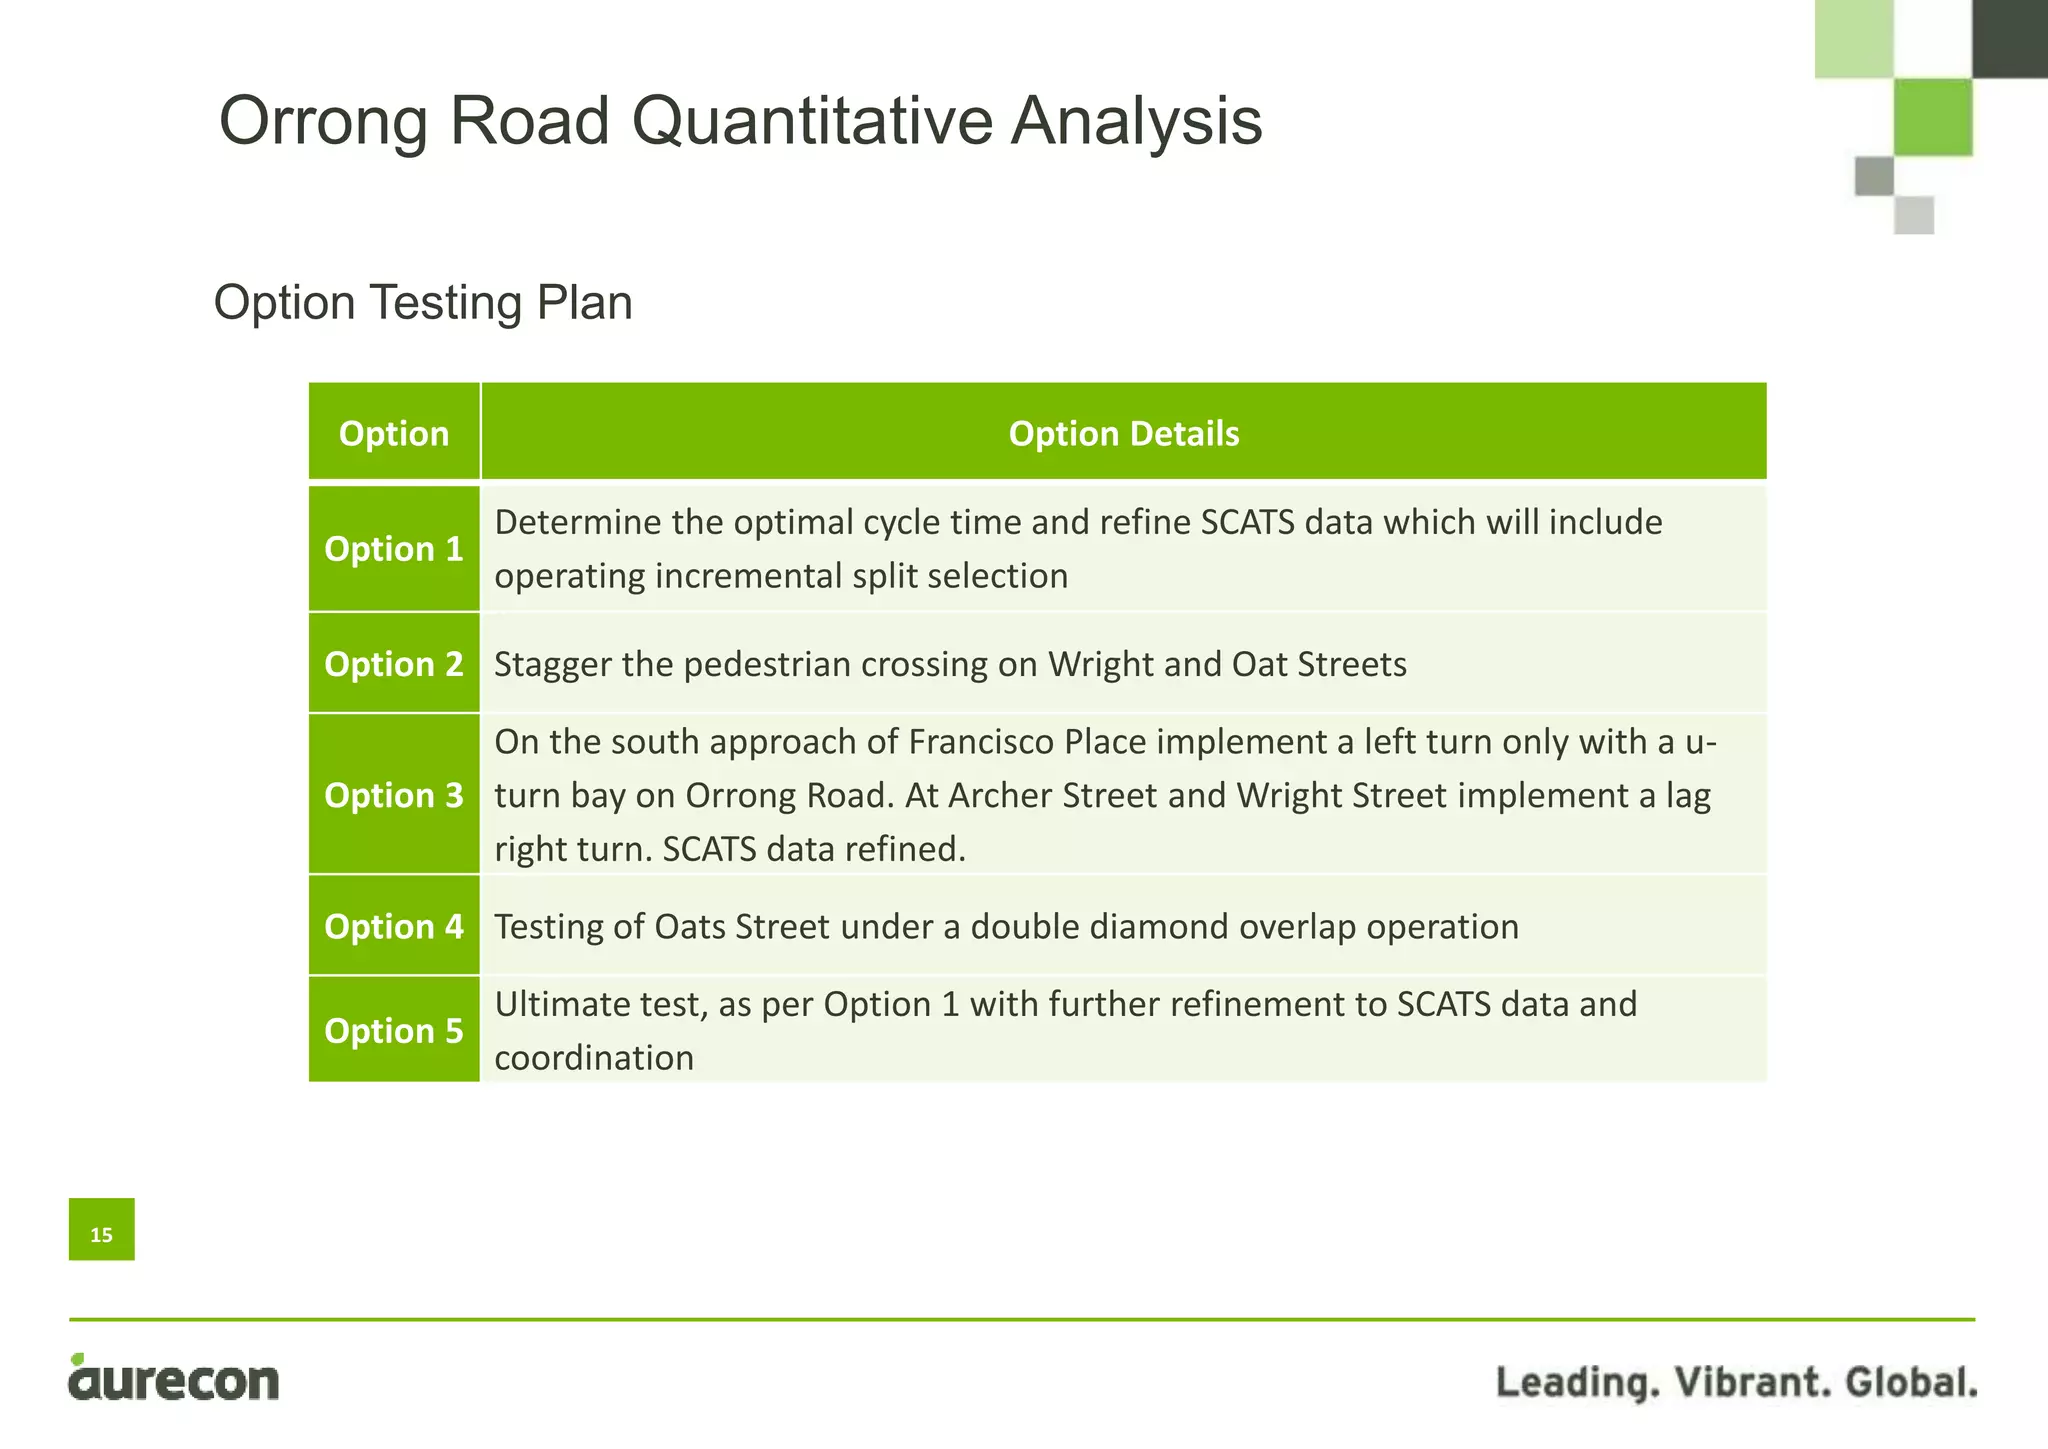
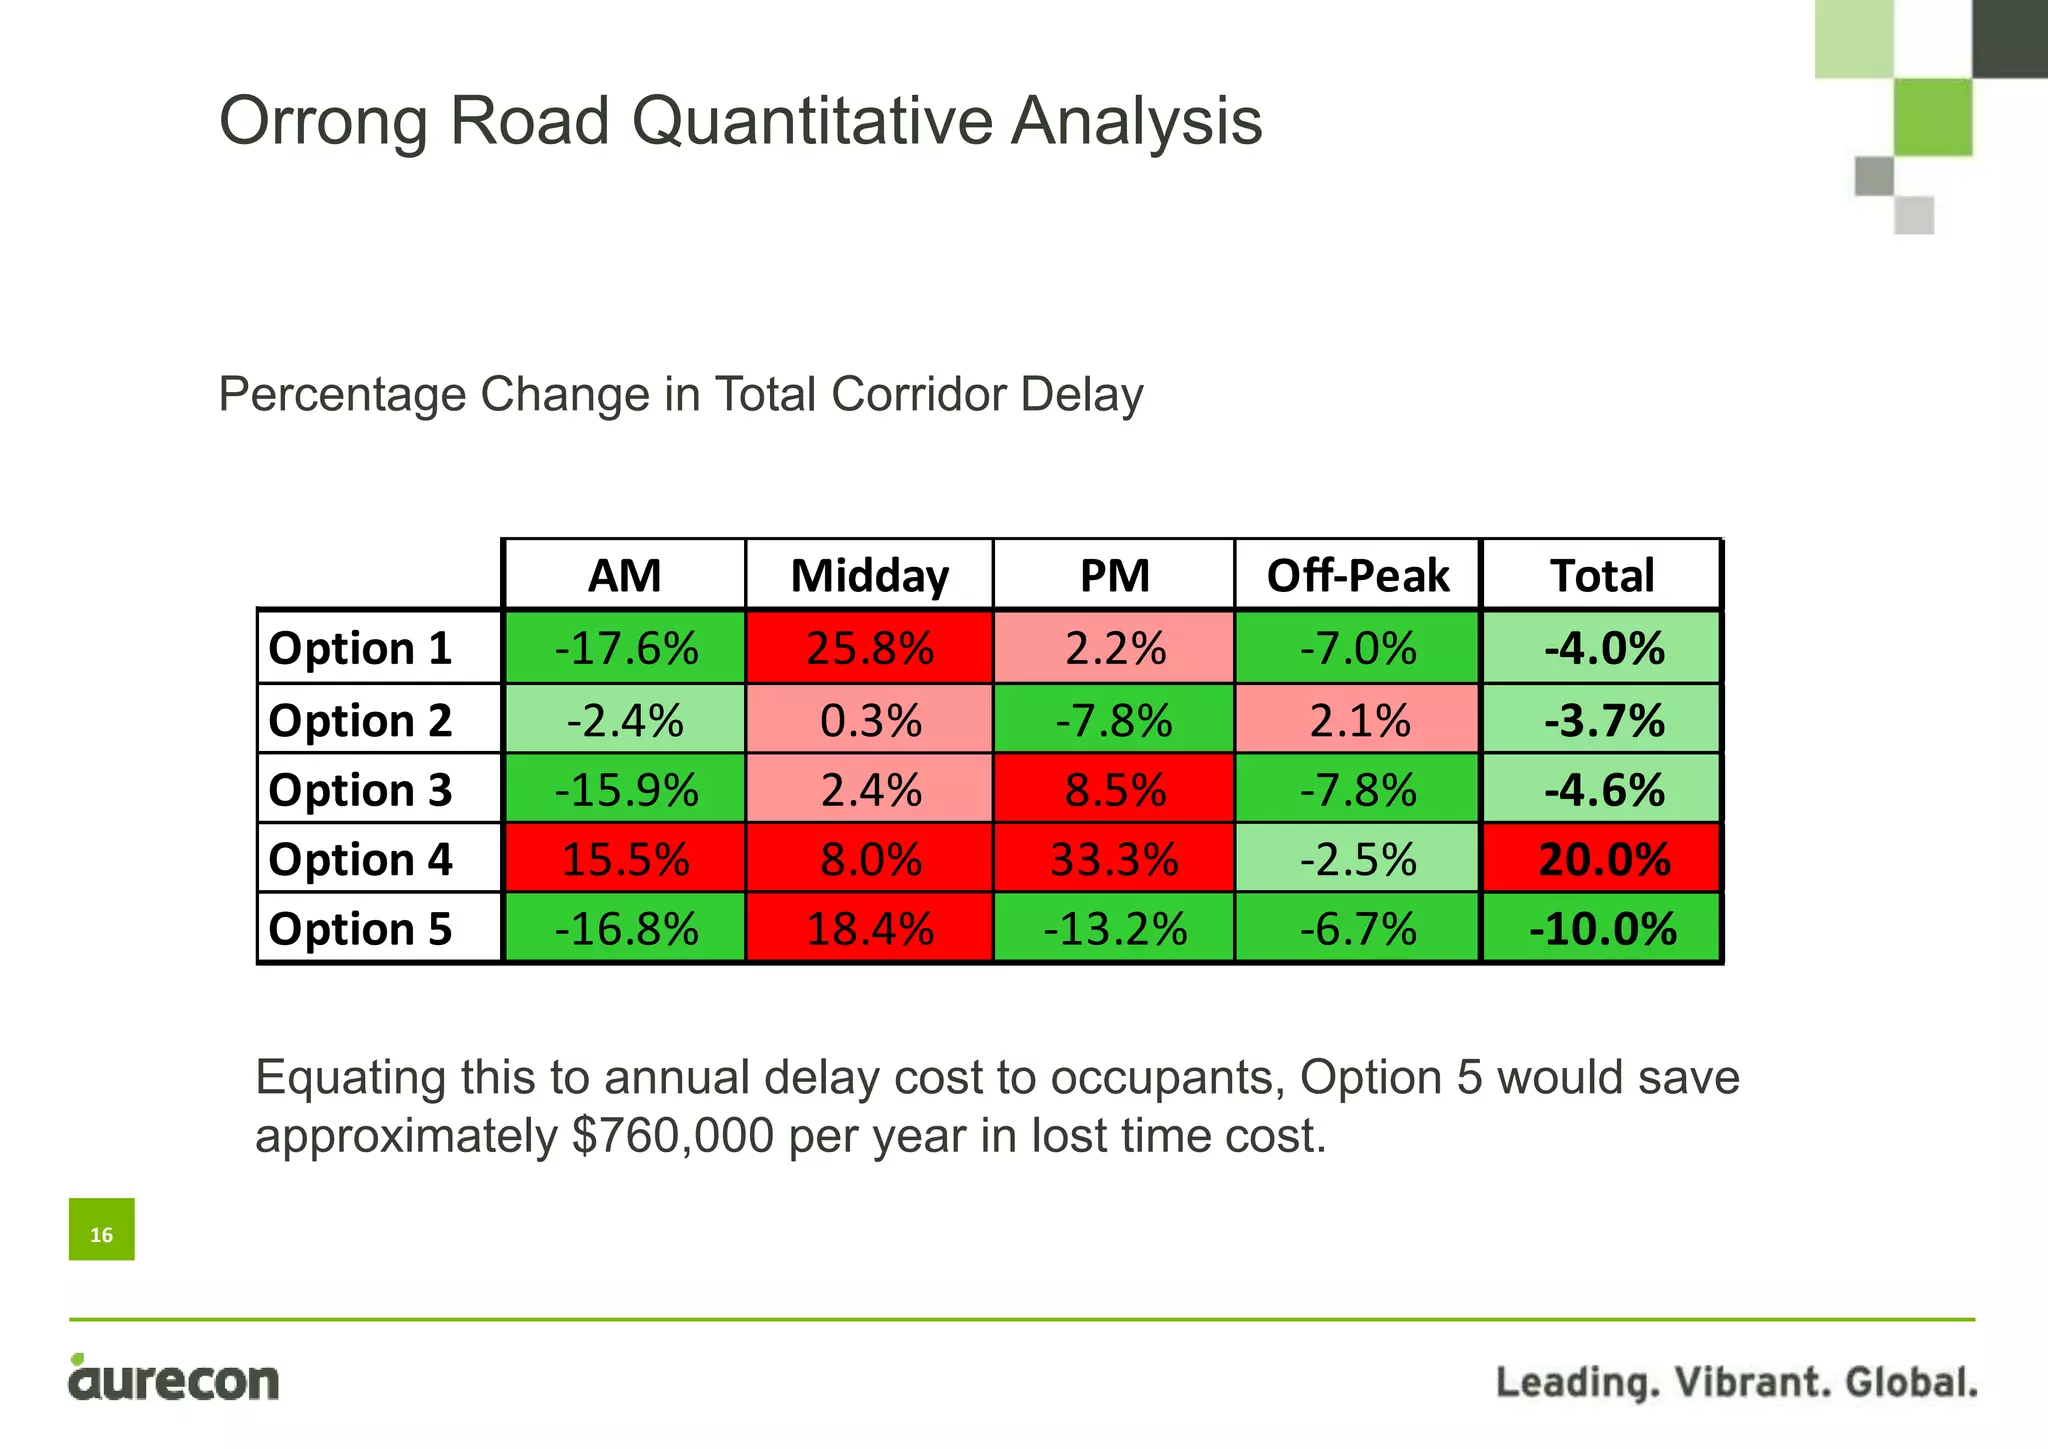
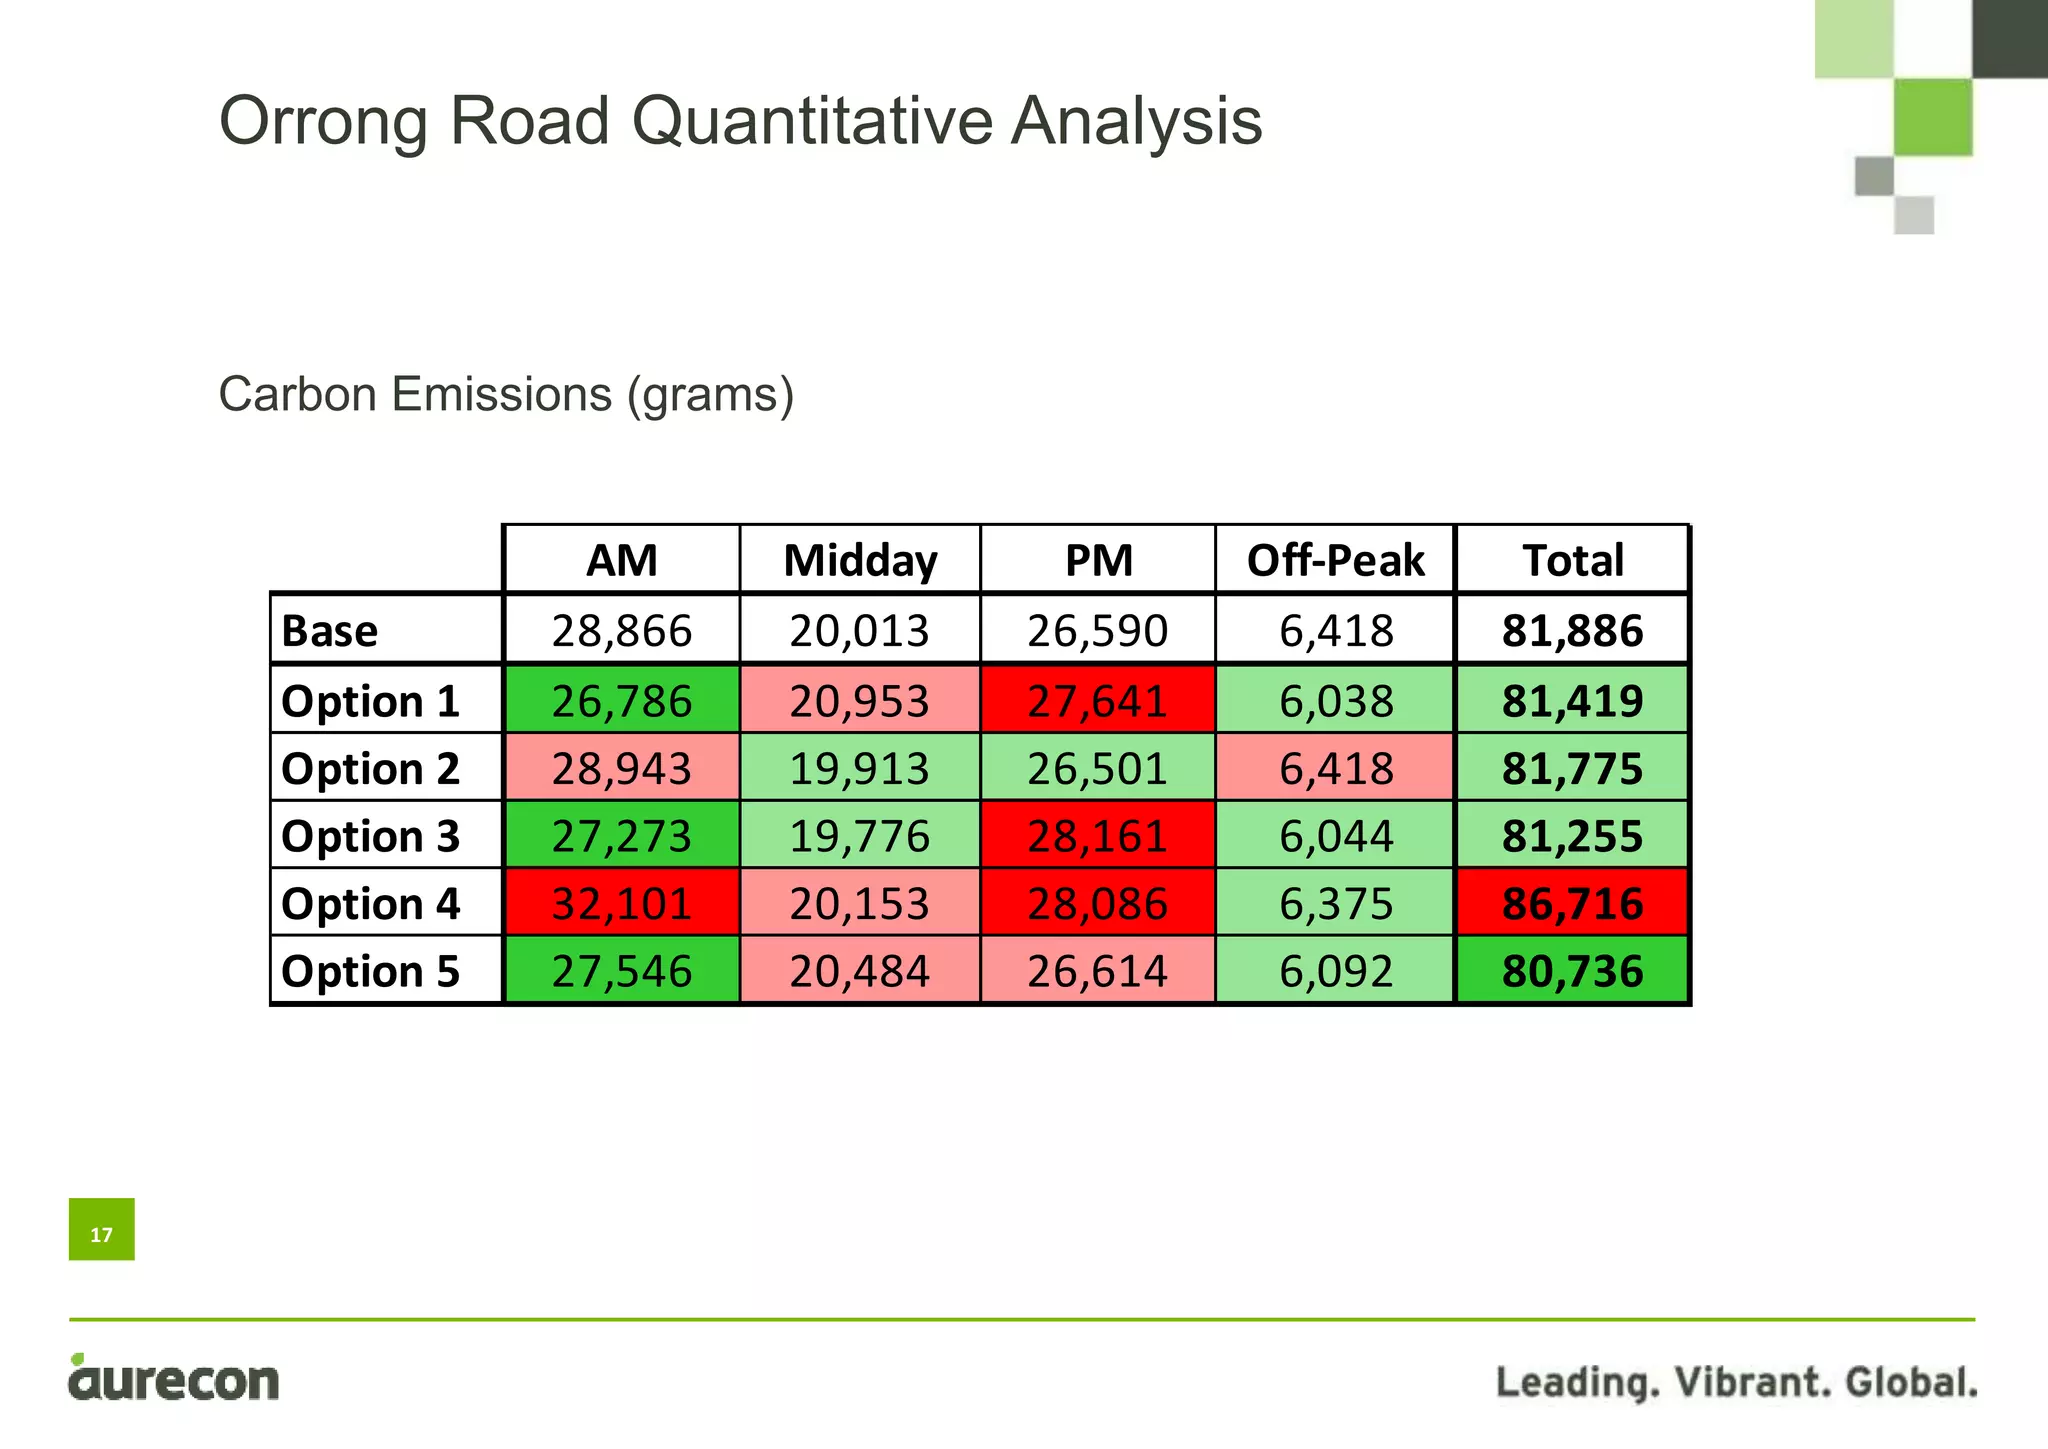
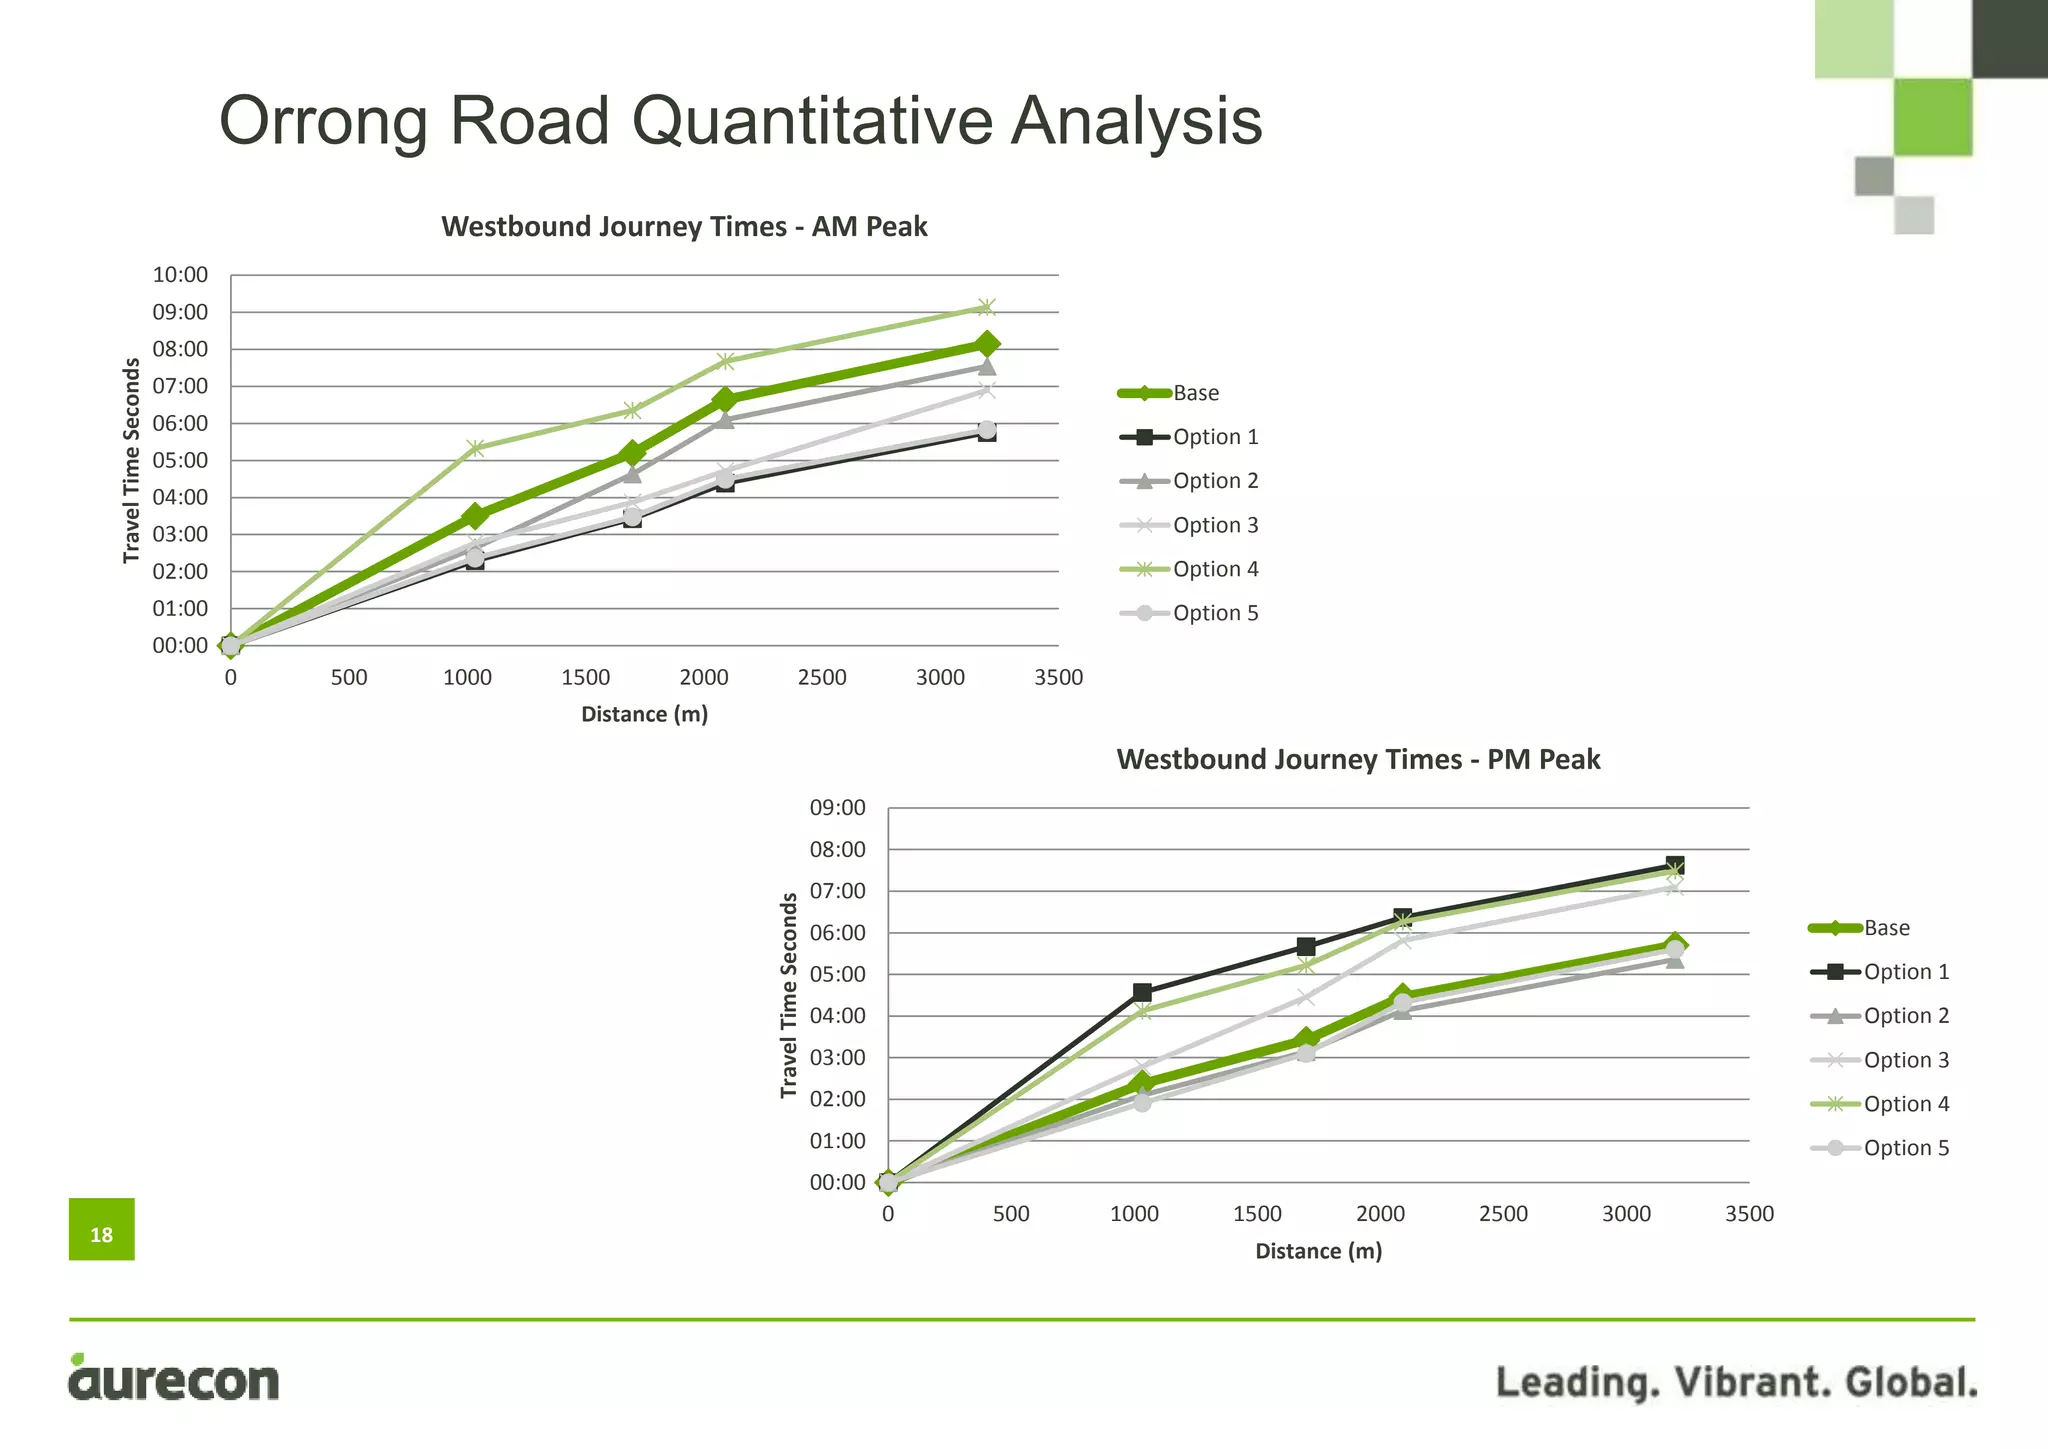
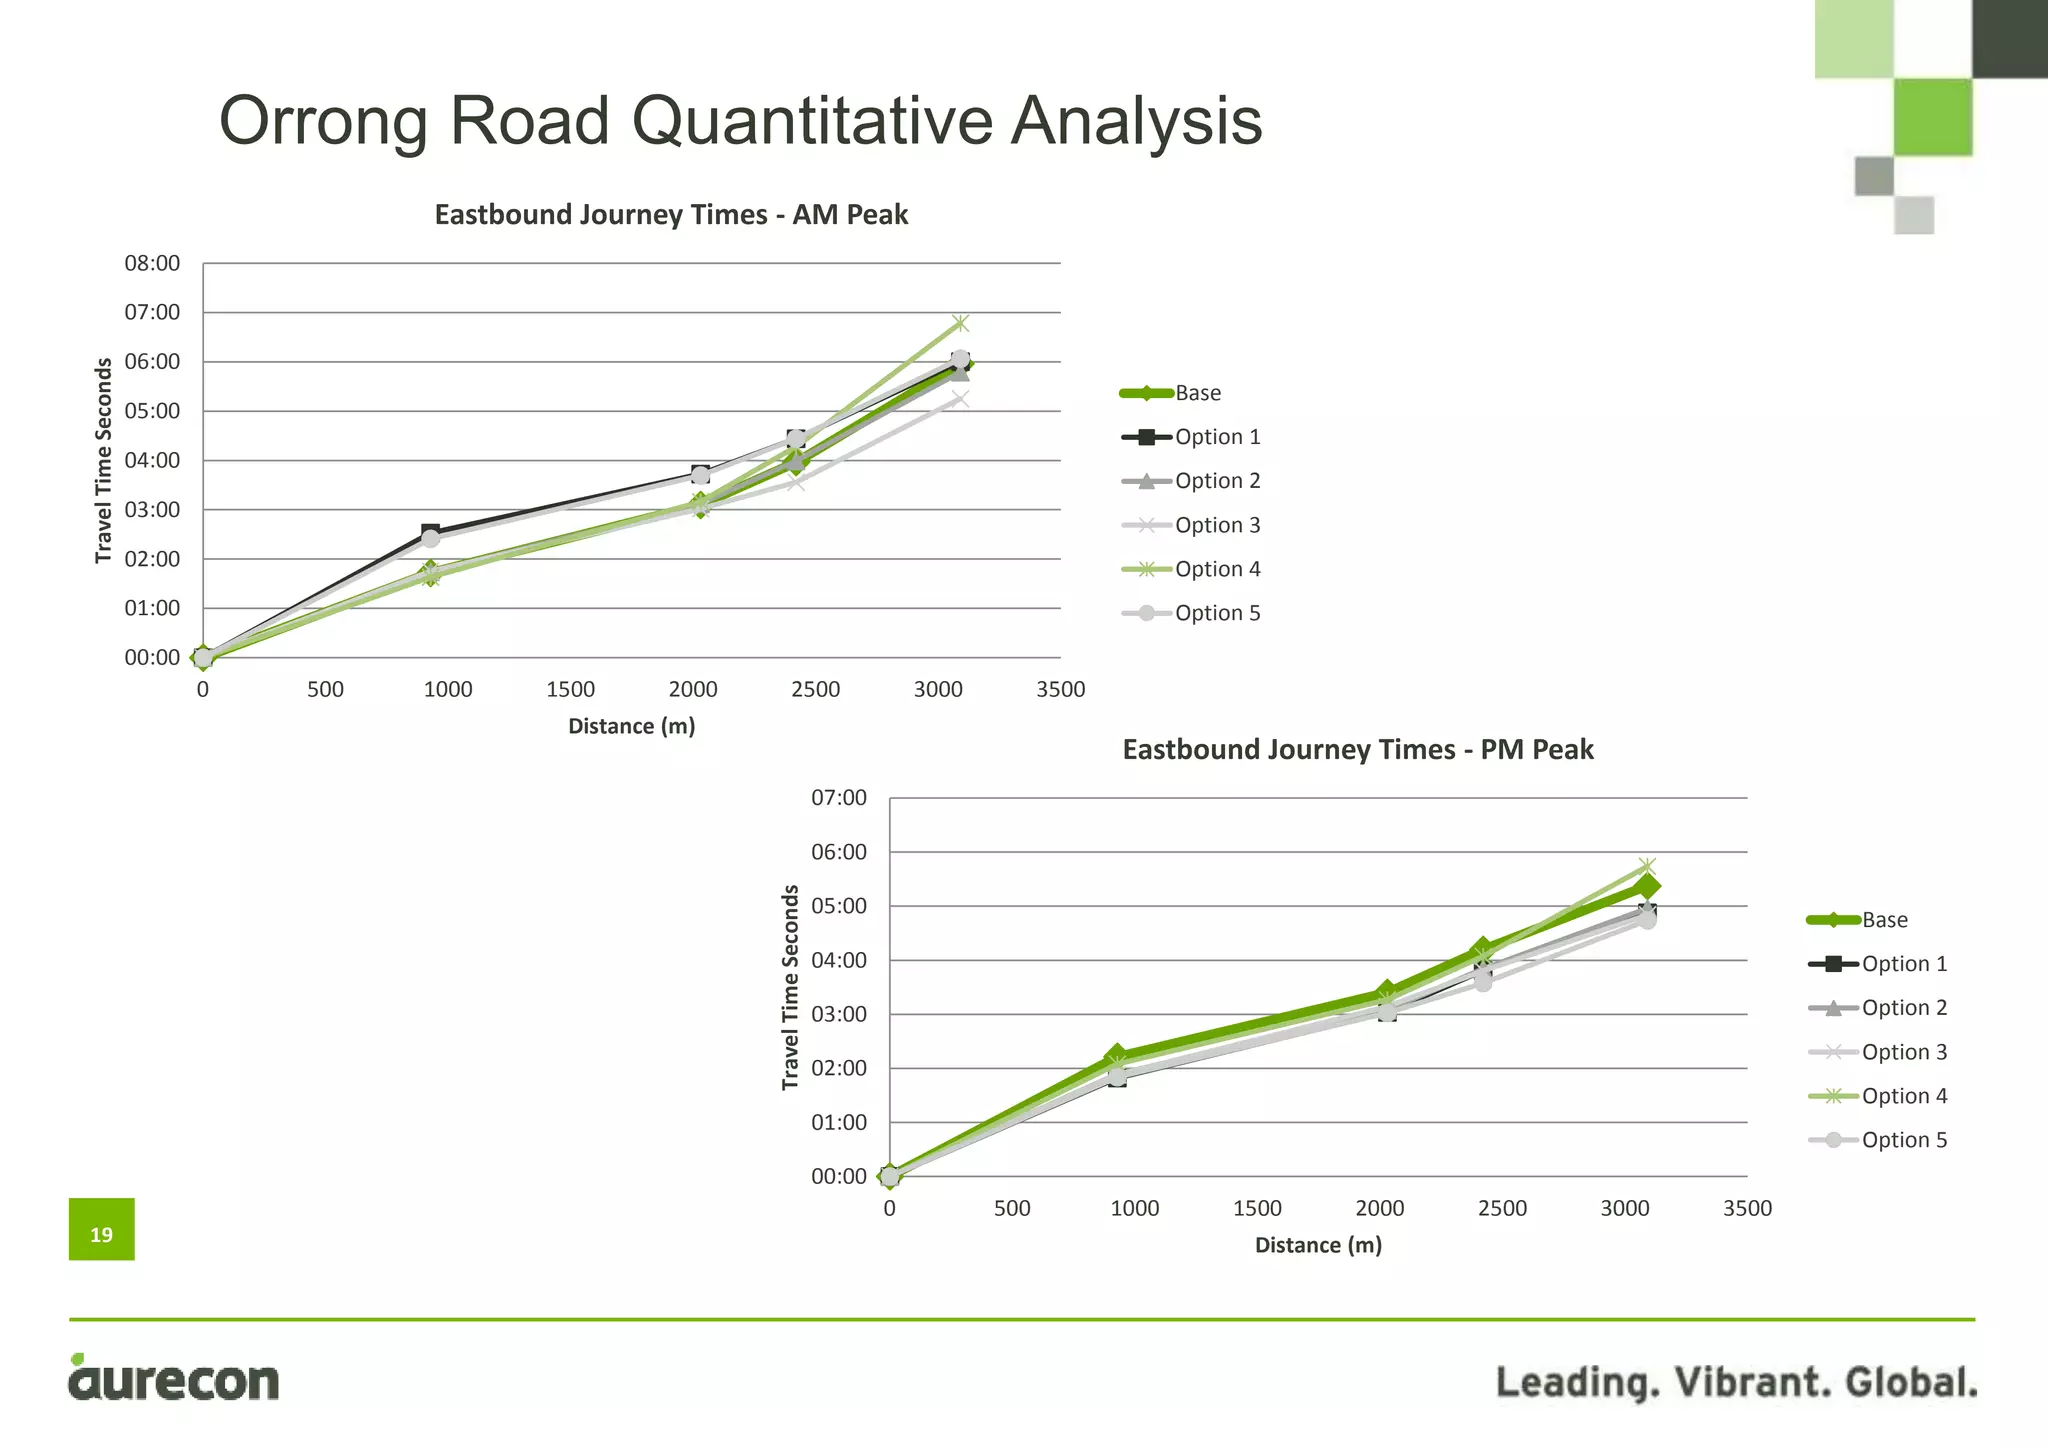
RAC WA Signals
Efficiency
Presentation
National AITPM Conference
Adelaide, SA
14 August 2014
2
The study looked at the Main Roads WA signal refinement processes to
and examined to subject sites to determine/ identify the following:
• What signalised intersection treatments are currently utilised
• What signal improvements could be achieved
• Considerations and requirements for refining SCATS signal settings
• Signal refinement methodologies
• Performance measures and evaluation of signal timing performance
• Main Roads WA signal refinement policy, management, planning, and
resources
Testing the use of an alternative method for optimising traffic
signals, modelling with SCATS, to squeeze more from existing
infrastructure.
Project Introduction
3
Why do this study?
The dream:
4
Why do this study?
The reality:
5
What is SCATS?
Sydney Coordinated Adaptive Traffic System
• SCATS monitors traffic volumes in real-time and coordinates traffic signals.
• It adjusts the coordination and green time of signals depending on the
traffic volumes detected on each approach.
• Approximately 900 signalised SCATS intersections in WA
6
What is SCATS?
Image Courtesy of Google Street View.
7
Qualitative Commentary
• Information gathered from the Main Roads WA workshops and
other sources
• High level overview of the SCATS signal settings
Quantitative Commentary
• Micro-simulation models built with SCATS signal control
• Several options tested
• Morning, Midday, Evening, and Off peak periods modelled
• On-site implementation and evaluation of AM and PM periods
Many subject sites were considered but two were selected for
testing:
• Orrong Road Corridor
• Tonkin Highway/ Kelvin Road intersection
Project Methodology
8
Tonkin Road/ Kelvin Road Site Description
9
Option Testing Plan
Tonkin Road/ Kelvin Road Quantitative Analysis
Option Option Details
Option 1
Adjust SCATS signal settings including Master-isolated operation and optimal
cycle time
Option 2 Test under a Double diamond overlap phasing
Option 3
Double right turn on Tonkin Highway north approach and localised additional
lane flaring on the Tonkin Highway south approach
Option 4
Ultimate test, adjustment of the SCATS signal settings including Master-isolated
operation, optimal cycle time, and test under a Double diamond overlap
phasing
10
Percentage Change in Total Intersection Delay
Tonkin Road/ Kelvin Road Quantitative Analysis
AM Midday PM Off-Peak Total
Option 1 -5.4% -22.2% 5.7% -4.1% -2.5%
Option 2 -10.8% -16.9% -5.8% -22.9% -9.6%
Option 3 -57.9% -10.1% -13.0% -0.5% -35.5%
Option 4 -34.3% -30.5% -16.2% -24.3% -26.8%
11
Carbon Emissions (grams)
Tonkin Road/ Kelvin Road Quantitative Analysis
AM Midday PM Off-Peak Total
Base 6,986 4,597 8,949 1,397 21,927
Option 1 7,638 4,570 9,793 1,362 23,362
Option 2 7,644 4,593 9,752 1,270 23,259
Option 3 6,559 4,229 8,552 1,321 20,662
Option 4 7,796 4,290 8,653 1,264 22,003
12
Orrong Road Site Description
13
Orrong Road Model
14
• Moderately high peak hour cycle times
• Fixed split plan selection used in most cases
• Link plans locked at times and not based on measured
flows
• Morning peak - Oats Street and Archer Street signals were
the cause of westbound congestion
• Evening peak - Francisco Street signals were the cause of
eastbound congestion
• Main road/ side road approach delays are not well
balanced
Orrong Road Qualitative Analysis
15
Option Testing Plan
Orrong Road Quantitative Analysis
Option Option Details
Option 1
Determine the optimal cycle time and refine SCATS data which will include
operating incremental split selection
Option 2 Stagger the pedestrian crossing on Wright and Oat Streets
Option 3
On the south approach of Francisco Place implement a left turn only with a u-
turn bay on Orrong Road. At Archer Street and Wright Street implement a lag
right turn. SCATS data refined.
Option 4 Testing of Oats Street under a double diamond overlap operation
Option 5
Ultimate test, as per Option 1 with further refinement to SCATS data and
coordination
16
Percentage Change in Total Corridor Delay
Orrong Road Quantitative Analysis
AM Midday PM Off-Peak Total
Option 1 -17.6% 25.8% 2.2% -7.0% -4.0%
Option 2 -2.4% 0.3% -7.8% 2.1% -3.7%
Option 3 -15.9% 2.4% 8.5% -7.8% -4.6%
Option 4 15.5% 8.0% 33.3% -2.5% 20.0%
Option 5 -16.8% 18.4% -13.2% -6.7% -10.0%
Equating this to annual delay cost to occupants, Option 5 would save
approximately $760,000 per year in lost time cost.
17
Carbon Emissions (grams)
Orrong Road Quantitative Analysis
AM Midday PM Off-Peak Total
Base 28,866 20,013 26,590 6,418 81,886
Option 1 26,786 20,953 27,641 6,038 81,419
Option 2 28,943 19,913 26,501 6,418 81,775
Option 3 27,273 19,776 28,161 6,044 81,255
Option 4 32,101 20,153 28,086 6,375 86,716
Option 5 27,546 20,484 26,614 6,092 80,736
18
Orrong Road Quantitative Analysis
00:00
01:00
02:00
03:00
04:00
05:00
06:00
07:00
08:00
09:00
10:00
0 500 1000 1500 2000 2500 3000 3500
TravelTimeSeconds
Distance (m)
Westbound Journey Times - AM Peak
Base
Option 1
Option 2
Option 3
Option 4
Option 5
00:00
01:00
02:00
03:00
04:00
05:00
06:00
07:00
08:00
09:00
0 500 1000 1500 2000 2500 3000 3500
TravelTimeSeconds
Distance (m)
Westbound Journey Times - PM Peak
Base
Option 1
Option 2
Option 3
Option 4
Option 5
19
Orrong Road Quantitative Analysis
00:00
01:00
02:00
03:00
04:00
05:00
06:00
07:00
08:00
0 500 1000 1500 2000 2500 3000 3500
TravelTimeSeconds
Distance (m)
Eastbound Journey Times - AM Peak
Base
Option 1
Option 2
Option 3
Option 4
Option 5
00:00
01:00
02:00
03:00
04:00
05:00
06:00
07:00
0 500 1000 1500 2000 2500 3000 3500
TravelTimeSeconds
Distance (m)
Eastbound Journey Times - PM Peak
Base
Option 1
Option 2
Option 3
Option 4
Option 5
20
• Option 5, widespread incremental split selection and
optimal cycle time with refinement, has the largest
improvement in terms of delay and average speed
• Option 1, 2, and 3 are considered to have performed
slightly better than the base model overall
• While improvement can be found through changes to the
SCATS signal settings, the current phasing setup can not
be further improved.
Orrong Road Quantitative Analysis Summary
21
Orrong Road Option 5 Implementation Results
22
SCATS Signals Summary
Stage One Analysis summary:
• Lower cycle times reduced the modelled delay
• Widespread incremental split selection assisted in balancing
modelled delay on all approaches
• Master-isolated as oppose to Flexi-link assisted modelled
performance
Stage One Broader summary:
• Some intersections are already running close to their optimal
operation
• The development of signal solutions should be done on a case
by case basis
• Alternative signal auditing procedures, such as the one used for
this study, were part of the broader recommendations for the
Main Roads WA Traffic Operations Centre (TOC).
23
SCATS Signals Optimisation
It is not just the signals fault!
24
Driver Inattention
25
The WA Space-Time Continuum
Image Courtesy of Google Earth.
26
Acknowledgements
RAC WA Policy and Research Team
- Anne Still, Senior Manager
- Una Mehta, Senior Traffic Engineer
- Sarah Cutter, Senior Transport Planner
ATS – Bill Sissons
Main Roads WA TOC and Road Network Operations team
Aurecon – Steve Cotton, Peer Reviewer
27
Thank You

Antony johnstone m_v2

  • 1.
    RAC WA Signals Efficiency Presentation NationalAITPM Conference Adelaide, SA 14 August 2014
  • 2.
    2 The study lookedat the Main Roads WA signal refinement processes to and examined to subject sites to determine/ identify the following: • What signalised intersection treatments are currently utilised • What signal improvements could be achieved • Considerations and requirements for refining SCATS signal settings • Signal refinement methodologies • Performance measures and evaluation of signal timing performance • Main Roads WA signal refinement policy, management, planning, and resources Testing the use of an alternative method for optimising traffic signals, modelling with SCATS, to squeeze more from existing infrastructure. Project Introduction
  • 3.
    3 Why do thisstudy? The dream:
  • 4.
    4 Why do thisstudy? The reality:
  • 5.
    5 What is SCATS? SydneyCoordinated Adaptive Traffic System • SCATS monitors traffic volumes in real-time and coordinates traffic signals. • It adjusts the coordination and green time of signals depending on the traffic volumes detected on each approach. • Approximately 900 signalised SCATS intersections in WA
  • 6.
    6 What is SCATS? ImageCourtesy of Google Street View.
  • 7.
    7 Qualitative Commentary • Informationgathered from the Main Roads WA workshops and other sources • High level overview of the SCATS signal settings Quantitative Commentary • Micro-simulation models built with SCATS signal control • Several options tested • Morning, Midday, Evening, and Off peak periods modelled • On-site implementation and evaluation of AM and PM periods Many subject sites were considered but two were selected for testing: • Orrong Road Corridor • Tonkin Highway/ Kelvin Road intersection Project Methodology
  • 8.
    8 Tonkin Road/ KelvinRoad Site Description
  • 9.
    9 Option Testing Plan TonkinRoad/ Kelvin Road Quantitative Analysis Option Option Details Option 1 Adjust SCATS signal settings including Master-isolated operation and optimal cycle time Option 2 Test under a Double diamond overlap phasing Option 3 Double right turn on Tonkin Highway north approach and localised additional lane flaring on the Tonkin Highway south approach Option 4 Ultimate test, adjustment of the SCATS signal settings including Master-isolated operation, optimal cycle time, and test under a Double diamond overlap phasing
  • 10.
    10 Percentage Change inTotal Intersection Delay Tonkin Road/ Kelvin Road Quantitative Analysis AM Midday PM Off-Peak Total Option 1 -5.4% -22.2% 5.7% -4.1% -2.5% Option 2 -10.8% -16.9% -5.8% -22.9% -9.6% Option 3 -57.9% -10.1% -13.0% -0.5% -35.5% Option 4 -34.3% -30.5% -16.2% -24.3% -26.8%
  • 11.
    11 Carbon Emissions (grams) TonkinRoad/ Kelvin Road Quantitative Analysis AM Midday PM Off-Peak Total Base 6,986 4,597 8,949 1,397 21,927 Option 1 7,638 4,570 9,793 1,362 23,362 Option 2 7,644 4,593 9,752 1,270 23,259 Option 3 6,559 4,229 8,552 1,321 20,662 Option 4 7,796 4,290 8,653 1,264 22,003
  • 12.
  • 13.
  • 14.
    14 • Moderately highpeak hour cycle times • Fixed split plan selection used in most cases • Link plans locked at times and not based on measured flows • Morning peak - Oats Street and Archer Street signals were the cause of westbound congestion • Evening peak - Francisco Street signals were the cause of eastbound congestion • Main road/ side road approach delays are not well balanced Orrong Road Qualitative Analysis
  • 15.
    15 Option Testing Plan OrrongRoad Quantitative Analysis Option Option Details Option 1 Determine the optimal cycle time and refine SCATS data which will include operating incremental split selection Option 2 Stagger the pedestrian crossing on Wright and Oat Streets Option 3 On the south approach of Francisco Place implement a left turn only with a u- turn bay on Orrong Road. At Archer Street and Wright Street implement a lag right turn. SCATS data refined. Option 4 Testing of Oats Street under a double diamond overlap operation Option 5 Ultimate test, as per Option 1 with further refinement to SCATS data and coordination
  • 16.
    16 Percentage Change inTotal Corridor Delay Orrong Road Quantitative Analysis AM Midday PM Off-Peak Total Option 1 -17.6% 25.8% 2.2% -7.0% -4.0% Option 2 -2.4% 0.3% -7.8% 2.1% -3.7% Option 3 -15.9% 2.4% 8.5% -7.8% -4.6% Option 4 15.5% 8.0% 33.3% -2.5% 20.0% Option 5 -16.8% 18.4% -13.2% -6.7% -10.0% Equating this to annual delay cost to occupants, Option 5 would save approximately $760,000 per year in lost time cost.
  • 17.
    17 Carbon Emissions (grams) OrrongRoad Quantitative Analysis AM Midday PM Off-Peak Total Base 28,866 20,013 26,590 6,418 81,886 Option 1 26,786 20,953 27,641 6,038 81,419 Option 2 28,943 19,913 26,501 6,418 81,775 Option 3 27,273 19,776 28,161 6,044 81,255 Option 4 32,101 20,153 28,086 6,375 86,716 Option 5 27,546 20,484 26,614 6,092 80,736
  • 18.
    18 Orrong Road QuantitativeAnalysis 00:00 01:00 02:00 03:00 04:00 05:00 06:00 07:00 08:00 09:00 10:00 0 500 1000 1500 2000 2500 3000 3500 TravelTimeSeconds Distance (m) Westbound Journey Times - AM Peak Base Option 1 Option 2 Option 3 Option 4 Option 5 00:00 01:00 02:00 03:00 04:00 05:00 06:00 07:00 08:00 09:00 0 500 1000 1500 2000 2500 3000 3500 TravelTimeSeconds Distance (m) Westbound Journey Times - PM Peak Base Option 1 Option 2 Option 3 Option 4 Option 5
  • 19.
    19 Orrong Road QuantitativeAnalysis 00:00 01:00 02:00 03:00 04:00 05:00 06:00 07:00 08:00 0 500 1000 1500 2000 2500 3000 3500 TravelTimeSeconds Distance (m) Eastbound Journey Times - AM Peak Base Option 1 Option 2 Option 3 Option 4 Option 5 00:00 01:00 02:00 03:00 04:00 05:00 06:00 07:00 0 500 1000 1500 2000 2500 3000 3500 TravelTimeSeconds Distance (m) Eastbound Journey Times - PM Peak Base Option 1 Option 2 Option 3 Option 4 Option 5
  • 20.
    20 • Option 5,widespread incremental split selection and optimal cycle time with refinement, has the largest improvement in terms of delay and average speed • Option 1, 2, and 3 are considered to have performed slightly better than the base model overall • While improvement can be found through changes to the SCATS signal settings, the current phasing setup can not be further improved. Orrong Road Quantitative Analysis Summary
  • 21.
    21 Orrong Road Option5 Implementation Results
  • 22.
    22 SCATS Signals Summary StageOne Analysis summary: • Lower cycle times reduced the modelled delay • Widespread incremental split selection assisted in balancing modelled delay on all approaches • Master-isolated as oppose to Flexi-link assisted modelled performance Stage One Broader summary: • Some intersections are already running close to their optimal operation • The development of signal solutions should be done on a case by case basis • Alternative signal auditing procedures, such as the one used for this study, were part of the broader recommendations for the Main Roads WA Traffic Operations Centre (TOC).
  • 23.
    23 SCATS Signals Optimisation Itis not just the signals fault!
  • 24.
  • 25.
    25 The WA Space-TimeContinuum Image Courtesy of Google Earth.
  • 26.
    26 Acknowledgements RAC WA Policyand Research Team - Anne Still, Senior Manager - Una Mehta, Senior Traffic Engineer - Sarah Cutter, Senior Transport Planner ATS – Bill Sissons Main Roads WA TOC and Road Network Operations team Aurecon – Steve Cotton, Peer Reviewer
  • 27.