Download to read offline


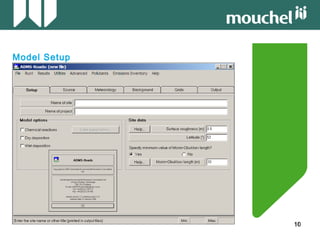
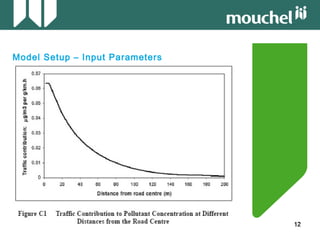

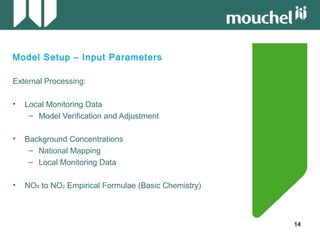

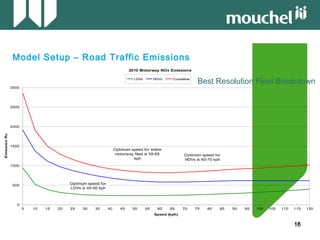

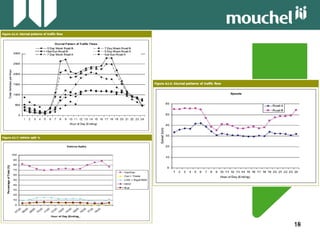


This document provides an overview of air quality modelling. It discusses key guidance documents, defining the modelling domain by identifying affected roads and receptors, model setup including input parameters like emissions factors and traffic data, and model verification through comparing predictions to monitoring data to improve the model. The goal is to use better inputs to produce better outputs from the dispersion model and accurately assess air quality impacts.


