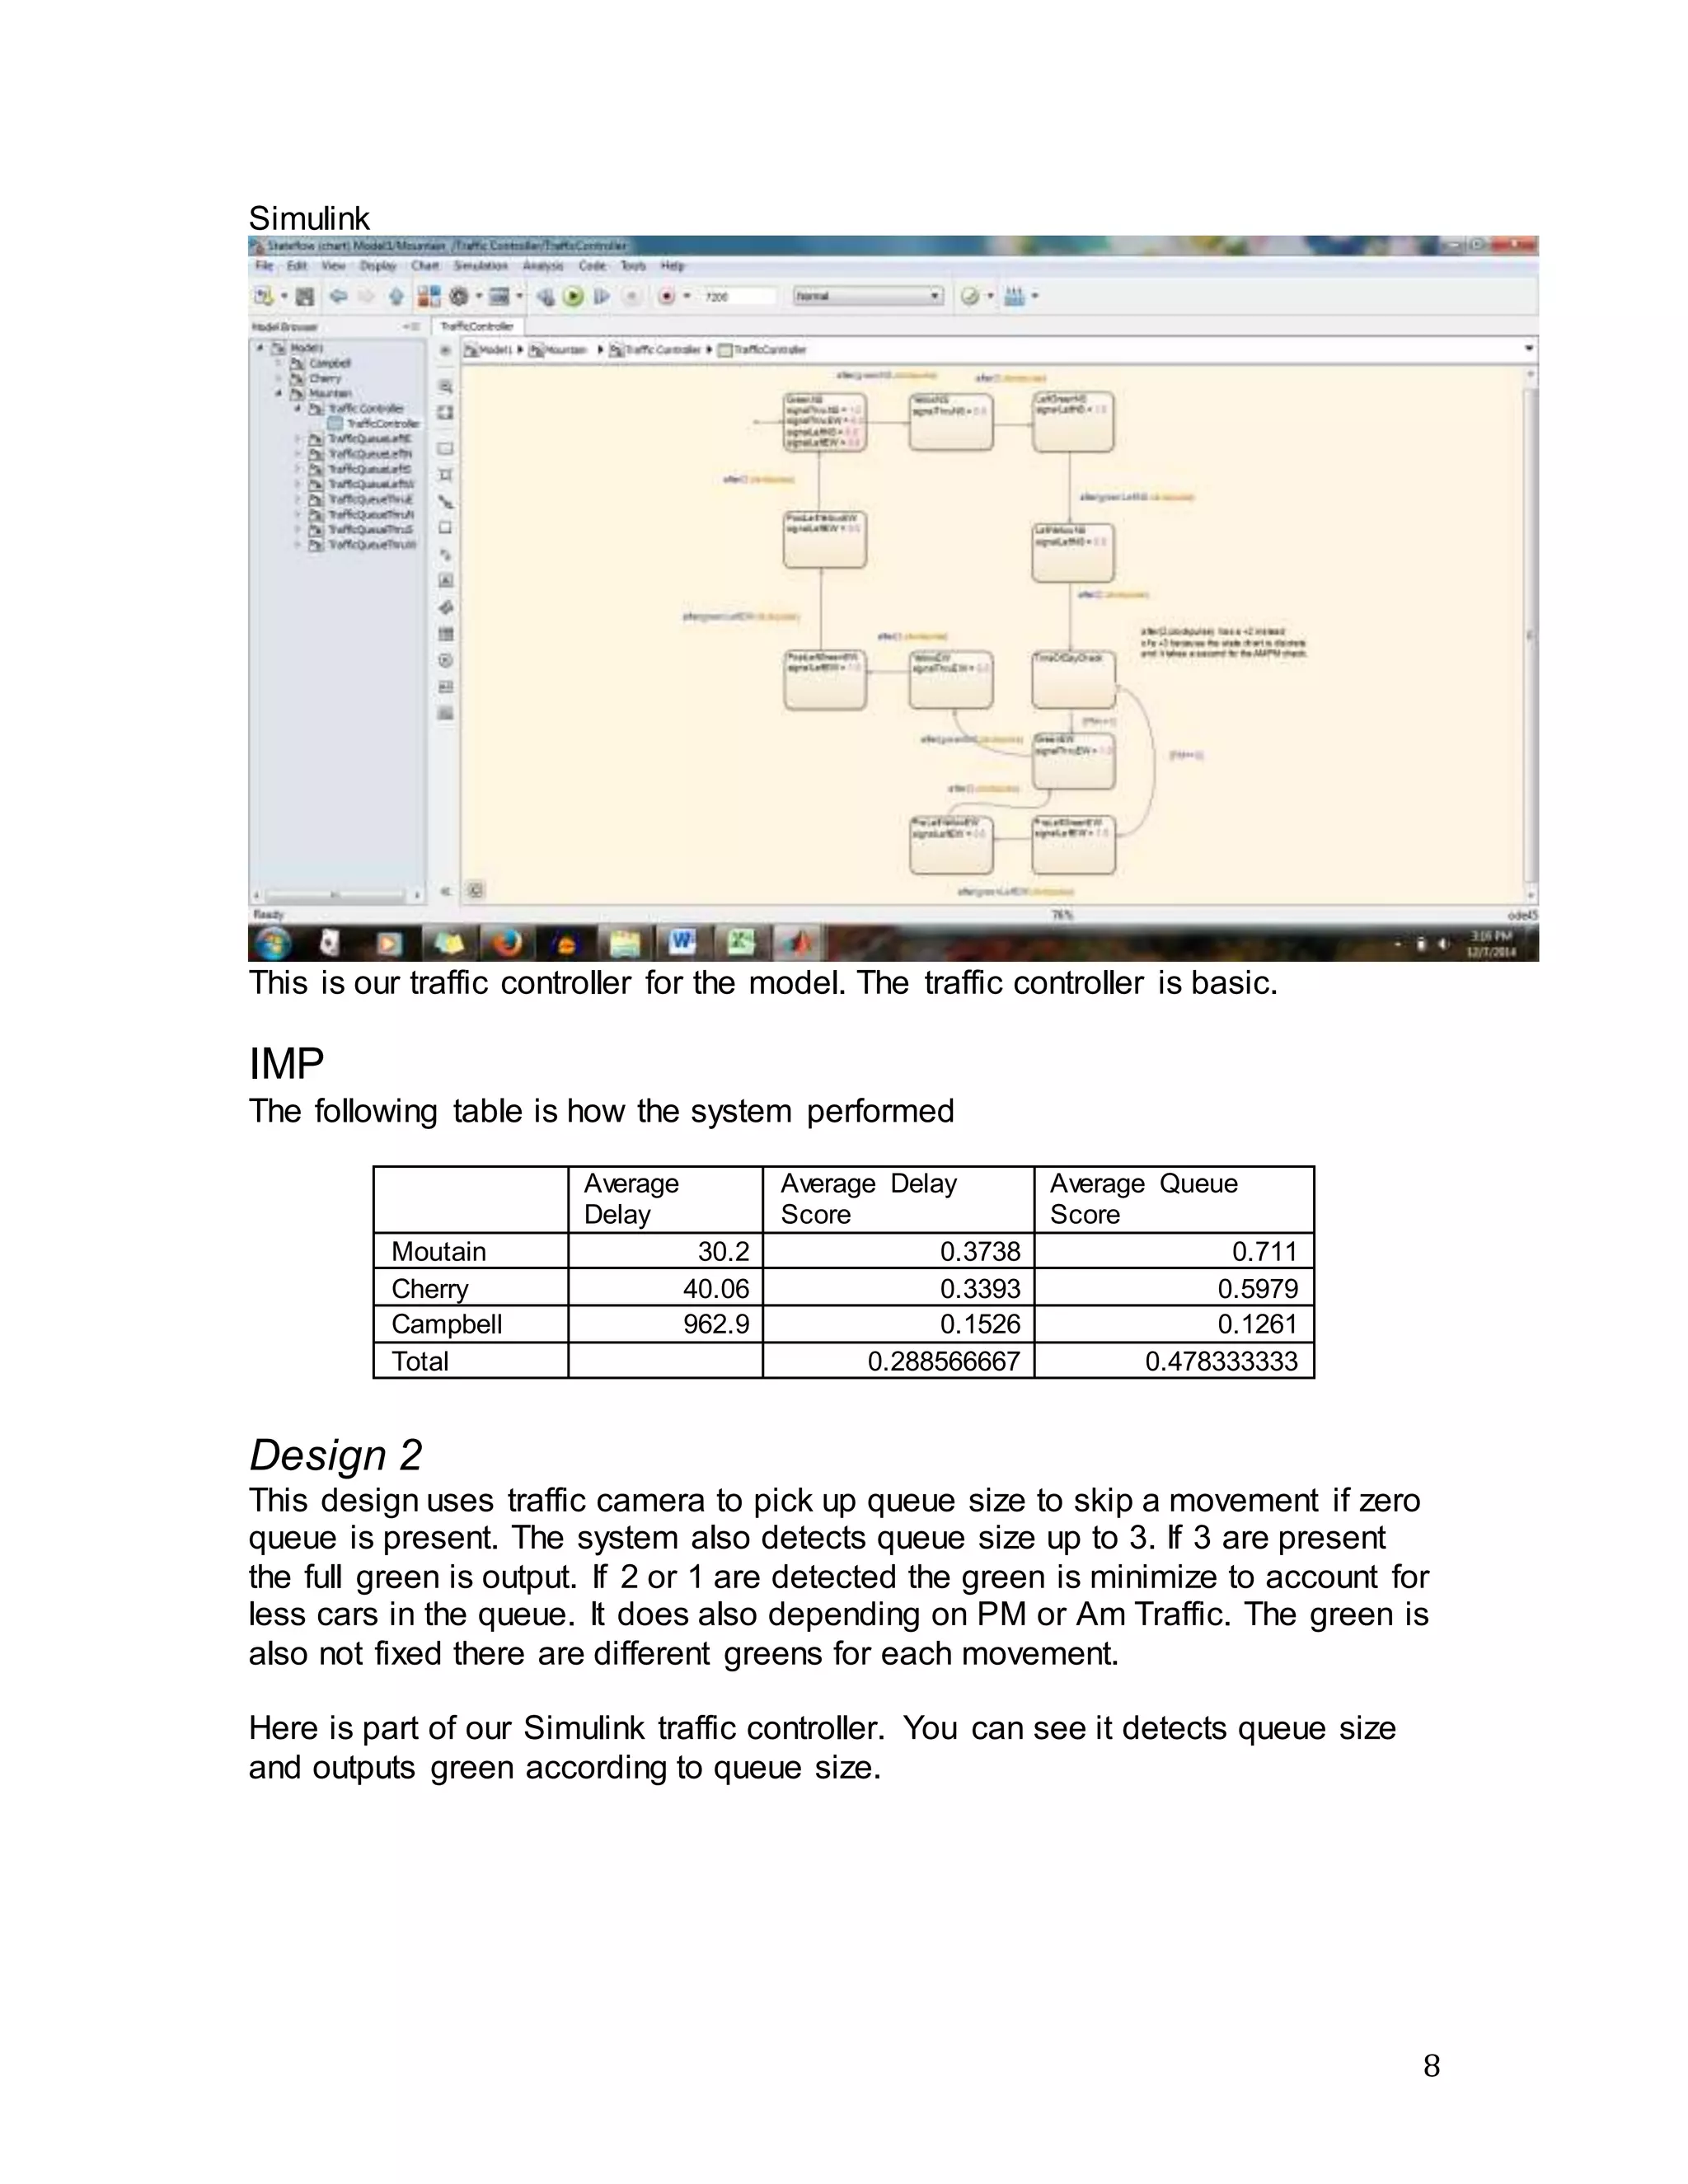
1
SIE 250
Project Final Report
Group 18
Traffic Signal System Design
Project.
Jordan Lo
Qisong Xiao
Terry Fuller
Mohammad Rabata
Adan O Bracamontes
December 10, 2014
2
Traffic Signal System: Concept of Operations
Contents
 1.0 Purpose of the Document……………………………………………………………………..3
 2.0 Scope of the Project……………………………………………………………………………...3
 3.0 Referenced Documents………………………………………………………………………...3
 4.0 Background…………………………………………………………………………………………4
 5.0 Concept for the Proposed System…………………………………………………………4
o Case Study
o General Design
 Design 1
 Design 2
 Design 3
 6.0 User-Oriented Operational Description
o Stakeholders
 7.0 Operational Needs
 8.0 System Overview
 9.0 Operational Environment
 10.0 Support Environment
 11.0 Operational Scenarios
 12.0 Operational Impact
 System Requirements
o 1.0 Input and Output Functional Requirements
o 2.0 Technology Requirements
o 3.0 Input and Output Performance Requirements
o 4.0 Utilization of Resources Requirements
o 5.0 Trade-Off Requirements
o 6.0 System Test Plan
 System Designs
 System Model
 Systems Engineering Management Plan
o Team Members
o Team Dynamics
 Roles
 Scribe
 Meetings
3
Concept of Operations
1.0 Purpose of the Document
The purpose is to optimize the performance of a traffic signal control. The
system model is designed around minimizing the total cost and optimizing the input
and output functionality of the model. By integrating technology and user processes
to the traffic signal model, the following goals will be accomplished:
 Minimize delay between phases within the system.
 Minimize the total cost of the system.
 Increase the life span longevity of the system; goal is fifteen years
2.0 Scope of the Project
The scope is intended to focus on Speedway Blvd. with major intersections at
Mountain, Cherry, and Campbell Avenue. These three intersections are adjacent to
each other on the north side of the University of Arizona.
3.0 Referenced Documents
All of the referenced documents are available on SIE 250 FA14 001 910 D2L page.
 SIE 250 Traffic Signal System Design Project.pdf
 Traffic Model Data
o Traffic Technology Costs
o simpletrafficmodel.slx
o Campbell.xls
o Cherry.xls
o Euclid.xls
o Mountain.xls
o Park.xls
 Optimal Green Times
o ideal.Delay.4Phase.xls
4
4.0 Background
The city of Tucson is looking for a system design that will help save costs
maintaining their traffic signal model without sacrificing the overall performance of
the system. The main interest is Speedway Blvd. with points at Campbell, Cherry,
and Mountain Avenue. This area of interest is highly concentrated with traffic, as it
is North of the University of Arizona and South of the University Medical Center.
5.0 Concept for the Proposed System
The proposed design is based on the current traffic model for Speedway
Blvd. and the three intersections on Cherry, Mountain, and Campbell, with different
timing and different weather conditions.
Design 1: Basic
This particular design features a basic traffic model presented at a low cost.
Constructed around time-based traffic, this model does not include any sensors for
its components.
Design 2: Camera
This design utilizes a camera to detect queue size up to 3 and only output full
green if 3 cars are detected.
Design 3: Wire Loop
This design uses wire loop to detect if a car is present in the queue if not car
is present skip that movement.
6.0 User-Oriented Operational Description
Stakeholders
 University of Arizona
 University of Arizona Systems and Industrial Engineering Department
 Arizona Department of Transportation
 City of Tucson
 Tucson Electrical Power
5
 Comcast Internet
7.0 Operational Needs
Control Center manages each intersection to maintain its service and
technology. Power source is needed to provide the necessary electricity for the
system to be fully operational. An open feed such as direct and wireless sensors and
transmitters are required to send and receive signals to communicate between
personnel and mechanical hardware.
8.0 System Overview
9.0 Operational Environment
The traffic system has the ability to operate in any intersection that has the
capability to interoperate with video or control loop technology.
10.0 Support Environment
If any problems persist, we encourage reaching out to our 24/7 technical
support desk that can be made available by phone, email, or chat. Our service desk
can brief upon current traffic events and reports or simply answer any general
questions.
11.0 Operational Scenarios
Use Case:
ID: 1
Brief Description:
Primary Actor:
Secondary Actors:
Pre-Condition:
6
Main Flow:
Post-Condition:
Alternative Flow:
12.0 Operational Impact
We have complete confidence that our model will deliver a more optimized
flow of traffic, while focusing primarily on minimizing the time it takes at the
intersections of Cherry, Mountain, and Campbell Avenue. The lesser amount of time
that it takes to travel through either one of these intersections, the greater traffic
efficiency will be. This can benefit Tucson’s fuel economy as well as its carbon
footprint. Without sacrificing the safety of our drivers, our system guarantees that
there will be a reduction of vehicle accidents, due to our innovating phase clearance.
This gives the driver enough time and ability to safely proceed in and out of the
intersection. There is a great deal of impact that this traffic model bring to the city
of Tucson and most importantly to its people.
System Requirements
1.0 Input and Output Functional Requirements
1.1 TSS allow a theoretical flow rate of 1,800 vehicles per hour per lane.
1.2 TSS assume a four second yellow light clearance.
1.3 TSS assume a two second all-red clearance.
1.4 TSS shall be functional 24 hours a day, seven days a week.
1.5 TSS use a base system that can be fitted for different equipment.
1.6 TSS switch time modes (AM to PM; PM to AM).
1.7 TSS accept inputs.
1.8 TSS generate output readouts.
2.0 Technology Requirements
2.1 TSS have a fixed-signal for green lights.
7
2.2 TSS have video controllers and sensors.
2.3 TSS have control loops
2.4 TSS monitor current and previous traffic activity.
2.5 TSS be monitored from the control center.
3.0 Input and Output Performance Requirements
3.1 TSS be judged on its ability to collect data in real time.
3.2 TSS maintain traffic flow in real time.
3.3 TSS perform in any weather conditions.
3.4 TSS judge the traffic phases.
3.5 TSS be judged on Mean Time Between Failures (MTBF).
4.0 Utilization of Resources Requirements
4.1 TSS be judged based on setup costs.
4.2 TSS be judged basedon maintainability cost.
4.3 TSS be judged based on operational cost.
4.4 TSS be judged based on reliability of its components.
5.0 Trade-Off Requirements
5.1 TSS be weighed 0.6 for delay and 0.4 for queue size.
5.2 TSS weigh UMP and IMP equally: 0.5IMP+0.5UMP.
6.0 System Test Plan
6.1 TSS validate and verify application architecture requirements.
6.2 TSS validate and verify application business requirements.
6.1 TSS be tested for 180 days after its installation.
System Designs
Design 1
This a basic traffic signals with a fixed green for all movements, with optimal
green.
8
Simulink
This is our traffic controller for the model. The traffic controller is basic.
IMP
The following table is how the system performed
Average
Delay
Average Delay
Score
Average Queue
Score
Moutain 30.2 0.3738 0.711
Cherry 40.06 0.3393 0.5979
Campbell 962.9 0.1526 0.1261
Total 0.288566667 0.478333333
Design 2
This design uses traffic camera to pick up queue size to skip a movement if zero
queue is present. The system also detects queue size up to 3. If 3 are present
the full green is output. If 2 or 1 are detected the green is minimize to account for
less cars in the queue. It does also depending on PM or Am Traffic. The green is
also not fixed there are different greens for each movement.
Here is part of our Simulink traffic controller. You can see it detects queue size
and outputs green according to queue size.
9
IMP
Average
Delay
Average Delay
Score
Average Queue
Score
Moutain 20.87 0.5944 0.7574
Cherry 26.68 0.4664 0.7023
Campbell 899.7 0.2576 0.2712
Total 0.439466667 0.576966667
Design 3
This design uses wired loop to detect if there is a car present in the queue if not it
skips that movement. The green is also not fixed there are different greens for
each movement.
Here is part of our Simulink model
10
IMP
Average
Delay
Average Delay
Score
Average Queue
Score
Moutain 21.34 0.5817 0.7515
Cherry 25.52 0.4802 0.7669
Campbell 761.7 0.237 0.268
Total 0.432966667 0.595466667
Design Recommendation
Model 1 Model 2 Model 3
Average score 0.1764 0.4989 0.433
Average Queue 0.479 0.577 0.5955
over60/40 0.29744 0.53014 0.498
Through our trade-off analysis we can see that model had the best overall score.
Therefore we recommend design two using traffic cameras to detected queue
size.
11
Team Summary
Team Members
Jordan Lo
Terry Fuller
Adan O Bracamontes
Mohammad Rabata
Qisong Xiao
Team Meetings
November 14th, 2014 11:00am – 11:50am, In-class meeting
 Started Traffic Model
 Started Concept of Operations
 Started report
Attended: Jordan, Terry, Adan, Mohammad, Qisong
November 18th, 2014 4:15pm – 7:30pm, Main Library
 System model progress
 Begun Traffic Model PowerPoint
 Started Design Recommendation
Attended: Jordan, Terry, Adan, Mohammad, Qisong
November 21st, 2014 11:00am – 11:50am, In-class meeting
 In-class meeting
 System model progress
 Design Recommendation progress
Attended: Jordan, Terry, Adan, Mohammad, Qisong
12
November 25th, 2014 6:30pm – 7:45pm, Main Library
 System model completed
 Design Recommendation completed
 Prepared In-Class presentation
 Report progress
Attended: Jordan, Terry, Adan, Mohammad, Qisong
November 26th, 2014 11:00am – 11:50am, In-class meeting
 Presented Traffic System PowerPoint to the class
Attended: Jordan, Terry, Adan, Mohammad, Qisong
December 8th, 2014 6:00pm – 8:00pm, Science and Engineering Library
 Concept of Operations completed
 Report progress
 Team Meeting progress
Attended: Jordan, Terry, Adan, Mohammad, Qisong
December 9th, 2014 8:00pm – 10:00pm, Science and Engineering Library
 Report completed
 Team Meeting completed
Attended: Jordan, Terry, Adan, Mohammad, Qisong

SIE 250 Final Report

  • 1.
    1 SIE 250 Project FinalReport Group 18 Traffic Signal System Design Project. Jordan Lo Qisong Xiao Terry Fuller Mohammad Rabata Adan O Bracamontes December 10, 2014
  • 2.
    2 Traffic Signal System:Concept of Operations Contents  1.0 Purpose of the Document……………………………………………………………………..3  2.0 Scope of the Project……………………………………………………………………………...3  3.0 Referenced Documents………………………………………………………………………...3  4.0 Background…………………………………………………………………………………………4  5.0 Concept for the Proposed System…………………………………………………………4 o Case Study o General Design  Design 1  Design 2  Design 3  6.0 User-Oriented Operational Description o Stakeholders  7.0 Operational Needs  8.0 System Overview  9.0 Operational Environment  10.0 Support Environment  11.0 Operational Scenarios  12.0 Operational Impact  System Requirements o 1.0 Input and Output Functional Requirements o 2.0 Technology Requirements o 3.0 Input and Output Performance Requirements o 4.0 Utilization of Resources Requirements o 5.0 Trade-Off Requirements o 6.0 System Test Plan  System Designs  System Model  Systems Engineering Management Plan o Team Members o Team Dynamics  Roles  Scribe  Meetings
  • 3.
    3 Concept of Operations 1.0Purpose of the Document The purpose is to optimize the performance of a traffic signal control. The system model is designed around minimizing the total cost and optimizing the input and output functionality of the model. By integrating technology and user processes to the traffic signal model, the following goals will be accomplished:  Minimize delay between phases within the system.  Minimize the total cost of the system.  Increase the life span longevity of the system; goal is fifteen years 2.0 Scope of the Project The scope is intended to focus on Speedway Blvd. with major intersections at Mountain, Cherry, and Campbell Avenue. These three intersections are adjacent to each other on the north side of the University of Arizona. 3.0 Referenced Documents All of the referenced documents are available on SIE 250 FA14 001 910 D2L page.  SIE 250 Traffic Signal System Design Project.pdf  Traffic Model Data o Traffic Technology Costs o simpletrafficmodel.slx o Campbell.xls o Cherry.xls o Euclid.xls o Mountain.xls o Park.xls  Optimal Green Times o ideal.Delay.4Phase.xls
  • 4.
    4 4.0 Background The cityof Tucson is looking for a system design that will help save costs maintaining their traffic signal model without sacrificing the overall performance of the system. The main interest is Speedway Blvd. with points at Campbell, Cherry, and Mountain Avenue. This area of interest is highly concentrated with traffic, as it is North of the University of Arizona and South of the University Medical Center. 5.0 Concept for the Proposed System The proposed design is based on the current traffic model for Speedway Blvd. and the three intersections on Cherry, Mountain, and Campbell, with different timing and different weather conditions. Design 1: Basic This particular design features a basic traffic model presented at a low cost. Constructed around time-based traffic, this model does not include any sensors for its components. Design 2: Camera This design utilizes a camera to detect queue size up to 3 and only output full green if 3 cars are detected. Design 3: Wire Loop This design uses wire loop to detect if a car is present in the queue if not car is present skip that movement. 6.0 User-Oriented Operational Description Stakeholders  University of Arizona  University of Arizona Systems and Industrial Engineering Department  Arizona Department of Transportation  City of Tucson  Tucson Electrical Power
  • 5.
    5  Comcast Internet 7.0Operational Needs Control Center manages each intersection to maintain its service and technology. Power source is needed to provide the necessary electricity for the system to be fully operational. An open feed such as direct and wireless sensors and transmitters are required to send and receive signals to communicate between personnel and mechanical hardware. 8.0 System Overview 9.0 Operational Environment The traffic system has the ability to operate in any intersection that has the capability to interoperate with video or control loop technology. 10.0 Support Environment If any problems persist, we encourage reaching out to our 24/7 technical support desk that can be made available by phone, email, or chat. Our service desk can brief upon current traffic events and reports or simply answer any general questions. 11.0 Operational Scenarios Use Case: ID: 1 Brief Description: Primary Actor: Secondary Actors: Pre-Condition:
  • 6.
    6 Main Flow: Post-Condition: Alternative Flow: 12.0Operational Impact We have complete confidence that our model will deliver a more optimized flow of traffic, while focusing primarily on minimizing the time it takes at the intersections of Cherry, Mountain, and Campbell Avenue. The lesser amount of time that it takes to travel through either one of these intersections, the greater traffic efficiency will be. This can benefit Tucson’s fuel economy as well as its carbon footprint. Without sacrificing the safety of our drivers, our system guarantees that there will be a reduction of vehicle accidents, due to our innovating phase clearance. This gives the driver enough time and ability to safely proceed in and out of the intersection. There is a great deal of impact that this traffic model bring to the city of Tucson and most importantly to its people. System Requirements 1.0 Input and Output Functional Requirements 1.1 TSS allow a theoretical flow rate of 1,800 vehicles per hour per lane. 1.2 TSS assume a four second yellow light clearance. 1.3 TSS assume a two second all-red clearance. 1.4 TSS shall be functional 24 hours a day, seven days a week. 1.5 TSS use a base system that can be fitted for different equipment. 1.6 TSS switch time modes (AM to PM; PM to AM). 1.7 TSS accept inputs. 1.8 TSS generate output readouts. 2.0 Technology Requirements 2.1 TSS have a fixed-signal for green lights.
  • 7.
    7 2.2 TSS havevideo controllers and sensors. 2.3 TSS have control loops 2.4 TSS monitor current and previous traffic activity. 2.5 TSS be monitored from the control center. 3.0 Input and Output Performance Requirements 3.1 TSS be judged on its ability to collect data in real time. 3.2 TSS maintain traffic flow in real time. 3.3 TSS perform in any weather conditions. 3.4 TSS judge the traffic phases. 3.5 TSS be judged on Mean Time Between Failures (MTBF). 4.0 Utilization of Resources Requirements 4.1 TSS be judged based on setup costs. 4.2 TSS be judged basedon maintainability cost. 4.3 TSS be judged based on operational cost. 4.4 TSS be judged based on reliability of its components. 5.0 Trade-Off Requirements 5.1 TSS be weighed 0.6 for delay and 0.4 for queue size. 5.2 TSS weigh UMP and IMP equally: 0.5IMP+0.5UMP. 6.0 System Test Plan 6.1 TSS validate and verify application architecture requirements. 6.2 TSS validate and verify application business requirements. 6.1 TSS be tested for 180 days after its installation. System Designs Design 1 This a basic traffic signals with a fixed green for all movements, with optimal green.
  • 8.
    8 Simulink This is ourtraffic controller for the model. The traffic controller is basic. IMP The following table is how the system performed Average Delay Average Delay Score Average Queue Score Moutain 30.2 0.3738 0.711 Cherry 40.06 0.3393 0.5979 Campbell 962.9 0.1526 0.1261 Total 0.288566667 0.478333333 Design 2 This design uses traffic camera to pick up queue size to skip a movement if zero queue is present. The system also detects queue size up to 3. If 3 are present the full green is output. If 2 or 1 are detected the green is minimize to account for less cars in the queue. It does also depending on PM or Am Traffic. The green is also not fixed there are different greens for each movement. Here is part of our Simulink traffic controller. You can see it detects queue size and outputs green according to queue size.
  • 9.
    9 IMP Average Delay Average Delay Score Average Queue Score Moutain20.87 0.5944 0.7574 Cherry 26.68 0.4664 0.7023 Campbell 899.7 0.2576 0.2712 Total 0.439466667 0.576966667 Design 3 This design uses wired loop to detect if there is a car present in the queue if not it skips that movement. The green is also not fixed there are different greens for each movement. Here is part of our Simulink model
  • 10.
    10 IMP Average Delay Average Delay Score Average Queue Score Moutain21.34 0.5817 0.7515 Cherry 25.52 0.4802 0.7669 Campbell 761.7 0.237 0.268 Total 0.432966667 0.595466667 Design Recommendation Model 1 Model 2 Model 3 Average score 0.1764 0.4989 0.433 Average Queue 0.479 0.577 0.5955 over60/40 0.29744 0.53014 0.498 Through our trade-off analysis we can see that model had the best overall score. Therefore we recommend design two using traffic cameras to detected queue size.
  • 11.
    11 Team Summary Team Members JordanLo Terry Fuller Adan O Bracamontes Mohammad Rabata Qisong Xiao Team Meetings November 14th, 2014 11:00am – 11:50am, In-class meeting  Started Traffic Model  Started Concept of Operations  Started report Attended: Jordan, Terry, Adan, Mohammad, Qisong November 18th, 2014 4:15pm – 7:30pm, Main Library  System model progress  Begun Traffic Model PowerPoint  Started Design Recommendation Attended: Jordan, Terry, Adan, Mohammad, Qisong November 21st, 2014 11:00am – 11:50am, In-class meeting  In-class meeting  System model progress  Design Recommendation progress Attended: Jordan, Terry, Adan, Mohammad, Qisong
  • 12.
    12 November 25th, 20146:30pm – 7:45pm, Main Library  System model completed  Design Recommendation completed  Prepared In-Class presentation  Report progress Attended: Jordan, Terry, Adan, Mohammad, Qisong November 26th, 2014 11:00am – 11:50am, In-class meeting  Presented Traffic System PowerPoint to the class Attended: Jordan, Terry, Adan, Mohammad, Qisong December 8th, 2014 6:00pm – 8:00pm, Science and Engineering Library  Concept of Operations completed  Report progress  Team Meeting progress Attended: Jordan, Terry, Adan, Mohammad, Qisong December 9th, 2014 8:00pm – 10:00pm, Science and Engineering Library  Report completed  Team Meeting completed Attended: Jordan, Terry, Adan, Mohammad, Qisong