Download as PDF, PPTX
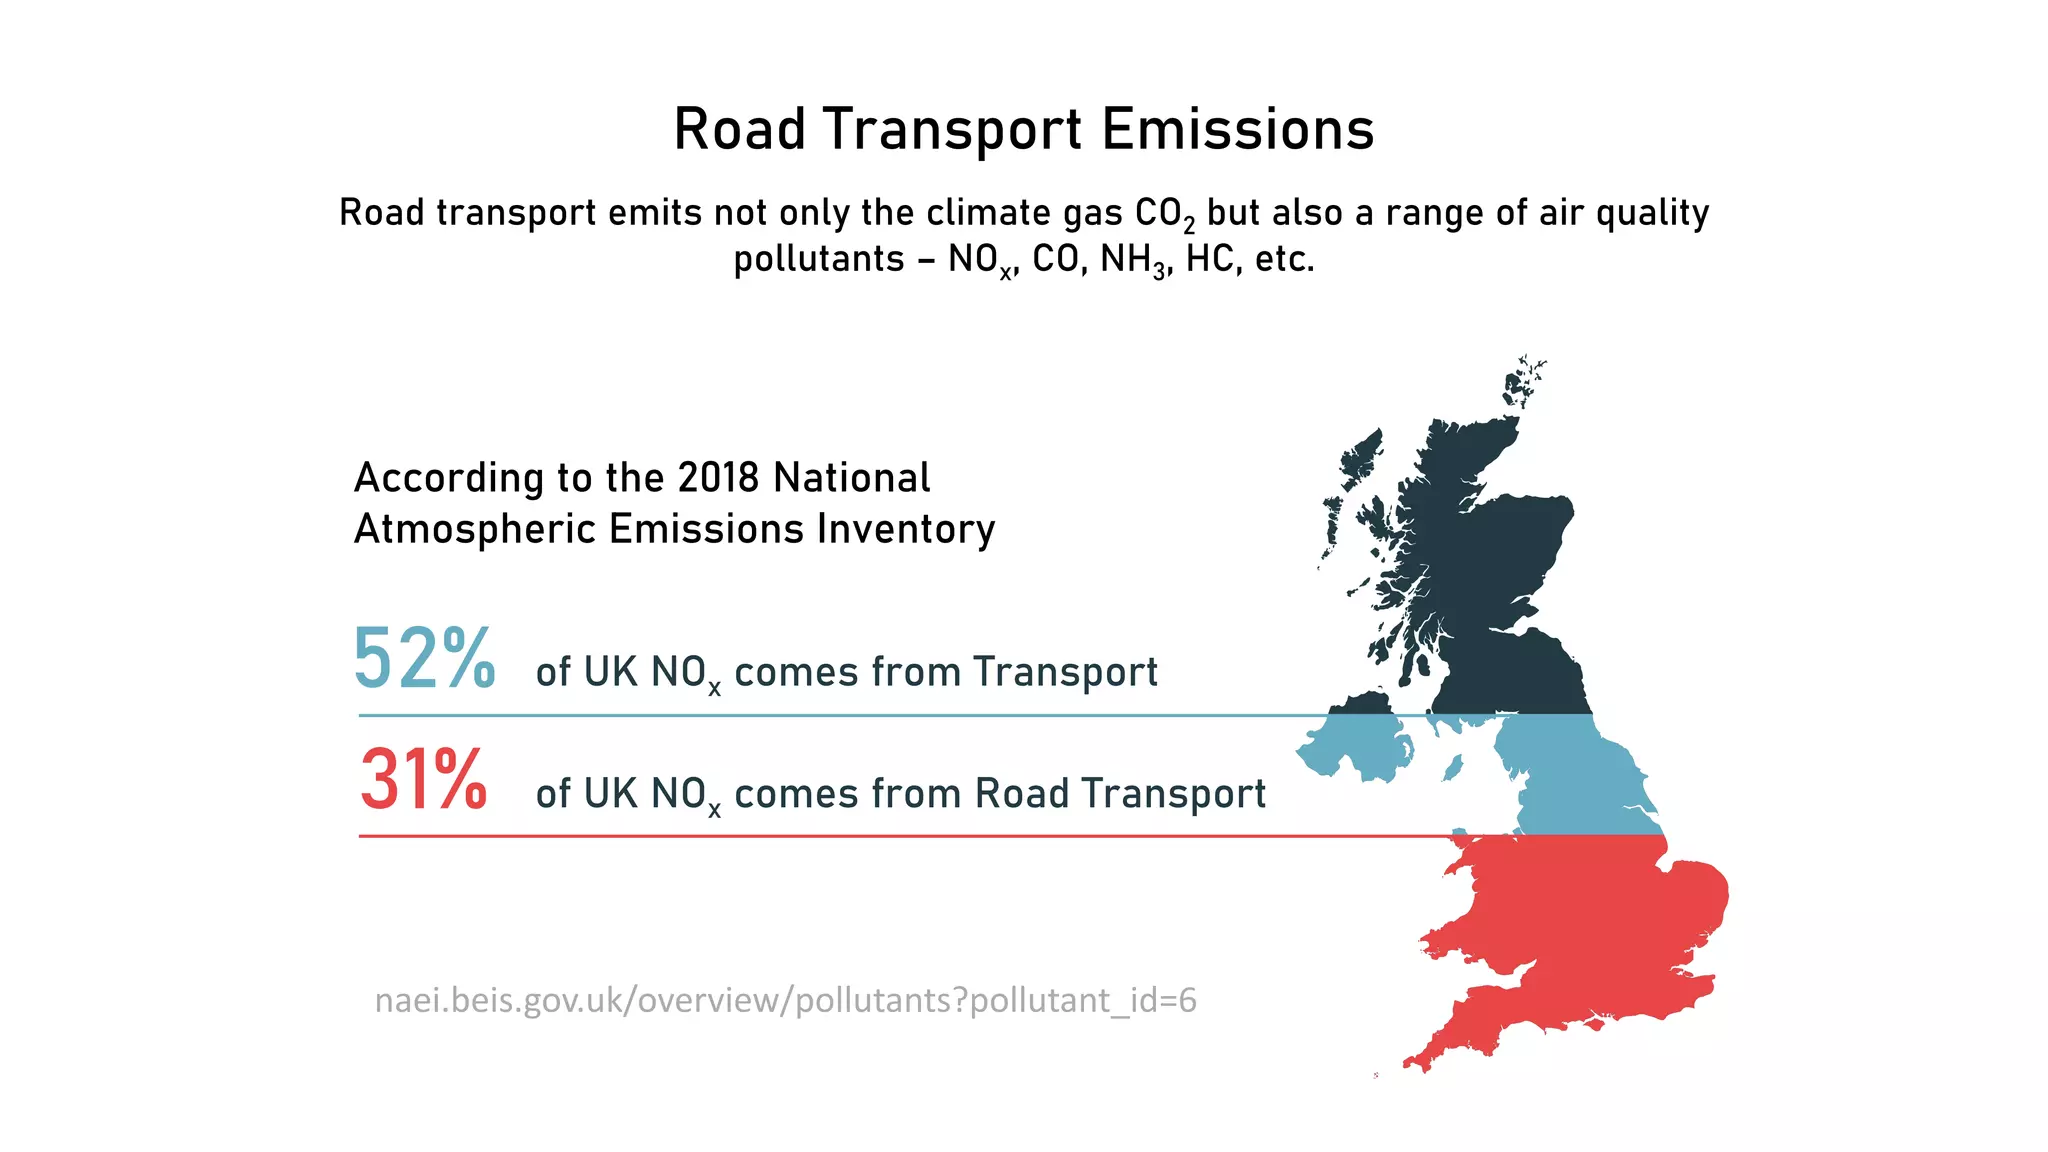
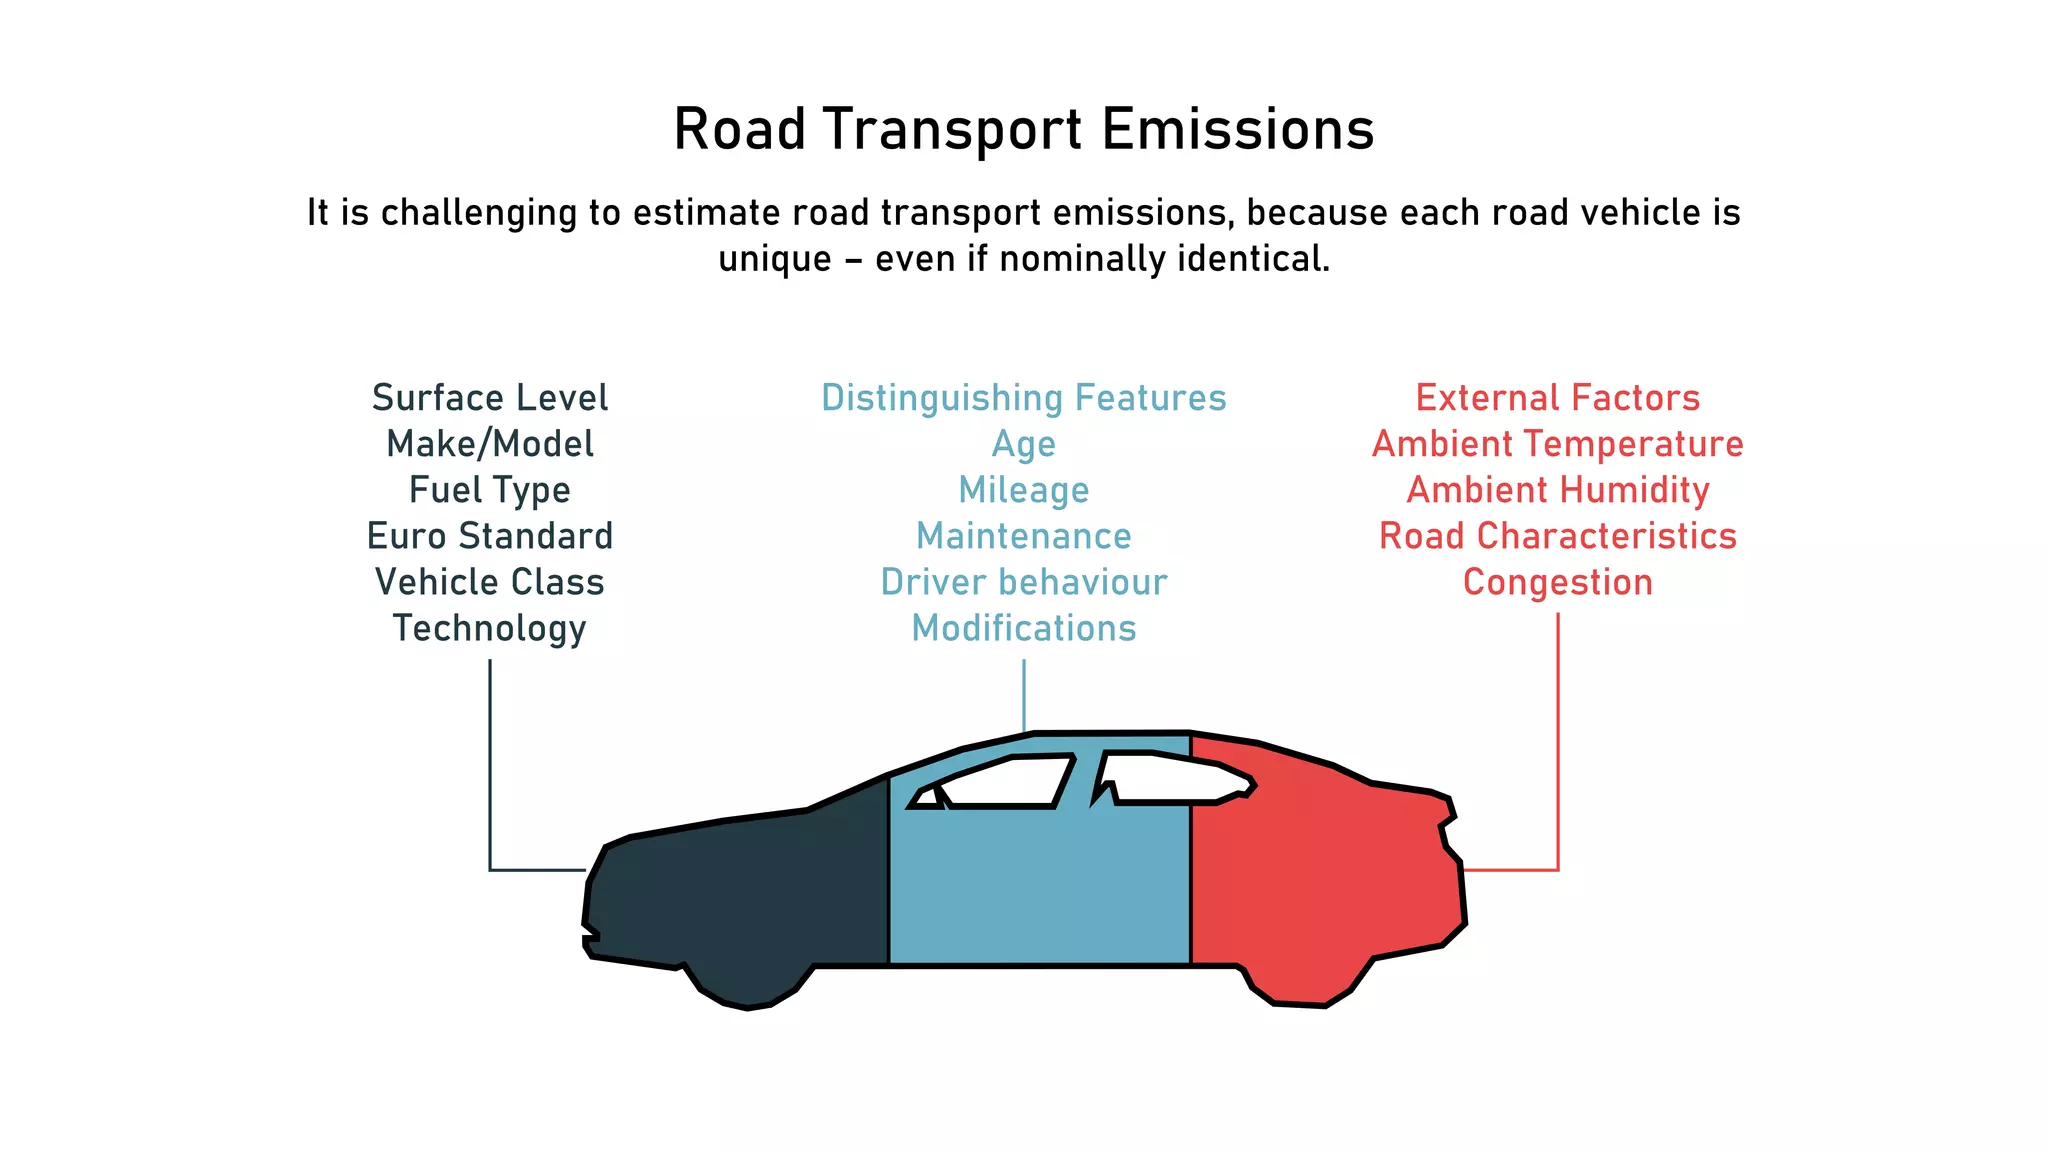
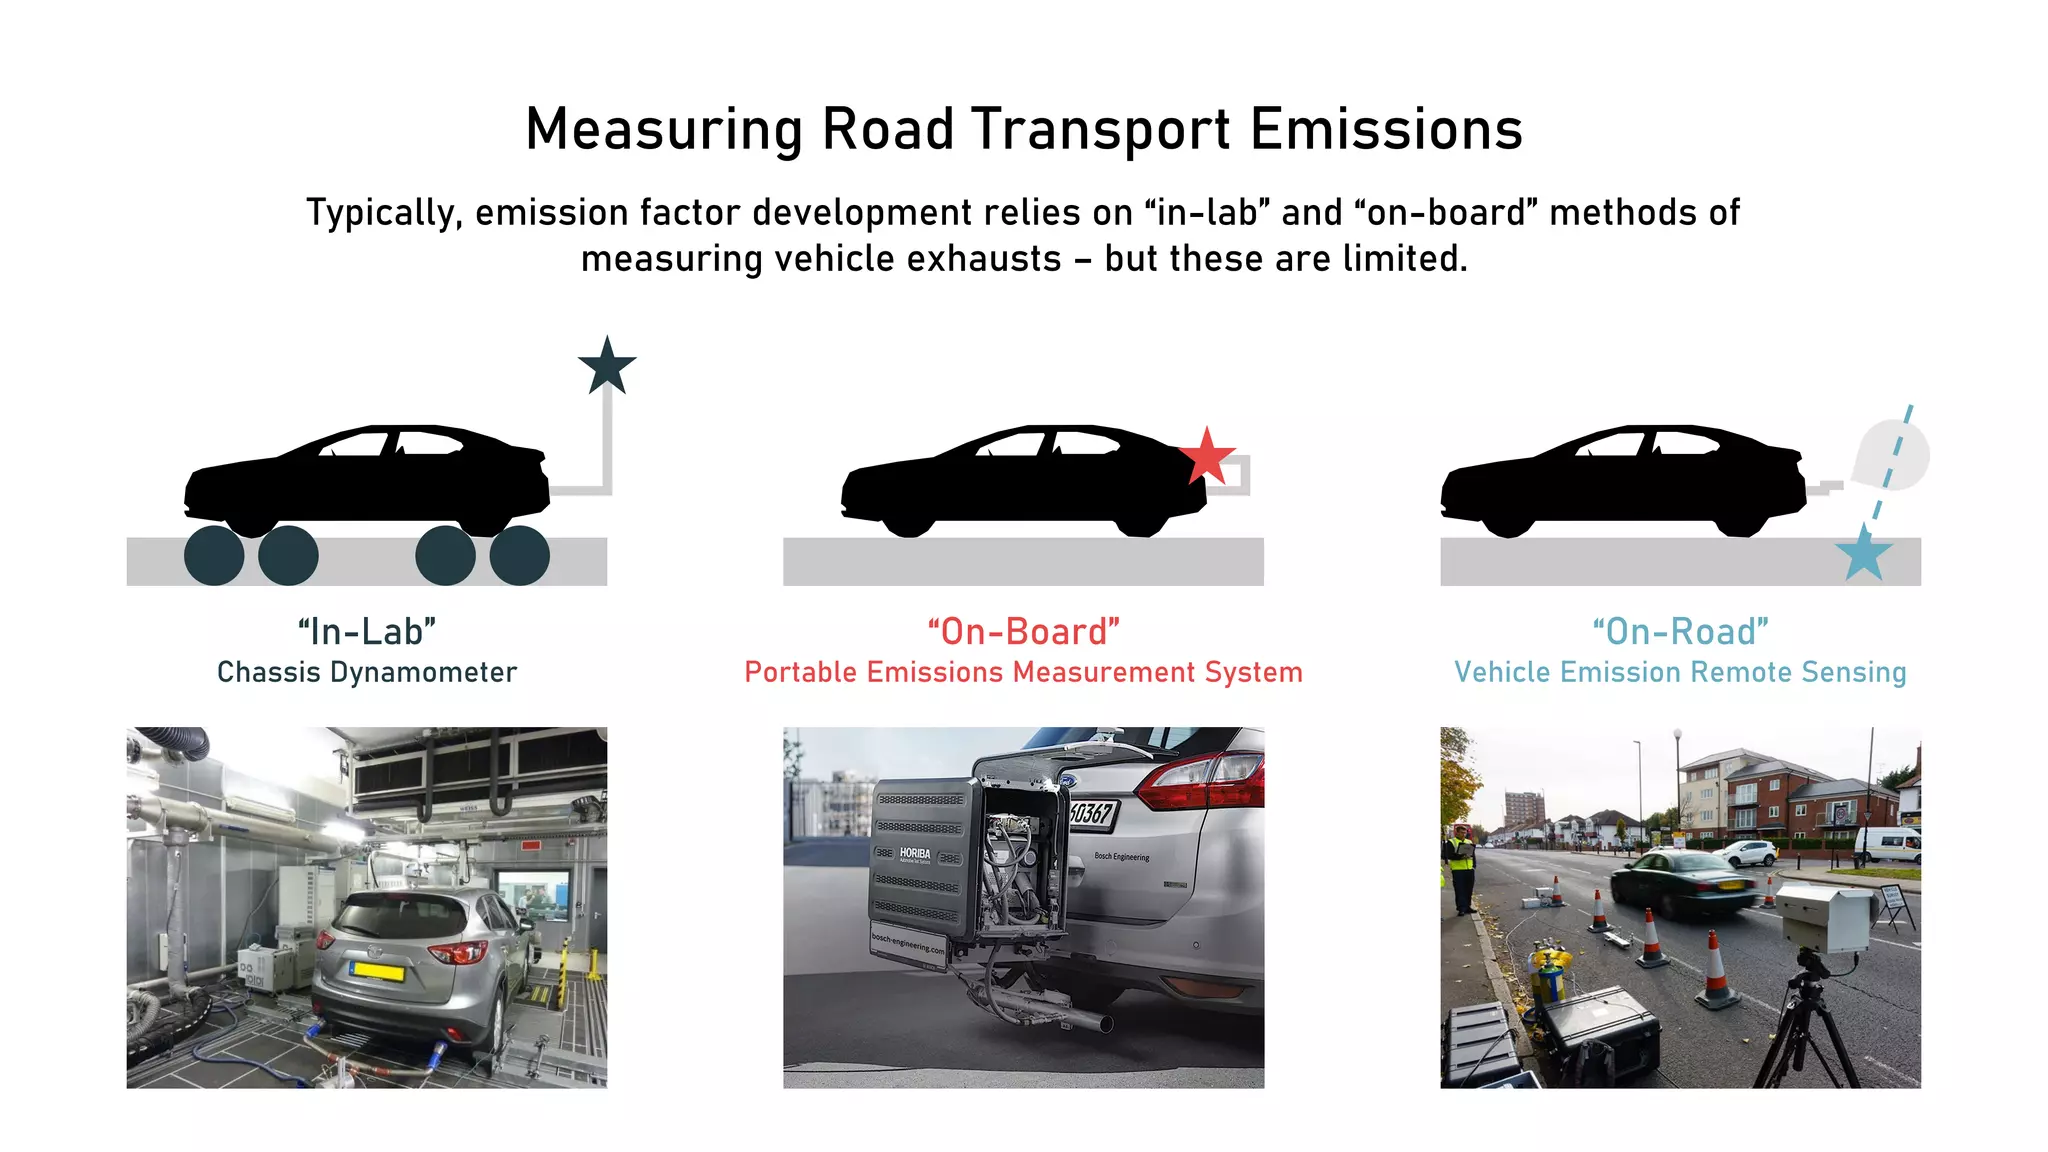
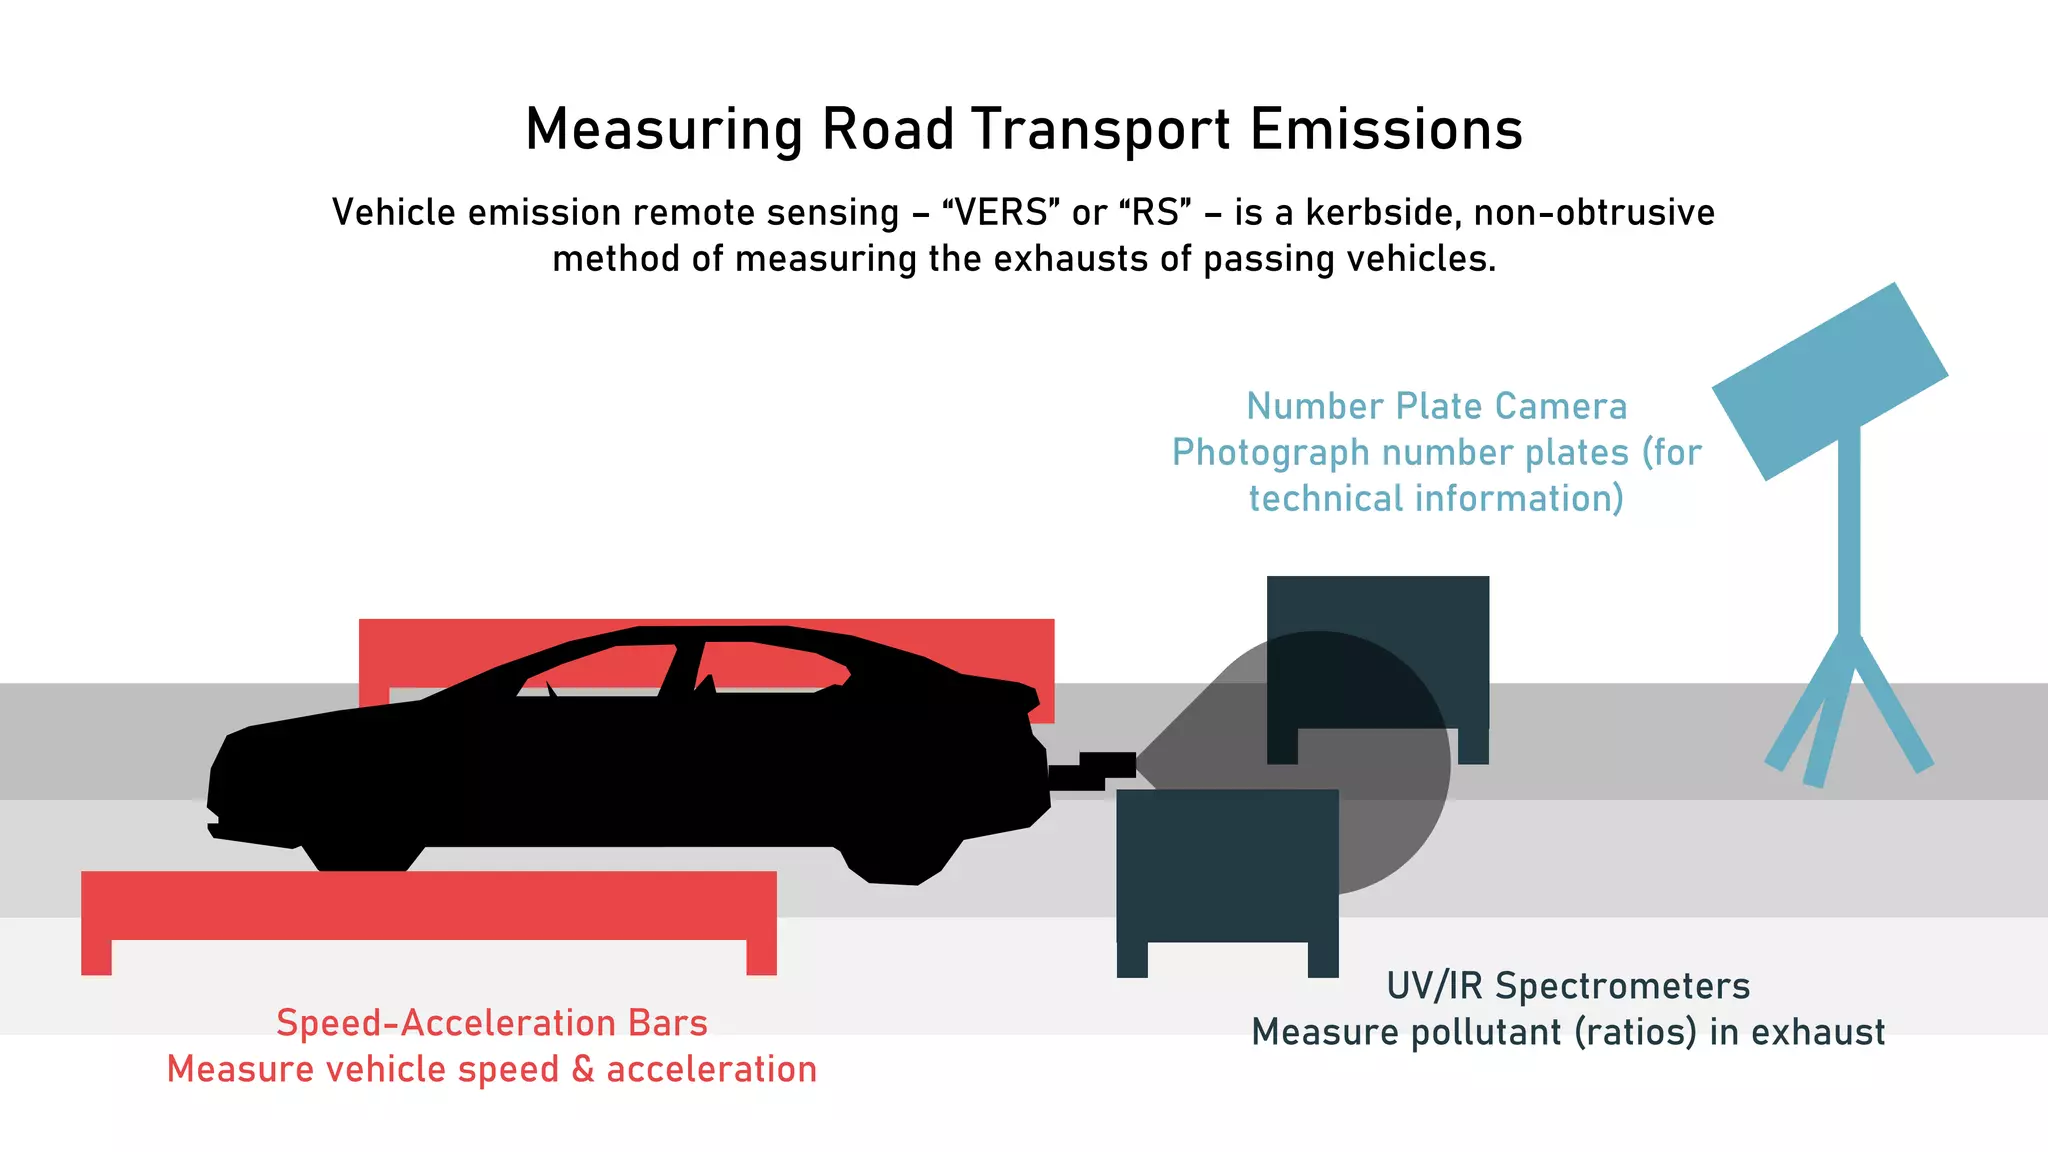
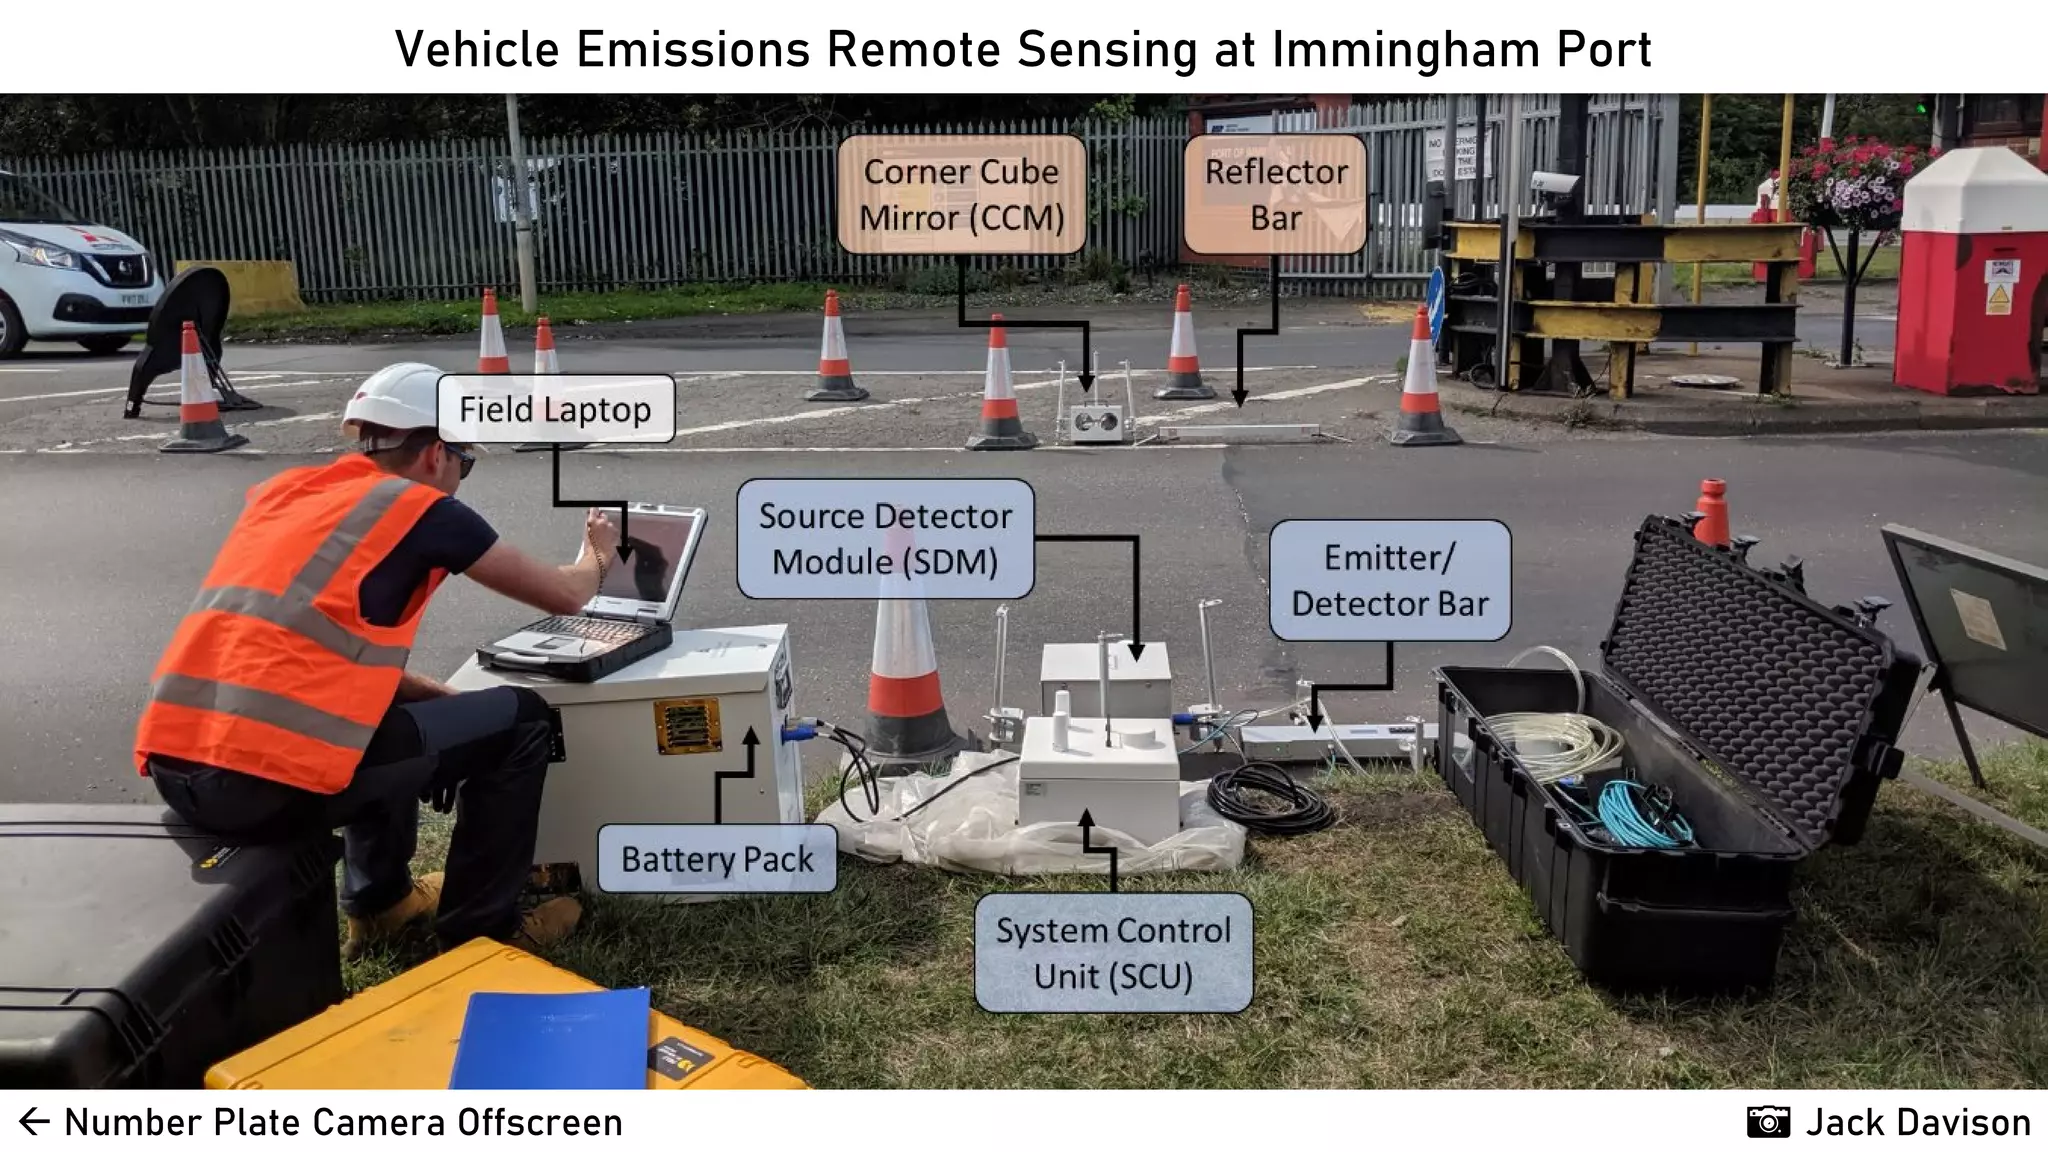
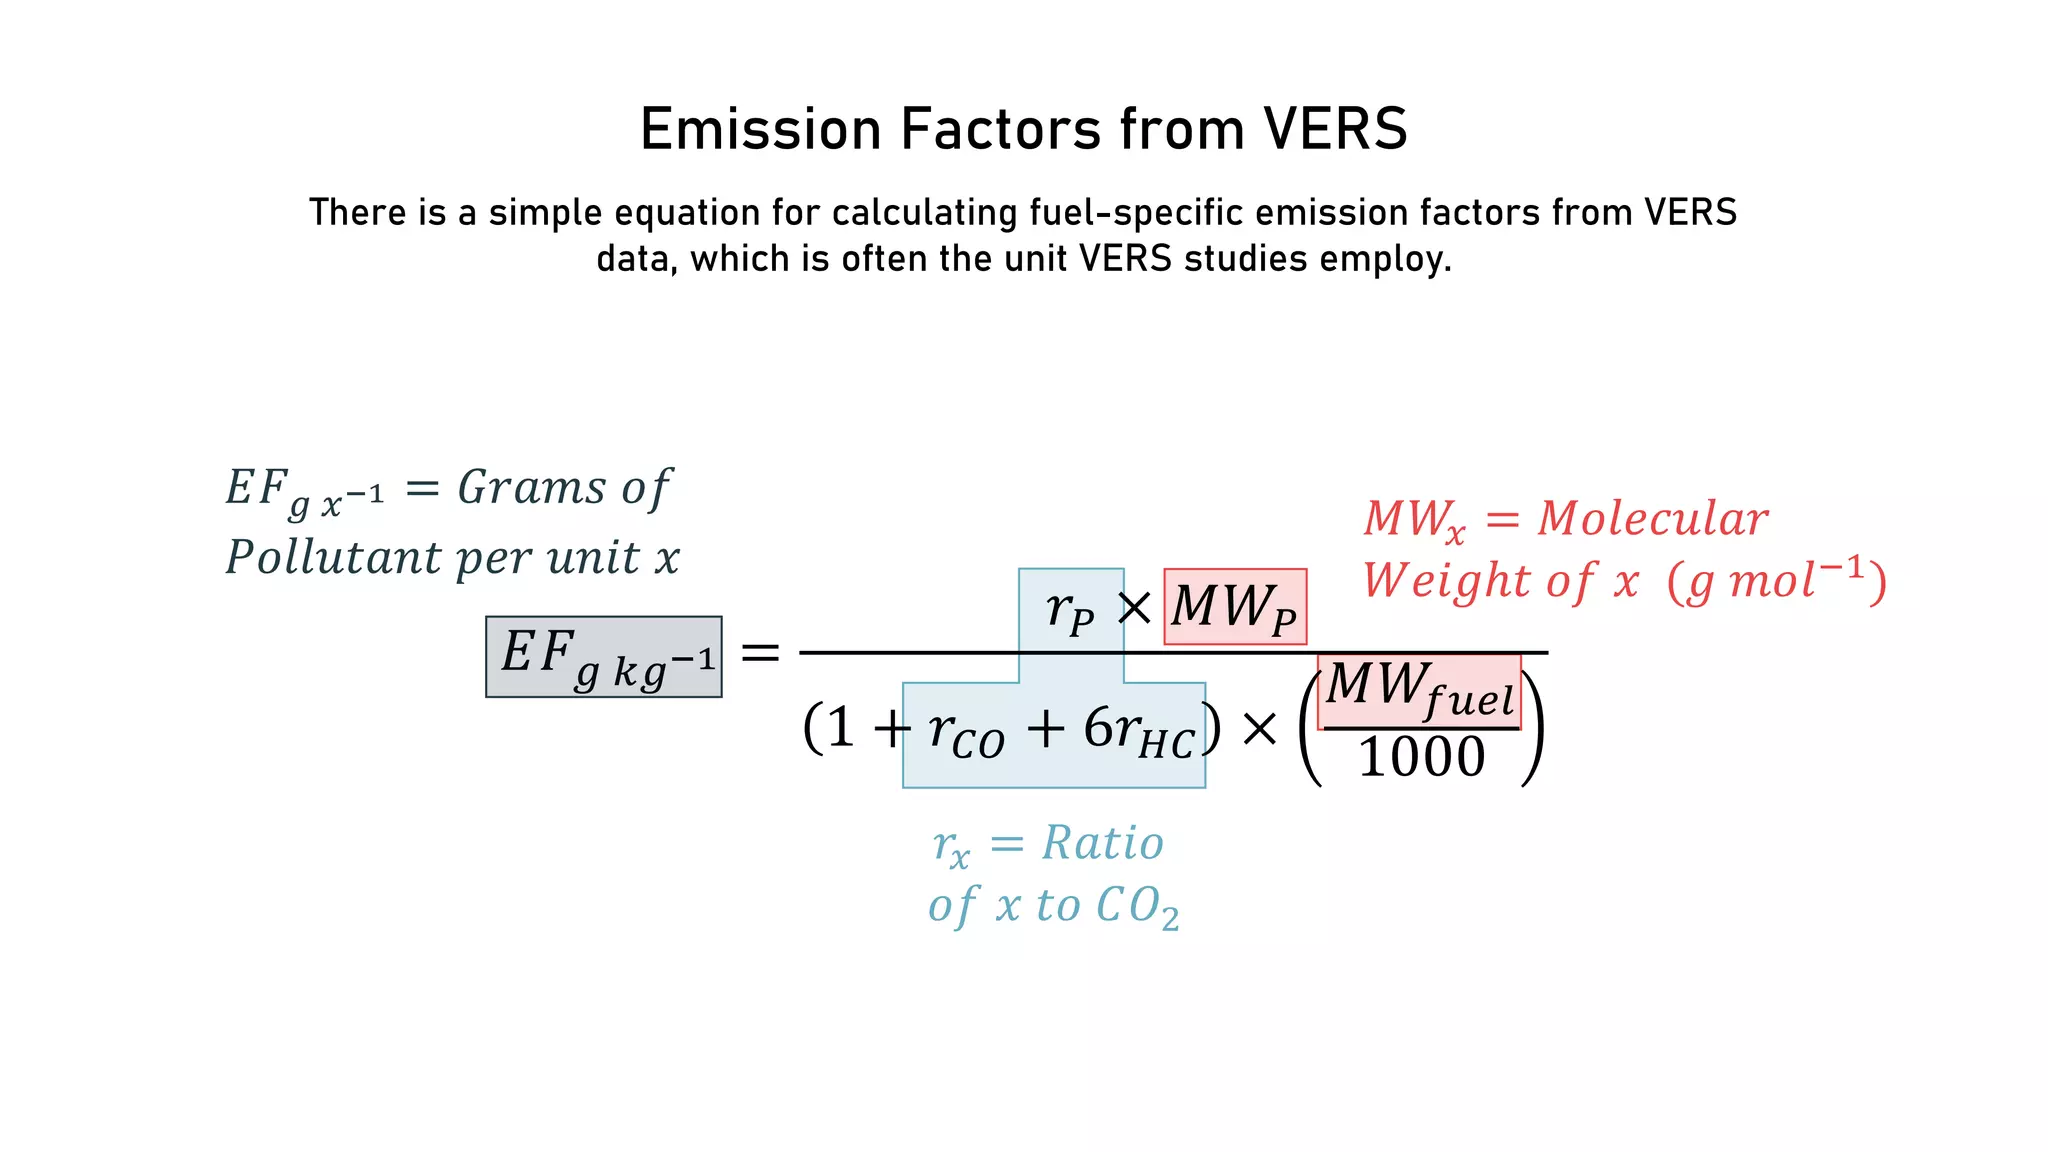
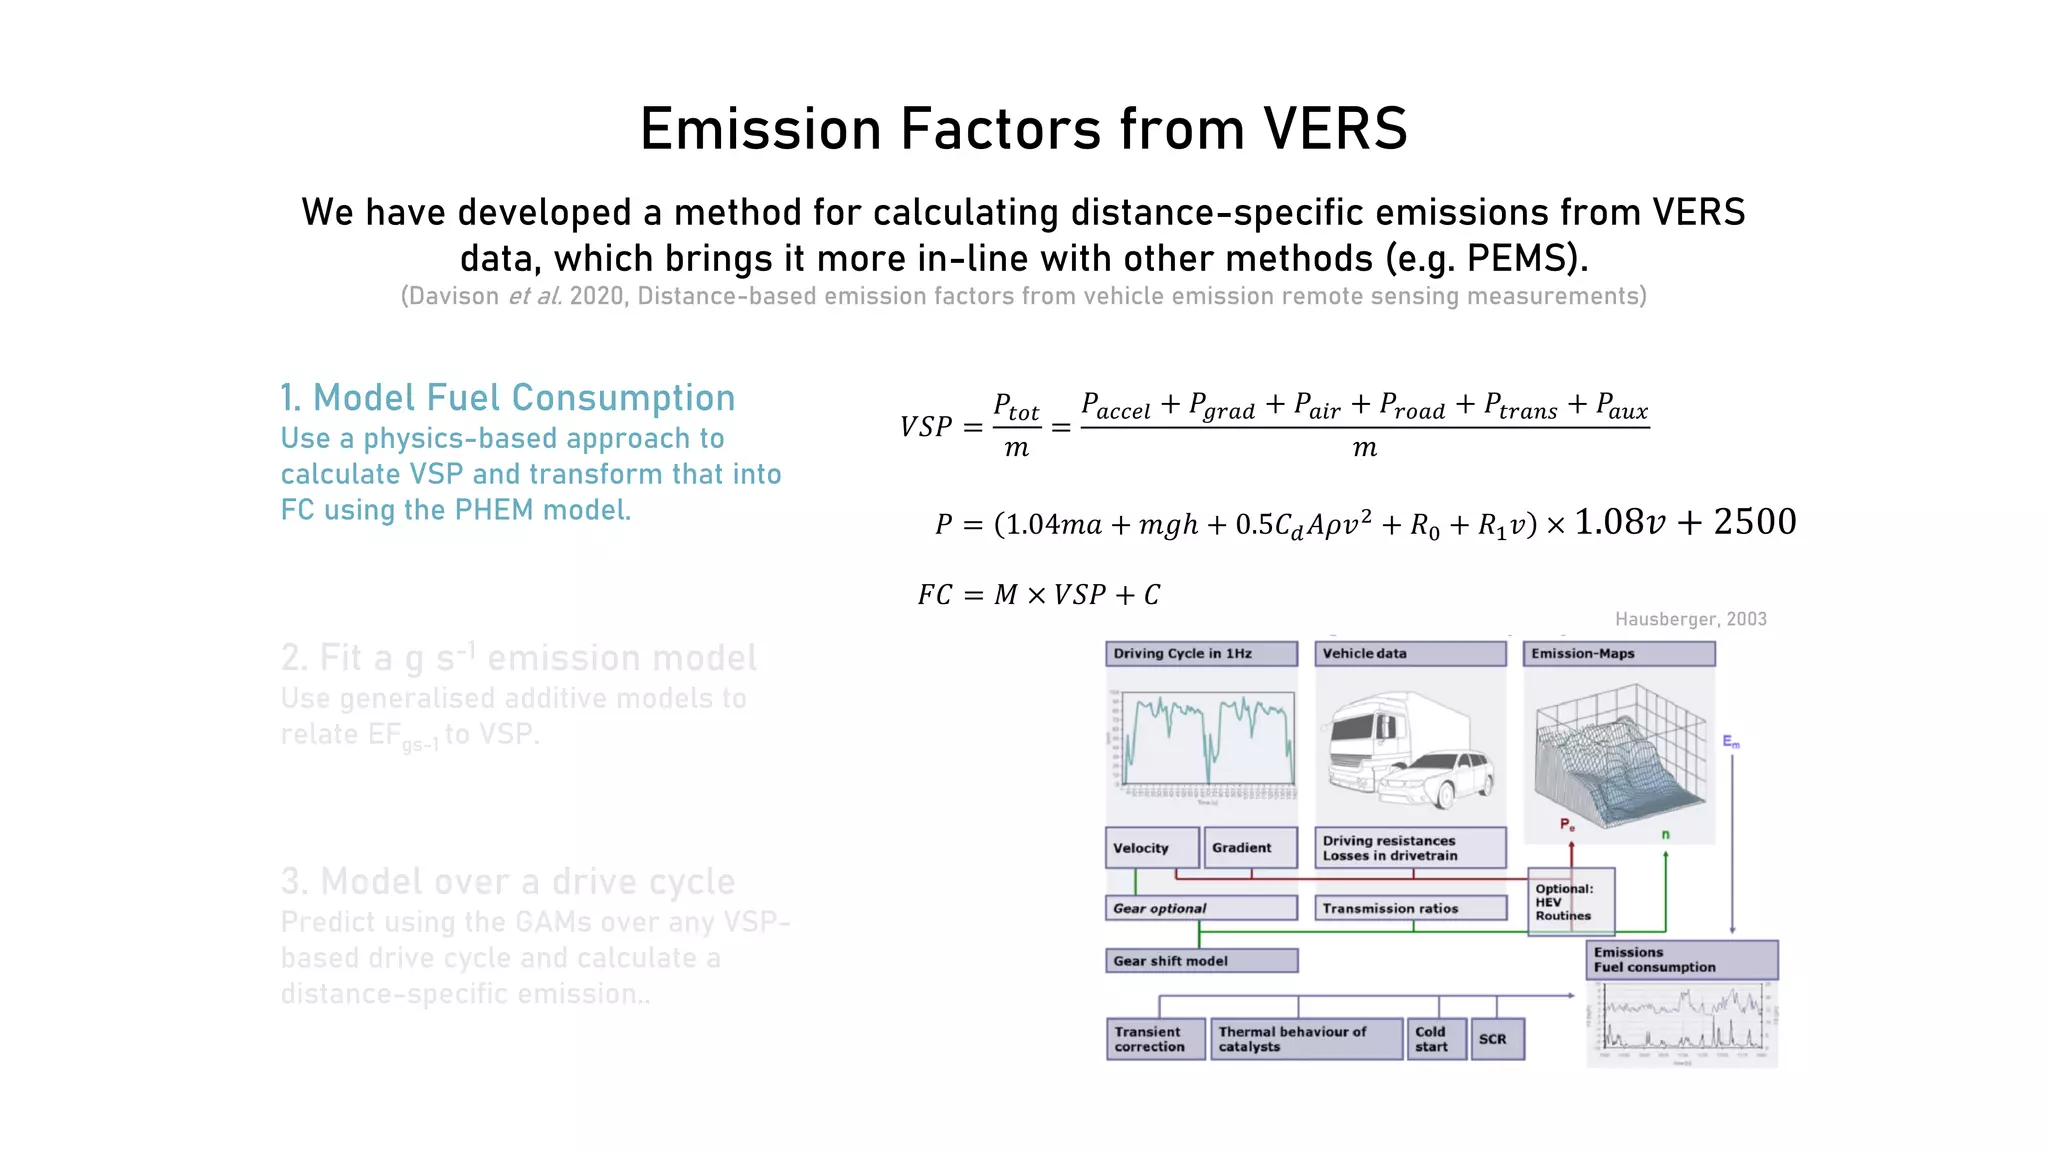
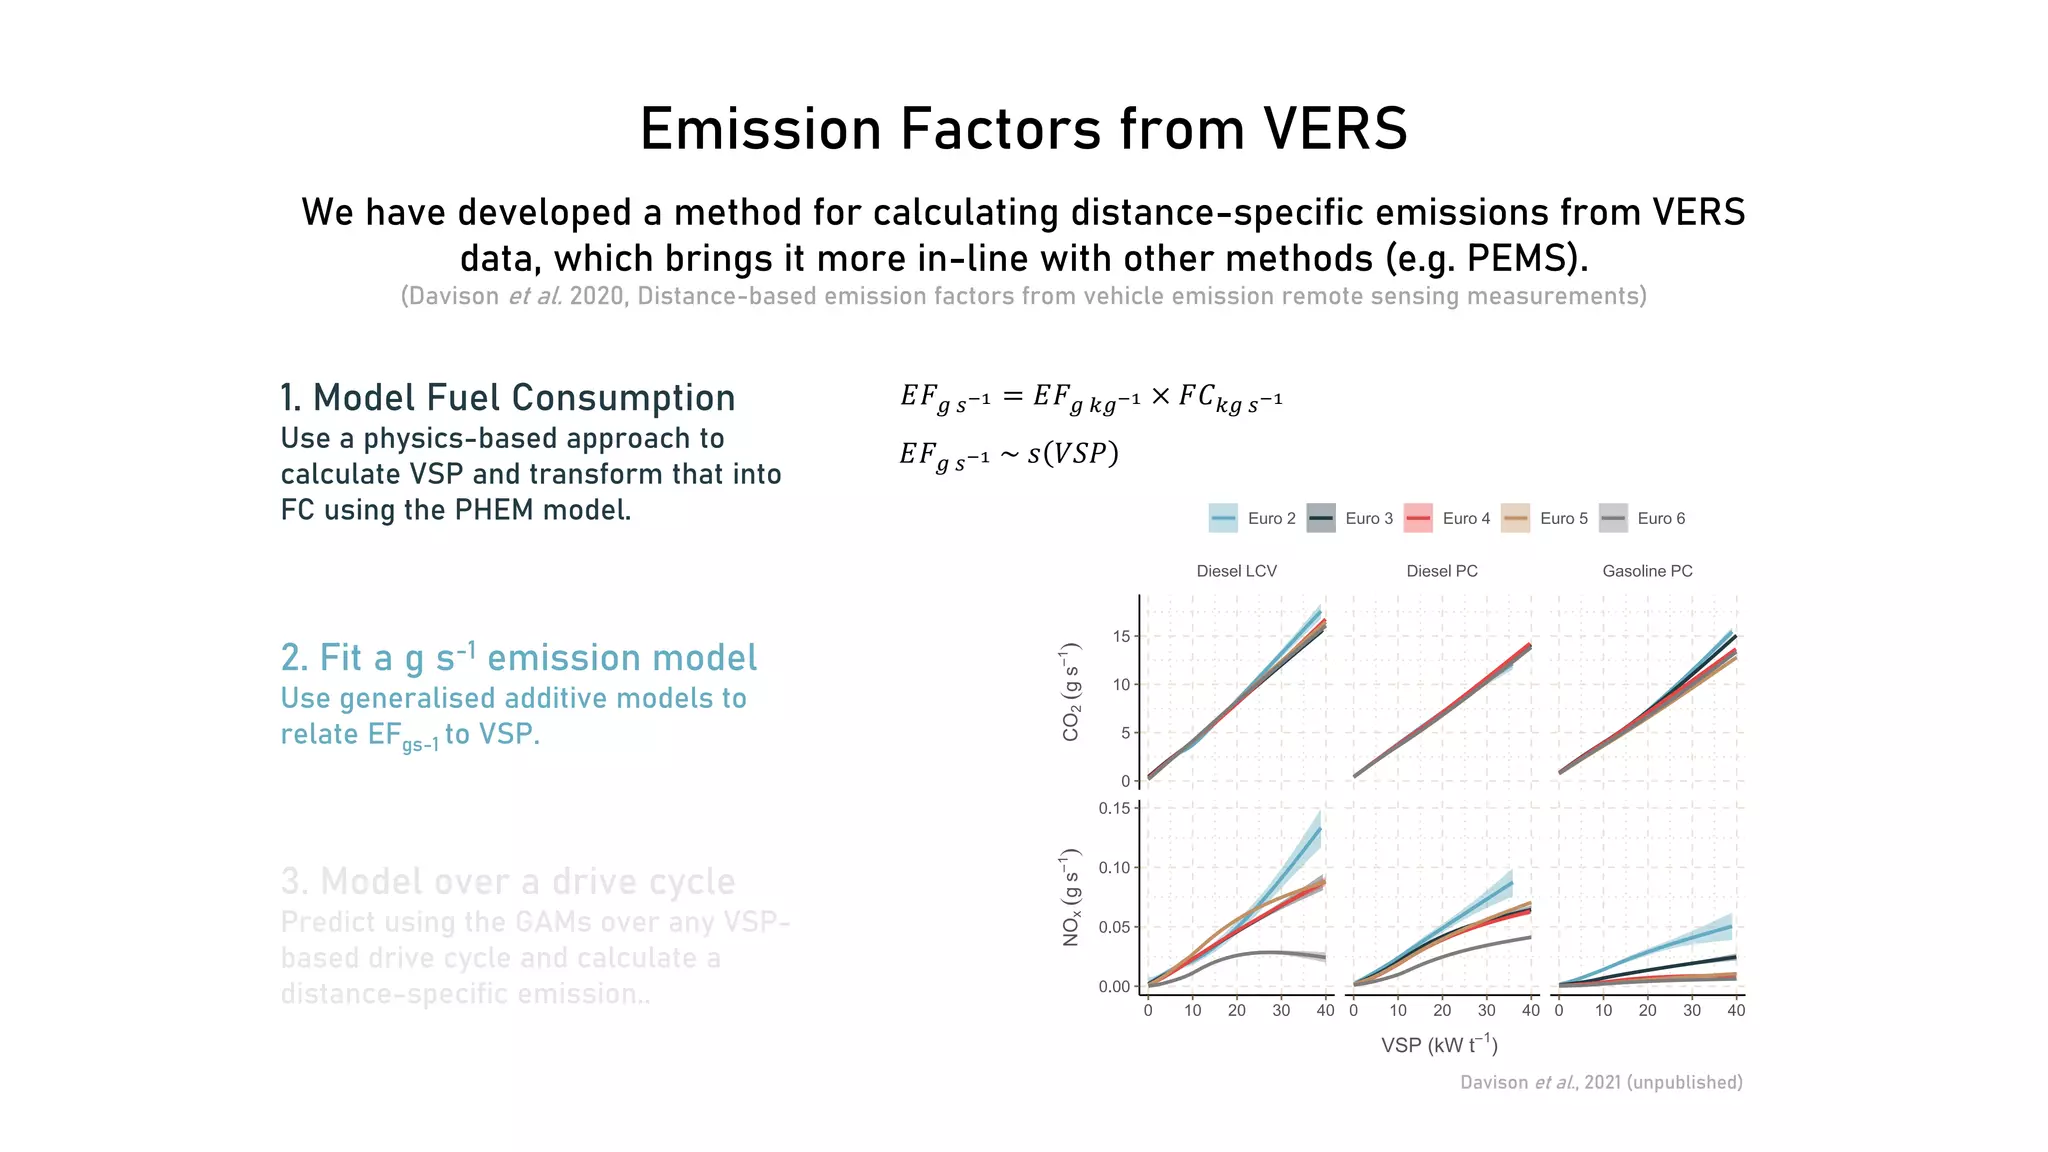
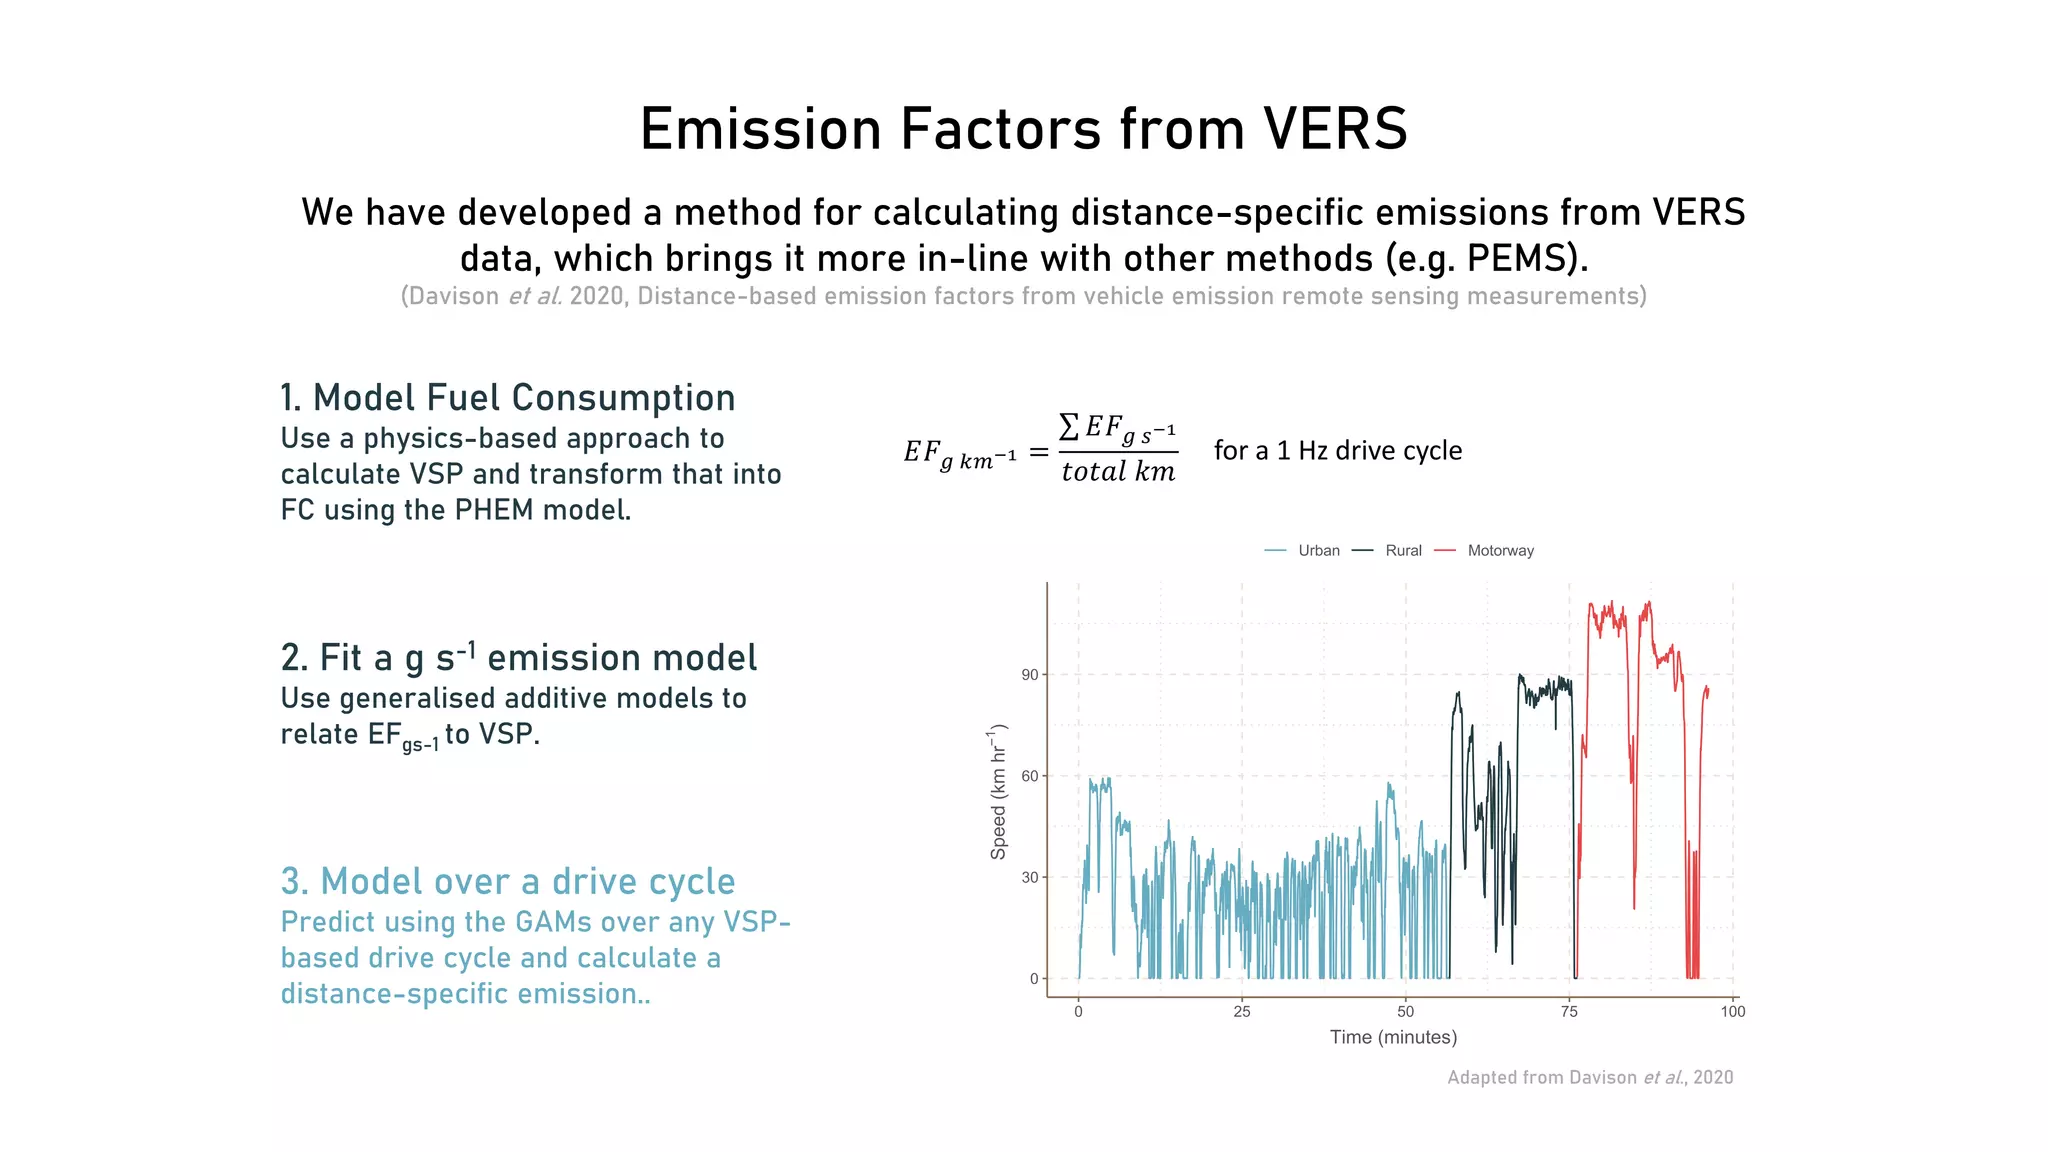
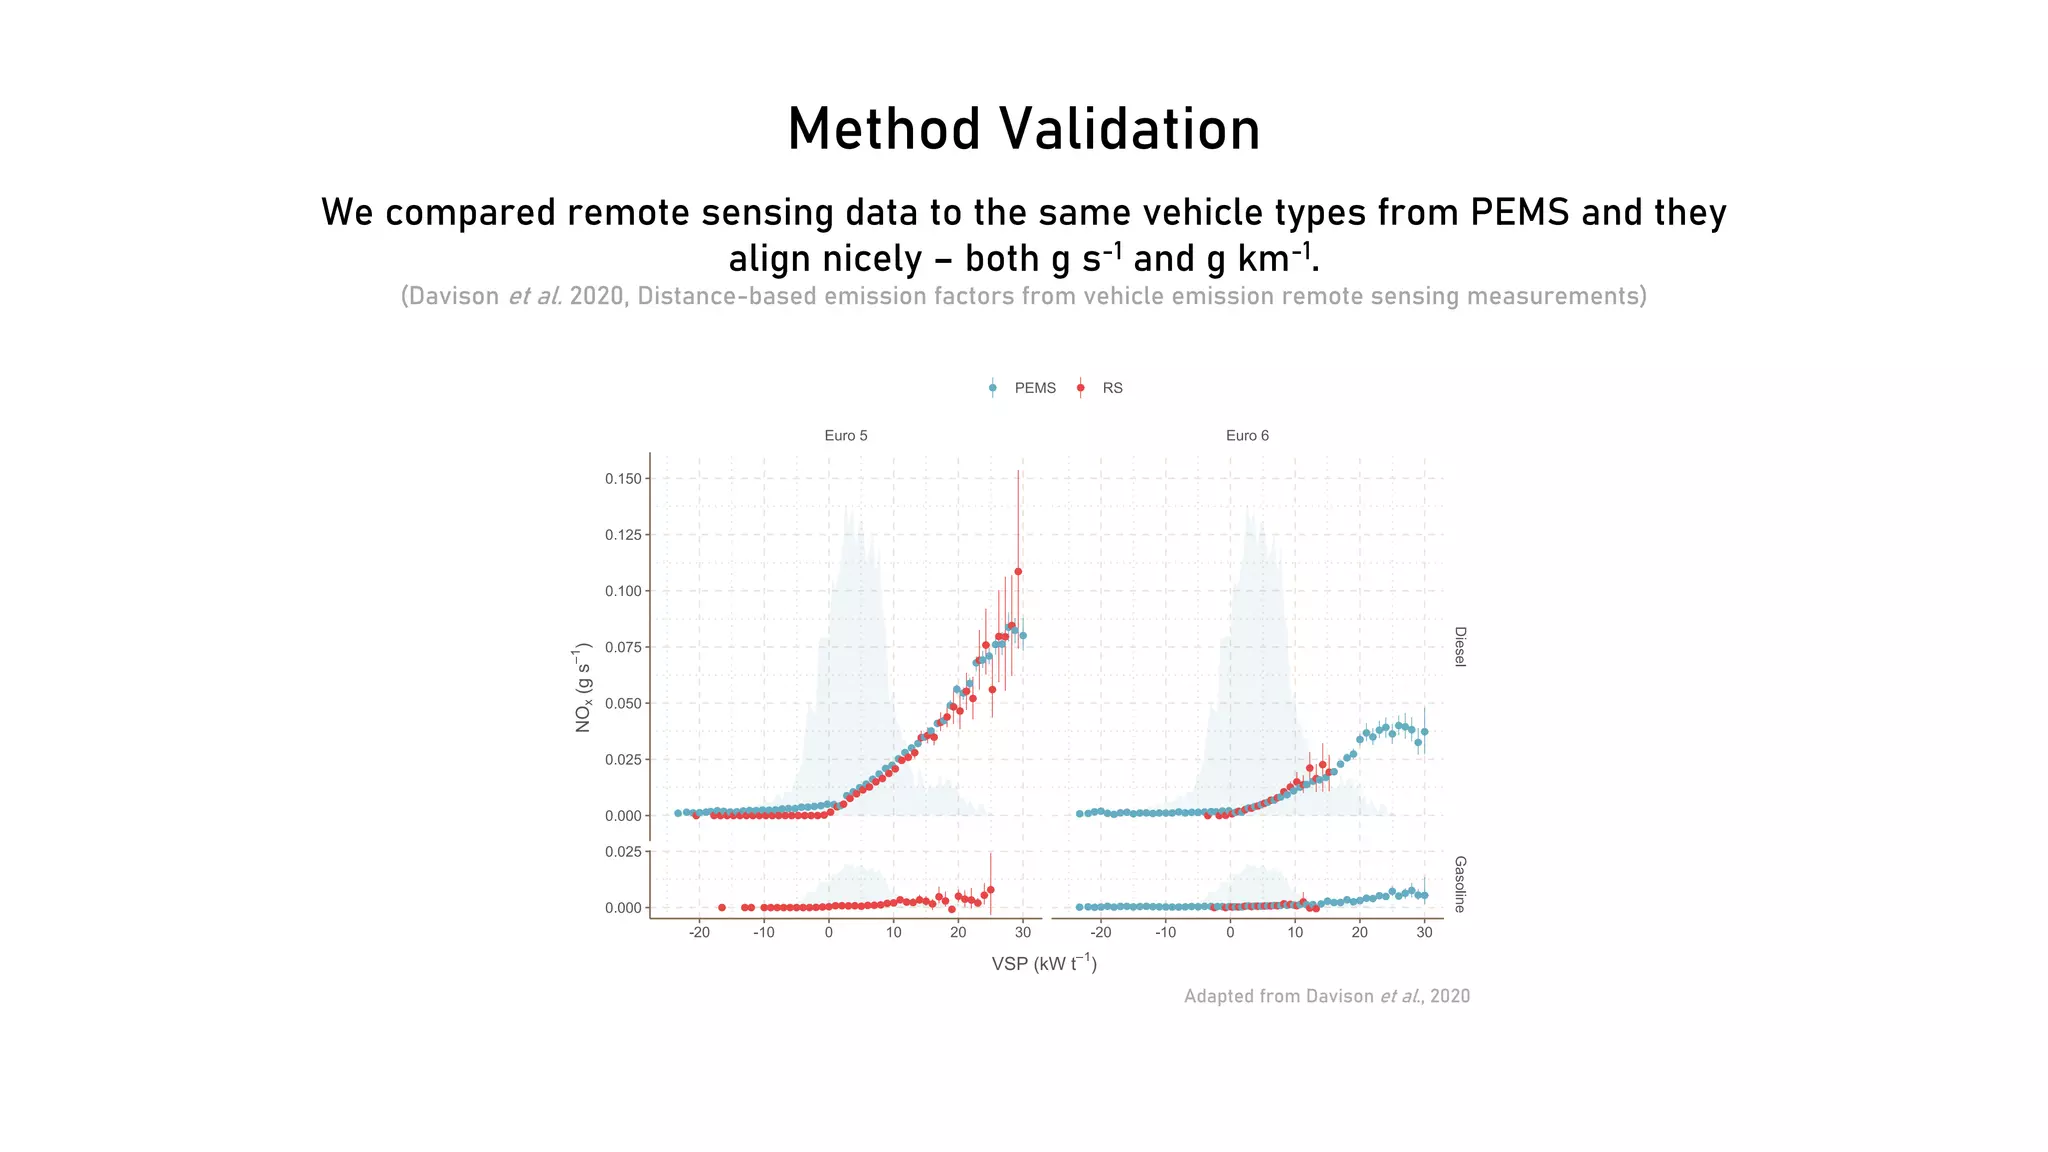
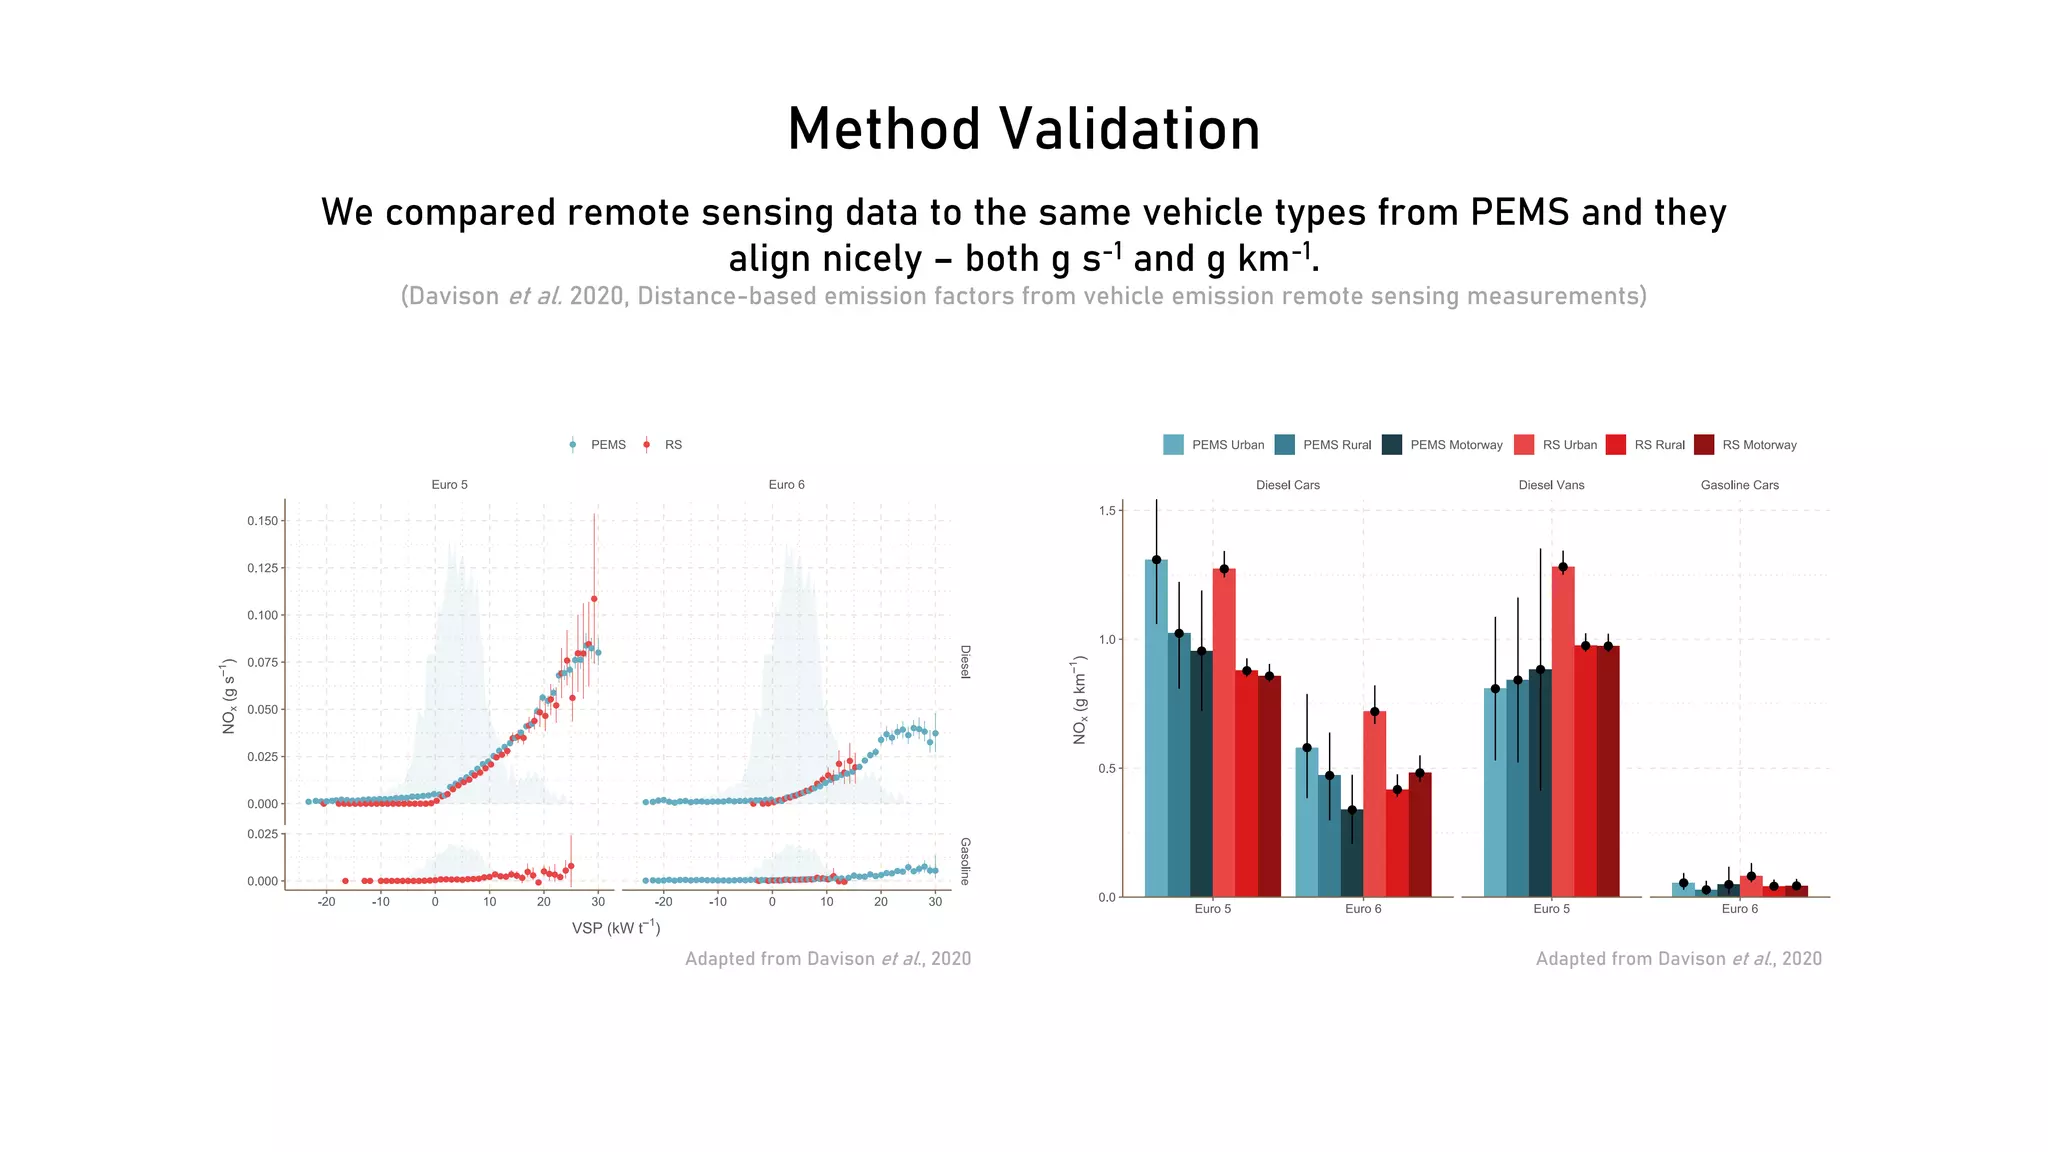
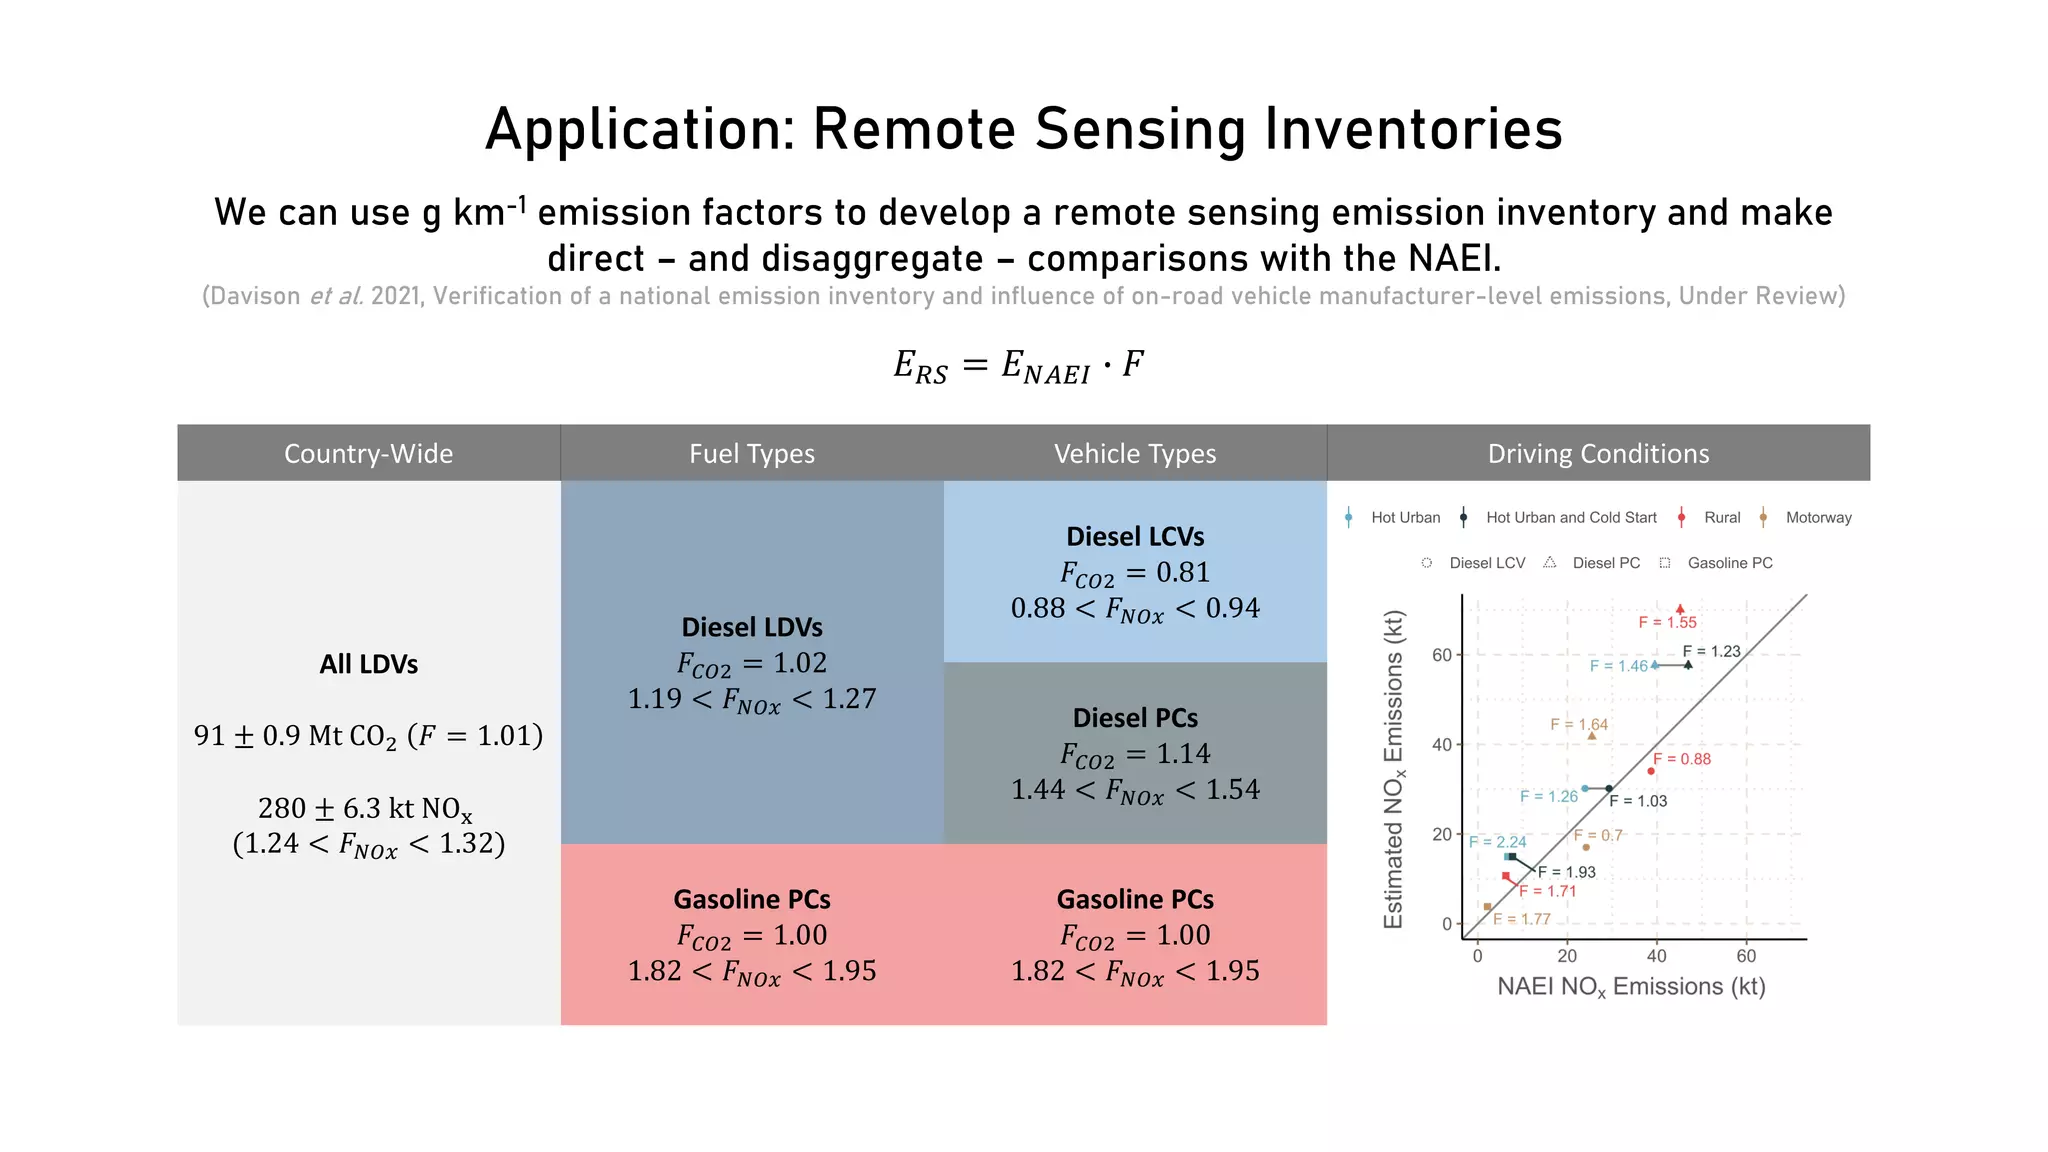
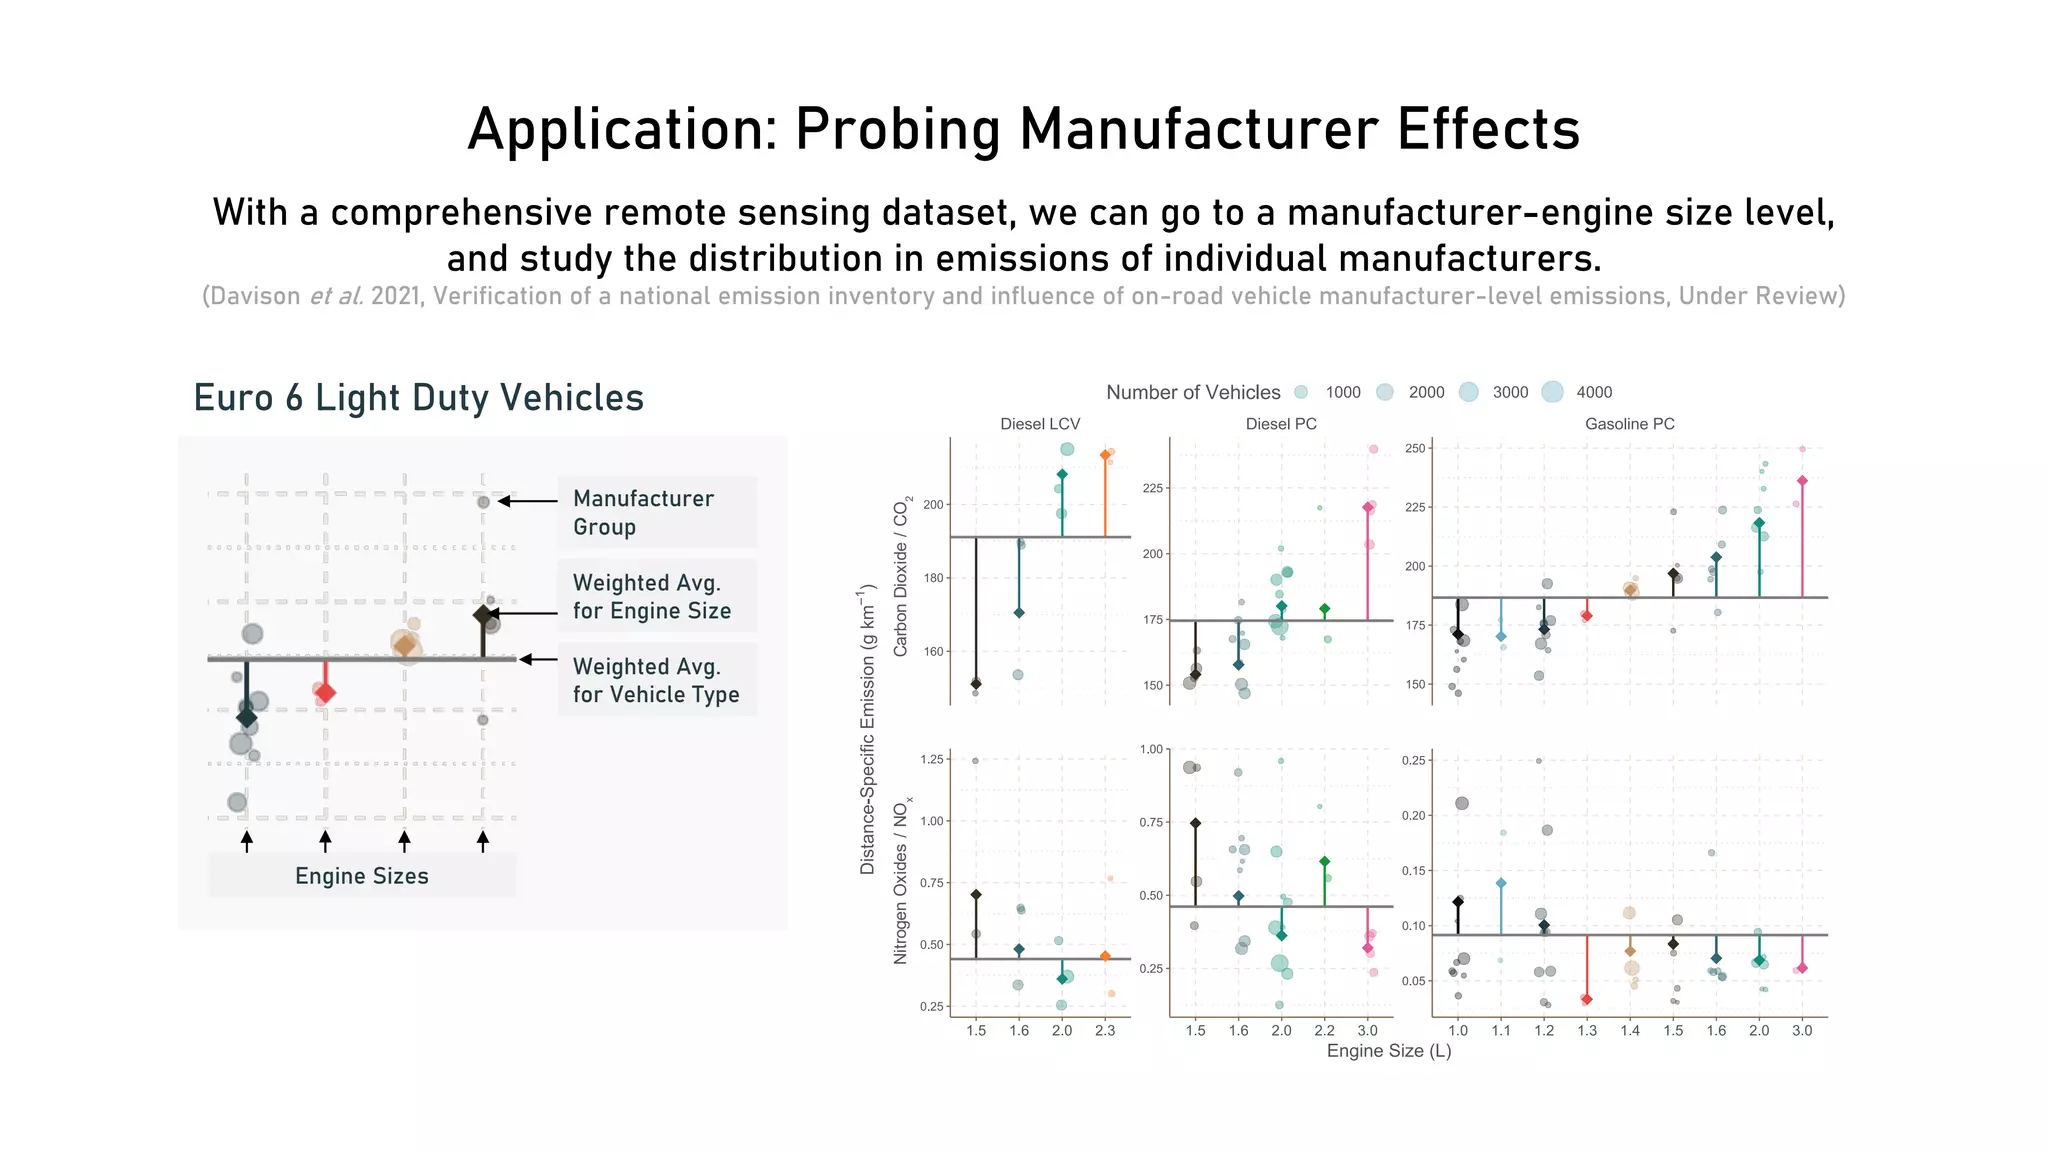
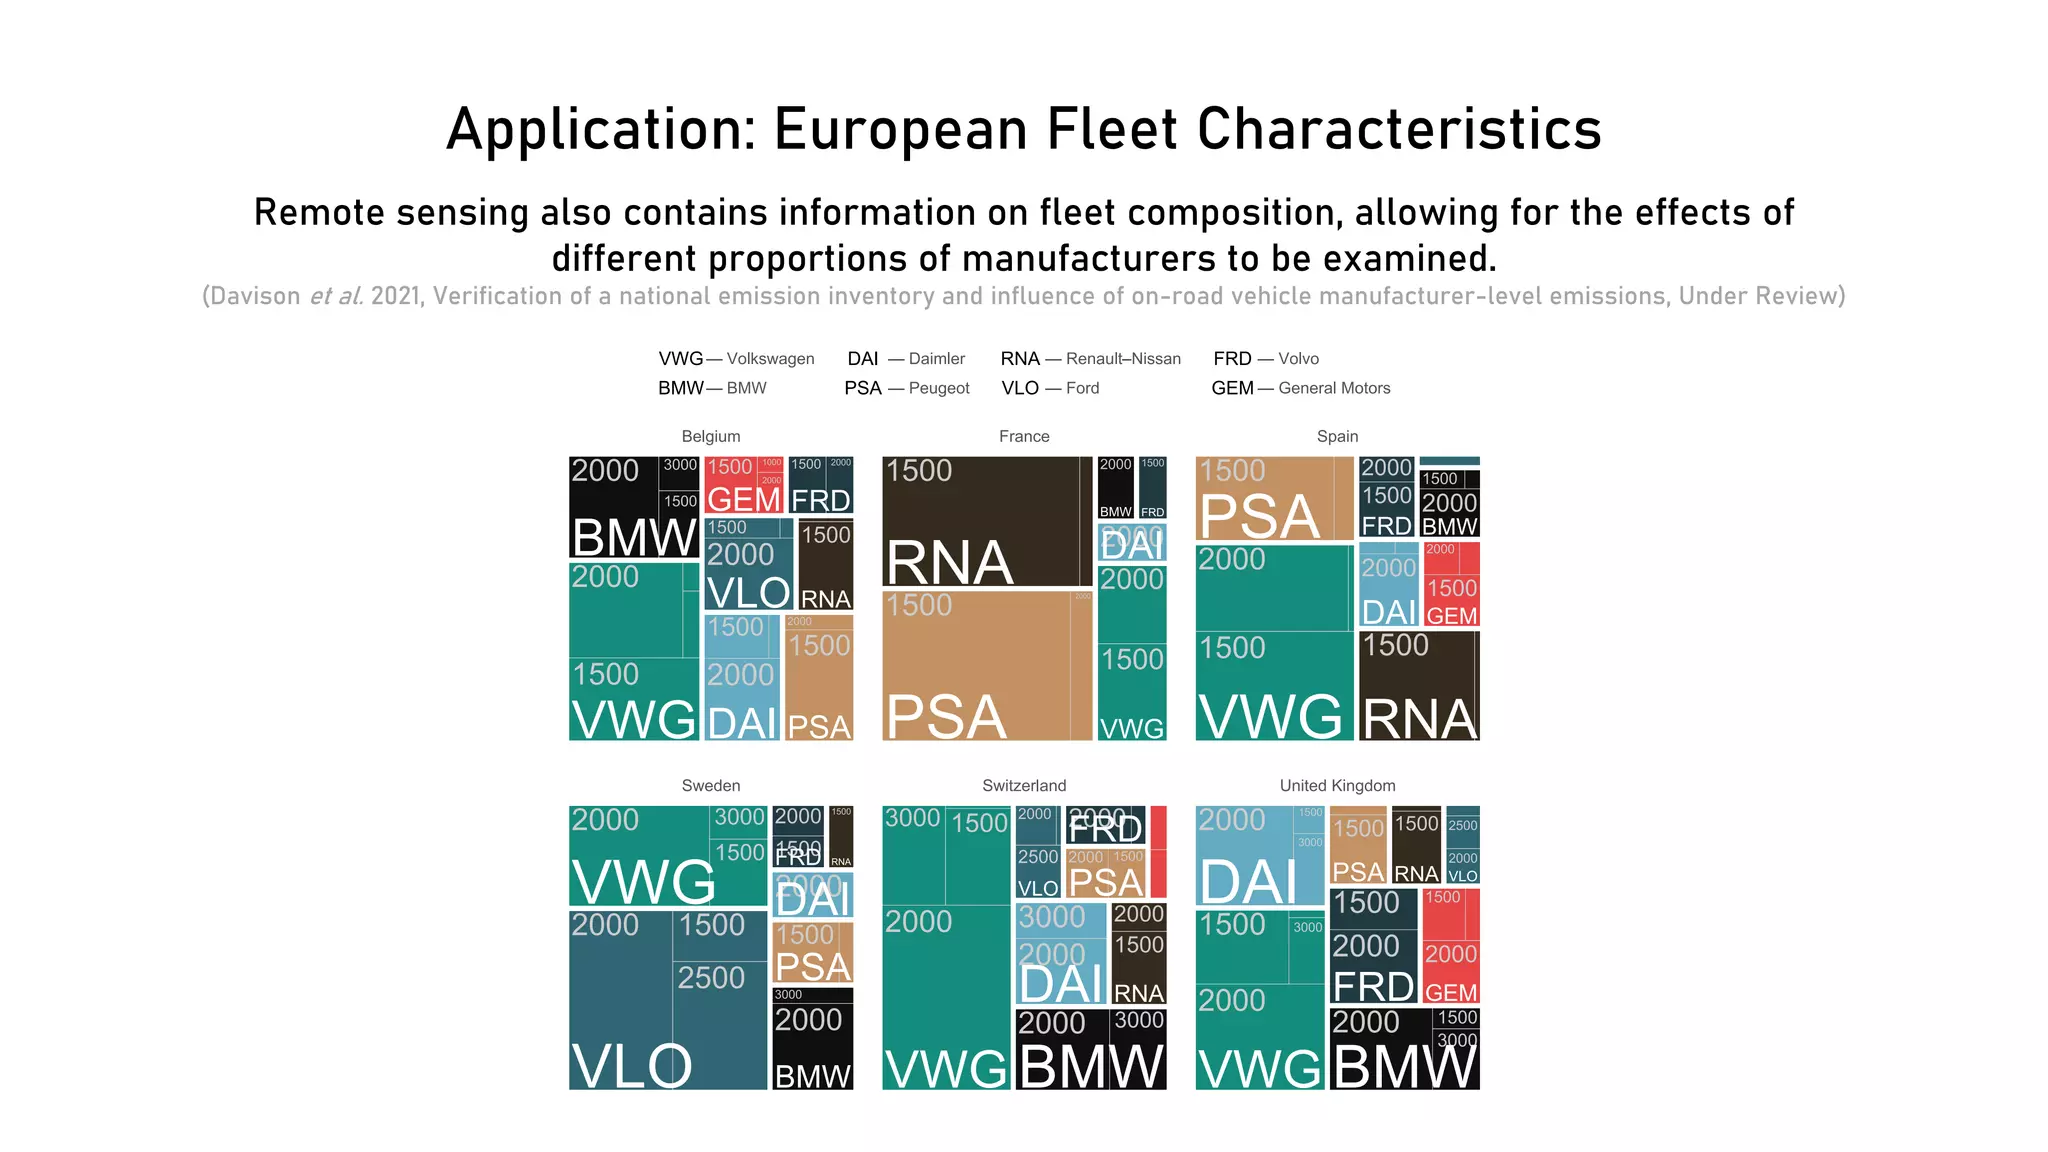
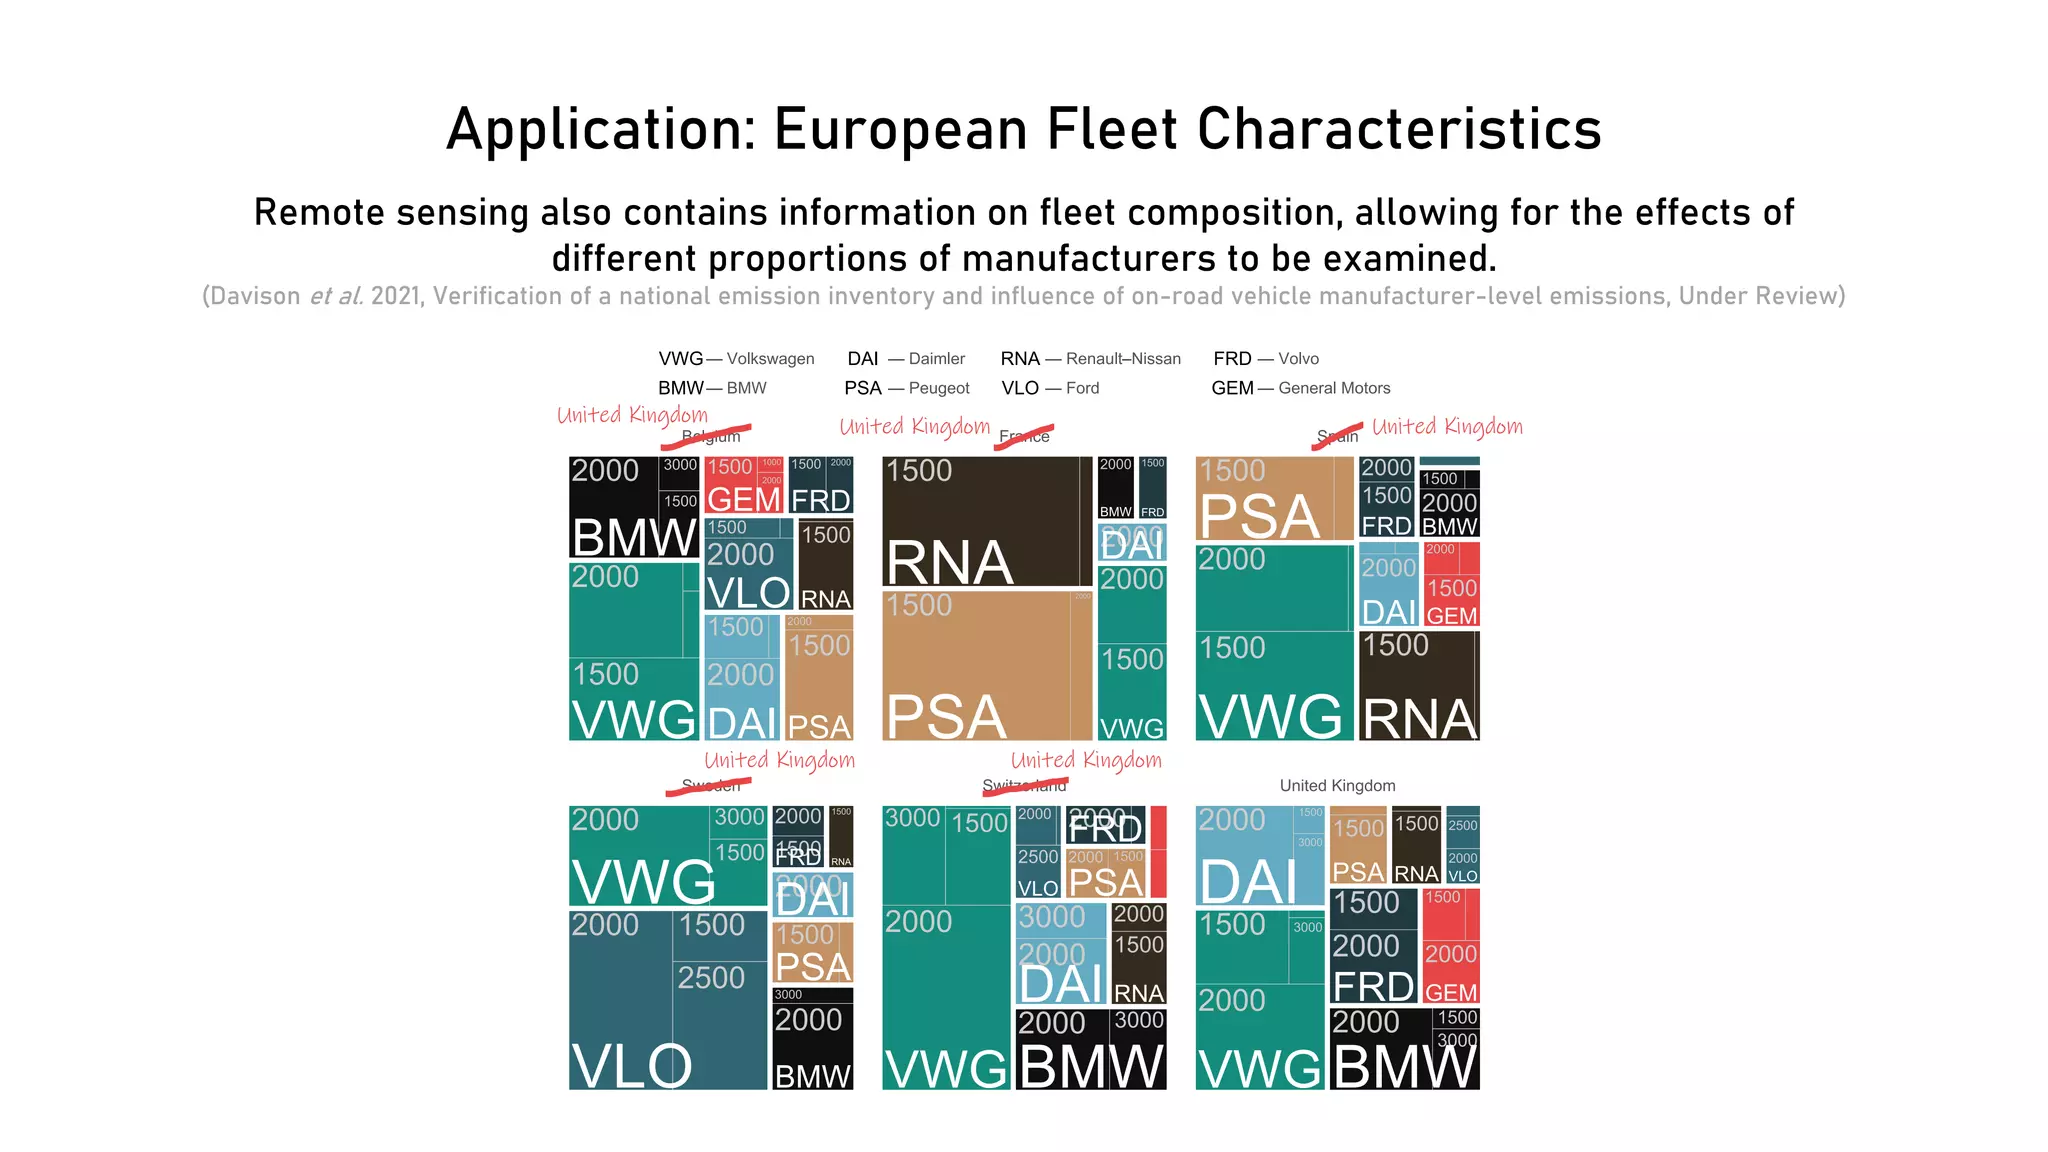
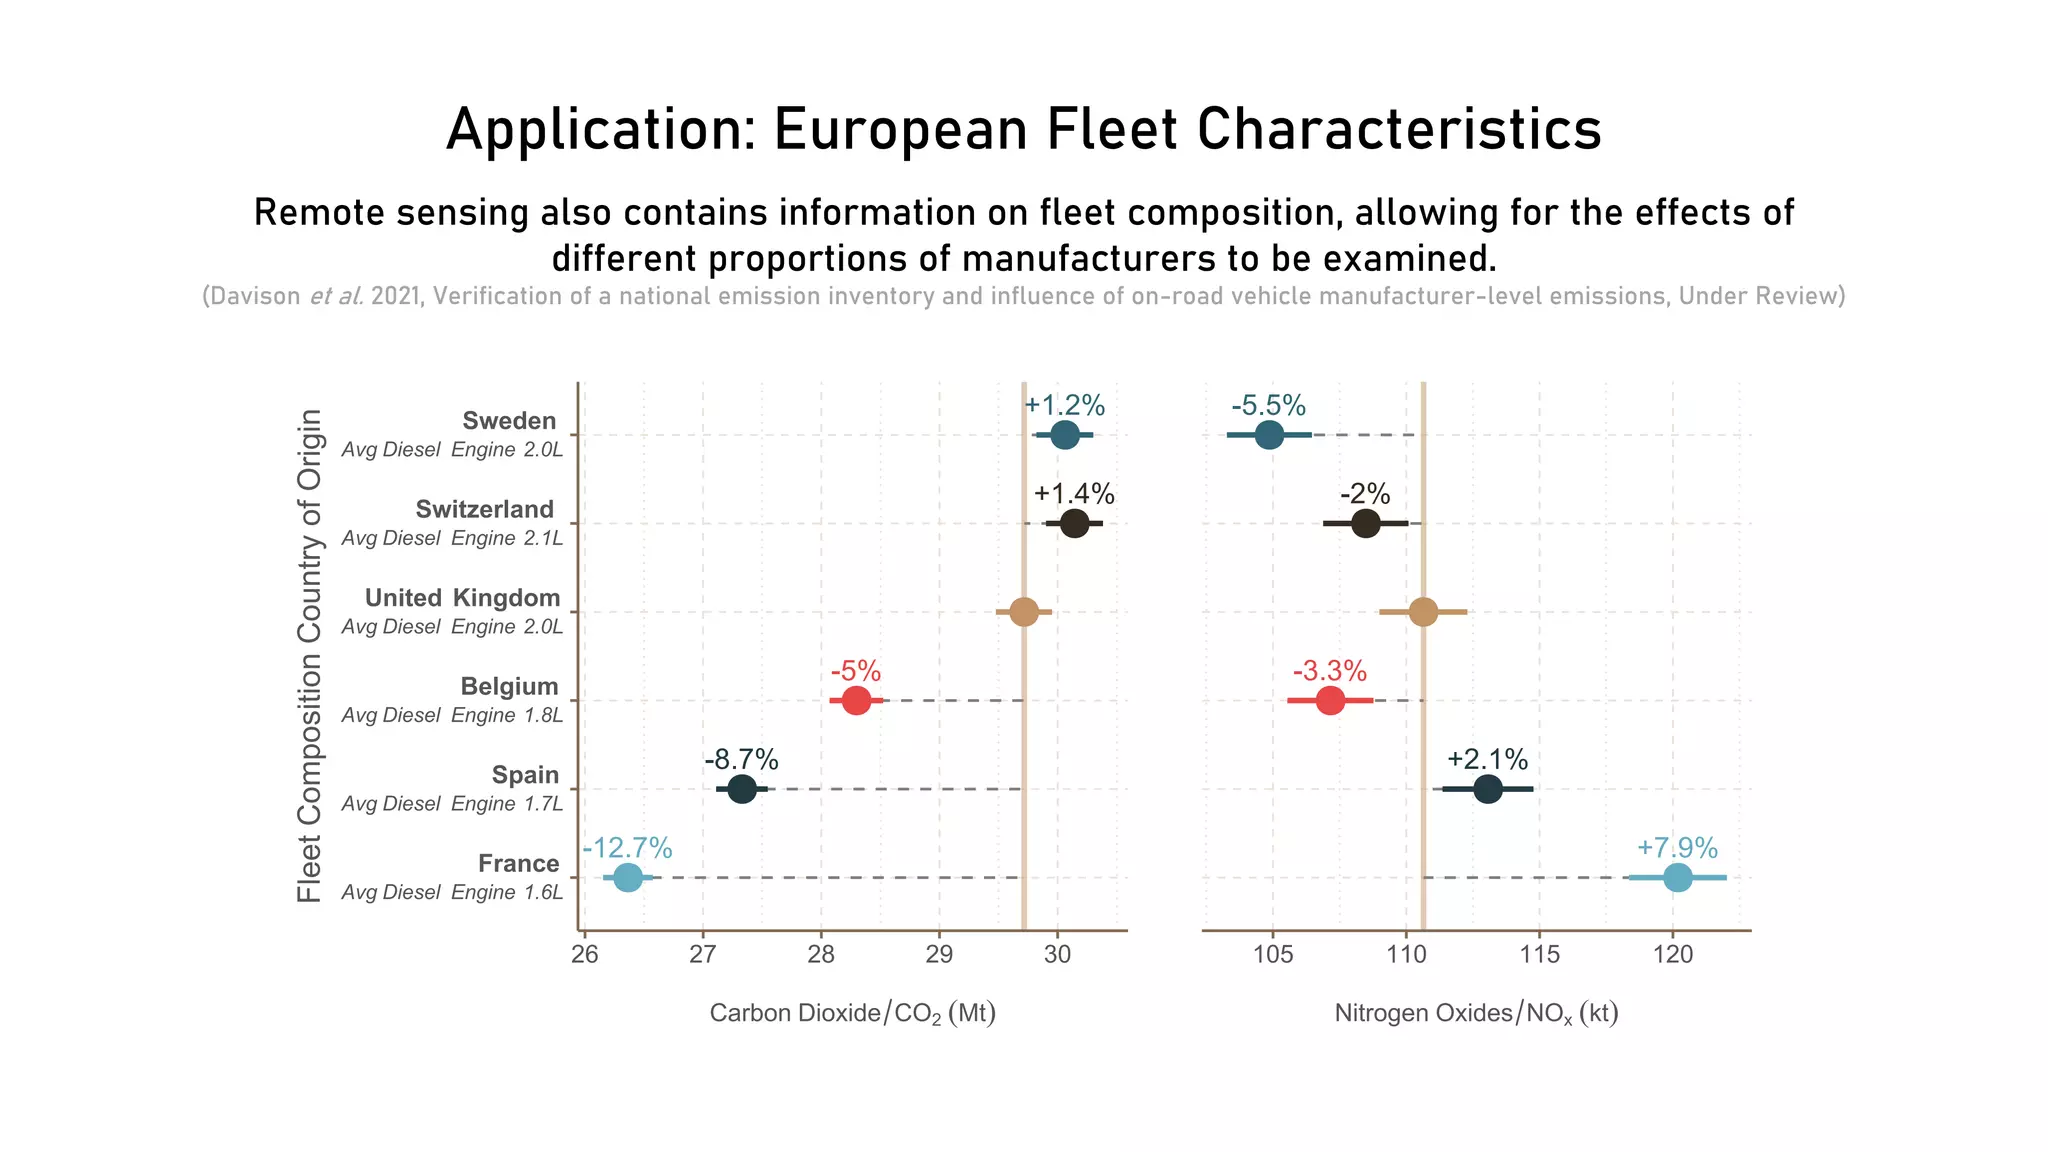
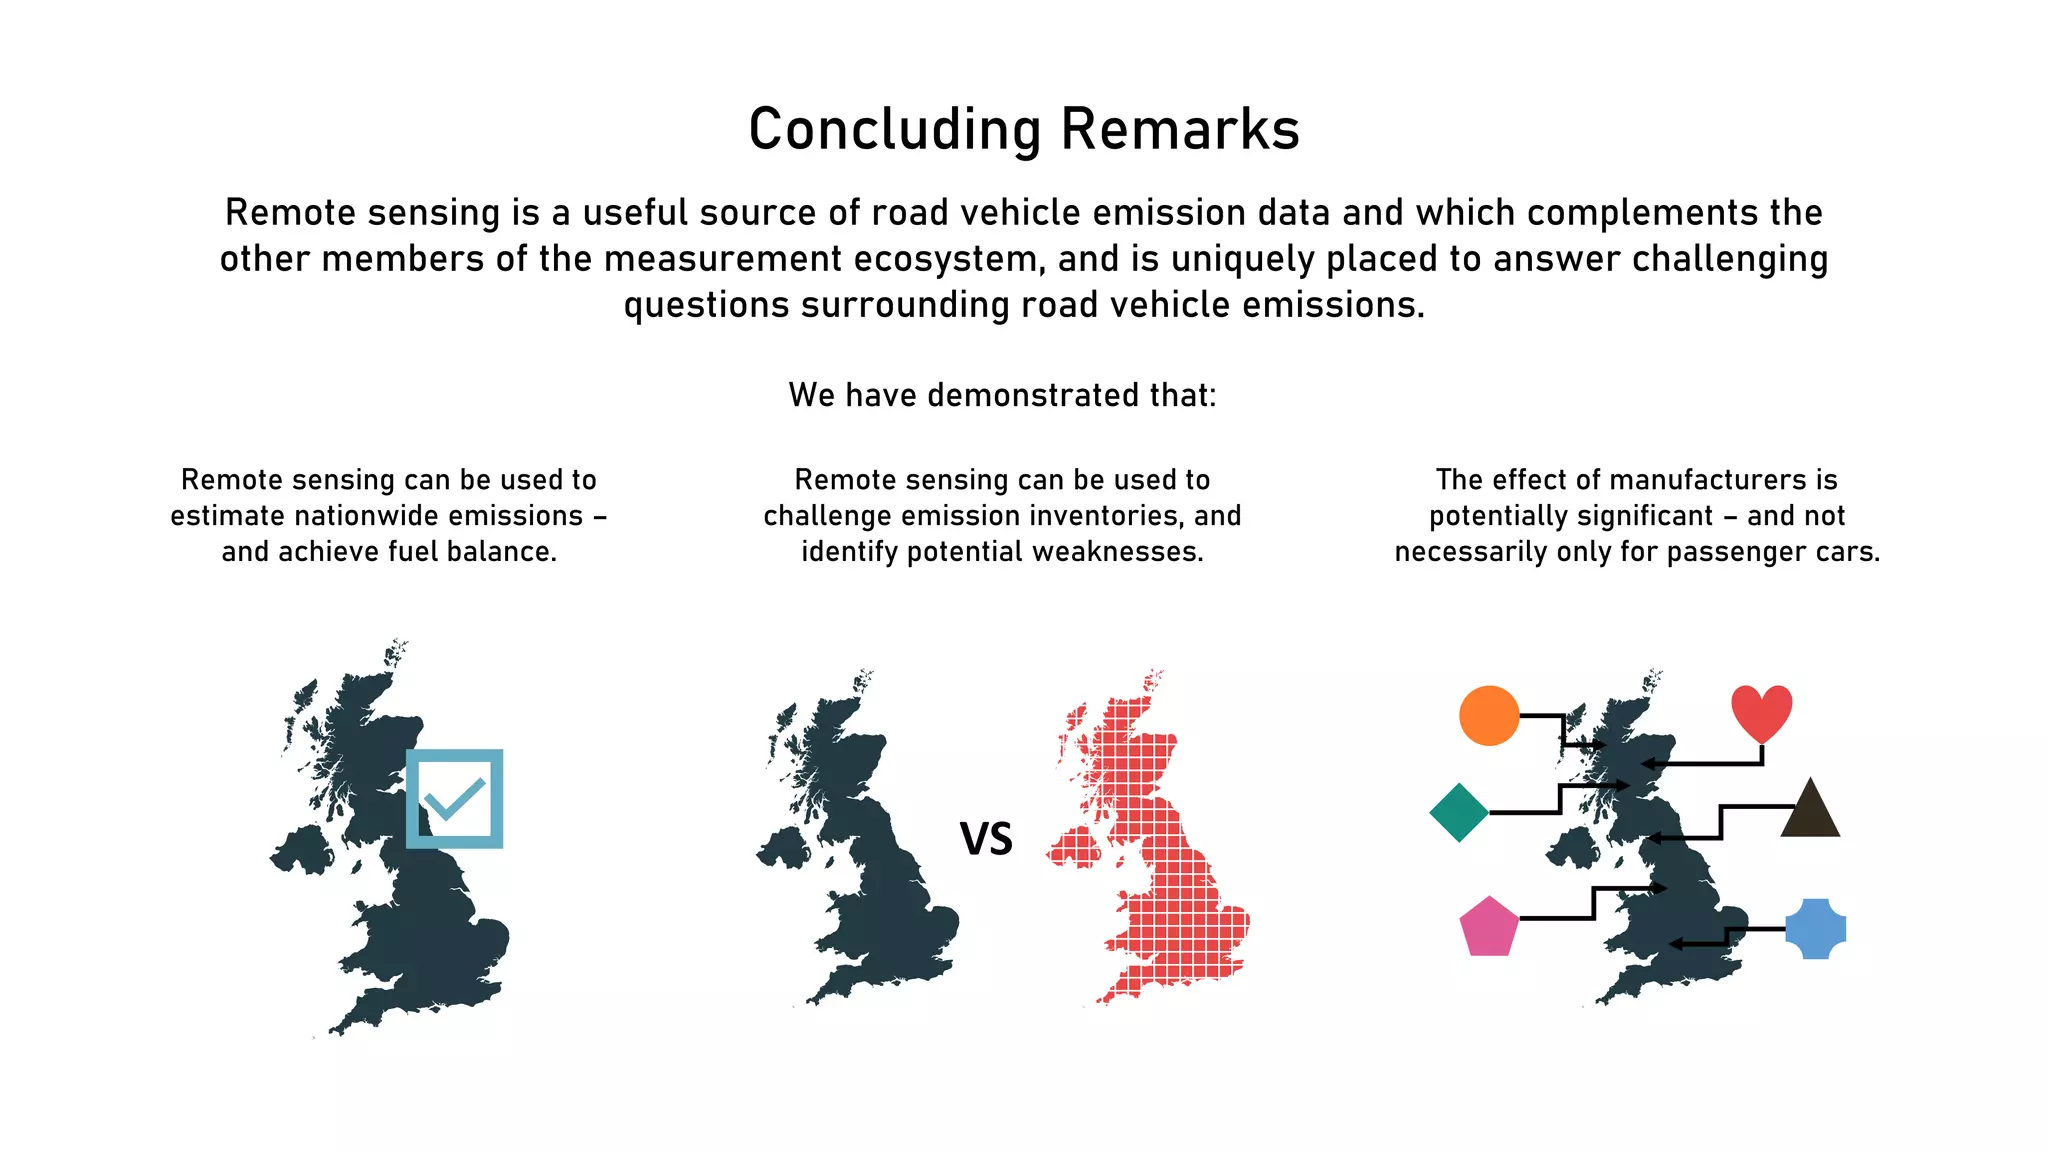
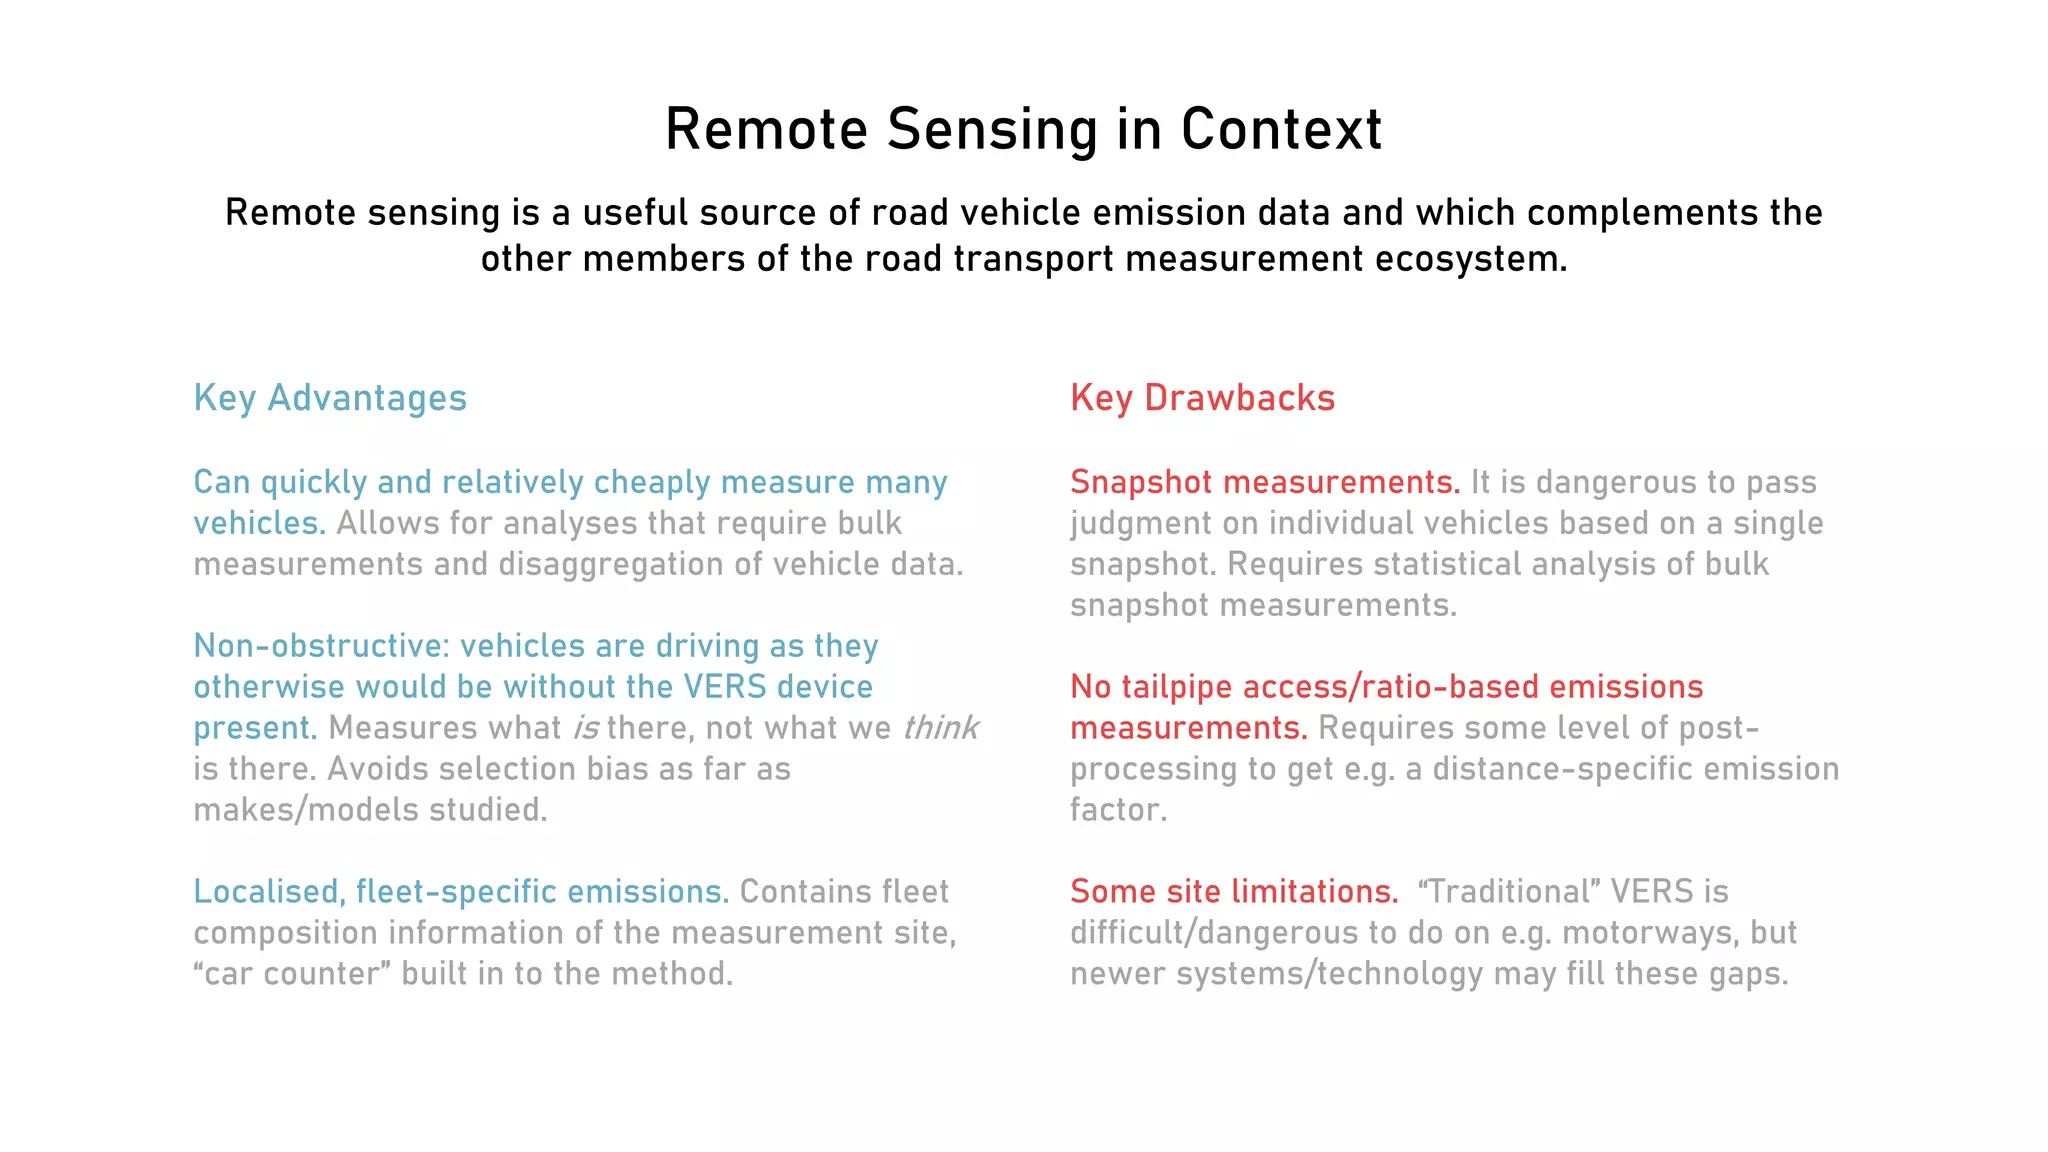

Vehicle emissions remote sensing (VERS) is a method to measure pollutants in vehicle exhaust through roadside sensors. VERS data can be used to develop emission factors and estimate emissions. The document discusses how VERS emission factors can be calculated in units of grams per second or grams per kilometer based on vehicle speed and acceleration. It also outlines applications of VERS data such as verifying national emission inventories, examining effects of vehicle manufacturers, and characterizing European vehicle fleets. Remote sensing is a useful tool that complements other emissions measurement methods.


