Downloaded 261 times

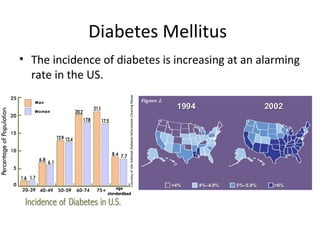
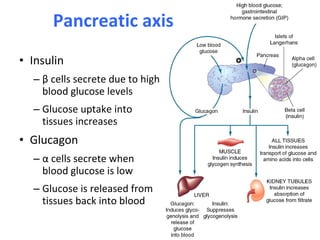
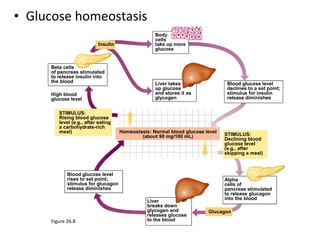
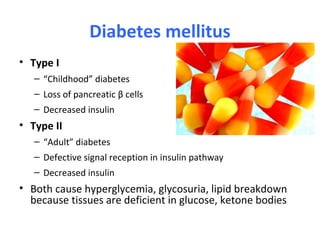
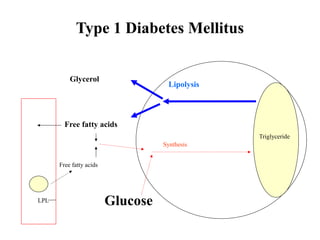
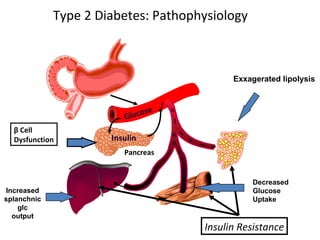
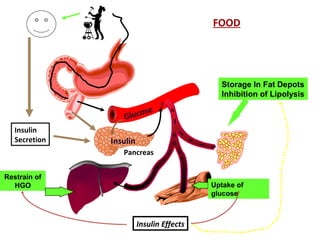
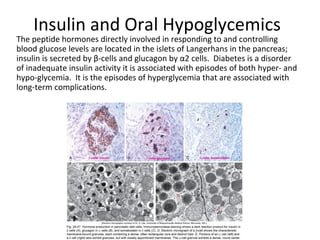
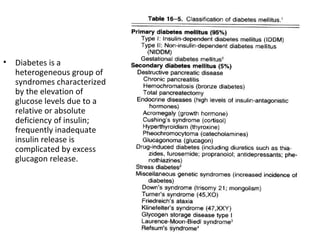
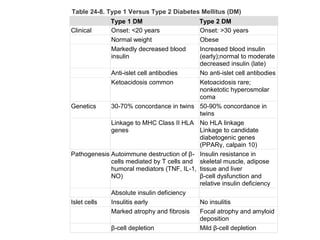
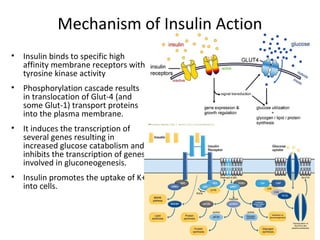
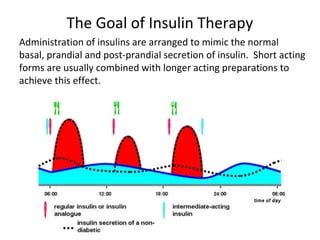
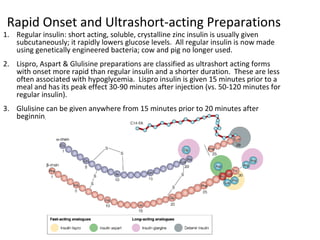
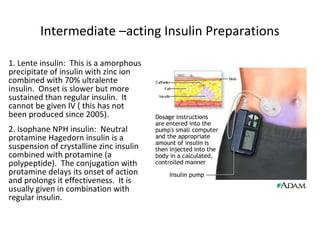
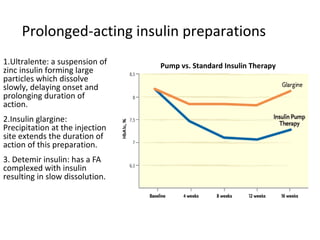

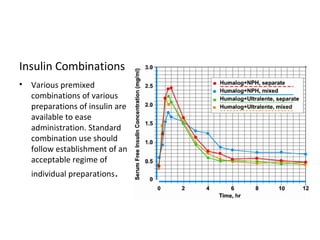
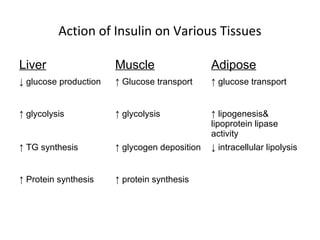
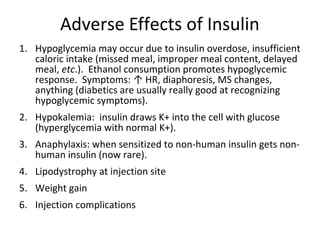
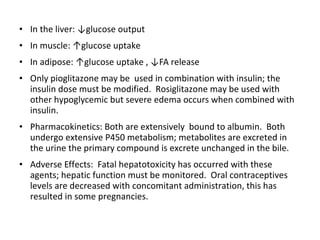
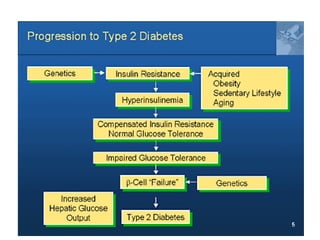
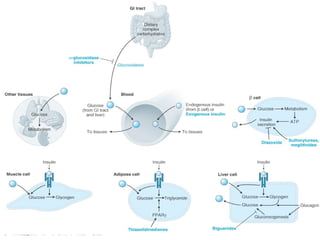
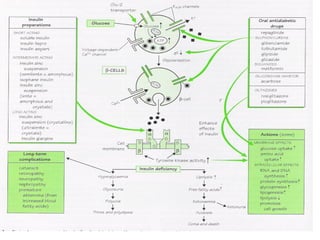

This document discusses various aspects of diabetes and its treatment with insulin and other drugs. It provides details on: 1) The two main types of diabetes - Type 1 characterized by a lack of insulin production and Type 2 characterized by insulin resistance. 2) How insulin controls blood glucose levels via its effects on various tissues like liver, muscle and fat. 3) The different types of insulin preparations used in treatment ranging from short-acting to prolonged-acting insulins. 4) Other oral hypoglycemic drugs used to treat Type 2 diabetes like sulfonylureas and meglitinide analogs which work by stimulating insulin secretion.


