Downloaded 20 times
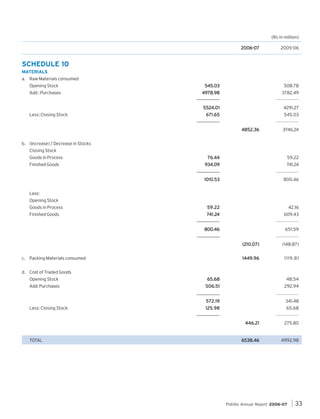
![Annexure I
To The Report of the Directors 2006-2007
Statement containing particulars pursuant to the Companies (Disclosure of particulars in the Report of the Board of
Directors) Rules, 1988 forming part of the report of the Directors.
.
CONSERV
ENERG
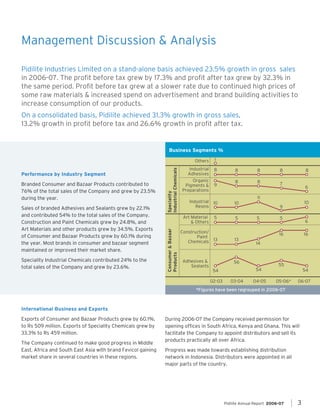
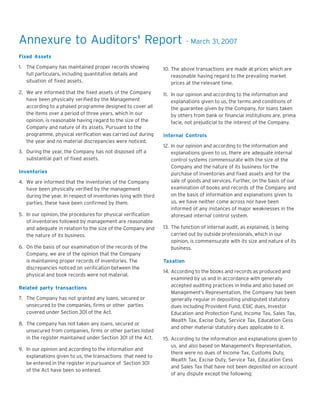
A] CONSERVATION OF ENERGY
a) Energy Conservation Measures taken
1. Energy Efficient mixing equipments.
2. Extended use of VFD for process / utilities equipments at new projects.
3. Process / Utilities optimization and automization.
onsumption of Energy
gy.
Propo als,
opos
any
implemented for reduction of Consump
Inv tments
b ) Additional Investments and Proposals, if any, being implemented for reduction of Consumption of Energy.
1. Use of Agro waste solid fuel (briquette) instead of fuel oil.
2. Revamping utilities with Gas-fired combustion system.
c ) Impact of measures of (a) and (b) above for reduction of energy consumption and consequent impact on
the cost of production of goods.
0.75 lac kwh Electricity and 1400 MT of Fuel Oil are expected to be saved annually by above measures.
energy consump
onsumption
energy consump
onsumption
of production
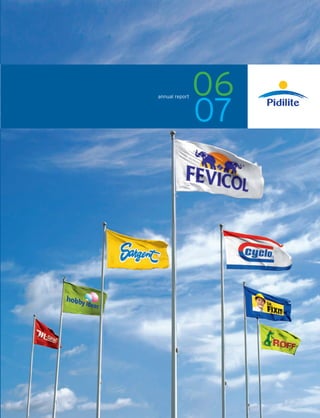
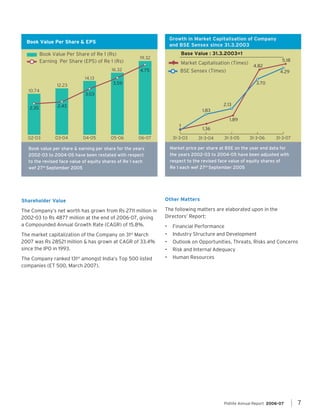
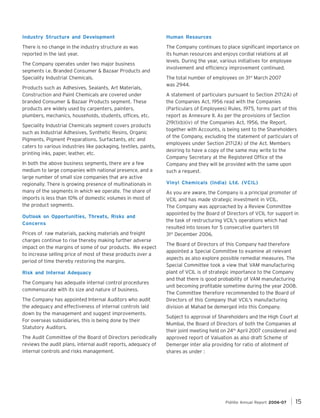
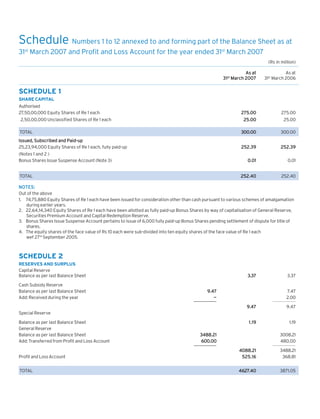
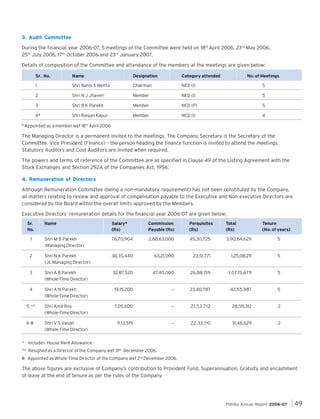
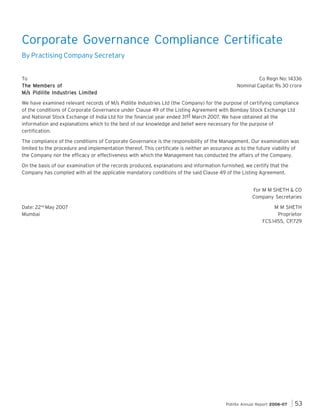
d ) Tot al energy consumption and energy consumption per unit of production
as per Form A
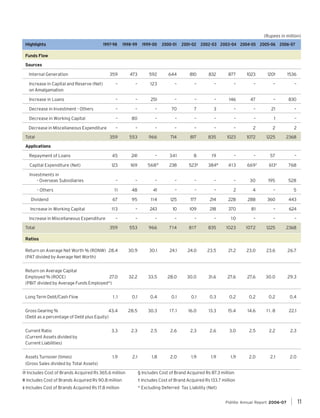
FORM A
Disclosure of Particulars with respect to Conservation of Energy
A. Power and Fuel consumption
Year ended
31st March 2007
1.
Year ended
31st March 2006
Electricity
a) Units Purchased
’000 kwh
1,13,03
98,20
Total Amount
Rs in million
56.66
5.01
46.63
’000 kwh
2,29
2,06
kwh
2.28
15.04
2.61
11.82
NA
NA
MT
Rs in million
Rs ’000/MT
34,27
59.96
17.
17.49
27,88
44.46
15.95
Units - Windmill
’000 kwh
5,84
7,16
Total Credit
Rate/Unit (Average)
Rs in million
Rs
2.75
4.70
3.14
4.39
Rate/Unit (Average)
Rs
4.75
b) Own Generation
Through Diesel Generator
Units
Units per litre of diesel oil
Cost/Unit
Rs/kwh
2. Coal
3. Fuel oil
Quantity
Total Amount
Average Rate
Other/Int
/Internal Generation
4. Other/Internal Generation
NB: 7.87 million kwh (7.52 million kwh) units generated amounting to Rs 20.47 million (Rs 17.17 million) at Satara and Sangli wind mill
projects are shown as "Other Income " in the current year.](https://image.slidesharecdn.com/annualreportproject-140121061259-phpapp02/85/Annual-report-project-20-320.jpg)
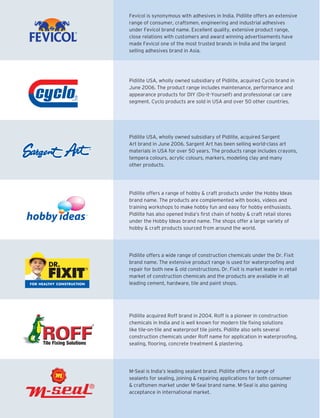
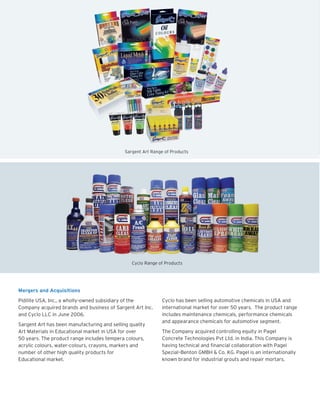
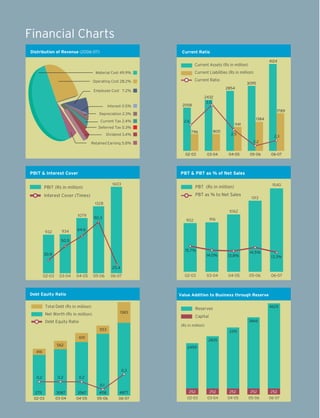
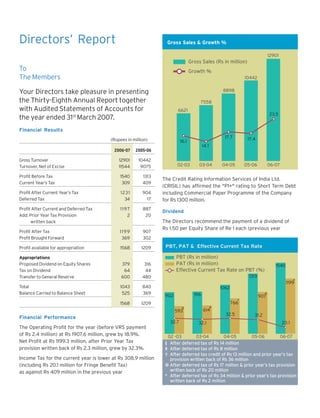
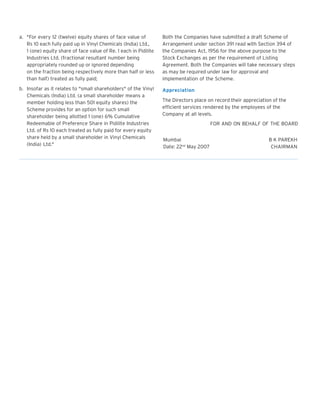
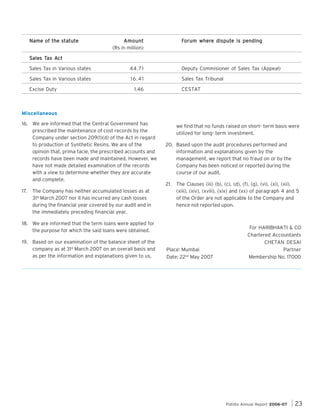
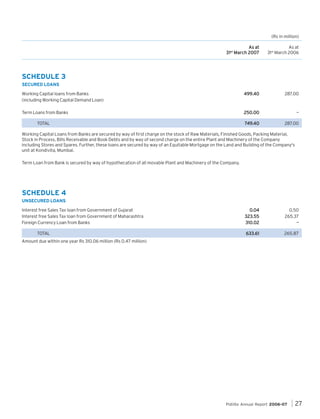
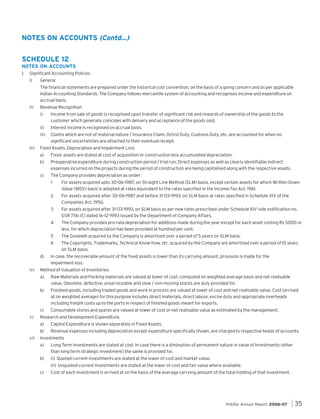
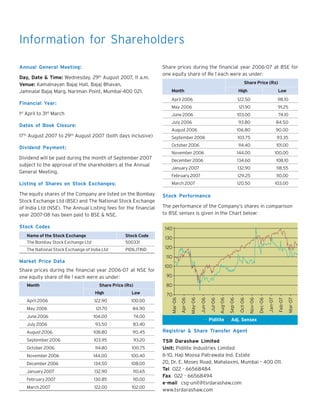
![B. Consumption per unit of production
It is not feasible to furnish information in respect of consumption per unit of production.
B] TECHNOLOGY ABSORPTION
e) Efforts made in technology absorption:
(as per Form B)
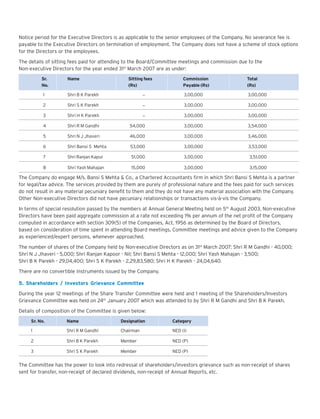
FORM B
Disclosure of Particulars with Respect to Technology Absorption
RESEARCH & DEVELOPMENT (R&D)
1. Specific areas in which R & D is carried out by the Company
R & D programmes are carried out towards development of new products, improvement of the existing products and
processes falling under the category of Synthetic Resins, Adhesives, Sealants, Pigments and Pigment Dispersions,
Intermediates, Surfactants, Art Materials, Coatings, Fabric Care Products, Construction Chemicals, Maintenance
Chemicals, Emulsion Polymers, etc.
2. Benefits derived as a result of the above R&D
Increase in sales due to product improvements and introduction of new products; reduction in cost due to process
improvements and cycle time reduction.
utur
ure
of Action
3. Future Plan of Action
Future R&D efforts will continue along similar lines, as at present.
4. Expenditure on R&D
(Rs in million)
Year ended
31st March 2007
Year ended
31st March 2006
2.75
1.61
ii) Recurring
47
47.07
39.77
Total
49.82
41.38
0.39
0.40
i)
Capital
iii) Total R&D expenditure as a percentage of total turnover
Absorption, Adap
dapt
Innov
5. Technology Abs orption, Adapt ation and Innovation
i) Technologies, Process developed by our R&D Department are being continuously absorbed and adopted on a
commercial scale.
ii) Benefits derived as a result of the above efforts :
Improvement in products and processes.
iii) Information regarding Technology imported during the last 5 years :
No technology imported during last 5 years.
Pidilite Annual Report 2006-07
19](https://image.slidesharecdn.com/annualreportproject-140121061259-phpapp02/85/Annual-report-project-21-320.jpg)
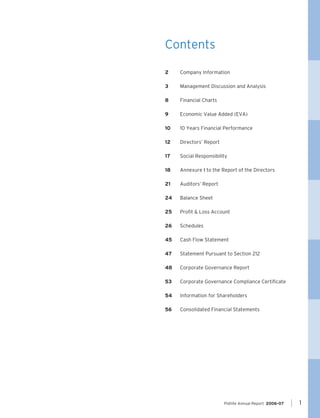
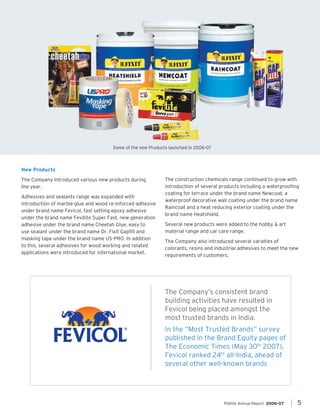
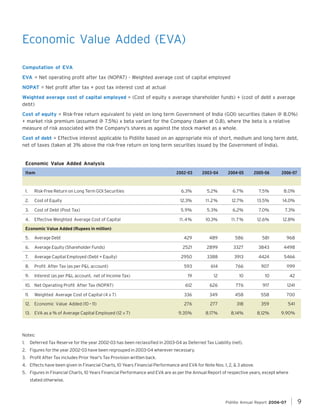
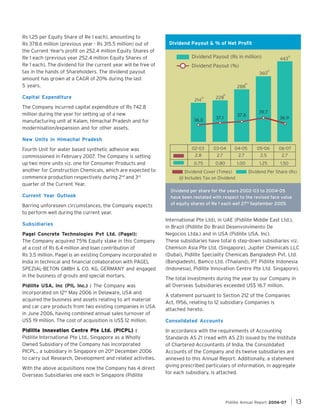
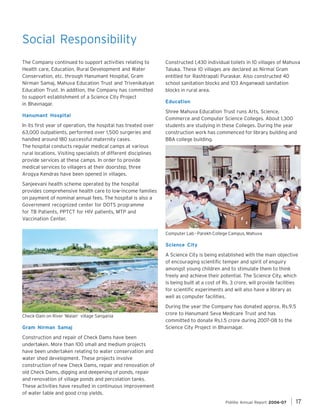
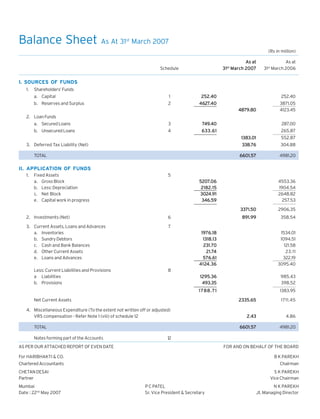
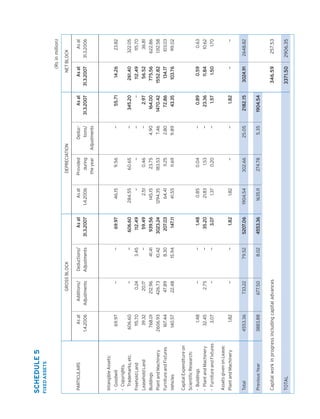
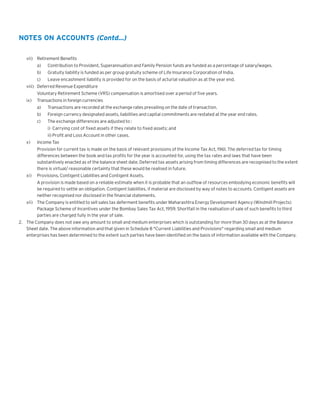
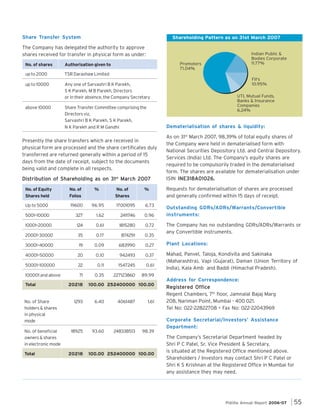
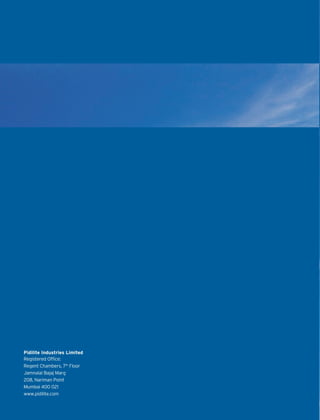
![C] FOREIGN EXCHANGE EARNINGS & OUTGO
f) Activities relating to exports, initiatives taken to increase exports, development of new export markets for
products and services and export plans
Export earnings during 2006-07 have shown an increase of Rs 310 Million over 2005-2006.
We have increased number of foreign distributors for our products and put in place more employees in exports and
overseas business development work.
for
oreign ex
used
earned
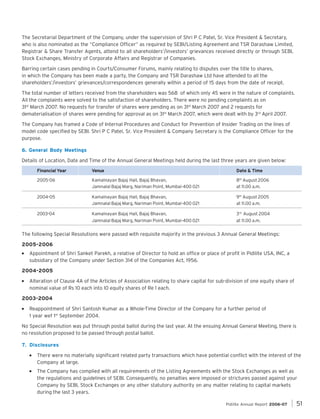
g ) Total foreign exchange used and earned
(Rs in million)
Year ended
31st March 2007
Year ended
31st March 2006
Foreign exchange earned
956
646
Foreign exchanged used*
2,175
1,472
*Out of the above, exchange used for import of materials which are either not manufactured in India and / or not easily available in India,
amounted to Rs 1,843 million for the year ended 31st March 2007 (Previous year Rs 1,256 million).](https://image.slidesharecdn.com/annualreportproject-140121061259-phpapp02/85/Annual-report-project-22-320.jpg)
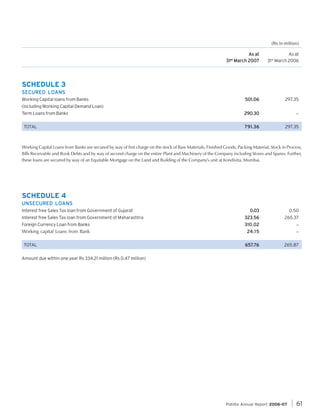
![(Rs in million)
As at
31st March 2007
As at
31st March 2006
0.01
0.10
117.8
.83
117.83
117.83
3594 Equity Shares of Rs 10 each of Hindustan Adhesives Ltd
0.09
0.09
14400 Equity Shares of Rs 10 each of Hindustan Organic Chemicals Ltd
0.72
0.77
0.72
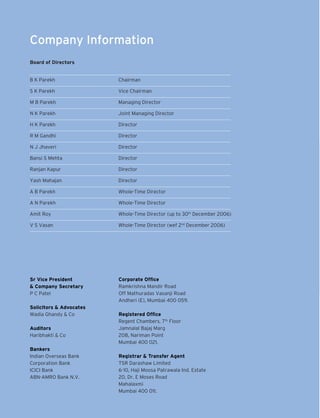
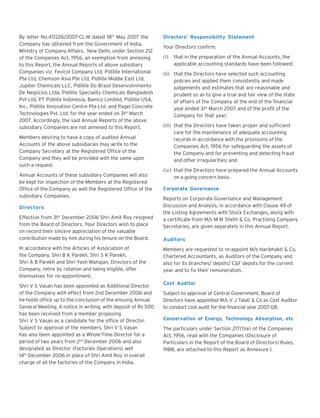
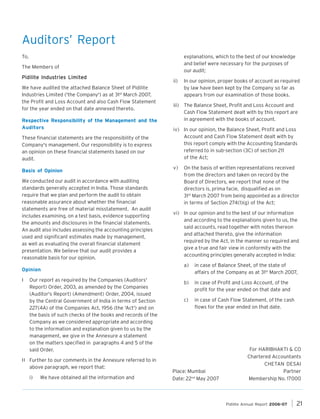
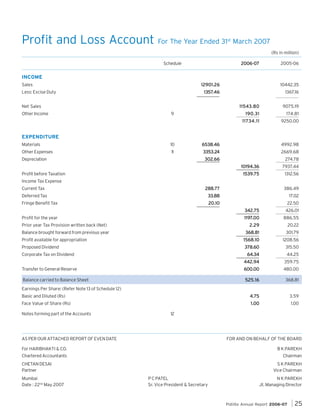
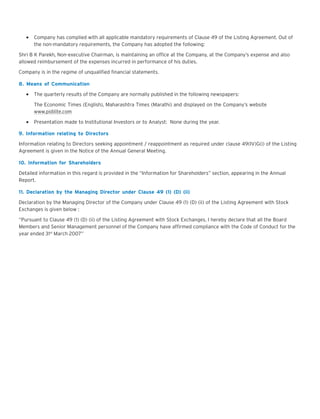
SCHEDULE 6
LONG TERM INVESTMENTS (AT COST)
I. In Government Securities (Unquoted)
6 and 7 Years National Savings Certificates
(Deposited with Government Departments, Mumbai Municipal Corporation, Reliance Energy Ltd)
II. In Equity Shares (Fully paid)
a) Quoted
Trade:
7451540 Equity Shares of Rs 10 each of Vinyl Chemicals (India) Ltd
Others:
4188 Equity Shares of Rs 10 each of Indian Petrochemicals Corporation Ltd
0.77
1.21
0.50
285.66
76.37
181.32
22.83
2.40
368.52
6.42
TOTAL - II (a)
127.96
0.50
61900 Equity Shares of Rs 10 each of Menon Pistons Ltd
2.96
127
127.96
222542 Equity Shares of Rs 10 each of Indian Overseas Bank Ltd
1.21
2.96
4.38
121300 Equity Shares of Rs 10 each of Pal Peugeot Ltd
—
4.38
[Market Value Rs 97.56 million (Rs 135.38 million)]
b) Unquoted (Fully paid)
In wholly-owned Subsidiary Companies:
50000 Equity Shares of Rs 10 each of Fevicol Company Ltd
6374353 (3997496) Equity Shares of Pidilite International Pte Ltd
6287005 (3465597) Equity Shares of Pidilite Middle East Ltd
1088471 (129999) Equity Shares of Pidilite Do Brasil Desenvolvimento De Negocios Ltda
8000000 (Nil) Equity Shares of Pidilite USA Inc
75000 (Nil) Equity Shares of Pagel Concrete Technologies Pvt Ltd
41.29
—
Others:
5.29
—
5.29
0.06
—
0.06
25 Equity Shares of Rs 10 each of New Usha Nagar Co-op Housing Society Ltd (Cost Rs 250)
—
—
10 Equity Shares of Rs 100 each of Taloja CETP Co-op Society Ltd (Cost Rs 1000)
—
—
765.65
230.86
400 Units of Rs 70000 each of Infinity Venture India Fund (Partly redeemed)
5.18
5.18
TOTAL - III
5.18
5.18
898.80
364.10
6.81
5.56
891.99
358.54
200200 Equity Shares of Rs 10 each of Enjayes Spices & Chemicals Oil Ltd
2275 Equity Shares of Re 1 each of Himalaya House Co-op Society Ltd (Cost Rs 2275)
628 Equity Shares of Rs 100 each of Jawahar Co-op Industrial Estate Ltd
40 Equity Shares of Rs 50 each of Regent Chambers Premises Co-op Society Ltd (Cost Rs 2000)
TOTAL - II (b)
—
—
III. In Units of Mutual Fund (Unquoted)
TOTAL : I + II (a) + II (b) + III
Less: Diminution in value of Investments
TOTAL
Previous year's figures are indicated in brackets only when there is a change.
Pidilite Annual Report 2006-07
29](https://image.slidesharecdn.com/annualreportproject-140121061259-phpapp02/85/Annual-report-project-31-320.jpg)
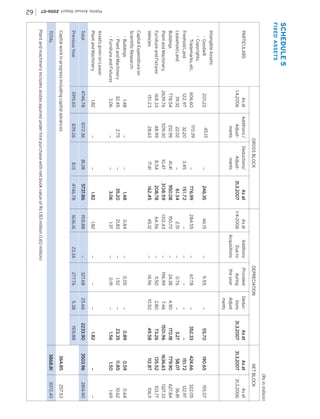
![(Rs in million)
As at
31st March 2007
As at
31st March 2006
SCHEDULE 7
CURRENT ASSETS, LOANS AND ADVANCES
A) Current Assets
a) Inventories
(As valued and certified by the Management)
Consumable Stores and Spares, etc.
Raw Materials
Goods in Process
Finished Goods
Traded Goods
Packing Materials
10.54
671.65
76.44
934.09
125.98
157
157.48
9.94
545.03
59.22
741.24
65.68
112.90
1976.18
b) Sundry Debtors (Unsecured)
Over six monthsConsidered good
Considered doubtful
Others, Considered good
Less : Provision for doubtful debts
17.
17.90
0.74
1300.23
18.53
0.11
1075.98
1318.87
0.74
1094.62
0.11
1318.13
c) Cash and Bank Balances
Cash and cheques on hand
Remittances in transit
Bank Balances:
With scheduled banks
In Current Accounts
Others:
In Fixed Deposit with Municipal Co-op Bank Ltd
[Maximum outstanding during the year Rs 0.03
million (Rs 0.03 million)]
1094.51
91.36
61.92
49.85
2.01
78.39
69.69
0.03
0.03
231.70
d) Other Current Assets
Interest Accrued on Investments
Claims Receivable
1534.01
121.58
—
21.7
21.74
0.09
23.02
21.7
21.74
TOTAL
23.11
576.61
B) Loans and Advances
(Unsecured, considered good)
Advances recoverable in cash or in kind or for value to be received
Advance Payment of Taxes (Net of Provisions)
Loans and Advances to Staff
Loans and Advance to Subsidiaries
Deposits
Balances with Central Excise Department
124.07
78.84
34.40
27.38
57.50
322.19
124
4124.36
3095.40
179.27
102.99
39.11
155.19
46.50
53.55
Pidilite Annual Report 2006-07
31](https://image.slidesharecdn.com/annualreportproject-140121061259-phpapp02/85/Annual-report-project-33-320.jpg)
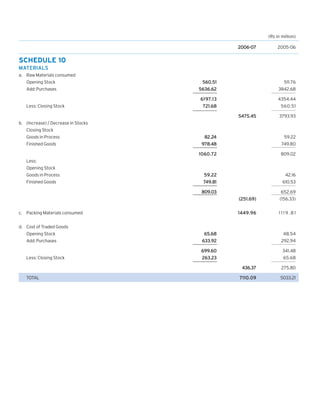
![(Rs in million)
As at
31st March 2007
As at
31st March 2006
30.89
24.68
SCHEDULE 8
CURRENT LIABILITIES AND PROVISIONS
A) Current Liabilities
Acceptances
Sundry Creditors (Refer Note 2 of Schedule 12)
Small and Medium Enterprises
Others
83.86
439.99
60.65
411.40
Dealers’ Deposits
523.85
154.58
472.05
132.75
Investor Education and Protection Fund shall be credited
by the following to the extent required as and when necessary :
Unclaimed Dividends
Other Liabilities
3.47
582.57
3.21
352.74
1295.36
985.43
50.41
38.77
B) Provisions
For Leave encashment
Dividends:
Proposed Dividend
Corporate Tax on Dividend
378.60
64.34
315.50
44.25
442.94
493.35
TOTAL
359.75
398.52
1788.71
1383.95
(Rs in Million)
2006-07
2005-06
15.35
11.66
0.64
3.29
19.11
50.66
10.34
90.92
—
56.56
5.90
18.30
12.33
—
69.71
0.35
190.31
174.81
SCHEDULE 9
OTHER INCOME
Interest received - (Gross)
[Tax deducted at source Rs 0.38 million (Rs 1.16 million)]
Insurance Claim Received
Dividend received
Export Incentives
Profit on sale of Fixed Assets
Foreign Exchange Fluctuation
Miscellaneous
Excess provisions written back
TOTAL](https://image.slidesharecdn.com/annualreportproject-140121061259-phpapp02/85/Annual-report-project-34-320.jpg)
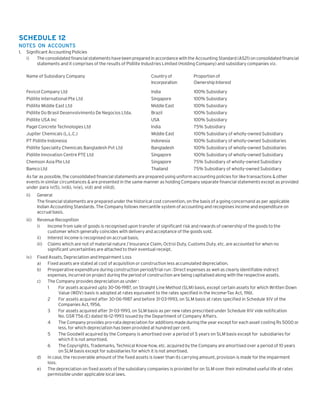
![(Rs in million)
2006-07
2005-06
50.32
441.16
13.13
126.38
9.93
40.19
351.99
13.02
95.55
8.61
SCHEDULE 11
OTHER EXPENSES
Stores and Spares consumed
Clearing, Forwarding, Octroi Duty, etc.
Central Excise Duty
Power and Fuel
Water Charges
Employees’ Emoluments: [Refer Notes 1 (vii), (viii), 6 and 7 of Schedule 12]
Salaries, Wages, Bonus, Allowances, etc.
Contribution to Provident and Other Funds
Welfare Expenses
Rent
Rates and Taxes
Insurance
Licence fees
Repairs :
Buildings
Machinery
Others
853.10
61.18
33.69
947.97
55.65
10.42
25.65
0.55
11.19
30.22
15.95
Donations
Diminution in value of Investments
[Refer Notes 1(vi) of Schedule 12]
Foreign Exchange Fluctuation
Loss on Fixed Assets Sold / Discarded
Interest
On Term Loan
Others
TOTAL
812.61
40.83
7.28
20.51
0.60
9.17
26.48
12.89
57.36
0.25
532.71
95.95
46.96
20.02
210.49
2.02
0.63
279.22
28.68
16.21
210.98
2.28
Directors' Fees
Advertisement and Publicity
Legal and Professional fees
Communication Expenses
Printing and Stationery
Travelling and Conveyance Expenses
Bad Debts
Provision for Doubtful Debts
Processing and Packing Charges
Bank Charges
Commission and Brokerage
Miscellaneous expenses
Scientific Research and Development Expenditure
[Refer Notes 1(v) of Schedule 12]
Remuneration to Auditors
Audit Fees (Including Tax Audit Fees)
For Other Services
724.37
56.98
31.26
1.88
0.98
48.54
0.14
394.19
80.82
41.42
15.85
177.32
4.58
0.11
224.32
23.17
17.17
172.26
2.79
1.47
1.46
2.86
95.80
1.25
2.93
46.97
—
—
5.70
9.64
1.62
22.12
40.59
—
14.65
.24
3353.24
2669.68](https://image.slidesharecdn.com/annualreportproject-140121061259-phpapp02/85/Annual-report-project-36-320.jpg)
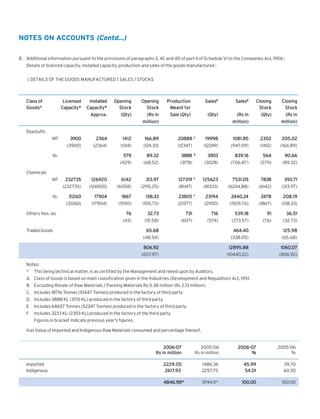
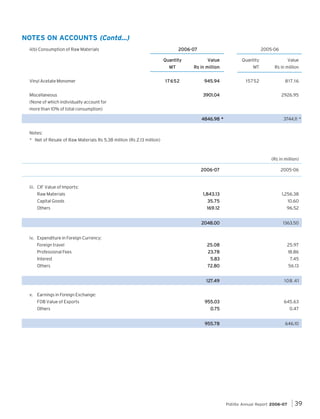
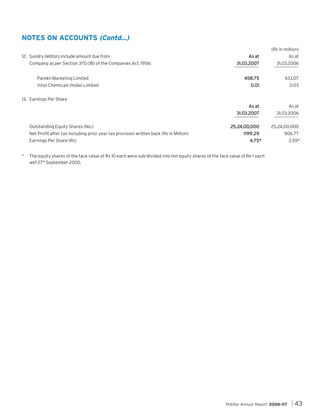
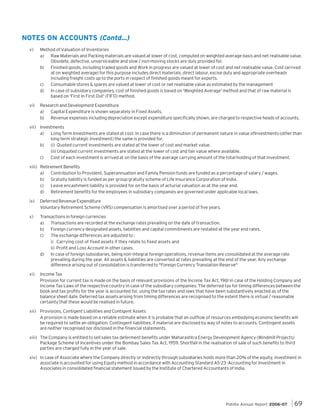
![NOTES ON ACCOUNTS (Contd...)
(Rs in million)
As at
31st March 2007
As at
31st March 2006
628.00
34.66
72.85
223.10
1.24
91.24
45.87
149.83
50.25
3. Contingent liabilities not provided for
i)
Guarantees given by Banks in favour of Government and others
ii)
Guarantees given by Company
[US $ 1.7 million (US $ 5 million)]
iii)
Disputed liabilities in respect of Income Tax, Sales Tax,
Central Excise and Customs (under appeal)
4. Estimated amount of contracts, net of advances, remaining
to be executed on capital account and not provided for
(Rs in million)
2006-07
(10.34)
9.64
33.14
26.89
40.32
34.32
1.68
2.95
3.47
1580.07
5. The net amount of exchange differences (credited) / debited
2005-2006
1346.89
to Profit and Loss Account
6. Remuneration to Directors:
(Includes benefits which are debited to respective expenses)
a.
Remuneration
b.
Commission
c.
Provident Fund Contribution
d.
Other Perquisites
1.47
7. Computation of Net Profit for Commission Payable to Directors
in accordance with Section 198 of the Companies Act, 1956.
Profit as per Profit and Loss Account before
Provision for taxation and commission to directors
Directors’ remuneration
33.14
26.89
Contribution to Provident Fund
Add:
1.68
2.95
1.47
Other Perquisites
3.47
37.77
31.83
61 7.
1 6 1 7. 8 4
1378.72
Profit / (Loss) on sale of investments
(0.02)
12.33
Profit / (Loss) on sale of fixed assets
Less:
44.98
(1.62)
1572.88
1368.01
37.92
32.32
2.40
2.00
40.32
34.32
Net Profit for the year for the purpose of Directors’ Commission
Commission payable to Directors
a) Managing Director, Joint Managing Director
and a Wholetime Director
b) Others
Pidilite Annual Report 2006-07
37](https://image.slidesharecdn.com/annualreportproject-140121061259-phpapp02/85/Annual-report-project-39-320.jpg)
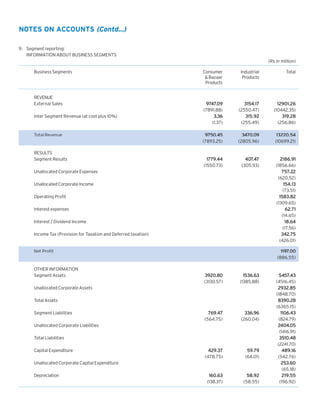
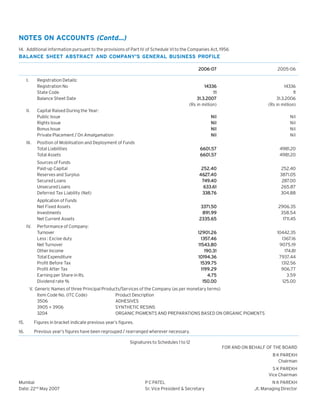
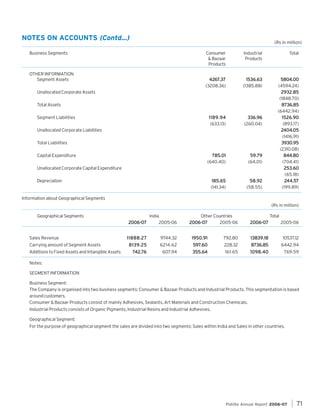
![Cash Flow Statement For The Year Ended 31
st
March 2007
(Rs in million)
2006-07
2005-06
A] CASH FLOW FROM OPERATING ACTIVITIES
1539.75
Net Profit before taxation
1312.56
302.66
274.78
1.25
62.71
—
14.65
Dividend received
(3.29)
(5.90)
Interest received
(15.35)
2.43
(11.66)
Adjustment for Depreciation
Additional Provision for Diminution in value of Investments
Interest paid
Amortisation of VRS compensation
2.43
(44.98)
1.62
(12.33)
Provision for Diminution in value of Investments written back
0.02
—
Bad debts w/off / provision for doubtful debts
2.65
4.69
(Profit) / Loss on Sale of Assets
(Profit) / Loss on Sale of Investments
(0.35)
308.10
1847.85
1847.85
Operating Profit before Working Capital changes
267.93
1580.49
Working Capital changes :
Inventories (Inc) / Dec
Debtors (Inc) / Dec
(442.17)
(226.27)
(234.52)
(15.48)
Loans and Advances, etc. (Inc) / Dec
(228.90)
24.90
321.31
171.23
Current Liabilities Inc / (Dec)
(576.03)
1271.82
Cash generated from operations
(53.87)
1526.62
15.35
(62.71)
Income Tax paid (Net)
2.00
(330.73)
Subsidy Received
(14.65)
—
Interest received
Interest paid
(405.03)
11.66
(378.09)
893.73
Net Cash flow from Operating Activities
(406.02)
1120.60
B] CASH FLOW FROM INVESTING ACTIVITIES
Purchase of Fixed Assets
(822.28)
(616.24)
Sale of Fixed Assets
99.45
(1507.26)
(1507.26)
(1132.36)
Purchase of Investments
1.05
972.54
3.29
Sale of Investments
Dividend received
Net Cash flow from Investing Activities
Carried Forward
970.82
5.90
(1254.26)
(770.83)
(360.53)
349.77
Pidilite Annual Report 2006-07
45](https://image.slidesharecdn.com/annualreportproject-140121061259-phpapp02/85/Annual-report-project-47-320.jpg)
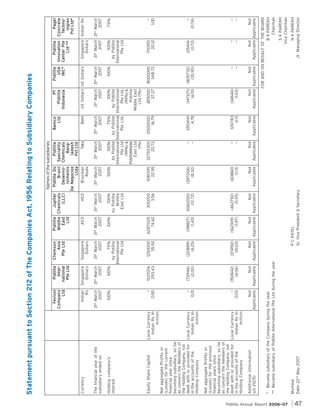
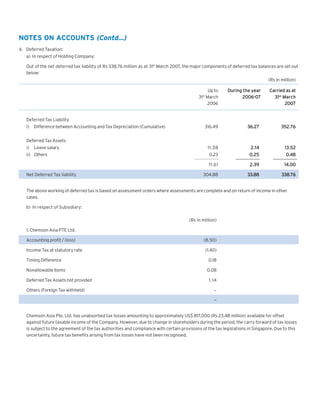
![(Rs in million)
2006-07
(360.53)
Brought Forward
2005-06
349.77
C] CASH FLOW FROM FINANCING ACTIVITIES
57.72
250.00
52.34
(Repayment) / Increase of long term borrowings - Bank
(Decrease) / Increase in Short term Borrowings - Bank
212.40
127.62
310.02
(236.80)
(359.49)
(287.98)
(Repayment) / Increase of long term borrowings
—
(Repayment) / Increase of Short Term Borrowings Foreign Currency Loan
Dividend paid (Including Dividend Tax, where applicable)
470.65
(344.82)
110.12
Net Cash Flow from Financing activities
4.95
Net Increase in Cash and Cash Equivalents
121.58
231.70
Cash and Cash Equivalents as at 01.04.2006
Cash and Cash Equivalents as at 31.03.2007
116.63
121.58
110.12
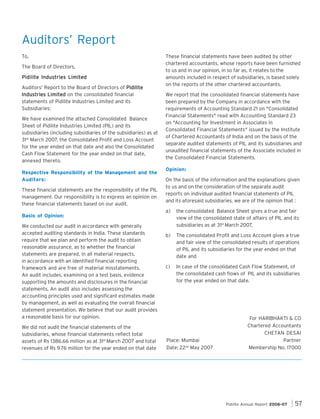
AS PER OUR ATTACHED REPORT OF EVEN DATE
4.95
FOR AND ON BEHALF OF THE BOARD
For HARIBHAKTI & CO
B K PAREKH
Chartered Accountants
Chairman
CHETAN DESAI
S K PAREKH
Partner
Vice Chairman
Mumbai
P C PATEL
Date: 22nd May 2007
Sr. Vice President & Secretary
N K PAREKH
Jt. Managing Director](https://image.slidesharecdn.com/annualreportproject-140121061259-phpapp02/85/Annual-report-project-48-320.jpg)
![(Rs in million)
As at
31st March 2007
As at
31st March 2006
0.01
0.10
117.8
.83
117.83
117.83
(9.52)
35.87
0.96
(9.52)
42.13
(6.25)
145.14
144.19
0.09
0.72
0.77
1.21
2.96
4.38
0.09
0.72
0.77
1.21
2.96
4.38
155.27
154.32
5.29
5.29
SCHEDULE 6
LONG TERM INVESTMENTS (AT COST)
In Government Securities (Unquoted)
6 and 7 Years National Savings Certificates
(Deposited with Government Departments, Mumbai Municipal
Corporation, Reliance Energy Ltd)
II. In Equity Shares (Fully paid)
Equit Share (Fully
quity
a) Quoted
Trade:
• 7451540 Equity Shares of Rs 10 each of Vinyl Chemicals (India) Ltd
Add : Adjustment for valuation of investment in Vinyl Chemicals (India) Ltd
Goodwill (net) arising at the time of acquisition of shares
Share of undistributed profits / losses in prior years up to 31st March 2004
Share of profit/(loss) for current year
I.
•
•
•
•
•
•
Others:
3594 Equity Shares of Rs 10 each of Hindustan Adhesives Ltd
14400 Equity Shares of Rs 10 each of Hindustan Organic Chemicals Ltd
4188 Equity Shares of Rs 10 each of Indian Petrochemicals Corporation Ltd
121300 Equity Shares of Rs 10 each of Pal Peugeot Ltd
222542 Equity Shares of Rs 10 each of Indian Overseas Bank Ltd
61900 Equity Shares of Rs 10 each of Menon Pistons Ltd
[Market Value Rs 97.56 million (Rs 135.38 million)]
TOTAL - II (a)
b) Unquoted (Fully paid)
Unquot (Fully
•
•
•
•
•
•
200200 Equity Shares of Rs 10 each of Enjayes Spices & Chemicals Oil Ltd
2275 Equity Shares of Re 1 each of Himalaya House Co-op. Society Ltd (Cost Rs 2275)
628 Equity Shares of Rs 100 each of Jawahar Co-op Industrial Estate Ltd
40 Equity Shares of Rs 50 each of Regent Chambers Premises Co-op Society Ltd (Cost Rs 2000)
25 Equity Shares of Rs 10 each of New Usha Nagar Co-op Housing Society Ltd (Cost Rs 250)
10 Equity Shares of Rs 100 each of Taloja CETP Co-op Society Ltd (Cost Rs 1000)
_
_
0.06
0.06
_
_
_
_
_
_
TOTAL - II (b)
III. In Units of Mutual Fund (Unquoted)
Units of Mutual Fund (Unquot
• 400 Units of Rs 70000 each of Infinity Venture India Fund (Partly Redeemed)
• 16775.146 (16775.146) Units of Grindlays Super Saver Fund
5.35
5.35
5.18
0.23
5.18
0.23
TOTAL - III
5.41
5.41
TOTAL : I + II (a) + II (b) + III
Less: Diminution in value of Investments
166.04
6.81
165.18
5.56
TOTAL
159.23
159.62
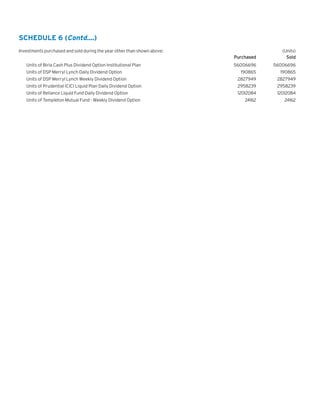
Purchased
56006696
190865
2827949
2958239
12012084
24162
(Units)
Sold
56006696
190865
2827949
2958239
12012084
24162
Previous year’s figures are indicated in brackets only when there is a change.
Investments purchased and sold during the year other than shown above:
Units of Birla Cash Plus Dividend Option Institutional Plan
Units of DSP Merryl Lynch Weekly Dividend Option
Units of DSP Merryl Lynch Weekly Dividend Option
Units of Prudential ICICI Liquid Plan Daily Dividend Option
Units of Reliance Liquid Fund Daily Dividend Option
Units of Templeton Mutual Fund Weekly Dividend Option
Pidilite Annual Report 2006-07
63](https://image.slidesharecdn.com/annualreportproject-140121061259-phpapp02/85/Annual-report-project-65-320.jpg)
![(Rs in million)
As at
31st March 2007
As at
31st March 2006
SCHEDULE 7
CURRENT ASSETS, LOANS AND ADVANCES
A) Current Assets
a) Inventories (As valued and certified by the Management)
Consumable Stores and Spares, etc.
Raw Materials
Goods in Process
Finished Goods
Traded Goods
Packing Materials
10.54
721.68
2.24
82.24
978.48
263.23
157
157. 4 8
9.94
560.51
59.22
749.81
65.68
112.90
2213.65
b) Sundry Debtors (Unsecured)
Over six months Considered good
Considered doubtful
Others, Considered good
Less : Provision for doubtful debts
17.93
17.
1.04
1561.95
18.53
0.58
1114.84
1580.92
1.04
1133.95
0.58
1579.88
c) Cash and Bank Balances
Cash and cheques on hand
Remittances in transit
Bank Balances:
With scheduled banks
In Current Accounts
In Deposits
Others:
In Fixed Deposit with Municipal Co-op. Bank Ltd.
[Maximum outstanding during the year Rs 0.03 million
(Rs 0.03 million)]
49.91
2.01
227.78
_
103.50
5.71
0.03
0.03
_
161.16
0.09
23.01
21.7
21.74
21.7
21.74
B) Loans and Advances
(Unsecured, considered good)
Advances recoverable in cash or in kind or for
value to be received
Advance Payment of Taxes (Net of Provisions)
Loans and Advances to Staff
Deposits
Balances with Central Excise Department
1133.37
91.64
61.92
381.37
d) Other Current Assets
Interest Accrued on Investments
Claims Receivable
1558.06
260.54
102.98
39.11
53.30
53.55
23.10
130.06
76.94
34.40
31.17
57.40
509.48
TOTAL
329.97
4706.12
3205.66](https://image.slidesharecdn.com/annualreportproject-140121061259-phpapp02/85/Annual-report-project-66-320.jpg)
![(Rs in million)
As at
31st March 2007
As at
31st March 2006
30.89
24.68
SCHEDULE 8
CURRENT LIABILITIES AND PROVISIONS
A) Current Liabilities
Acceptances
Sundry Creditors
Small and Medium Enterprises
Others
83.86
8.34
748.34
60.65
439.53
832.20
154.58
367.99
163 .89
1637.89
1028.81
50.41
Other Liabilities
3.21
616.75
Investor Education and Protection Fund shall be credited
by the following to the extent required as and when necessary:
Unclaimed Dividends
132.75
3.47
Dealers’ Deposits
500.18
38.77
B) Provisions
For Leave encashment
Dividends:
Proposed Dividend
Corporate Tax on Dividend
378.60
64.34
315.50
44.25
442.94
493.35
TOTAL
359.75
398.52
2131.2
1.24
213 1.24
1427.33
(Rs in million)
2006-07
2005-06
11.40
11.91
Insurance Claim Received
0.64
56.56
Dividend received
3.29
5.90
Export Incentives
19.11
18.30
Profit on sale of Fixed Assets
50.66
12.33
Foreign Exchange Fluctuation
9.14
_
94.50
70.87
_
0.36
188.7
188.74
176.23
SCHEDULE 9
OTHER INCOME
Interest received (Gross)
[Tax deducted at source Rs 0.38 million (Rs 1.16 million]
Miscellaneous
Excess provisions written back
TOTAL
Pidilite Annual Report 2006-07
65](https://image.slidesharecdn.com/annualreportproject-140121061259-phpapp02/85/Annual-report-project-67-320.jpg)
![(Rs in million)
2006-07
2005-06
50.32
489.91
13.13
126.38
9.93
40.19
356.83
13.02
95.55
8.61
SCHEDULE 11
OTHER EXPENSES
Stores and Spares consumed
Clearing, Forwarding, Octroi Duty, etc.
Central Excise Duty
Power and Fuel
Water Charges
Employees’ Emoluments: [Refer Notes 1 (viii), (ix), of Schedule 12]
Salaries, Wages, Bonus, Allowances, etc.
Contribution to Provident and Other Funds
Welfare Expenses
Rent
Rates and Taxes
Insurance
Licence fees
Repairs:
Buildings
Machinery
Others
Directors’ Fees
Advertisement and Publicity
Legal and Professional fees
Communication Expenses
Printing and Stationery
Travelling & Conveyance Expenses
Bad Debts
Provision for Doubtful Debts
Processing and Packing Charges
Bank charges
Commission & Brokerage
Miscellaneous expenses
Scientific Research and Development Expenditure
[Refer Note 1(vi) of Schedule 12]
Remuneration to Auditors
Audit Fees (Including tax audit fees)
For Other Services
Donations
Diminution in value of Investments
[Refer Notes 1(vii) of Schedule 12]
Foreign Exchange Fluctuation
Loss on Fixed Assets Sold/Discarded (Net)
Interest
On Term Loan
Others
TOTAL
991.72
61.18
.62
37.62
755.60
56.98
32.45
1090.52
80.44
11.21
29.94
0.60
11.19
32.08
16.32
845.03
45.89
7.44
20.75
0.71
9.17
26.48
13.05
59.59
0.73
582.20
116.44
55.86
20.71
229.35
4.50
0.46
335.77
29.51
35.38
223.71
3.09
48.70
0.24
396.63
80.40
42.88
16.18
180.88
4.77
0.58
245.30
23.41
17.34
176.62
3.10
6.51
0.98
2.05
1.46
7.49
95.81
1.25
3.51
47.10
_
5.90
9.64
1.62
22.12
44.23
15.41
3776.48
2748.33
_
_
Pidilite Annual Report 2006-07
67](https://image.slidesharecdn.com/annualreportproject-140121061259-phpapp02/85/Annual-report-project-69-320.jpg)
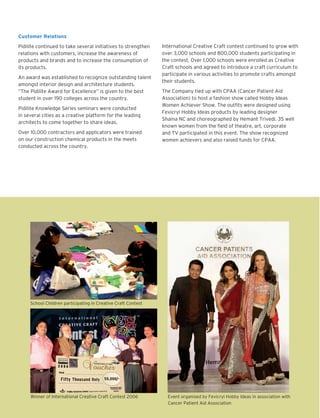
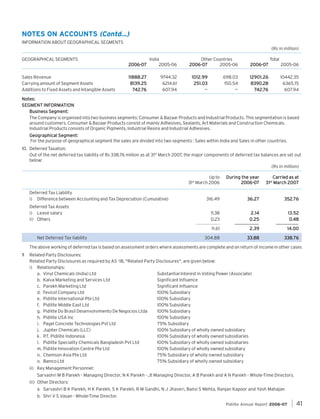
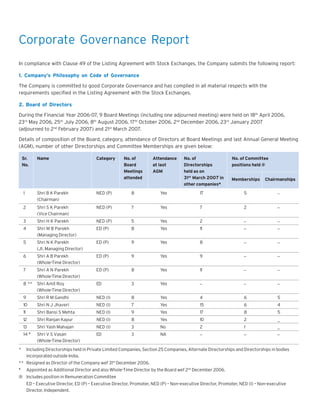
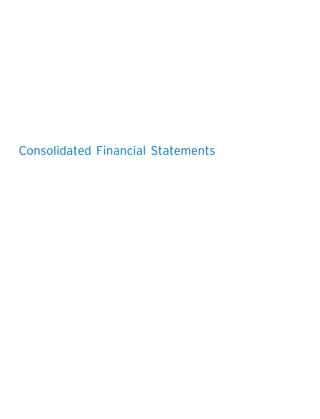
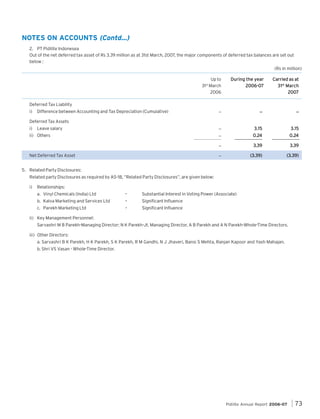
![NOTES ON ACCOUNTS (Contd...)
xv) The Associate Company considered in the financial statements is
Country of
Incorporation
Vinyl Chemicals (India) Ltd
Proportion of
Ownership Interest
India
40.64%
(Rs in million)
As at
31st March 2007
2. Contingent liabilities not provided for
i)
Guarantees given by Banks in favour of Government and others
ii)
Guarantees given by Company
As at
31st March 2006
629.21
34.66
72.85
223.10
1.24
91.24
45.87
[US $ 5 million (US $ 5 million)]
iii)
Disputed liabilities in respect of Income Tax, Sales Tax,
Central Excise and Customs (under appeal)
3. Segment reporting:
Information about Business Segments
Business Segments
REVENUE
External Sales
Inter Segment Revenue (at cost plus 10%)
Total Revenue
RESULTS
Segment Results
Unallocated Corporate Expenses
Unallocated Corporate Income
Operating Profit
Interest Expenses
Interest / Dividend Income
Income Tax (Provision for Taxation and Deferred Taxation)
Net Profit
(Rs in million)
Consumer
& Bazaar
Products
Industrial
Products
Total
10685.01
(7986.65)
3.36
(1.37)
3154.17
(2550.47)
315.92
(255.49)
13839.18
(10537.12)
319.28
(256.86)
10688.37
(7988.02)
3470.09
(2805.96)
14158.46
(10793.98)
1703.49
(1540.95)
407
407.47
(305.93)
2110.96
(1846.88)
.22
757.22
(635.91)
154.13
(73.52)
1507.87
1507.87
(1284.49)
66.35
(15.41)
14.69
(17.81)
342.73
(426.10)
1113.48
(860.79)](https://image.slidesharecdn.com/annualreportproject-140121061259-phpapp02/85/Annual-report-project-72-320.jpg)
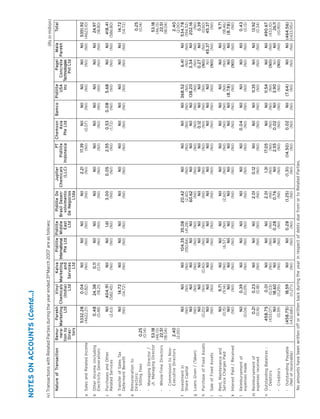
![Cash Flow Statement For The Year Ended 31st March 2007
(Rs in million)
2006-07
2005-06
A] CASH FLOW FROM OPERATING ACTIVITIES
1,4
1,457.9 1
Net Profit before taxation
1286.90
327.68
277.76
_
Interest paid
1.25
66.35
15.41
Dividend received
(3.29)
(5.90)
Interest received
(11.40)
2.54
(11.91)
Amortisation of VRS compensation
(Profit) / Loss on Sale of Assets
(45.00)
1.61
.24
0.24
(12.33)
_
(0.35)
4.96
5.35
Adjustment for Depreciation
Additional Provision for Diminution in value of Investments
(Profit) / Loss on Sale of Investments
Provision for Diminution in value of Investments written back
Bad debts w/off / provision for doubtful debts
2.43
343.33
1,801.24
1,801.24
Operating Profit before Working Capital changes
272.07
1558.97
Working Capital changes :
Debtors (Inc) / Dec
(655.59)
(451.47)
Loans and Advances, etc. (Inc) / Dec
(152.11)
15.87
619.54
211.64
Inventories (Inc) / Dec
Current Liabilities Inc / (Dec)
(254.49)
(41.13)
(639.63)
(68.11)
1,161.61
Cash generated from operations
1490.86
11.40
Interest paid
11.91
(66.35)
Interest received
(15.41)
_
Income Tax paid (Net)
2.00
(335.99)
Subsidy Received
(403.15)
(390.94)
770.67
Net Cash flow from Operating Activities
(404.65)
1086.21
B] CASH FLOW FROM INVESTING ACTIVITIES
Purchase of Fixed Assets
(1,178.51)
(754.65)
Sale of Fixed Assets
Purchase of Investments
99.45
(973.64)
(937.84)
Sale of Investments
972.54
970.82
3.29
5.90
Dividend received
Net Cash flow from Investing Activities
Carried Forward
1.13
(1,076.87)
(714.64)
(306.20)
371.57
Pidilite Annual Report 2006-07
75](https://image.slidesharecdn.com/annualreportproject-140121061259-phpapp02/85/Annual-report-project-77-320.jpg)
![(Rs in million)
2006-07
(306.20)
Brought Forward
2005-06
371.57
C] CASH FLOW FROM FINANCING ACTIVITIES
57.72
52.34
290.30
_
22
227.86
310.02
131.80
(287.97)
(359.49)
(248.16)
(Repayment) / Increase of long term borrowings
(Repayment) / Increase of Short term Borrowings Commercial Paper
(Decrease) / Increase in Short term Borrowings - Bank
Dividend paid (Including dividend tax, where applicable)
(Repayment) / Increase of Short term Borrowings Foreign Currency Loan
Net Cash Flow from Financing Activities
526.41
(351.99)
Net Increase in Cash and Cash Equivalents
220.21
19.58
Cash and Cash Equivalents as at 1st April 2006
161.16
141.58
Cash and Cash Equivalents as at 31st March 2007
381.37
161.16
220.21
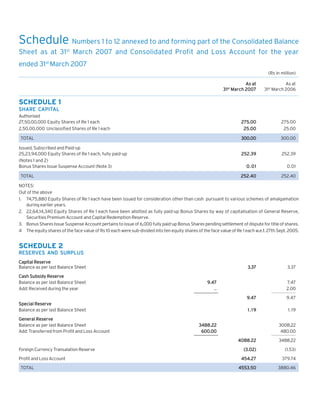
AS PER OUR ATTACHED REPORT OF EVEN DATE
19.58
FOR AND ON BEHALF OF THE BOARD
For HARIBHAKTI & CO
Chartered Accountants
B K PAREKH
Chairman
CHETAN DESAI
S K PAREKH
Partner
Vice Chairman
Mumbai
P C PATEL
Date: 22nd May 2007
Sr. Vice President & Secretary
N K PAREKH
Jt. Managing Director](https://image.slidesharecdn.com/annualreportproject-140121061259-phpapp02/85/Annual-report-project-78-320.jpg)


This document is the annual report of Pidilite Industries Limited for the fiscal year 2006-2007. Some key points: - Pidilite achieved 23.5% growth in gross sales and 32.3% growth in profit after tax on a standalone basis. On a consolidated basis, sales grew 31.3% and profit after tax grew 26.6%. - Branded consumer and bazaar products contributed 76% of total sales and grew 23.5%. Adhesives and sealants grew 22.1% and contributed 54% of sales. - Exports of consumer products grew 60.1% and exports of specialty chemicals grew 33.3% with progress made in expanding distribution networks in


