Downloaded 54 times

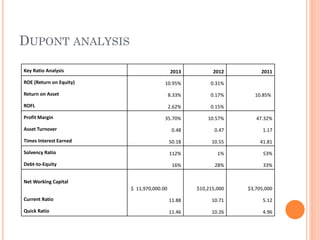
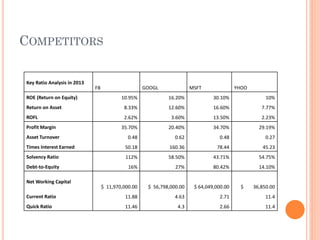
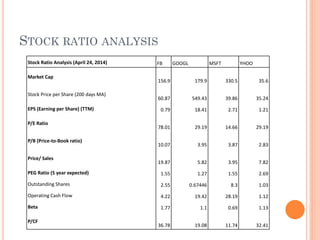
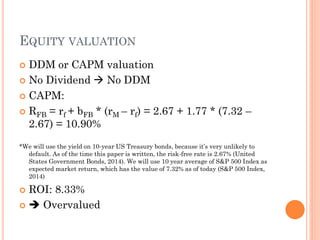
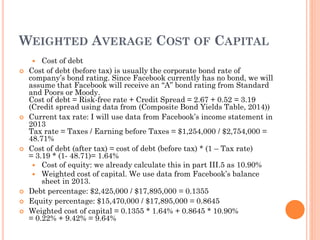

The document presents a comprehensive financial analysis of Facebook Inc., including key ratios and comparisons with competitors like Google, Microsoft, and Yahoo from 2011 to 2013, highlighting metrics such as return on equity, profit margins, and asset turnover. It also discusses stock ratios, capital asset pricing model (CAPM), and weighted average cost of capital calculations, revealing insights into Facebook's valuation and cost of debt. Additionally, the document compares operating cash flows and market capitalization among the companies analyzed.


