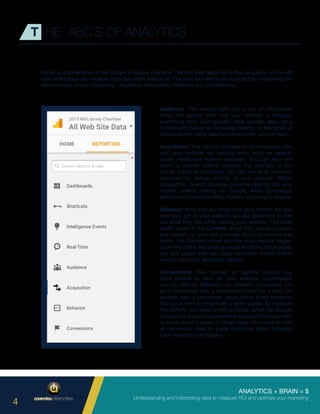
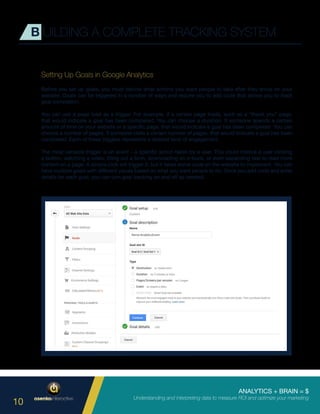
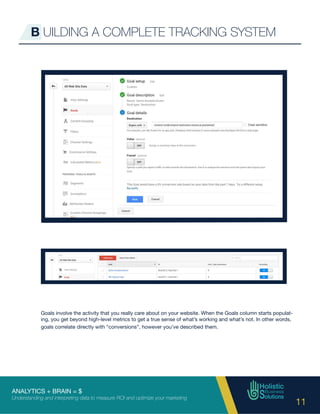
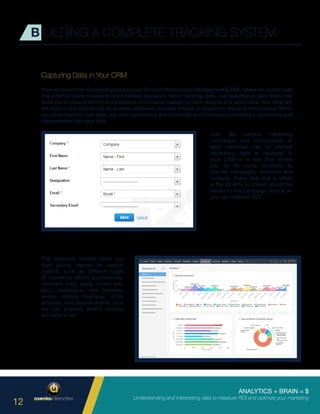
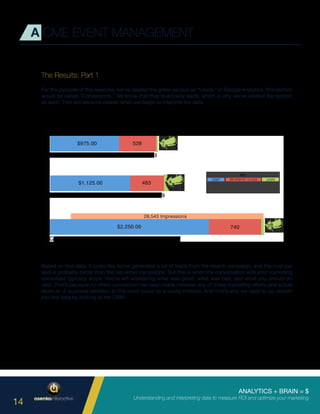
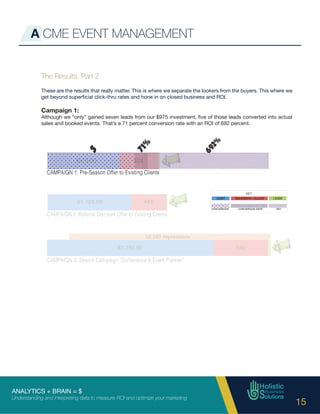
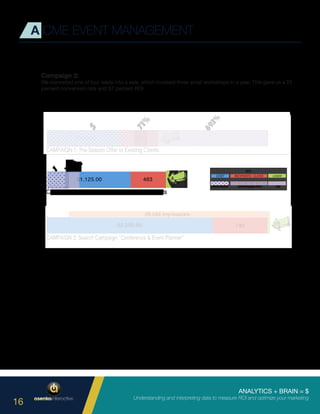
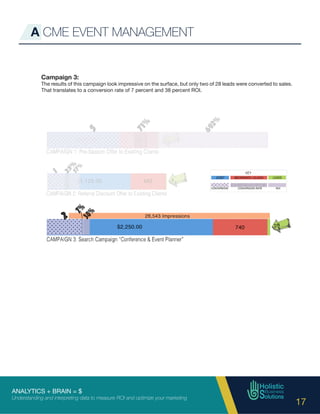
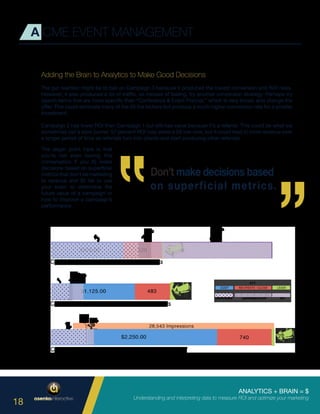
ANALYTICS + BRAIN = $
Understanding and interpreting data to measure ROI and optimize your marketing
1
ANALYTICS + BRAIN = $
Understanding and interpreting data to measure ROI and optimize your marketing
2
I NTRODUCTION
Everyone has the ability to access data analytics. Everyone has a brain. That means everyone has the
tools required to measure the value of a digital marketing campaign. What’s often missing is a strategy
that allows you to make sense of readily available data and apply it to your marketing.
Without a strategy, marketing often creates more questions than it answers. For example, your marketing
consultant might tell you that your most recent campaign drove 300 paid visits to your website last
month, traffic is up 10 percent, and the search ranking for your most important keyword improved by
three positions.
Cue the fist pumps and high fives. 10 seconds later, cue the puzzled facial expressions when someone
wonders aloud, “So, how much revenue did this bring in?”
What do all those clicks and rankings mean in
terms of revenue? How do you know if your
money is being spent wisely? Can you make a
direct correlation between dollars spent, leads
generated and sales closed?
Typically, those questions go unanswered.
The goal of marketing is to generate leads, drive sales and increase revenue. Basic, high-level metrics
like clicks and search rankings are helpful, but they don’t tell you how well your marketing is really
working.
This white paper will show you:
•	 The basics of Google Analytics.
•	 Key metrics for monitoring the progress and measuring the results of your digital marketing
campaigns.
•	 Why the integration of Google Analytics and customer relationship management (CRM) data
is critical to determining the true value of each campaign.
•	 A hypothetical example that illustrates the importance of digging deeper into this data so you
can make intelligent marketing decisions.
ANALYTICS + BRAIN = $
Understanding and interpreting data to measure ROI and optimize your marketing
3
T HE ABC’S OF ANALYTICS
In this section, we’ll introduce you to
basic terms and definitions used by
Google Analytics.
For the purposes of this white paper, we’ll focus
on the terminology, capabilities and data available
through Google Analytics. There are other platforms
available for tracking, measuring and reporting
data, but Google Analytics is the most widely used
analytics service on the internet. It’s free and easy
to install, and it offers robust data for marketing
analysis.
To get started, you sign up for Google Analytics
with basic information about the site you’d like to
monitor. You’ll get a tracking code to paste onto
your website pages. That tracking code sends data
to Google so it knows when your site has been
visited. Within hours, you’ll begin to see data about
your website traffic and visitors.
To the right are some basic terms to understand
when using Google Analytics.
Session: A single person’s single visit to your
website. This can include multiple interactions
and pageviews. If someone leaves your website
and returns later, that begins a second session.
Pageviews: The number of times a specific
web page is seen.
Bounce: This occurs when someone leaves
your website without interacting with the land-
ing page. In other words, they land on a page
and don’t click or type anything before “bounc-
ing” away.
Direct Traffic: Traffic that comes to a web page
after someone types your URL in the browser.
Referral Traffic: Traffic that comes to a web
page after someone clicks a link on a brows-
er interface, which then loads the URL in the
browser. Referral traffic comes from a variety of
sources, such as search engines, social media
and advertisements.
Keep in mind that traffic classification can be a little dicey with email. For example, if someone clicks a link
in an email application such as Microsoft Outlook, a browser will automatically open with your URL in it. This
will be interpreted as direct traffic by Google Analytics. If someone clicks a link in a browser-based email
platform such as Gmail, this will be interpreted as referral traffic. This is why the proper use of tracking links
is so important. We’ll discuss this later in greater detail.
ANALYTICS + BRAIN = $
Understanding and interpreting data to measure ROI and optimize your marketing
4
T HE ABC’S OF ANALYTICS
Below is a screenshot of the Google Analytics interface. The first four headings in the navigation on the left
side of the page are valuable tools but rather advanced. The next four are most important for measuring the
effectiveness of your marketing – Audience, Acquisition, Behavior and Conversions.
Audience: This section tells you a ton of information
about the people who visit your website. It includes
everything from demographic data (gender, age, etc.),
to interests (based on browsing history), to the types of
mobile device being used to interact with your content.
Acquisition: This section focuses on where people who
visit your website are coming from, such as search,
social media and referral websites. You can also drill
down to specific referral sources. For example, if you
run an AdWords campaign, you can see what someone
searched for before arriving at your website. Within
Acquisition, Search Console provides insights into your
organic search ranking on Google, while Campaigns
specifically tracks the traffic that you’re paying to acquire.
Behavior: Now that we know who your visitors are and
how they got to your website, we use Behaviors to find
out what they did while visiting your website. The most
useful report is Top Content, which tells you what pages
and content on your site generate the most interest and
traffic. Top Content shows you the most popular pages,
click-thru paths, top landing pages (if not the home page),
top exit pages (the last page someone visited before
leaving your site), and other metrics.
Conversions: This focuses on specific actions you
want people to take on your website. Conversions
can be defined differently by different companies. On
an e-commerce site, a conversion could be a sale. On
another site, a conversion could occur when someone
fills out a form to download a white paper. To measure
this activity, you need to set up Goals, which tell Google
Analytics that a particular event is important and you need
to know about it (more on Goals later). It’s critical to look
at conversion data to guide decisions about targeting
your marketing campaigns.
ANALYTICS + BRAIN = $
Understanding and interpreting data to measure ROI and optimize your marketing
5
T HE ABC’S OF ANALYTICS
In this section, we’ll discuss developing a strategy for tracking your marketing, tracking
campaigns in Google Analytics, and integrating analytics data with your CRM.
There are three questions that should guide your tracking strategy.
Based on your business and marketing goals, what information do you need to collect?
Different types of data, such as email addresses, phone numbers, geographic location, and the age of the
user, will be more important to different types of companies and organizations. For example, customer
behavior, referral sources, keywords, and social media engagement are commonly tracked.
How do you collect data from people you reach with your marketing?
Depending on your business operations and target audience, data could be collected from registration forms,
downloads, point-of-sale/e-commerce, social media, coupons, referral sources, industry trends, surveys/
research studies, and networking.
What specific metrics will you track to measure success?
This will often be determined by whether you place greater emphasis on volume or value. For example, are
you more interested in generating a high volume of sales, or would you rather see higher value per sale?
ANALYTICS + BRAIN = $
Understanding and interpreting data to measure ROI and optimize your marketing
6
Marketing: Determine who you wish to reach and what you want to do with your marketing (Call to Action).
Collect: Identify the type of data you need to collect and how you’ll collect it.
Configure: Store the right data in a database within your CRM so you can use it to configure your marketing
campaigns.
Deploy: Deploy the campaigns
Tracking: Be sure to carefully track their progress by linking them to the neccesary related information
(lead source, sales, etc.).
Analyze: As your campaigns unfold, analyze the data and start to assess each campaign’s effectiveness.
Refine: Use this data analysis to refine your marketing efforts and restart the loop.
B UILDING A COMPLETE TRACKING SYSTEM
The Intelligent Loop
The graphic below shows the repeatable, intelligent loop that is followed when you take a strategic, analytics-
driven approach to marketing.
ANALYTICS + BRAIN = $
Understanding and interpreting data to measure ROI and optimize your marketing
7
Setting Up Tracking Codes
Google Analytics will help you determine how effectively you’re generating leads by delivering the right
message to the right audience. This is the job of marketing. Unfortunately, this is where most marketing
agencies stop. They tell you who is coming to your website and where they came from, and leave it to you
to figure out the rest.
But you also must determine how effectively you’re converting those leads into dollars. This is the job of
sales. What are people doing when they get to your website? What are the most important actions to track?
This will tell you what an effective marketing campaign should look like.
When you track and analyze data from both the marketing activity and sales activity, you’ll have the insights
required to make data-driven decisions at the end of the each cycle in the Intelligent Loop discussed
previously.
To accomplish this goal, you need to specify which outlet, effort, spend and channel are driving each visit so
you can compare the results. This requires you to build a campaign tracking tool, which is nothing more than
a fancy link to your website. The campaign tracking tool embeds very specific information about where that
link came from and sends details about the origin of the traffic to Google Analytics.
B UILDING A COMPLETE TRACKING SYSTEM
Google has a very simple
tool for doing this, called
the “Google Analytics
Campaign Builder” -
https://goo.gl/d52Nse.
You enter the destination
where you want to send
people and the parameters
you want to track. We
recommend using at least
three parameters – the
source, the vehicle, and
the campaign to which the
traffic is connected.
ANALYTICS + BRAIN = $
Understanding and interpreting data to measure ROI and optimize your marketing
8
Let’s walk through the setup using Google’s tool. We’ve created a fictitious campaign to show you what
tracking links look like. They may seem a bit long and scary at first, but they make more sense once you break
them down and understand what each part means.
For every marketing campaign, you typically have individual components that require their own custom
tracking URLs. It’s helpful to set up a spreadsheet with all components and tracking URLs so you can see
everything together when comparing data.
This organization’s hypothetical campaign includes multiple components:
•	 An internal email newsletter
•	 A package purchased from a local association, which includes a website banner, a text messaging
program, and a link in monthly email blasts to their clients
•	 Employee email signatures, which will promote the campaign
•	 A pay-per-click campaign on LinkedIn that targets a specific business audience
•	 A press release
B UILDING A COMPLETE TRACKING SYSTEM
The first part of the tracking URL
in (#1) is the link to your website,
landing page, or wherever you’re
sending people.
The second part of the tracking
URL in (#2) specifies the source –
newsletter, association, signature,
LinkedIn, and press. This identifies
the company you’re paying for
the advertising. If the source is
in-house, it identifies the internal
vehicle used to generate traffic.
The next part in (#3) beginning with “&” identifies the medium, or how the message is being delivered. This
is especially important for the association package, which is delivering the message in three ways – banner,
text and email. This way, we’ll know which part of the association package is responsible for the traffic we’re
receiving. In this campaign, we have a lot of distribution through email, but each custom tracking URL has a
different source so we can sort the data later.
The final part in (#4) beginning with the second “&” simply identifies the name of the overall campaign. Each
tracking URL is part of the same campaign, which is why they all have the same campaign name in our above
example. Keep in mind that you can run multiple campaigns simultaneously, each promoting a different offer
or initiative. In this case, you would assign each campaign a different name.
#1 #2 #3 #4
ANALYTICS + BRAIN = $
Understanding and interpreting data to measure ROI and optimize your marketing
9
So what do you do with these big fancy links? Use them in the appropriate component of your marketing
campaign. For example, if you direct people to click a certain link in your internal email newsletter, you
would use the first custom URL as the link. As intimidating as these links may appear, all you have to do
is build them correctly, put them in the right places, and let Google Analytics do the rest. This is where the
spreadsheet (see images below) becomes a useful reference.
B UILDING A COMPLETE TRACKING SYSTEM
ANALYTICS + BRAIN = $
Understanding and interpreting data to measure ROI and optimize your marketing
10
Setting Up Goals in Google Analytics
Before you set up goals, you must decide what actions you want people to take after they arrive on your
website. Goals can be triggered in a number of ways and require you to add code that allows you to track
goal completion.
You can use a page load as a trigger. For example, if a certain page loads, such as a “thank you” page,
that would indicate a goal has been completed. You can choose a duration. If someone spends a certain
amount of time on your website or a specific page, that would indicate a goal has been completed. You can
choose a number of pages. If someone visits a certain number of pages, that would indicate a goal has been
completed. Each of these triggers represents a desired level of engagement.
The most versatile trigger is an event – a specific action taken by a user. This could involve a user clicking
a button, watching a video, filling out a form, downloading an e-book, or even expanding text to read more
content on a page. A simple click will trigger it, but it takes some code on the website to implement. You can
have multiple goals with different values based on what you want people to do. Once you add code and enter
details for each goal, you can turn goal tracking on and off as needed.
B UILDING A COMPLETE TRACKING SYSTEM
ANALYTICS + BRAIN = $
Understanding and interpreting data to measure ROI and optimize your marketing
11
B UILDING A COMPLETE TRACKING SYSTEM
Goals involve the activity that you really care about on your website. When the Goals column starts populat-
ing, you get beyond high-level metrics to get a true sense of what’s working and what’s not. In other words,
goals correlate directly with “conversions”, however you’ve described them.
ANALYTICS + BRAIN = $
Understanding and interpreting data to measure ROI and optimize your marketing
12
Capturing Data in Your CRM
Now we move from Google Analytics to your Contact Relationship Management (CRM), where we collect data
that informs future marketing and business decisions. When entering data, use quantitative data fields that
allow you to choose from multiple options. This makes it easier to track, analyze and report data. Text fields are
the enemy here and should be avoided whenever possible in favor of dropdown lists and checkboxes. When
you allow users to type data, you lose consistency and uniformity and introduce unnecessary complexity and
interpretation into your data.
B UILDING A COMPLETE TRACKING SYSTEM
This becomes evident when you
start pulling reports on various
metrics, such as different types
of marketing efforts (conferences,
webinars, blog posts, online ads,
etc.), campaigns, new business
versus referral business, dollar
amounts, and periods of time. Now
we can pinpoint what’s working
and what’s not.
Just like various marketing
campaigns and components of
each campaign can be tracked
separately, data is captured in
your CRM in a way that allows
you to tie dollar amounts to
specific campaigns, accounts and
contacts. Every deal that is either
in the pipeline or closed should be
traced to the campaign source so
you can measure ROI.
ANALYTICS + BRAIN = $
Understanding and interpreting data to measure ROI and optimize your marketing
13
A CME EVENT MANAGEMENT
In this section, we’ll show you how combining Google Analytics and your brain
allows you to make smarter marketing decisions.
We created a fake event management company, Acme Event Management, that caters to B2B, B2C and
nonprofits. B2B events are typically conferences, workshops, seminars, etc. B2C focuses on tradeshows
and product launches. Nonprofits are geared towards galas, fundraisers and events of that nature. These are
three very different markets that require different types of marketing.
We created three fictitious marketing campaigns for our fake company to show how they would be tracked
in Google Analytics and the types of conclusions one might reach, depending on what data is analyzed and
how that data is interpreted. These campaigns are for the B2C sector, so a B2B or nonprofit campaign would
likely require a different approach.
Campaign 1 is an email campaign to existing clients. The goal is to book one large event per year for the fall
event season. The offer encourages recipients to book this year for next year’s event and receive this year’s
rate.
Campaign 2 is an email campaign to existing clients that have larger pools of resources. This campaign is
about referrals only. The offer is a discount on an upcoming event for every new client that the recipient refers
to Acme Event Management.
Campaign 3 is a pay-per-click search campaign in which “Conference & Event Planner” is the search term.
Show me
the money!
We set the codes, build the creative and
deploy the marketing. Then we say what
every responsible business owner should
say to their marketing agency:
ANALYTICS + BRAIN = $
Understanding and interpreting data to measure ROI and optimize your marketing
14
A CME EVENT MANAGEMENT
The Results: Part 1
For the purpose of this exercise, we’ve labeled the green section as “Leads.” In Google Analytics, this section
would be called “Conversions.” We know that they’re actually leads, which is why we’ve labeled the section
as such. This will become clearer when we begin to interpret the data.
Based on this data, it looks like Acme generated a lot of leads from the search campaign, and the cost per
lead is probably better than the two email campaigns. But this is when the conversation with your marketing
consultant typically stops. You’re left wondering what was good, what was bad, and what you should do
next. That’s because no direct connection has been made between any of these marketing efforts and actual
revenue. A business decision at this point could be a costly mistake. And that’s why we need to go deeper
into the data by looking at the CRM.
ANALYTICS + BRAIN = $
Understanding and interpreting data to measure ROI and optimize your marketing
15
A CME EVENT MANAGEMENT
The Results: Part 2
These are the results that really matter. This is where we separate the lookers from the buyers. This where we
get beyond superficial click-thru rates and hone in on closed business and ROI.
Campaign 1:
Although we “only” gained seven leads from our $975 investment, five of those leads converted into actual
sales and booked events. That’s a 71 percent conversion rate with an ROI of 692 percent.
ANALYTICS + BRAIN = $
Understanding and interpreting data to measure ROI and optimize your marketing
16
Campaign 2:
We converted one of four leads into a sale, which involved three small workshops in a year. This gave us a 25
percent conversion rate and 57 percent ROI.
A CME EVENT MANAGEMENT
ANALYTICS + BRAIN = $
Understanding and interpreting data to measure ROI and optimize your marketing
17
Campaign 3:
The results of this campaign look impressive on the surface, but only two of 28 leads were converted to sales.
That translates to a conversion rate of 7 percent and 38 percent ROI.
A CME EVENT MANAGEMENT
ANALYTICS + BRAIN = $
Understanding and interpreting data to measure ROI and optimize your marketing
18
A CME EVENT MANAGEMENT
Adding the Brain to Analytics to Make Good Decisions
The gut reaction might be to bail on Campaign 3 because it produced the lowest conversion and ROI rates.
However, it also produced a lot of traffic, so instead of bailing, try another conversion strategy. Perhaps try
search terms that are more specific than “Conference & Event Planner,” which is very broad, and change the
offer. This could eliminate many of the 26 tire kickers but produce a much higher conversion rate for a smaller
investment.
Campaign 2 has lower ROI than Campaign 1 but still has value because it’s a referral. This could be what we
sometimes call a slow burner. 57 percent ROI may seem a bit low now, but it could lead to more revenue over
a longer period of time as referrals turn into clients and start producing other referrals.
The larger point here is that
you’re not even having this
conversation if you A) make
decisions based on superficial
metrics that don’t tie marketing
to revenue and B) fail to use
your brain to determine the
future value of a campaign or
how to improve a campaign’s
performance.
ANALYTICS + BRAIN = $
Understanding and interpreting data to measure ROI and optimize your marketing
19
C ONCLUSION
Good marketing is made before you start marketing
Toomanybusinessownersjumpintomarketingwithoutdevelopingastrategicplan.Youcanhaveaphenomenal
product or service. You can have brilliant messaging, breathtaking imagery, a perfectly functioning and user-
friendly website, and a substantial budget. But if you don’t have a plan, you can expect to waste marketing
dollars and lose opportunities to your competition.
Before you start marketing, you need to:
•	 Identify specific goals
•	 Identify a specific target audience
•	 Determine what you want that audience to do
•	 Determine what data you need to collect
•	 Determine how you should collect that data
•	 Identify key metrics to measure the effectiveness of your campaigns
•	 Learn how to interpret meaningful data
This will allow you to connect the dots between marketing and revenue. When you devote time and resources
to strategic planning, marketing becomes less about guesswork and more about testing educated hypotheses.
Based on the results, you can then use your brain to adapt your strategy and restart the cycle.
If you still feel a little overwhelmed by Google Analytics, CRM, and how to make sense of all the data housed
in these platforms, that’s okay. At this point, it’s more important to understand the overall concepts and the
importance of a strategic marketing plan than the specific steps involved in setting up and executing your
campaigns.
Remember, the analytics tools are there. The data is there. Your brain is there.
Everything you need to be a successful marketer is either at your fingertips or sitting on your shoulders. If you
take the time to plan at the beginning of the process, you can make smart decisions that drive revenue and
maximize every marketing dollar.
ANALYTICS + BRAIN = $
Understanding and interpreting data to measure ROI and optimize your marketing
20
ABOUT THE AUTHORS
Brian Hasenkamp, President
Asenka Interactive
P: (609) 249-2700
E: brian@asenka.com
www.asenka.com
Coming up through the ranks of Direct Mail, Publishing and Traditional Advertising Agencies,
Brian got a feel for process, the good and bad and took it all in for about 10 years. He noticed
a distinct lack of solid defensible rationale in the creative being developed and rolled out.
Brian sought to find a place where his passion for logic and data could enhance his creative
pursuits.
Everything began to gel when the digital market took off around the millennium. Brian started
down the path of all things digital, without leaving his past behind. Brian started his own
agency in 2002 and has steadily grown with the technology. He leverages his creative training
with his understanding of digital tracking tools to deploy his own matrix for analyzing the
effectiveness of digital campaigns.
ANALYTICS + BRAIN = $
Understanding and interpreting data to measure ROI and optimize your marketing
21
ABOUT THE AUTHORS
Sheri Kurdakul, President
Holistic Business Solutions LLC
P: (609) 557-7377
E: sheri@HolisticBusinessSolutions.com
www.HolisticBusinessSolutions.com
SheriKurdakulisPresidentofHolisticBusinessSolutions,aCRMconsultingfirmthatspecializes
in small organizations looking to better manage their business processes in order to increase
efficiencies and profits. They are based in Trenton, NJ. A leader in data and business process
management, Sheri provides her clients with the tools and knowledge to effectively manage
marketing, sales and customer care through information and technology. With expertise in
knowledge management, process automation, case management, business intelligence,
Customer Relationship Management (CRM) applications, and sales and order management,
Sheri and her team develop and implement affordable enterprise cloud solutions to generate
more effective and efficient customer and client experiences.
ANALYTICS + BRAIN = $
Understanding and interpreting data to measure ROI and optimize your marketing
22
Copyright January 2017
All rights of any nature reserved. No part of this publication may be reproduced or transmitted in any
form or by any means, electronic or mechanical, without written permission from the copyright owners.

Analytics + Brain = $

  • 1.
    ANALYTICS + BRAIN= $ Understanding and interpreting data to measure ROI and optimize your marketing 1
  • 2.
    ANALYTICS + BRAIN= $ Understanding and interpreting data to measure ROI and optimize your marketing 2 I NTRODUCTION Everyone has the ability to access data analytics. Everyone has a brain. That means everyone has the tools required to measure the value of a digital marketing campaign. What’s often missing is a strategy that allows you to make sense of readily available data and apply it to your marketing. Without a strategy, marketing often creates more questions than it answers. For example, your marketing consultant might tell you that your most recent campaign drove 300 paid visits to your website last month, traffic is up 10 percent, and the search ranking for your most important keyword improved by three positions. Cue the fist pumps and high fives. 10 seconds later, cue the puzzled facial expressions when someone wonders aloud, “So, how much revenue did this bring in?” What do all those clicks and rankings mean in terms of revenue? How do you know if your money is being spent wisely? Can you make a direct correlation between dollars spent, leads generated and sales closed? Typically, those questions go unanswered. The goal of marketing is to generate leads, drive sales and increase revenue. Basic, high-level metrics like clicks and search rankings are helpful, but they don’t tell you how well your marketing is really working. This white paper will show you: • The basics of Google Analytics. • Key metrics for monitoring the progress and measuring the results of your digital marketing campaigns. • Why the integration of Google Analytics and customer relationship management (CRM) data is critical to determining the true value of each campaign. • A hypothetical example that illustrates the importance of digging deeper into this data so you can make intelligent marketing decisions.
  • 3.
    ANALYTICS + BRAIN= $ Understanding and interpreting data to measure ROI and optimize your marketing 3 T HE ABC’S OF ANALYTICS In this section, we’ll introduce you to basic terms and definitions used by Google Analytics. For the purposes of this white paper, we’ll focus on the terminology, capabilities and data available through Google Analytics. There are other platforms available for tracking, measuring and reporting data, but Google Analytics is the most widely used analytics service on the internet. It’s free and easy to install, and it offers robust data for marketing analysis. To get started, you sign up for Google Analytics with basic information about the site you’d like to monitor. You’ll get a tracking code to paste onto your website pages. That tracking code sends data to Google so it knows when your site has been visited. Within hours, you’ll begin to see data about your website traffic and visitors. To the right are some basic terms to understand when using Google Analytics. Session: A single person’s single visit to your website. This can include multiple interactions and pageviews. If someone leaves your website and returns later, that begins a second session. Pageviews: The number of times a specific web page is seen. Bounce: This occurs when someone leaves your website without interacting with the land- ing page. In other words, they land on a page and don’t click or type anything before “bounc- ing” away. Direct Traffic: Traffic that comes to a web page after someone types your URL in the browser. Referral Traffic: Traffic that comes to a web page after someone clicks a link on a brows- er interface, which then loads the URL in the browser. Referral traffic comes from a variety of sources, such as search engines, social media and advertisements. Keep in mind that traffic classification can be a little dicey with email. For example, if someone clicks a link in an email application such as Microsoft Outlook, a browser will automatically open with your URL in it. This will be interpreted as direct traffic by Google Analytics. If someone clicks a link in a browser-based email platform such as Gmail, this will be interpreted as referral traffic. This is why the proper use of tracking links is so important. We’ll discuss this later in greater detail.
  • 4.
    ANALYTICS + BRAIN= $ Understanding and interpreting data to measure ROI and optimize your marketing 4 T HE ABC’S OF ANALYTICS Below is a screenshot of the Google Analytics interface. The first four headings in the navigation on the left side of the page are valuable tools but rather advanced. The next four are most important for measuring the effectiveness of your marketing – Audience, Acquisition, Behavior and Conversions. Audience: This section tells you a ton of information about the people who visit your website. It includes everything from demographic data (gender, age, etc.), to interests (based on browsing history), to the types of mobile device being used to interact with your content. Acquisition: This section focuses on where people who visit your website are coming from, such as search, social media and referral websites. You can also drill down to specific referral sources. For example, if you run an AdWords campaign, you can see what someone searched for before arriving at your website. Within Acquisition, Search Console provides insights into your organic search ranking on Google, while Campaigns specifically tracks the traffic that you’re paying to acquire. Behavior: Now that we know who your visitors are and how they got to your website, we use Behaviors to find out what they did while visiting your website. The most useful report is Top Content, which tells you what pages and content on your site generate the most interest and traffic. Top Content shows you the most popular pages, click-thru paths, top landing pages (if not the home page), top exit pages (the last page someone visited before leaving your site), and other metrics. Conversions: This focuses on specific actions you want people to take on your website. Conversions can be defined differently by different companies. On an e-commerce site, a conversion could be a sale. On another site, a conversion could occur when someone fills out a form to download a white paper. To measure this activity, you need to set up Goals, which tell Google Analytics that a particular event is important and you need to know about it (more on Goals later). It’s critical to look at conversion data to guide decisions about targeting your marketing campaigns.
  • 5.
    ANALYTICS + BRAIN= $ Understanding and interpreting data to measure ROI and optimize your marketing 5 T HE ABC’S OF ANALYTICS In this section, we’ll discuss developing a strategy for tracking your marketing, tracking campaigns in Google Analytics, and integrating analytics data with your CRM. There are three questions that should guide your tracking strategy. Based on your business and marketing goals, what information do you need to collect? Different types of data, such as email addresses, phone numbers, geographic location, and the age of the user, will be more important to different types of companies and organizations. For example, customer behavior, referral sources, keywords, and social media engagement are commonly tracked. How do you collect data from people you reach with your marketing? Depending on your business operations and target audience, data could be collected from registration forms, downloads, point-of-sale/e-commerce, social media, coupons, referral sources, industry trends, surveys/ research studies, and networking. What specific metrics will you track to measure success? This will often be determined by whether you place greater emphasis on volume or value. For example, are you more interested in generating a high volume of sales, or would you rather see higher value per sale?
  • 6.
    ANALYTICS + BRAIN= $ Understanding and interpreting data to measure ROI and optimize your marketing 6 Marketing: Determine who you wish to reach and what you want to do with your marketing (Call to Action). Collect: Identify the type of data you need to collect and how you’ll collect it. Configure: Store the right data in a database within your CRM so you can use it to configure your marketing campaigns. Deploy: Deploy the campaigns Tracking: Be sure to carefully track their progress by linking them to the neccesary related information (lead source, sales, etc.). Analyze: As your campaigns unfold, analyze the data and start to assess each campaign’s effectiveness. Refine: Use this data analysis to refine your marketing efforts and restart the loop. B UILDING A COMPLETE TRACKING SYSTEM The Intelligent Loop The graphic below shows the repeatable, intelligent loop that is followed when you take a strategic, analytics- driven approach to marketing.
  • 7.
    ANALYTICS + BRAIN= $ Understanding and interpreting data to measure ROI and optimize your marketing 7 Setting Up Tracking Codes Google Analytics will help you determine how effectively you’re generating leads by delivering the right message to the right audience. This is the job of marketing. Unfortunately, this is where most marketing agencies stop. They tell you who is coming to your website and where they came from, and leave it to you to figure out the rest. But you also must determine how effectively you’re converting those leads into dollars. This is the job of sales. What are people doing when they get to your website? What are the most important actions to track? This will tell you what an effective marketing campaign should look like. When you track and analyze data from both the marketing activity and sales activity, you’ll have the insights required to make data-driven decisions at the end of the each cycle in the Intelligent Loop discussed previously. To accomplish this goal, you need to specify which outlet, effort, spend and channel are driving each visit so you can compare the results. This requires you to build a campaign tracking tool, which is nothing more than a fancy link to your website. The campaign tracking tool embeds very specific information about where that link came from and sends details about the origin of the traffic to Google Analytics. B UILDING A COMPLETE TRACKING SYSTEM Google has a very simple tool for doing this, called the “Google Analytics Campaign Builder” - https://goo.gl/d52Nse. You enter the destination where you want to send people and the parameters you want to track. We recommend using at least three parameters – the source, the vehicle, and the campaign to which the traffic is connected.
  • 8.
    ANALYTICS + BRAIN= $ Understanding and interpreting data to measure ROI and optimize your marketing 8 Let’s walk through the setup using Google’s tool. We’ve created a fictitious campaign to show you what tracking links look like. They may seem a bit long and scary at first, but they make more sense once you break them down and understand what each part means. For every marketing campaign, you typically have individual components that require their own custom tracking URLs. It’s helpful to set up a spreadsheet with all components and tracking URLs so you can see everything together when comparing data. This organization’s hypothetical campaign includes multiple components: • An internal email newsletter • A package purchased from a local association, which includes a website banner, a text messaging program, and a link in monthly email blasts to their clients • Employee email signatures, which will promote the campaign • A pay-per-click campaign on LinkedIn that targets a specific business audience • A press release B UILDING A COMPLETE TRACKING SYSTEM The first part of the tracking URL in (#1) is the link to your website, landing page, or wherever you’re sending people. The second part of the tracking URL in (#2) specifies the source – newsletter, association, signature, LinkedIn, and press. This identifies the company you’re paying for the advertising. If the source is in-house, it identifies the internal vehicle used to generate traffic. The next part in (#3) beginning with “&” identifies the medium, or how the message is being delivered. This is especially important for the association package, which is delivering the message in three ways – banner, text and email. This way, we’ll know which part of the association package is responsible for the traffic we’re receiving. In this campaign, we have a lot of distribution through email, but each custom tracking URL has a different source so we can sort the data later. The final part in (#4) beginning with the second “&” simply identifies the name of the overall campaign. Each tracking URL is part of the same campaign, which is why they all have the same campaign name in our above example. Keep in mind that you can run multiple campaigns simultaneously, each promoting a different offer or initiative. In this case, you would assign each campaign a different name. #1 #2 #3 #4
  • 9.
    ANALYTICS + BRAIN= $ Understanding and interpreting data to measure ROI and optimize your marketing 9 So what do you do with these big fancy links? Use them in the appropriate component of your marketing campaign. For example, if you direct people to click a certain link in your internal email newsletter, you would use the first custom URL as the link. As intimidating as these links may appear, all you have to do is build them correctly, put them in the right places, and let Google Analytics do the rest. This is where the spreadsheet (see images below) becomes a useful reference. B UILDING A COMPLETE TRACKING SYSTEM
  • 10.
    ANALYTICS + BRAIN= $ Understanding and interpreting data to measure ROI and optimize your marketing 10 Setting Up Goals in Google Analytics Before you set up goals, you must decide what actions you want people to take after they arrive on your website. Goals can be triggered in a number of ways and require you to add code that allows you to track goal completion. You can use a page load as a trigger. For example, if a certain page loads, such as a “thank you” page, that would indicate a goal has been completed. You can choose a duration. If someone spends a certain amount of time on your website or a specific page, that would indicate a goal has been completed. You can choose a number of pages. If someone visits a certain number of pages, that would indicate a goal has been completed. Each of these triggers represents a desired level of engagement. The most versatile trigger is an event – a specific action taken by a user. This could involve a user clicking a button, watching a video, filling out a form, downloading an e-book, or even expanding text to read more content on a page. A simple click will trigger it, but it takes some code on the website to implement. You can have multiple goals with different values based on what you want people to do. Once you add code and enter details for each goal, you can turn goal tracking on and off as needed. B UILDING A COMPLETE TRACKING SYSTEM
  • 11.
    ANALYTICS + BRAIN= $ Understanding and interpreting data to measure ROI and optimize your marketing 11 B UILDING A COMPLETE TRACKING SYSTEM Goals involve the activity that you really care about on your website. When the Goals column starts populat- ing, you get beyond high-level metrics to get a true sense of what’s working and what’s not. In other words, goals correlate directly with “conversions”, however you’ve described them.
  • 12.
    ANALYTICS + BRAIN= $ Understanding and interpreting data to measure ROI and optimize your marketing 12 Capturing Data in Your CRM Now we move from Google Analytics to your Contact Relationship Management (CRM), where we collect data that informs future marketing and business decisions. When entering data, use quantitative data fields that allow you to choose from multiple options. This makes it easier to track, analyze and report data. Text fields are the enemy here and should be avoided whenever possible in favor of dropdown lists and checkboxes. When you allow users to type data, you lose consistency and uniformity and introduce unnecessary complexity and interpretation into your data. B UILDING A COMPLETE TRACKING SYSTEM This becomes evident when you start pulling reports on various metrics, such as different types of marketing efforts (conferences, webinars, blog posts, online ads, etc.), campaigns, new business versus referral business, dollar amounts, and periods of time. Now we can pinpoint what’s working and what’s not. Just like various marketing campaigns and components of each campaign can be tracked separately, data is captured in your CRM in a way that allows you to tie dollar amounts to specific campaigns, accounts and contacts. Every deal that is either in the pipeline or closed should be traced to the campaign source so you can measure ROI.
  • 13.
    ANALYTICS + BRAIN= $ Understanding and interpreting data to measure ROI and optimize your marketing 13 A CME EVENT MANAGEMENT In this section, we’ll show you how combining Google Analytics and your brain allows you to make smarter marketing decisions. We created a fake event management company, Acme Event Management, that caters to B2B, B2C and nonprofits. B2B events are typically conferences, workshops, seminars, etc. B2C focuses on tradeshows and product launches. Nonprofits are geared towards galas, fundraisers and events of that nature. These are three very different markets that require different types of marketing. We created three fictitious marketing campaigns for our fake company to show how they would be tracked in Google Analytics and the types of conclusions one might reach, depending on what data is analyzed and how that data is interpreted. These campaigns are for the B2C sector, so a B2B or nonprofit campaign would likely require a different approach. Campaign 1 is an email campaign to existing clients. The goal is to book one large event per year for the fall event season. The offer encourages recipients to book this year for next year’s event and receive this year’s rate. Campaign 2 is an email campaign to existing clients that have larger pools of resources. This campaign is about referrals only. The offer is a discount on an upcoming event for every new client that the recipient refers to Acme Event Management. Campaign 3 is a pay-per-click search campaign in which “Conference & Event Planner” is the search term. Show me the money! We set the codes, build the creative and deploy the marketing. Then we say what every responsible business owner should say to their marketing agency:
  • 14.
    ANALYTICS + BRAIN= $ Understanding and interpreting data to measure ROI and optimize your marketing 14 A CME EVENT MANAGEMENT The Results: Part 1 For the purpose of this exercise, we’ve labeled the green section as “Leads.” In Google Analytics, this section would be called “Conversions.” We know that they’re actually leads, which is why we’ve labeled the section as such. This will become clearer when we begin to interpret the data. Based on this data, it looks like Acme generated a lot of leads from the search campaign, and the cost per lead is probably better than the two email campaigns. But this is when the conversation with your marketing consultant typically stops. You’re left wondering what was good, what was bad, and what you should do next. That’s because no direct connection has been made between any of these marketing efforts and actual revenue. A business decision at this point could be a costly mistake. And that’s why we need to go deeper into the data by looking at the CRM.
  • 15.
    ANALYTICS + BRAIN= $ Understanding and interpreting data to measure ROI and optimize your marketing 15 A CME EVENT MANAGEMENT The Results: Part 2 These are the results that really matter. This is where we separate the lookers from the buyers. This where we get beyond superficial click-thru rates and hone in on closed business and ROI. Campaign 1: Although we “only” gained seven leads from our $975 investment, five of those leads converted into actual sales and booked events. That’s a 71 percent conversion rate with an ROI of 692 percent.
  • 16.
    ANALYTICS + BRAIN= $ Understanding and interpreting data to measure ROI and optimize your marketing 16 Campaign 2: We converted one of four leads into a sale, which involved three small workshops in a year. This gave us a 25 percent conversion rate and 57 percent ROI. A CME EVENT MANAGEMENT
  • 17.
    ANALYTICS + BRAIN= $ Understanding and interpreting data to measure ROI and optimize your marketing 17 Campaign 3: The results of this campaign look impressive on the surface, but only two of 28 leads were converted to sales. That translates to a conversion rate of 7 percent and 38 percent ROI. A CME EVENT MANAGEMENT
  • 18.
    ANALYTICS + BRAIN= $ Understanding and interpreting data to measure ROI and optimize your marketing 18 A CME EVENT MANAGEMENT Adding the Brain to Analytics to Make Good Decisions The gut reaction might be to bail on Campaign 3 because it produced the lowest conversion and ROI rates. However, it also produced a lot of traffic, so instead of bailing, try another conversion strategy. Perhaps try search terms that are more specific than “Conference & Event Planner,” which is very broad, and change the offer. This could eliminate many of the 26 tire kickers but produce a much higher conversion rate for a smaller investment. Campaign 2 has lower ROI than Campaign 1 but still has value because it’s a referral. This could be what we sometimes call a slow burner. 57 percent ROI may seem a bit low now, but it could lead to more revenue over a longer period of time as referrals turn into clients and start producing other referrals. The larger point here is that you’re not even having this conversation if you A) make decisions based on superficial metrics that don’t tie marketing to revenue and B) fail to use your brain to determine the future value of a campaign or how to improve a campaign’s performance.
  • 19.
    ANALYTICS + BRAIN= $ Understanding and interpreting data to measure ROI and optimize your marketing 19 C ONCLUSION Good marketing is made before you start marketing Toomanybusinessownersjumpintomarketingwithoutdevelopingastrategicplan.Youcanhaveaphenomenal product or service. You can have brilliant messaging, breathtaking imagery, a perfectly functioning and user- friendly website, and a substantial budget. But if you don’t have a plan, you can expect to waste marketing dollars and lose opportunities to your competition. Before you start marketing, you need to: • Identify specific goals • Identify a specific target audience • Determine what you want that audience to do • Determine what data you need to collect • Determine how you should collect that data • Identify key metrics to measure the effectiveness of your campaigns • Learn how to interpret meaningful data This will allow you to connect the dots between marketing and revenue. When you devote time and resources to strategic planning, marketing becomes less about guesswork and more about testing educated hypotheses. Based on the results, you can then use your brain to adapt your strategy and restart the cycle. If you still feel a little overwhelmed by Google Analytics, CRM, and how to make sense of all the data housed in these platforms, that’s okay. At this point, it’s more important to understand the overall concepts and the importance of a strategic marketing plan than the specific steps involved in setting up and executing your campaigns. Remember, the analytics tools are there. The data is there. Your brain is there. Everything you need to be a successful marketer is either at your fingertips or sitting on your shoulders. If you take the time to plan at the beginning of the process, you can make smart decisions that drive revenue and maximize every marketing dollar.
  • 20.
    ANALYTICS + BRAIN= $ Understanding and interpreting data to measure ROI and optimize your marketing 20 ABOUT THE AUTHORS Brian Hasenkamp, President Asenka Interactive P: (609) 249-2700 E: brian@asenka.com www.asenka.com Coming up through the ranks of Direct Mail, Publishing and Traditional Advertising Agencies, Brian got a feel for process, the good and bad and took it all in for about 10 years. He noticed a distinct lack of solid defensible rationale in the creative being developed and rolled out. Brian sought to find a place where his passion for logic and data could enhance his creative pursuits. Everything began to gel when the digital market took off around the millennium. Brian started down the path of all things digital, without leaving his past behind. Brian started his own agency in 2002 and has steadily grown with the technology. He leverages his creative training with his understanding of digital tracking tools to deploy his own matrix for analyzing the effectiveness of digital campaigns.
  • 21.
    ANALYTICS + BRAIN= $ Understanding and interpreting data to measure ROI and optimize your marketing 21 ABOUT THE AUTHORS Sheri Kurdakul, President Holistic Business Solutions LLC P: (609) 557-7377 E: sheri@HolisticBusinessSolutions.com www.HolisticBusinessSolutions.com SheriKurdakulisPresidentofHolisticBusinessSolutions,aCRMconsultingfirmthatspecializes in small organizations looking to better manage their business processes in order to increase efficiencies and profits. They are based in Trenton, NJ. A leader in data and business process management, Sheri provides her clients with the tools and knowledge to effectively manage marketing, sales and customer care through information and technology. With expertise in knowledge management, process automation, case management, business intelligence, Customer Relationship Management (CRM) applications, and sales and order management, Sheri and her team develop and implement affordable enterprise cloud solutions to generate more effective and efficient customer and client experiences.
  • 22.
    ANALYTICS + BRAIN= $ Understanding and interpreting data to measure ROI and optimize your marketing 22 Copyright January 2017 All rights of any nature reserved. No part of this publication may be reproduced or transmitted in any form or by any means, electronic or mechanical, without written permission from the copyright owners.