Download to read offline

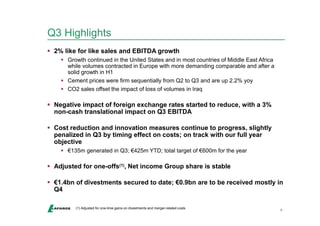
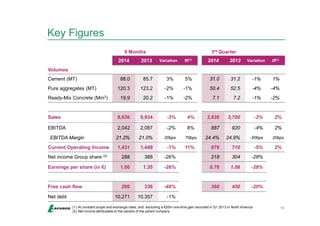
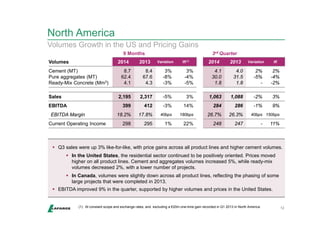
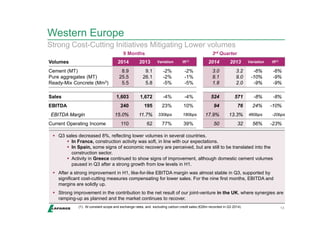
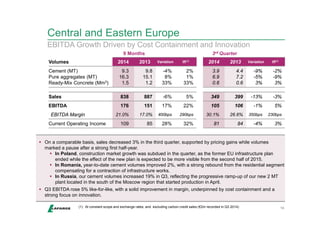
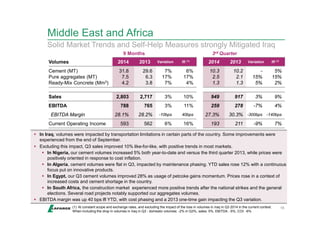
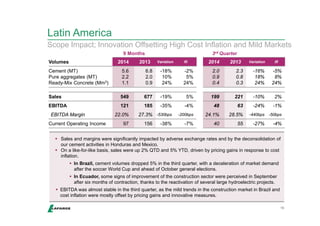
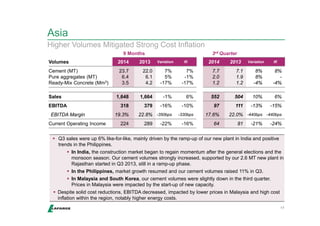
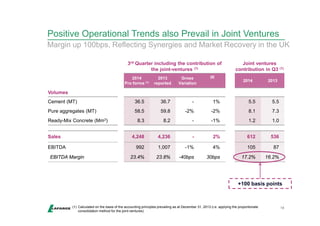
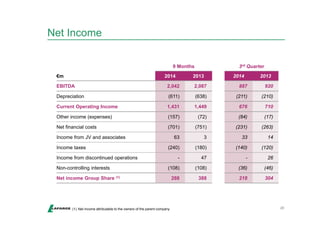

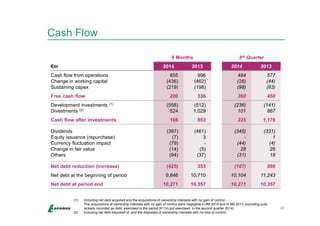
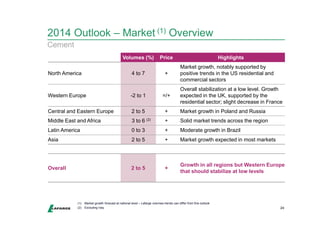

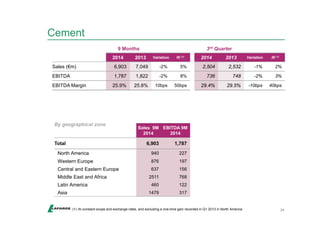
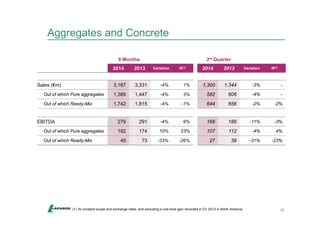
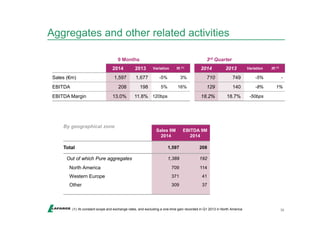
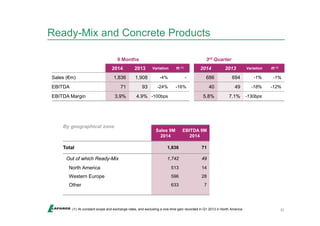


The document provides financial results for Lafarge for the first nine months of 2014. Key points include: - Sales and EBITDA grew 2% in Q3 on a like-for-like basis, with growth in the US and emerging markets offsetting declines in Europe. - Cost reduction objectives for 2014 and 2015 are confirmed to offset foreign exchange impacts and lower volumes in some regions. - The planned merger with Holcim is proceeding on track with regulatory approvals completed.