Download to read offline


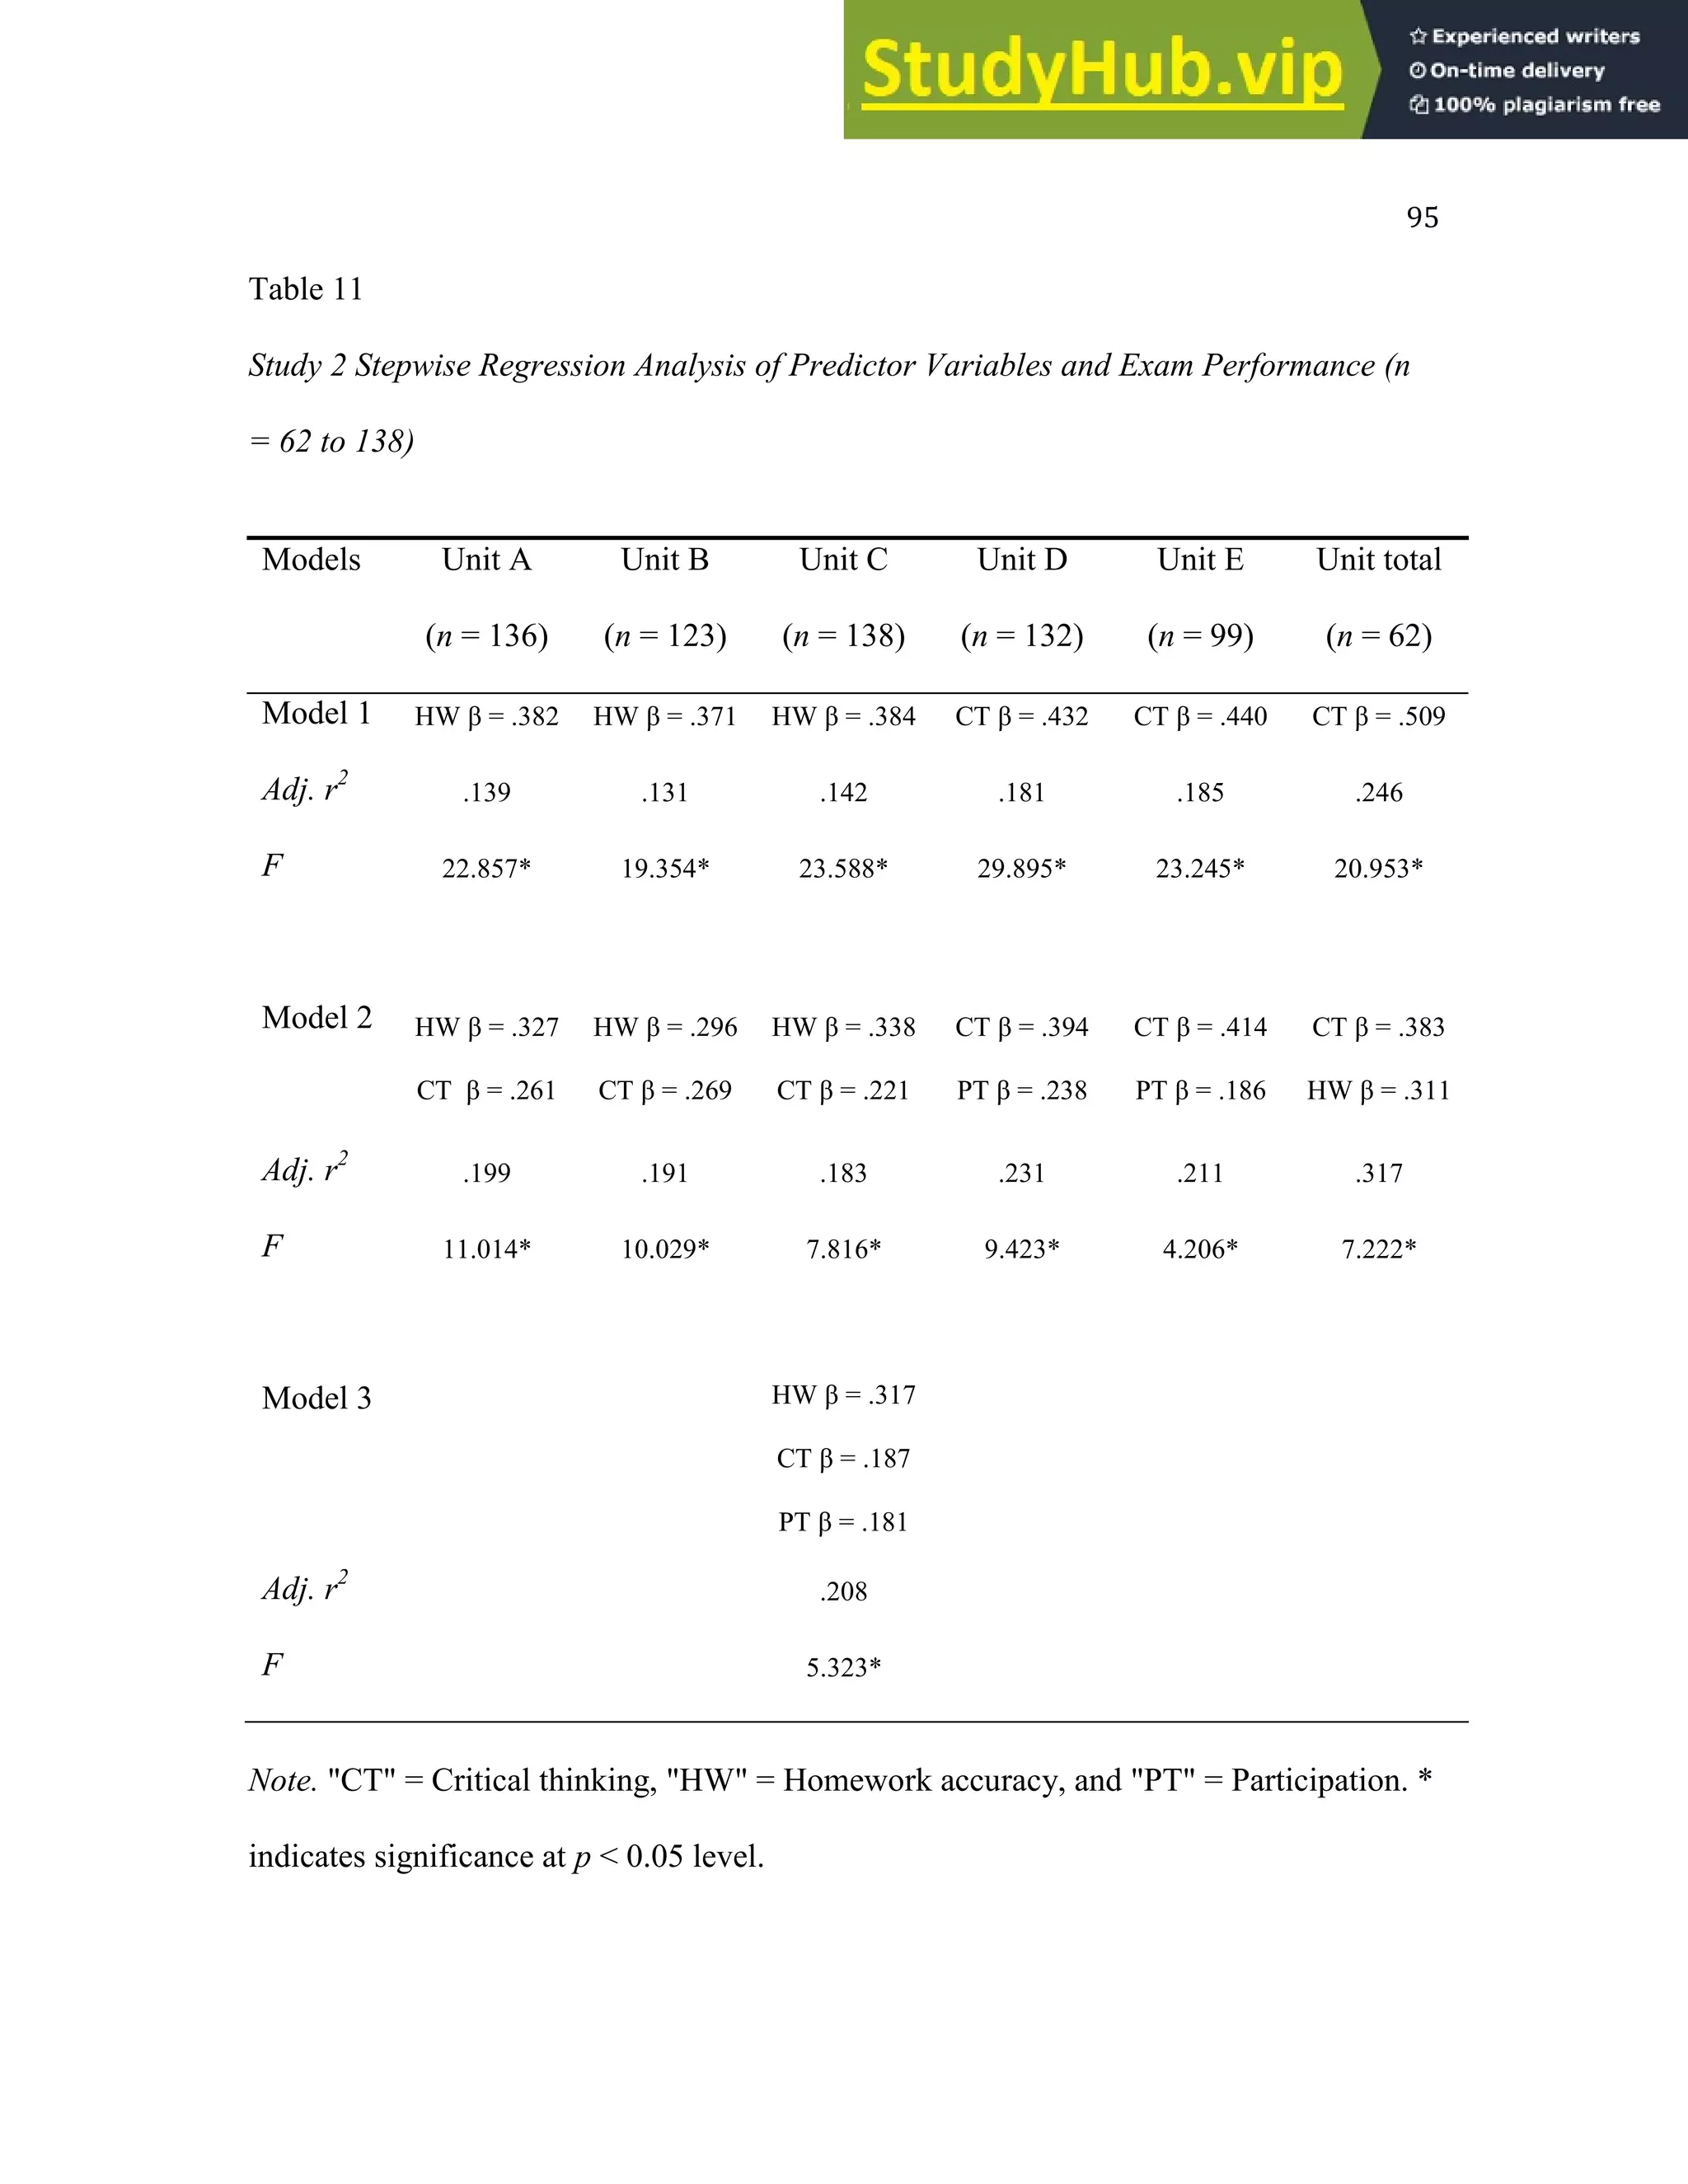
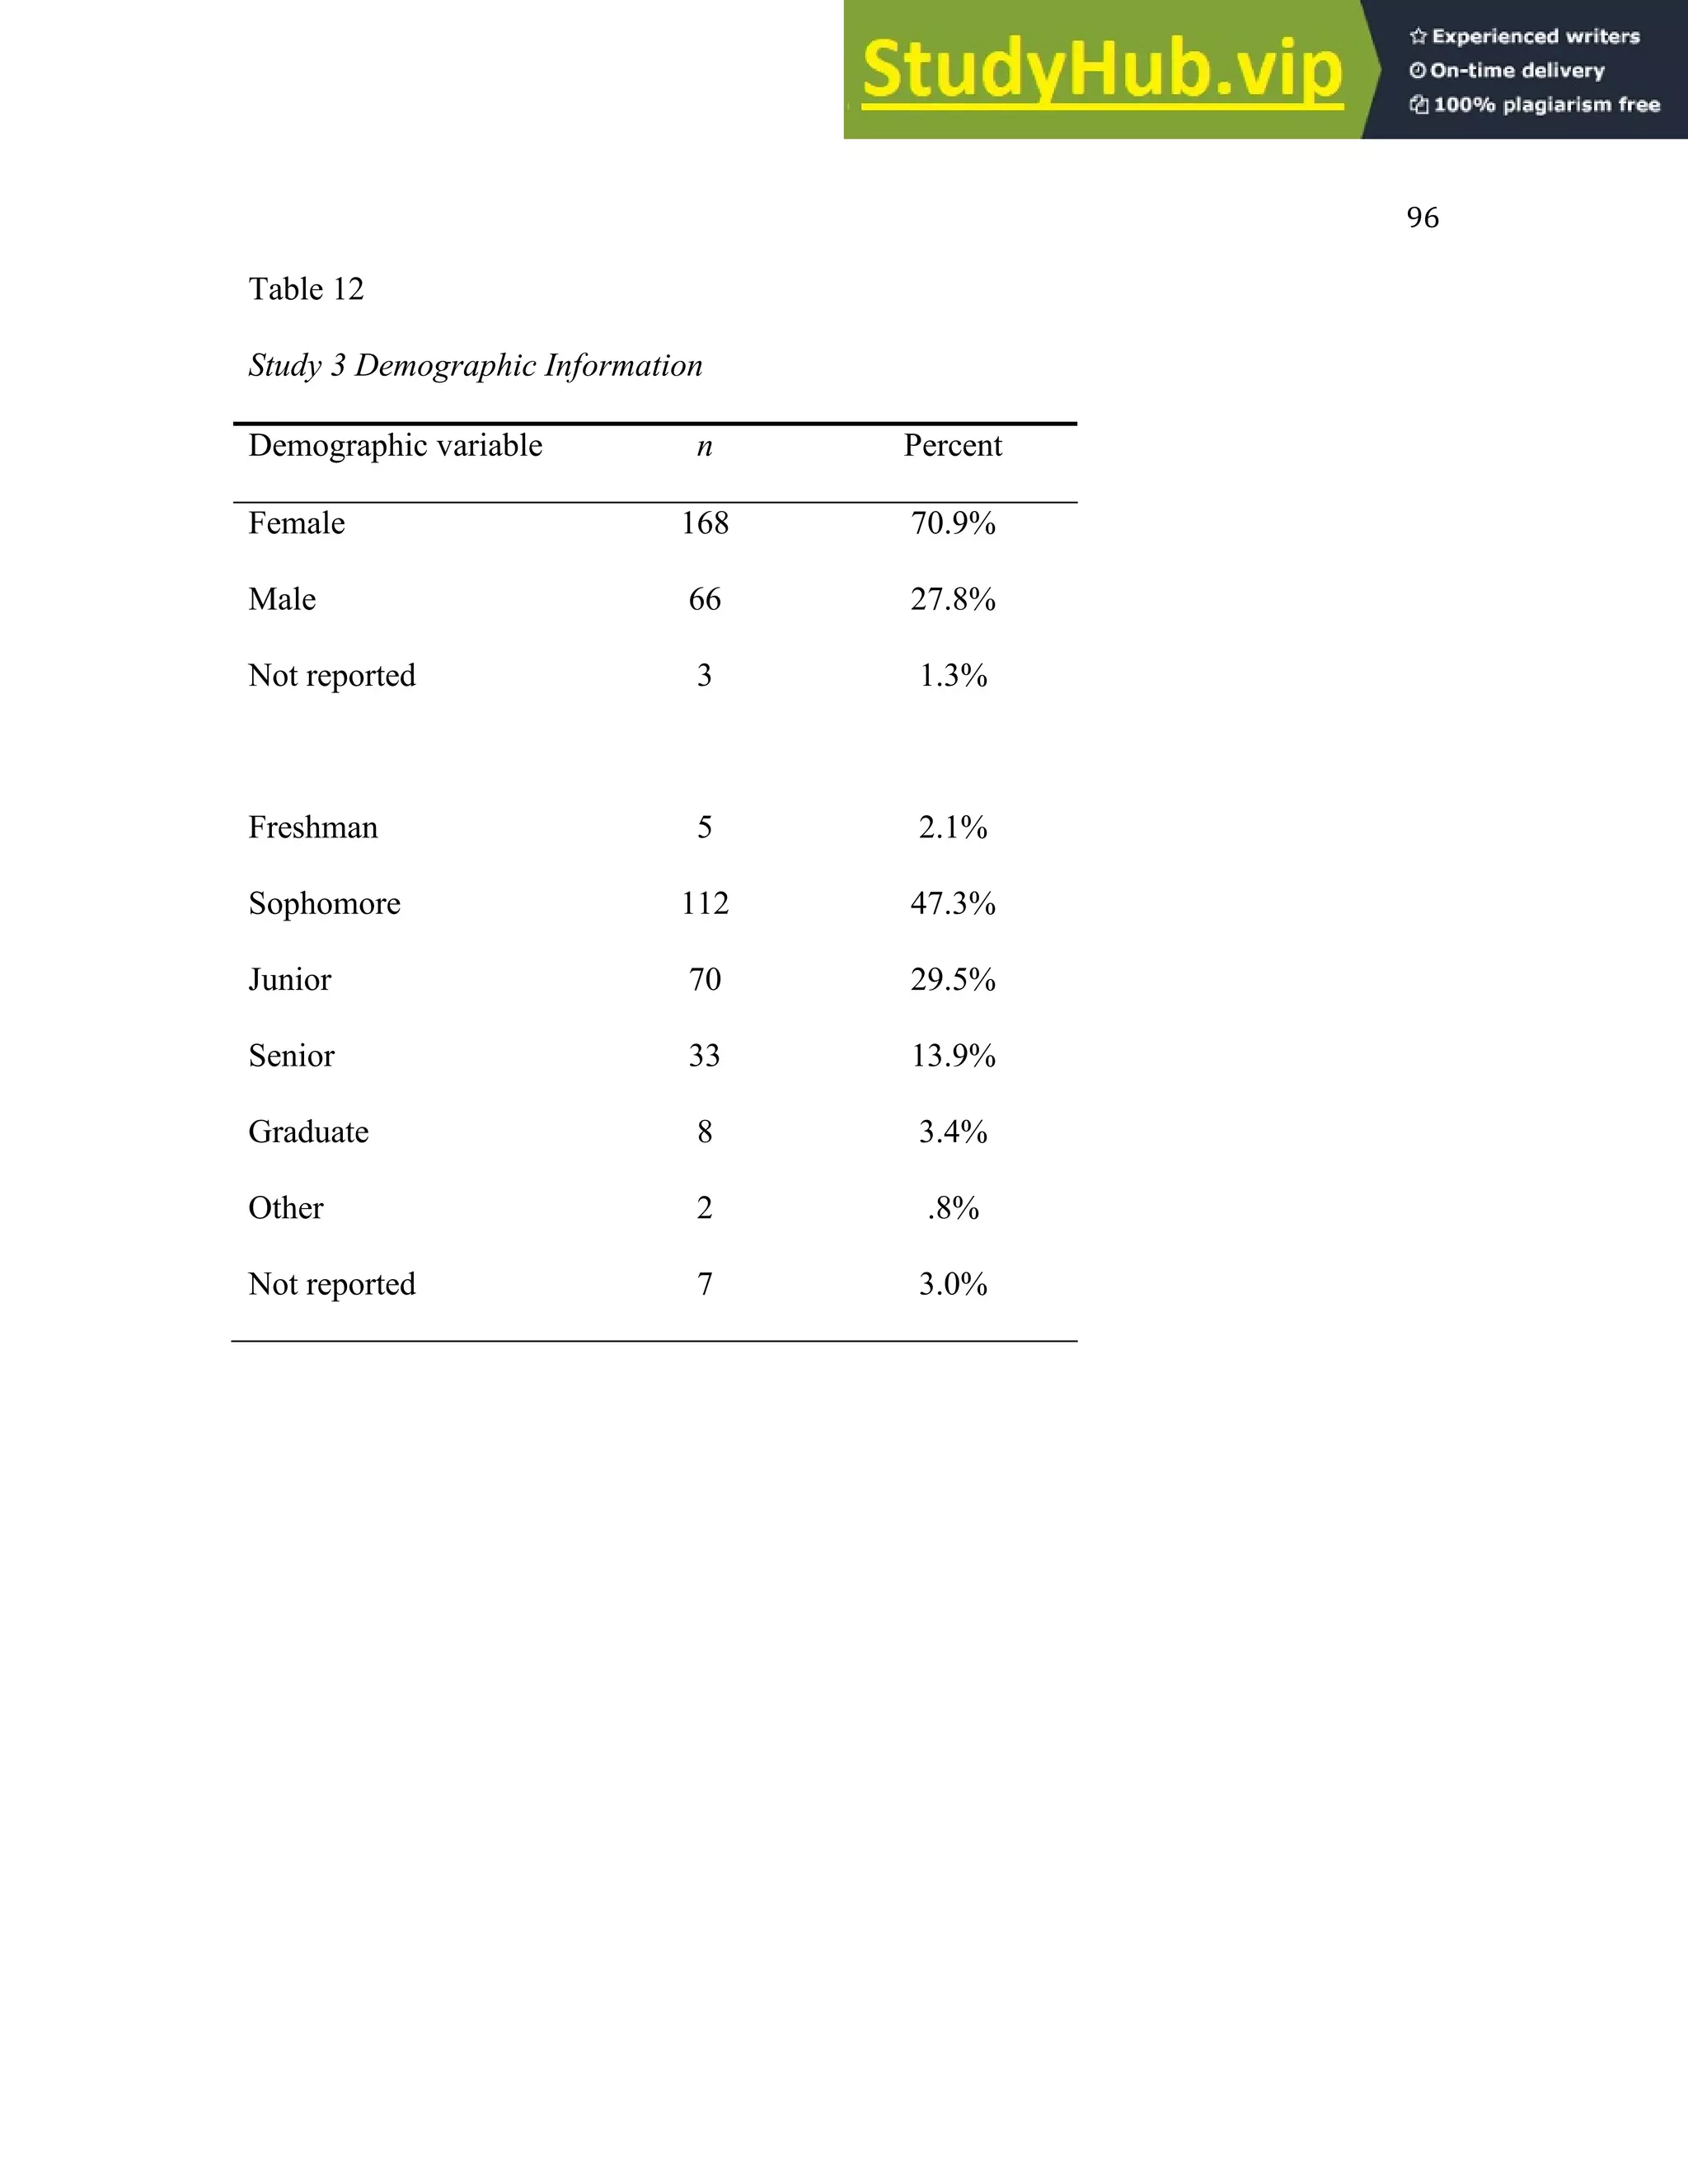

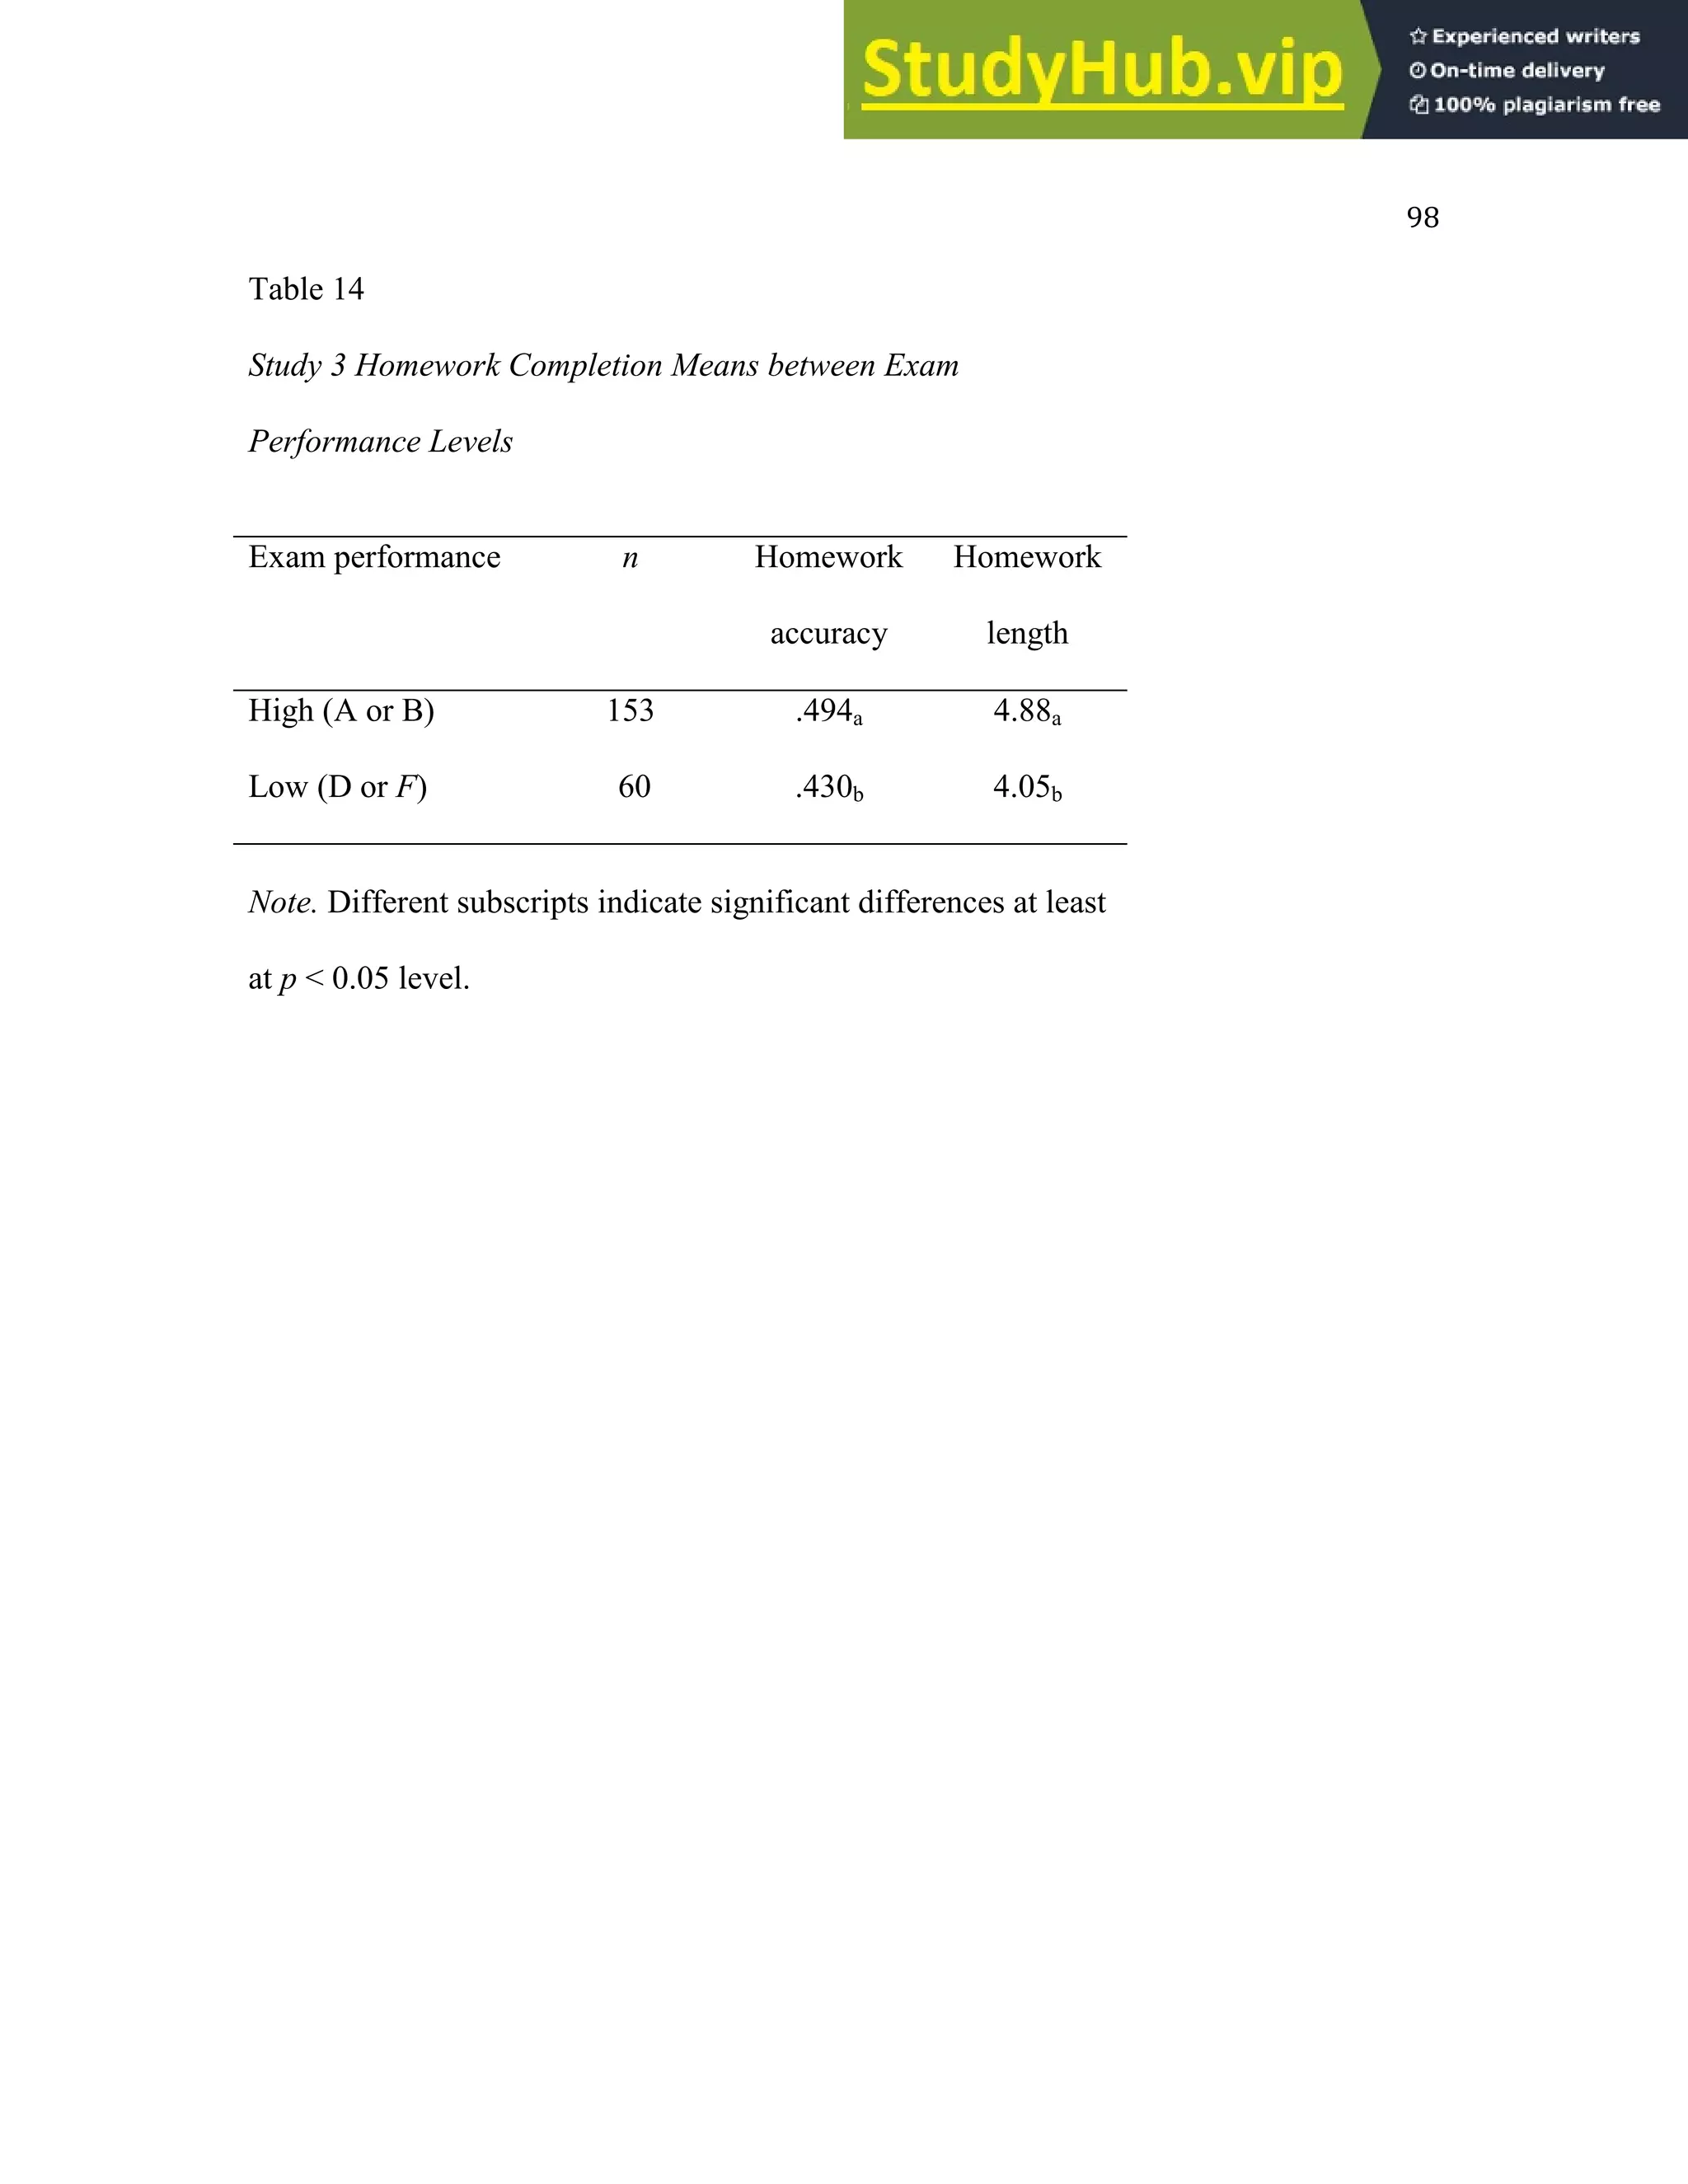
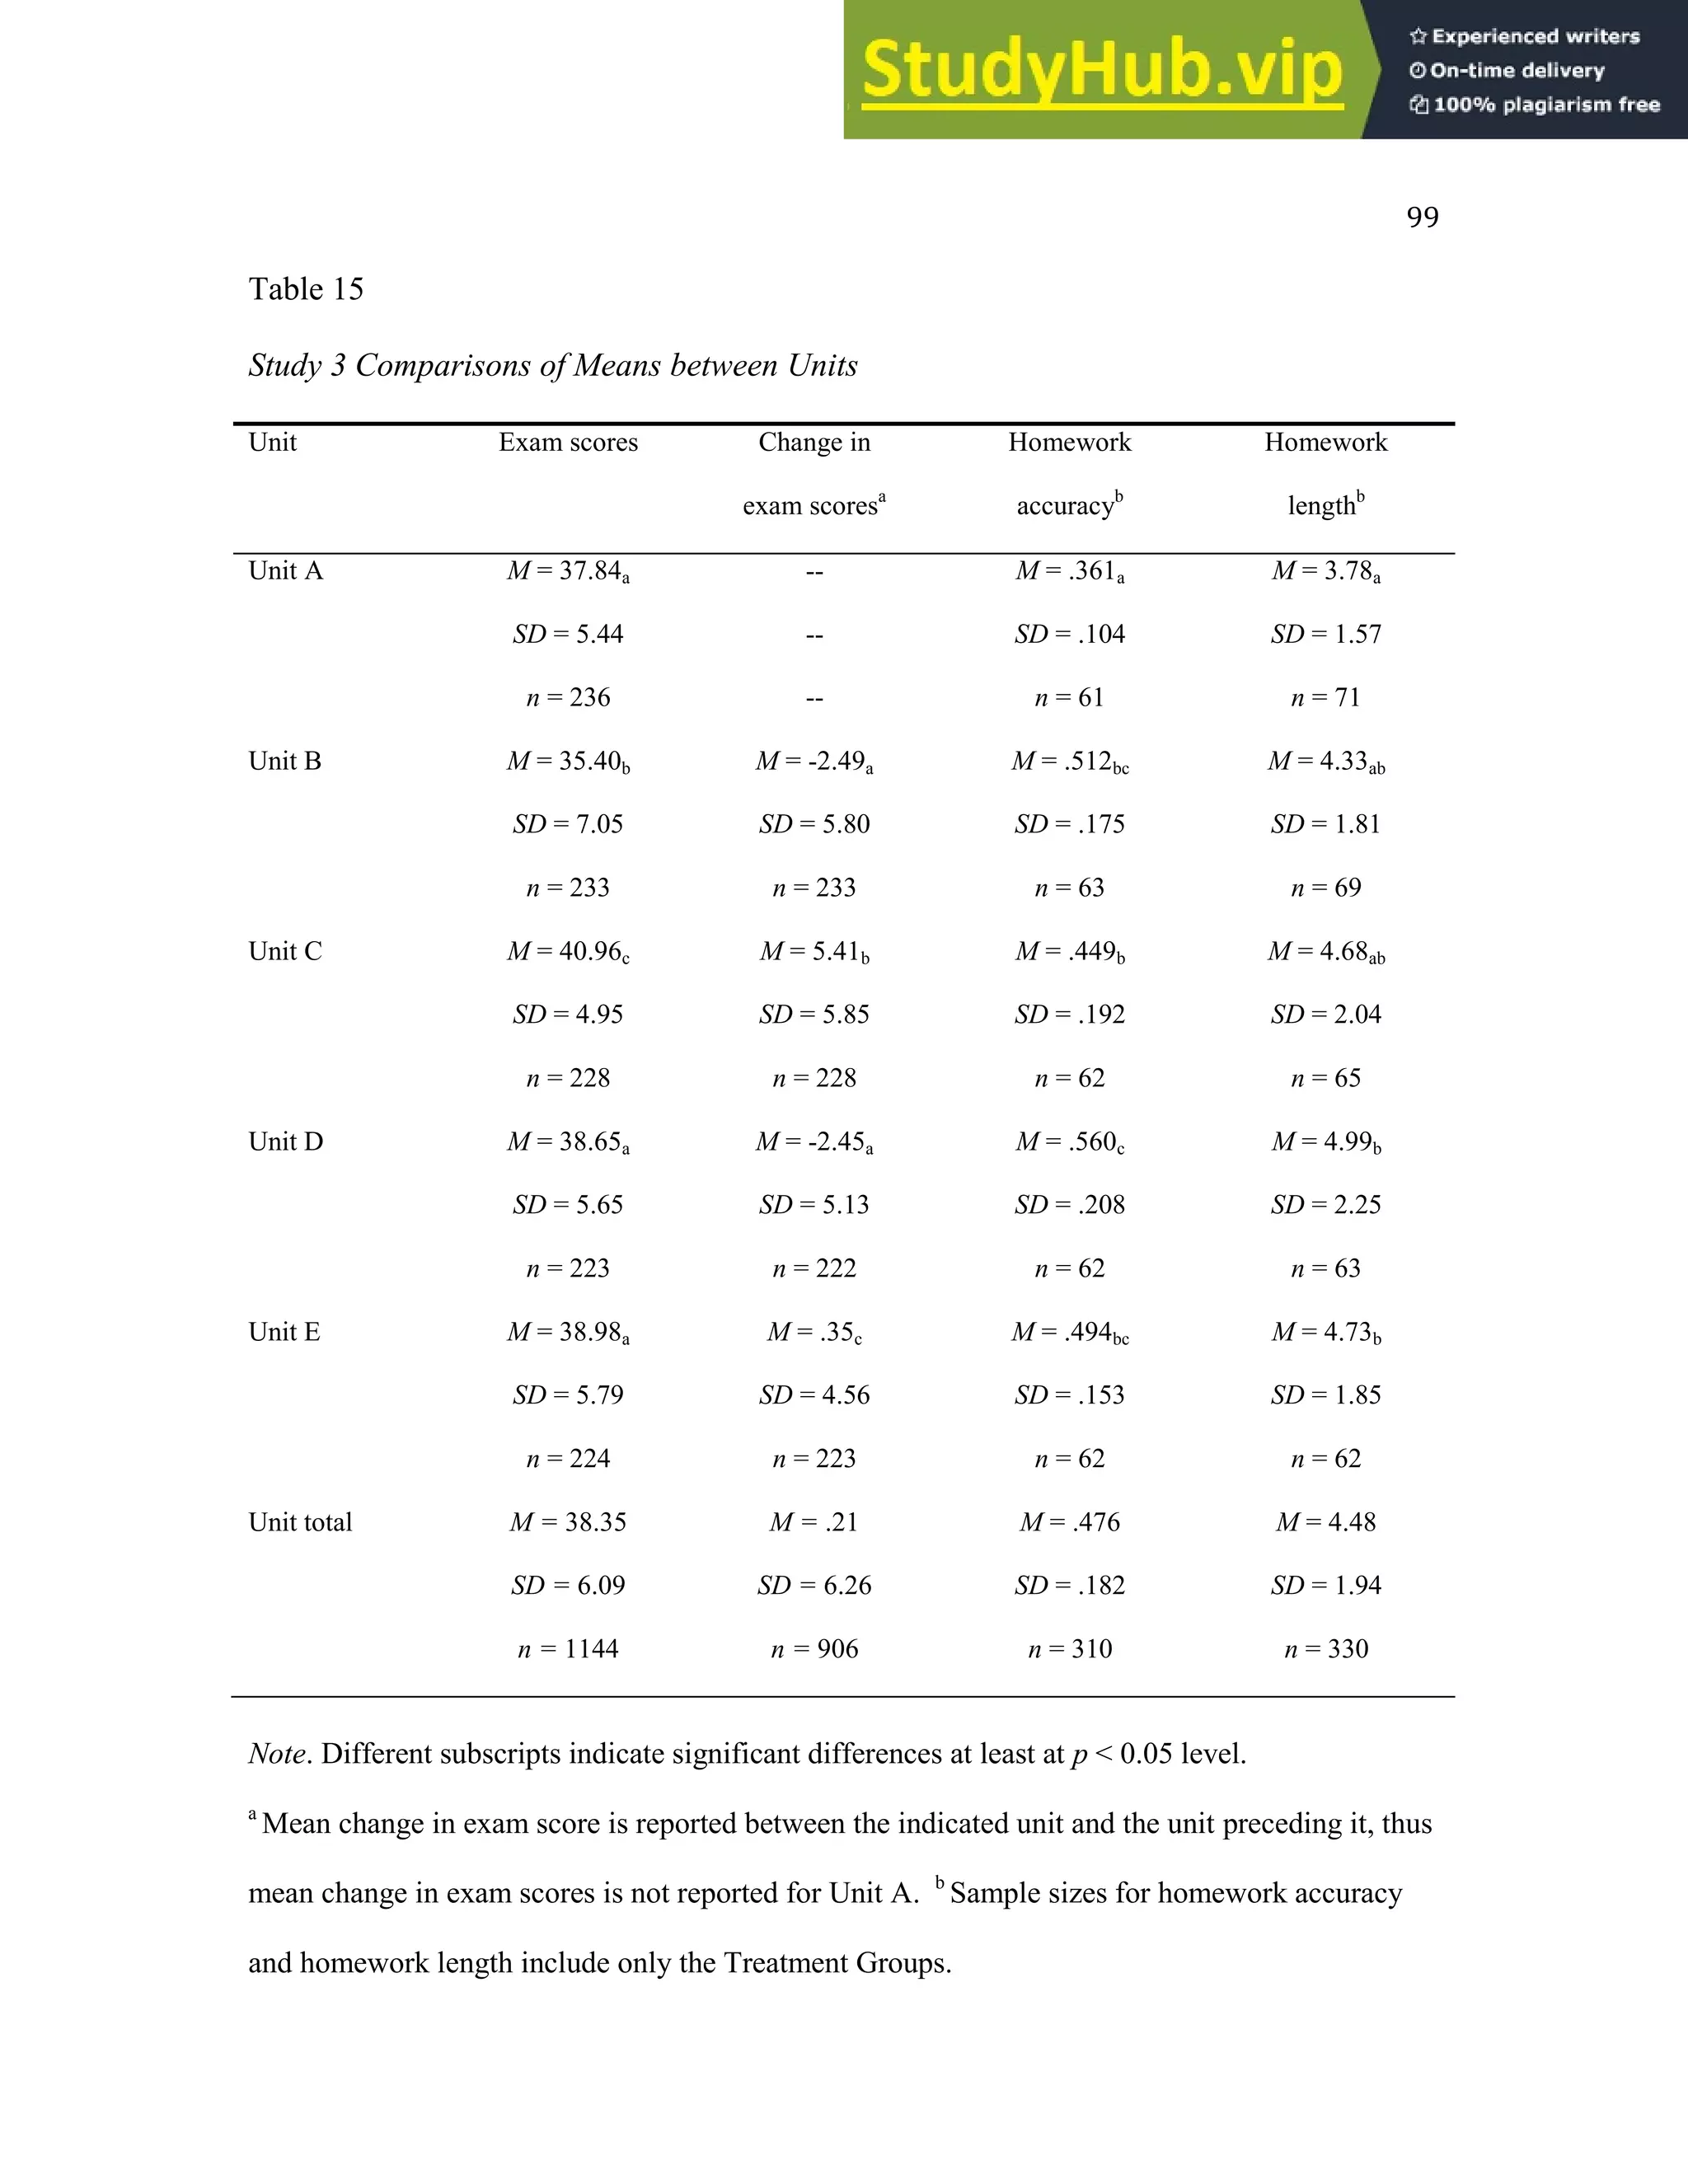


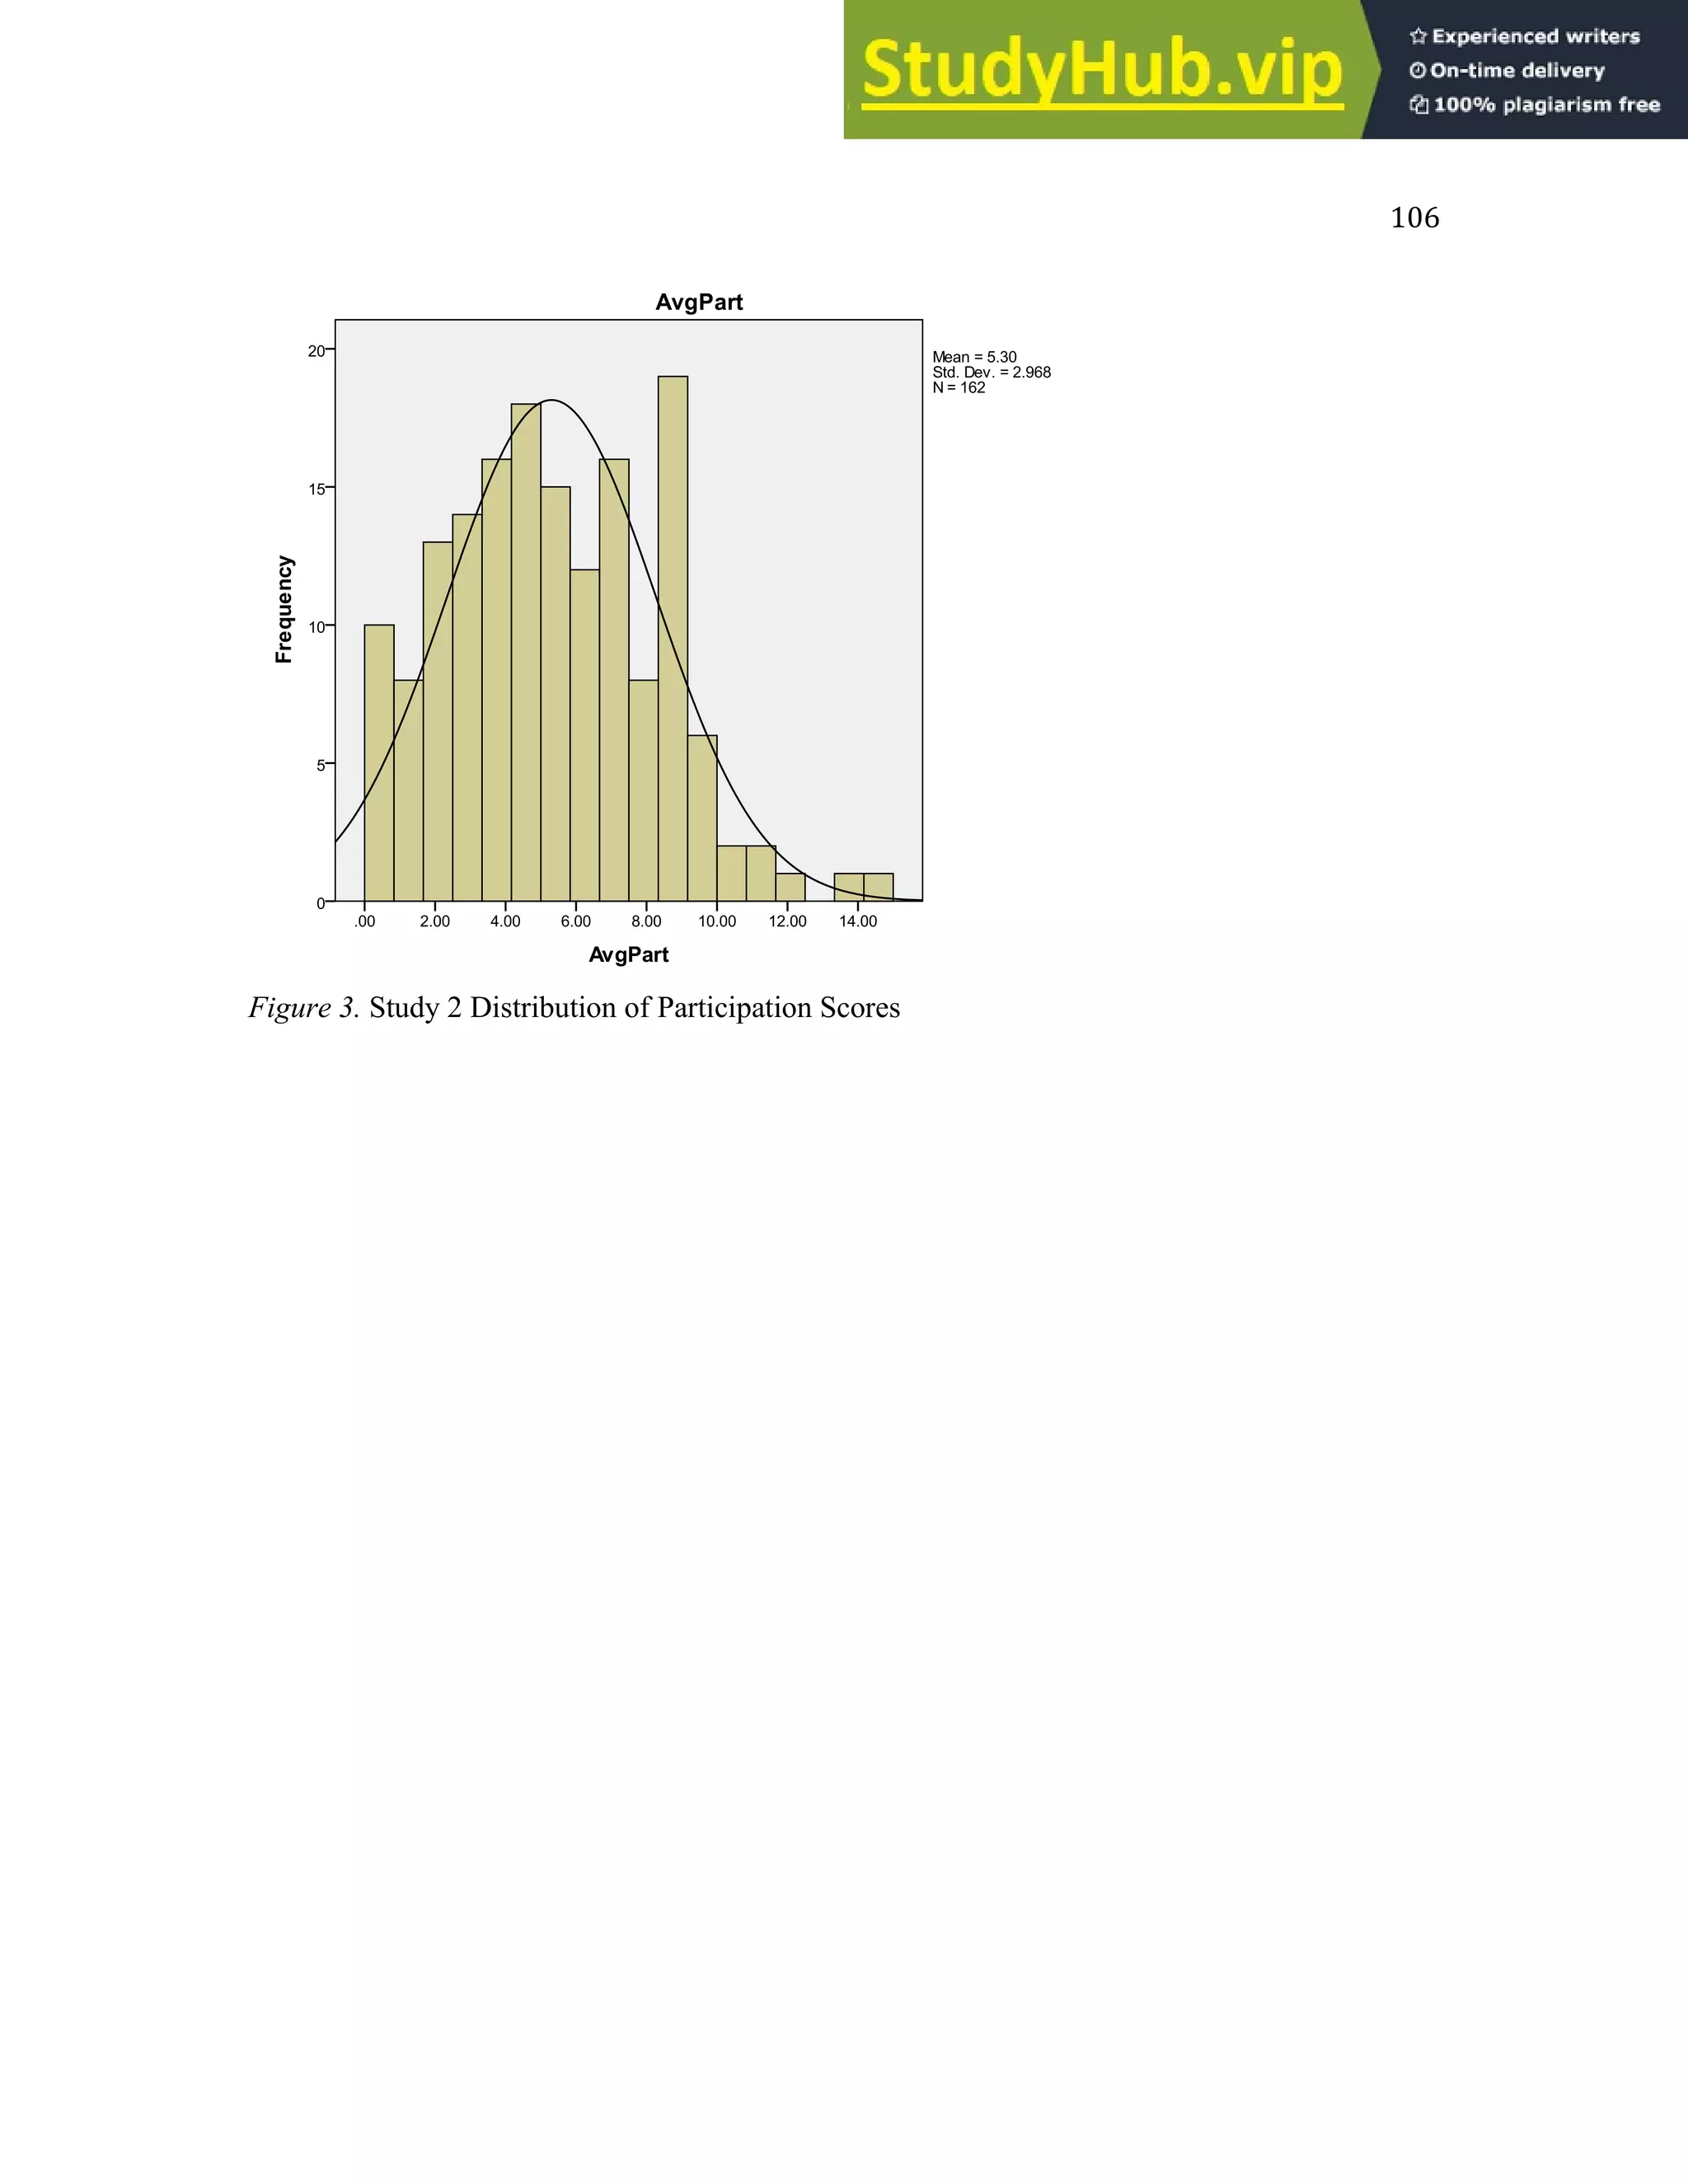
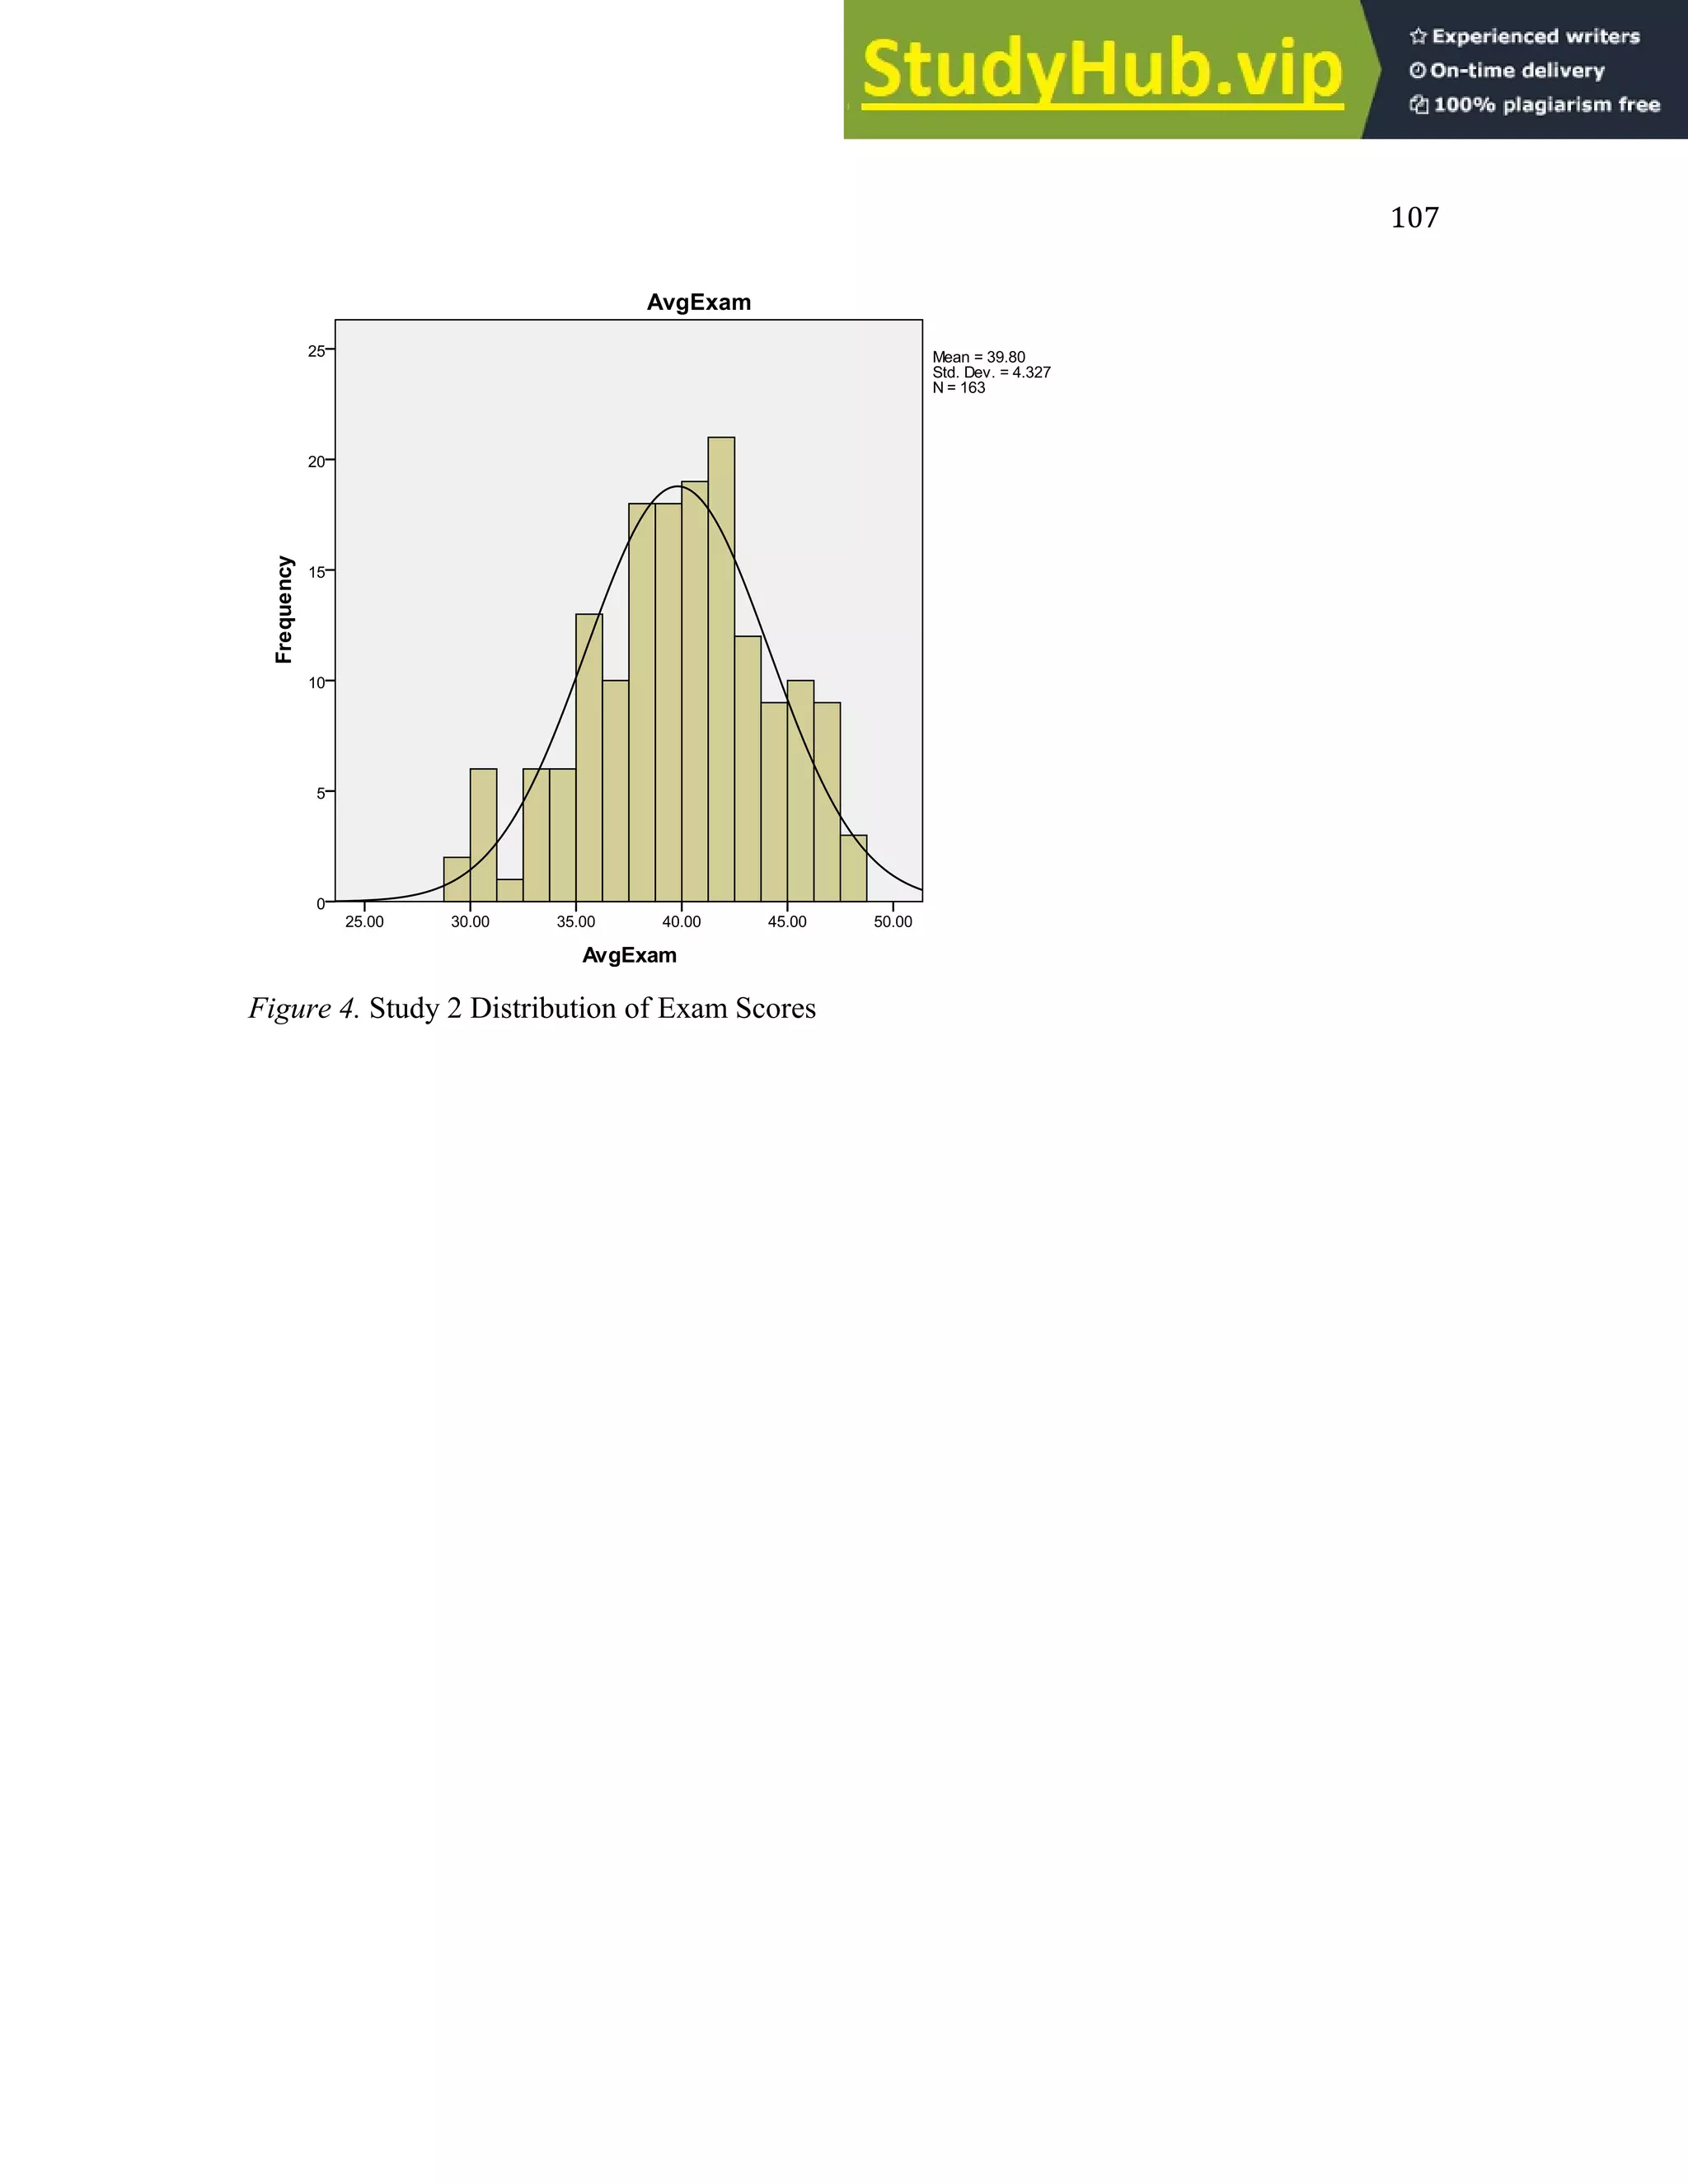
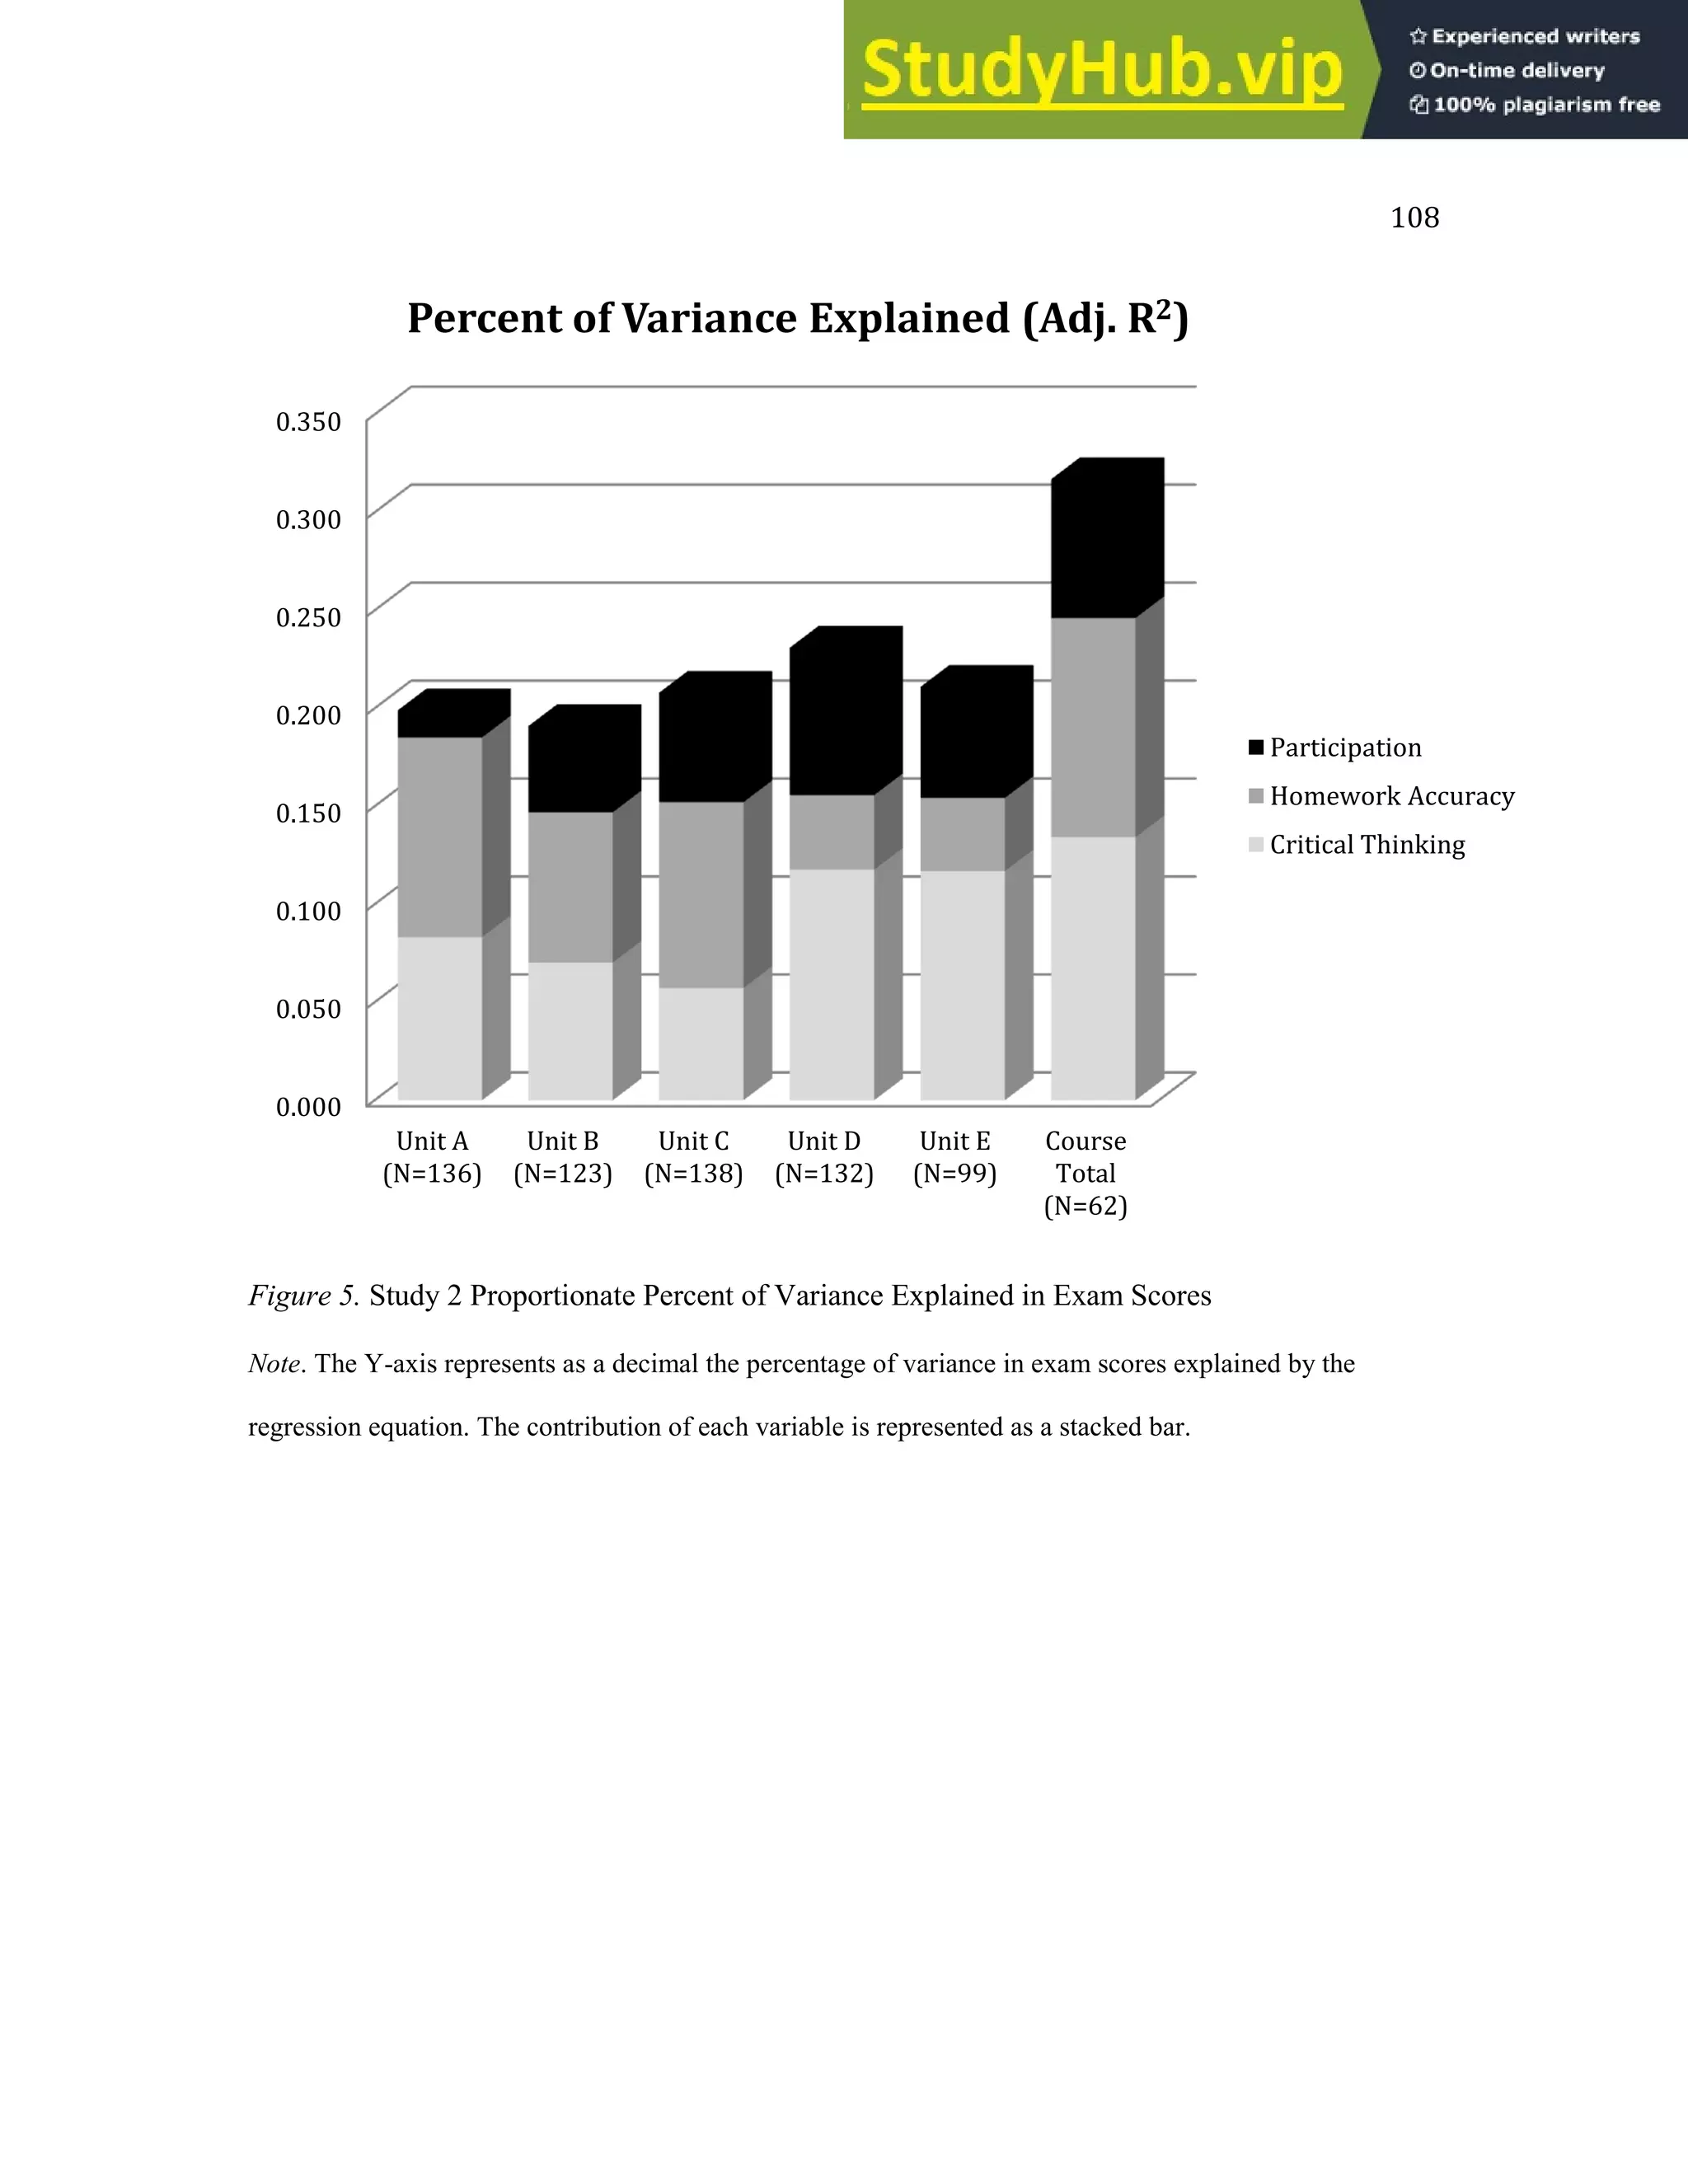
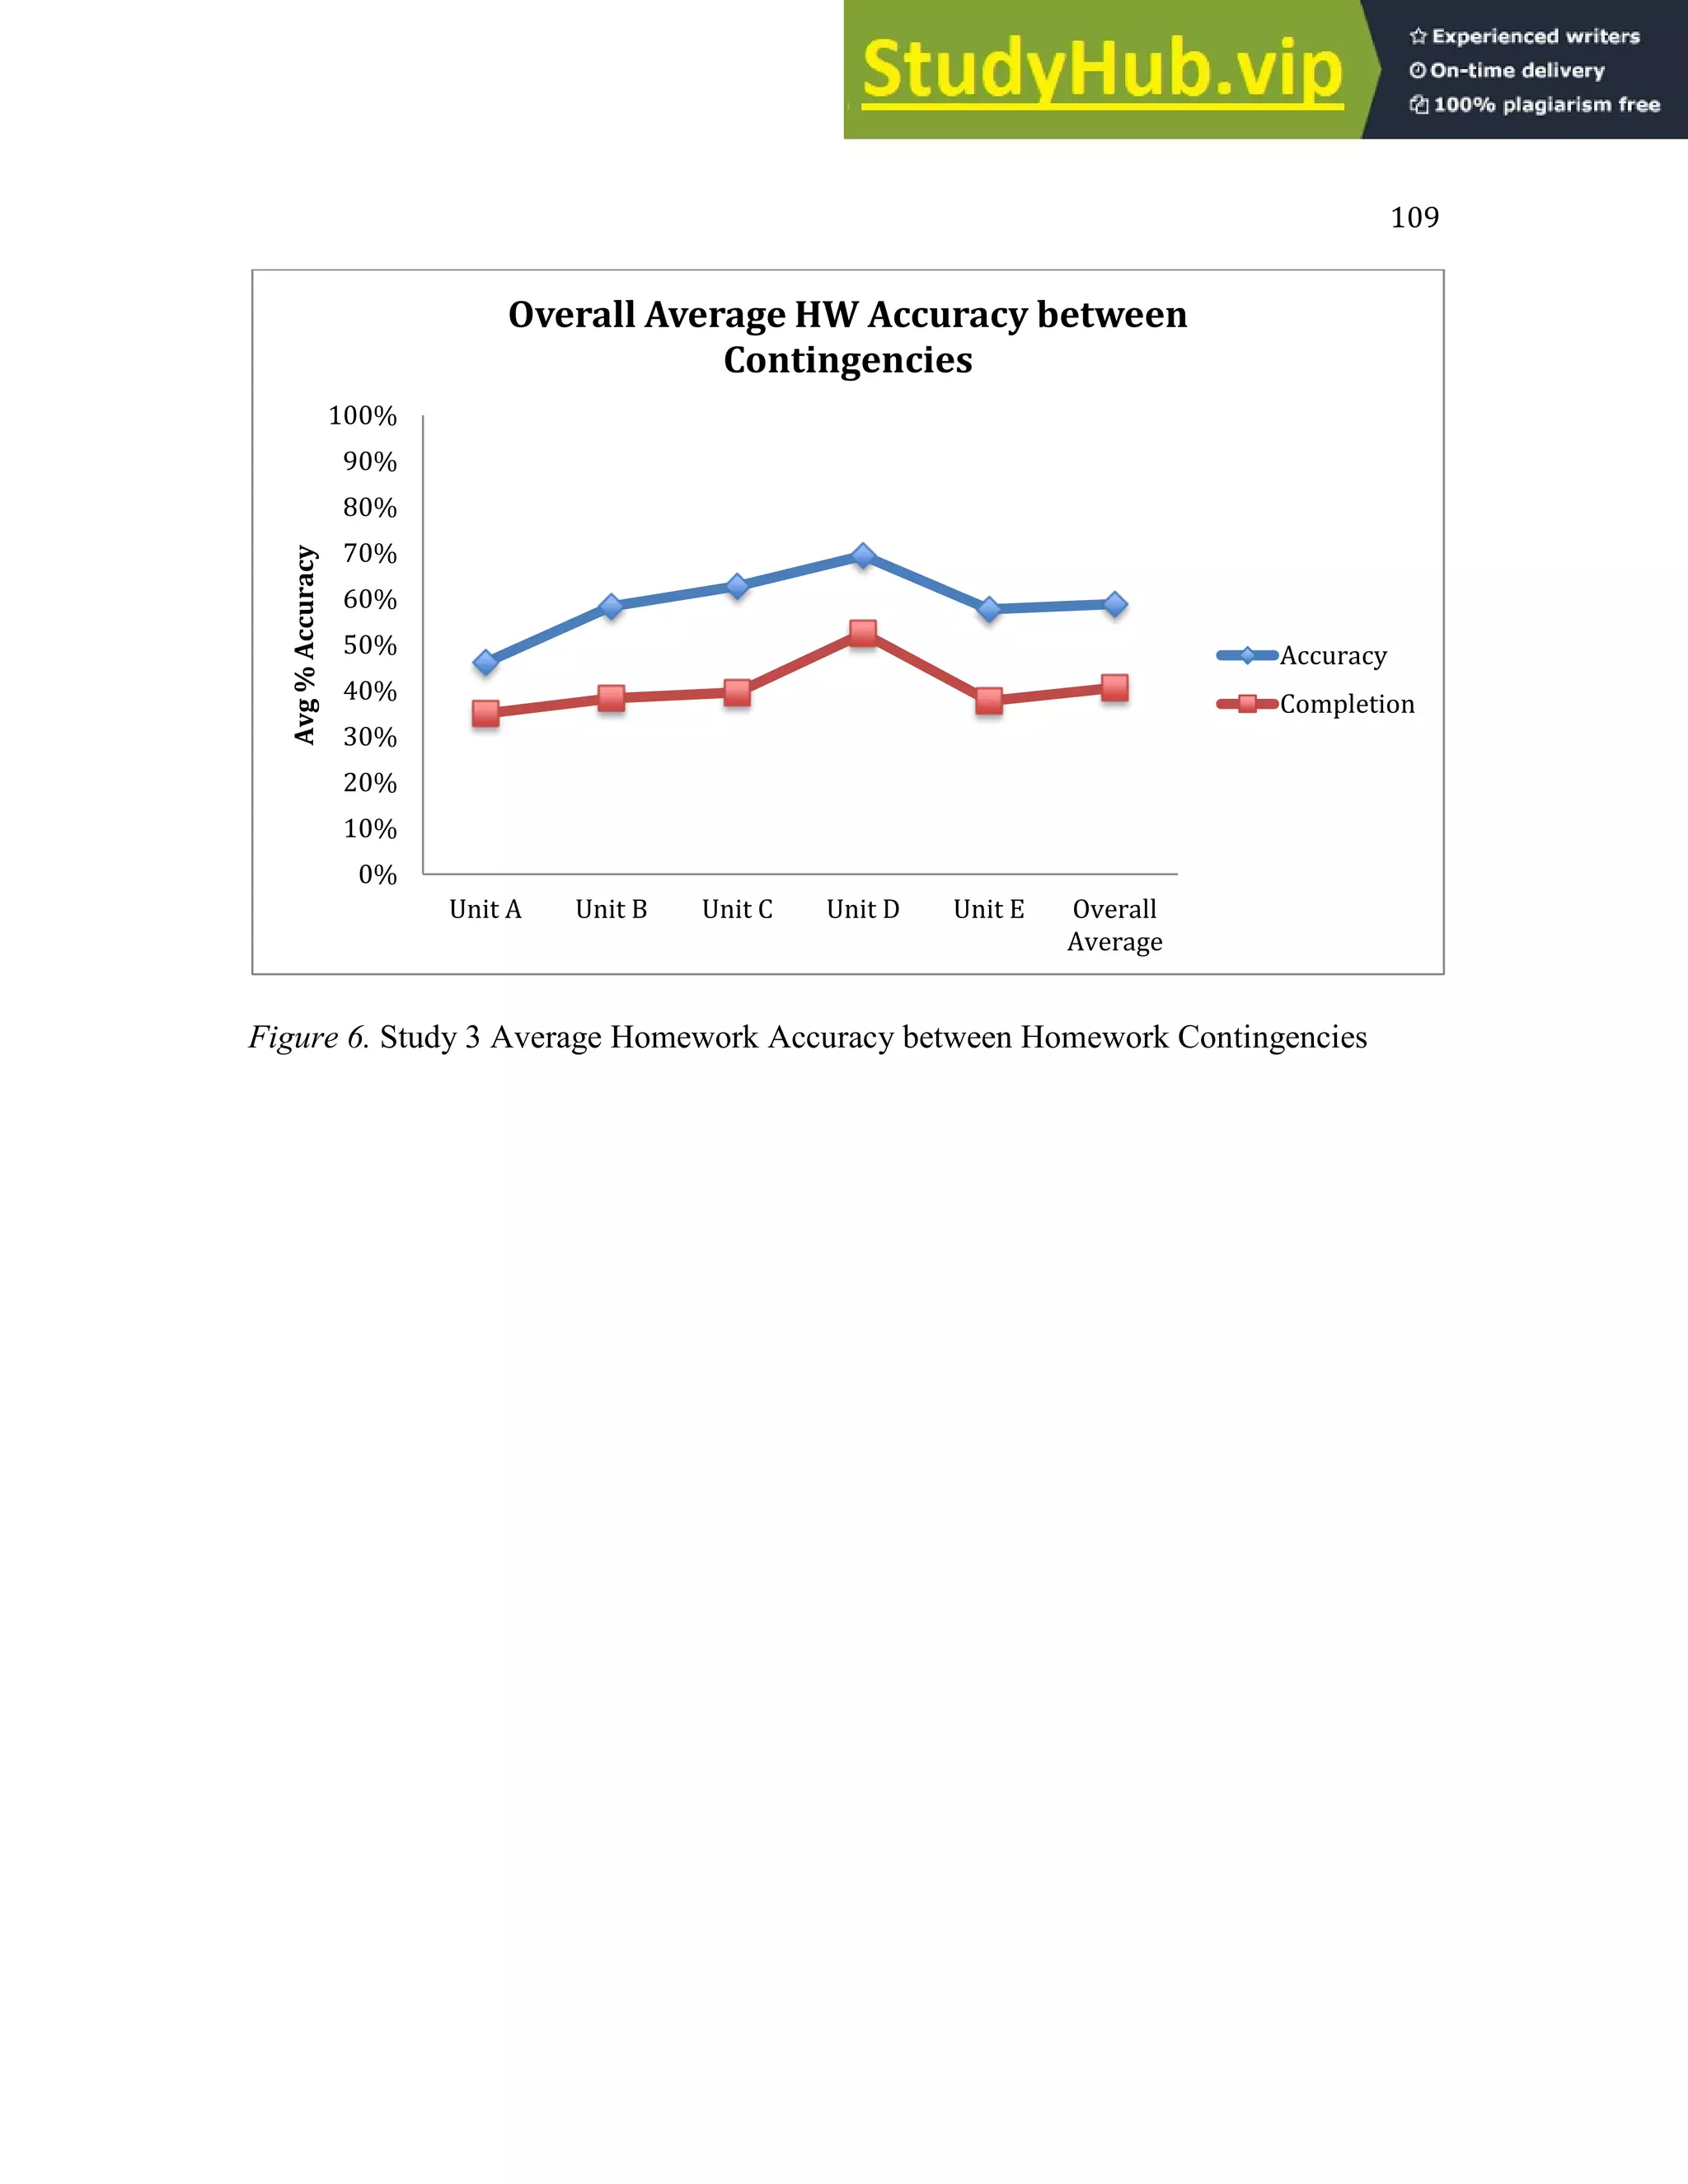
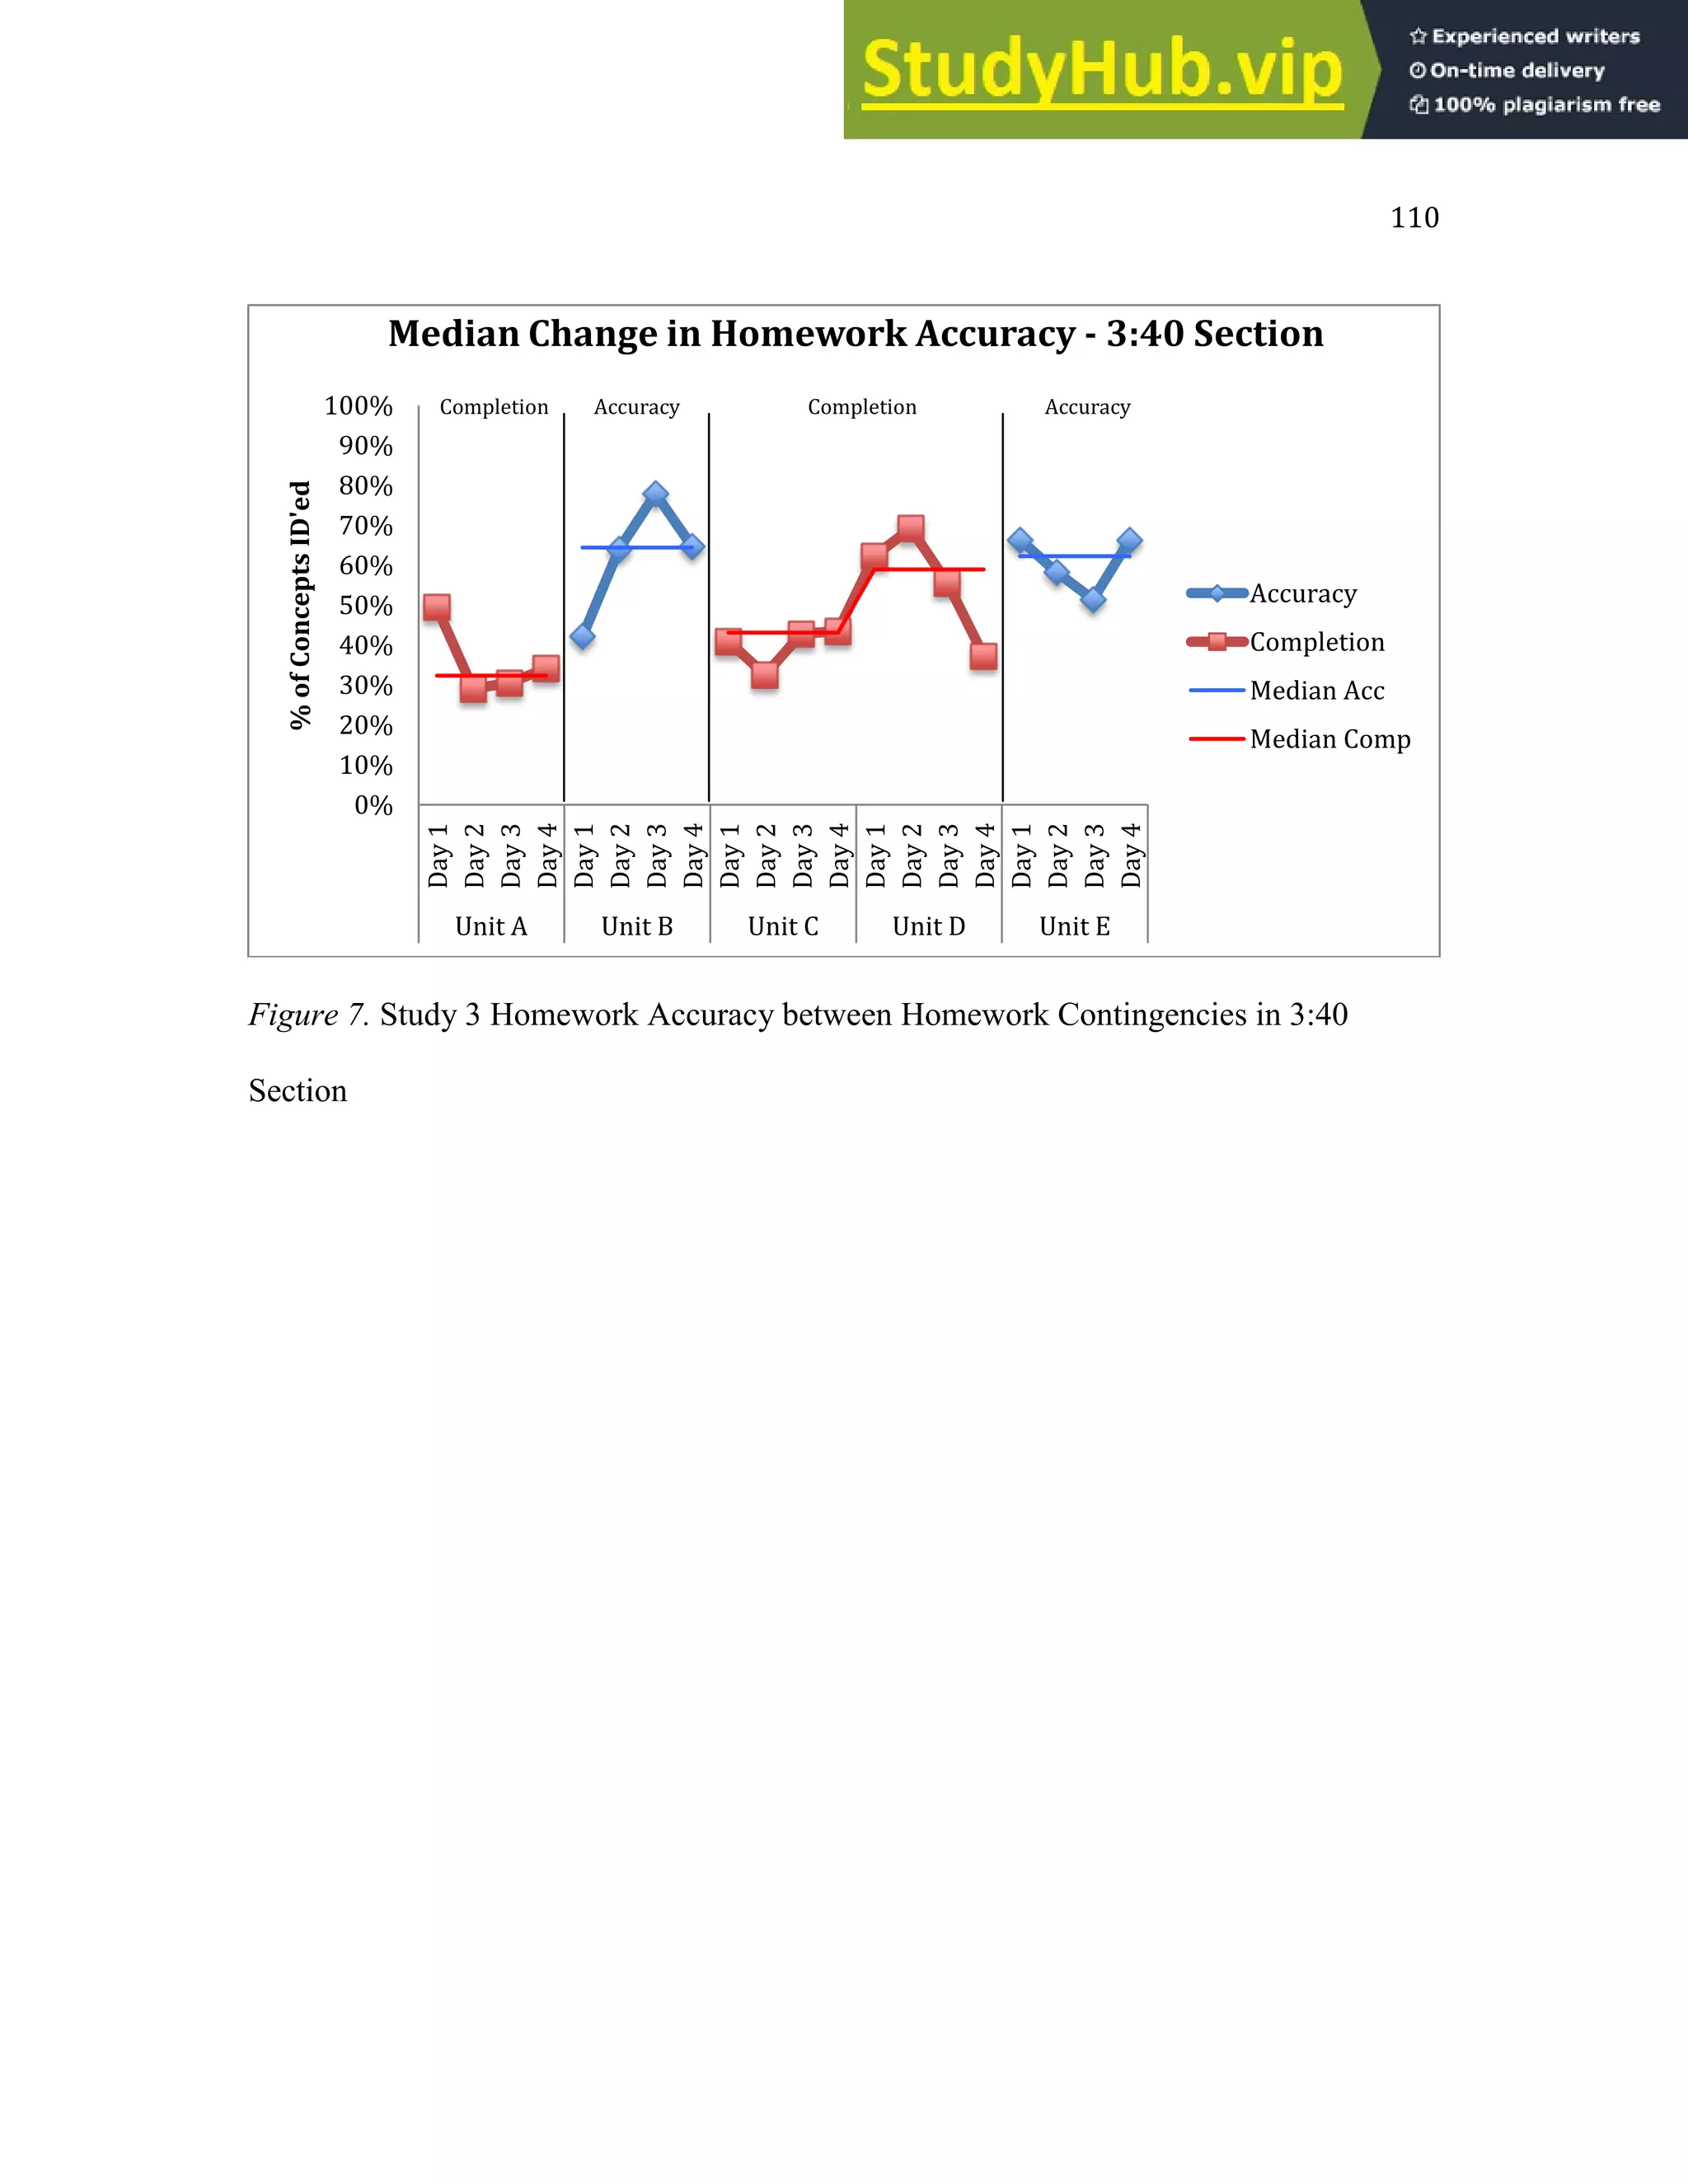
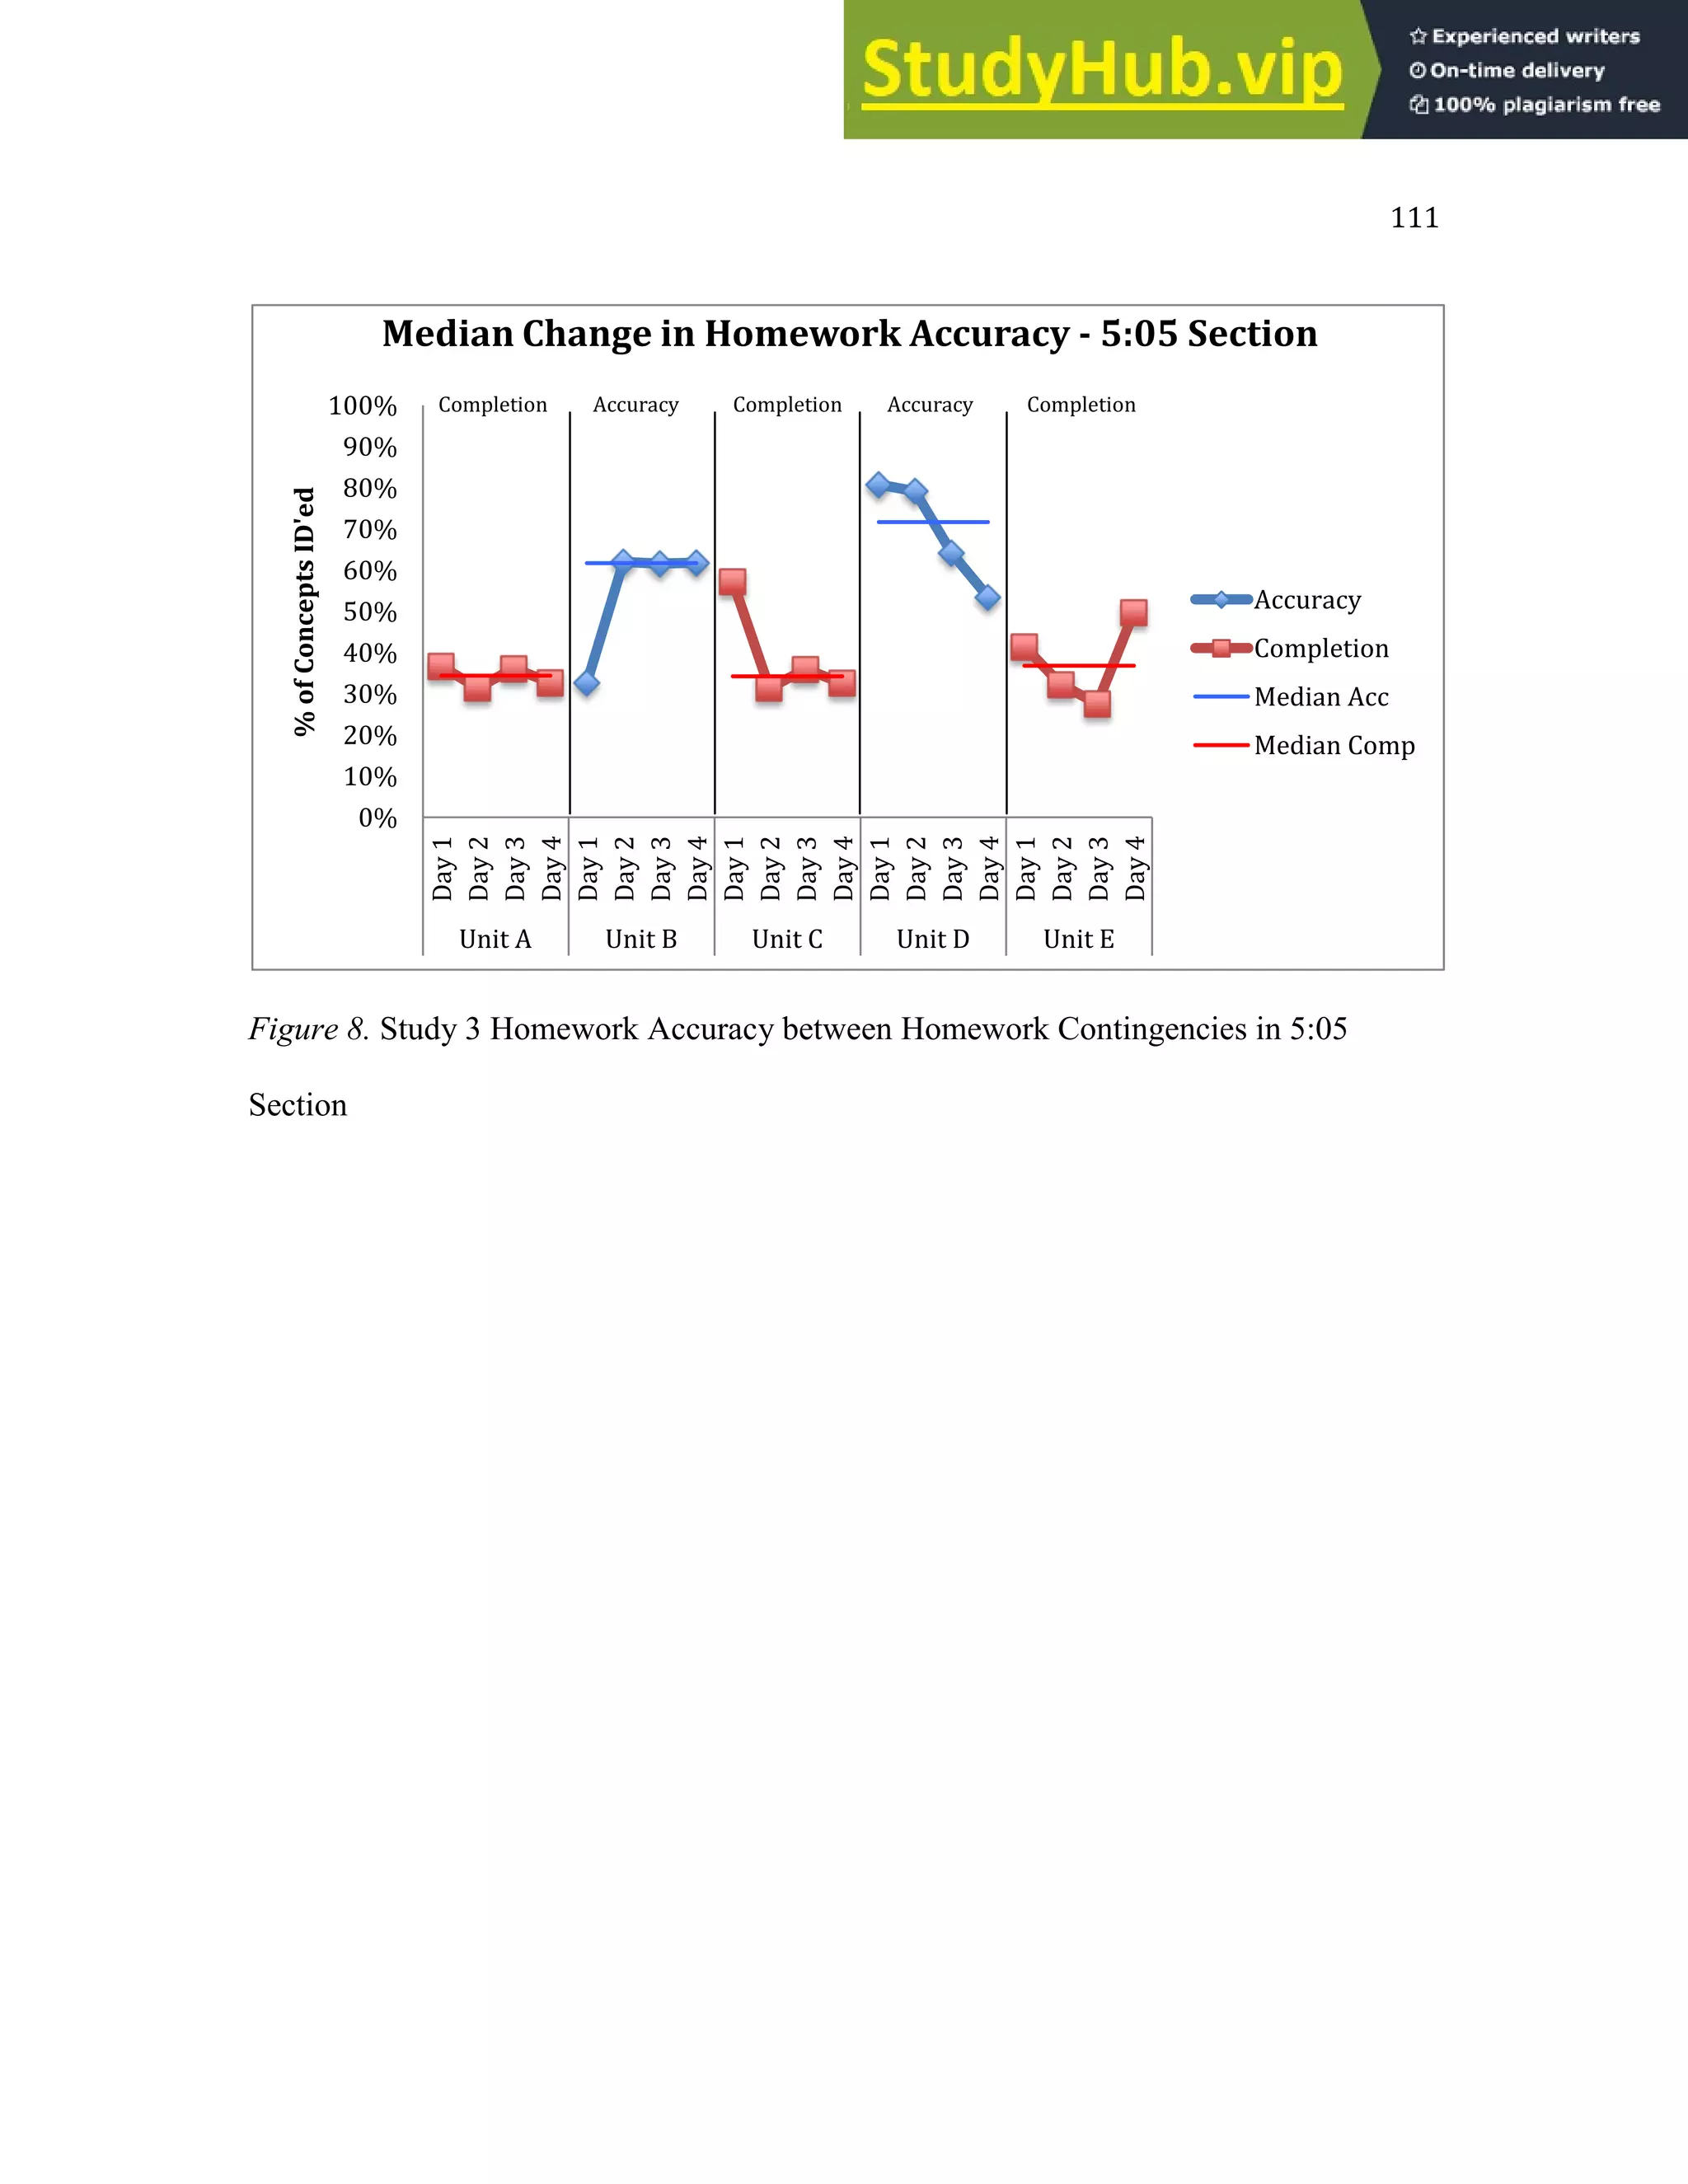
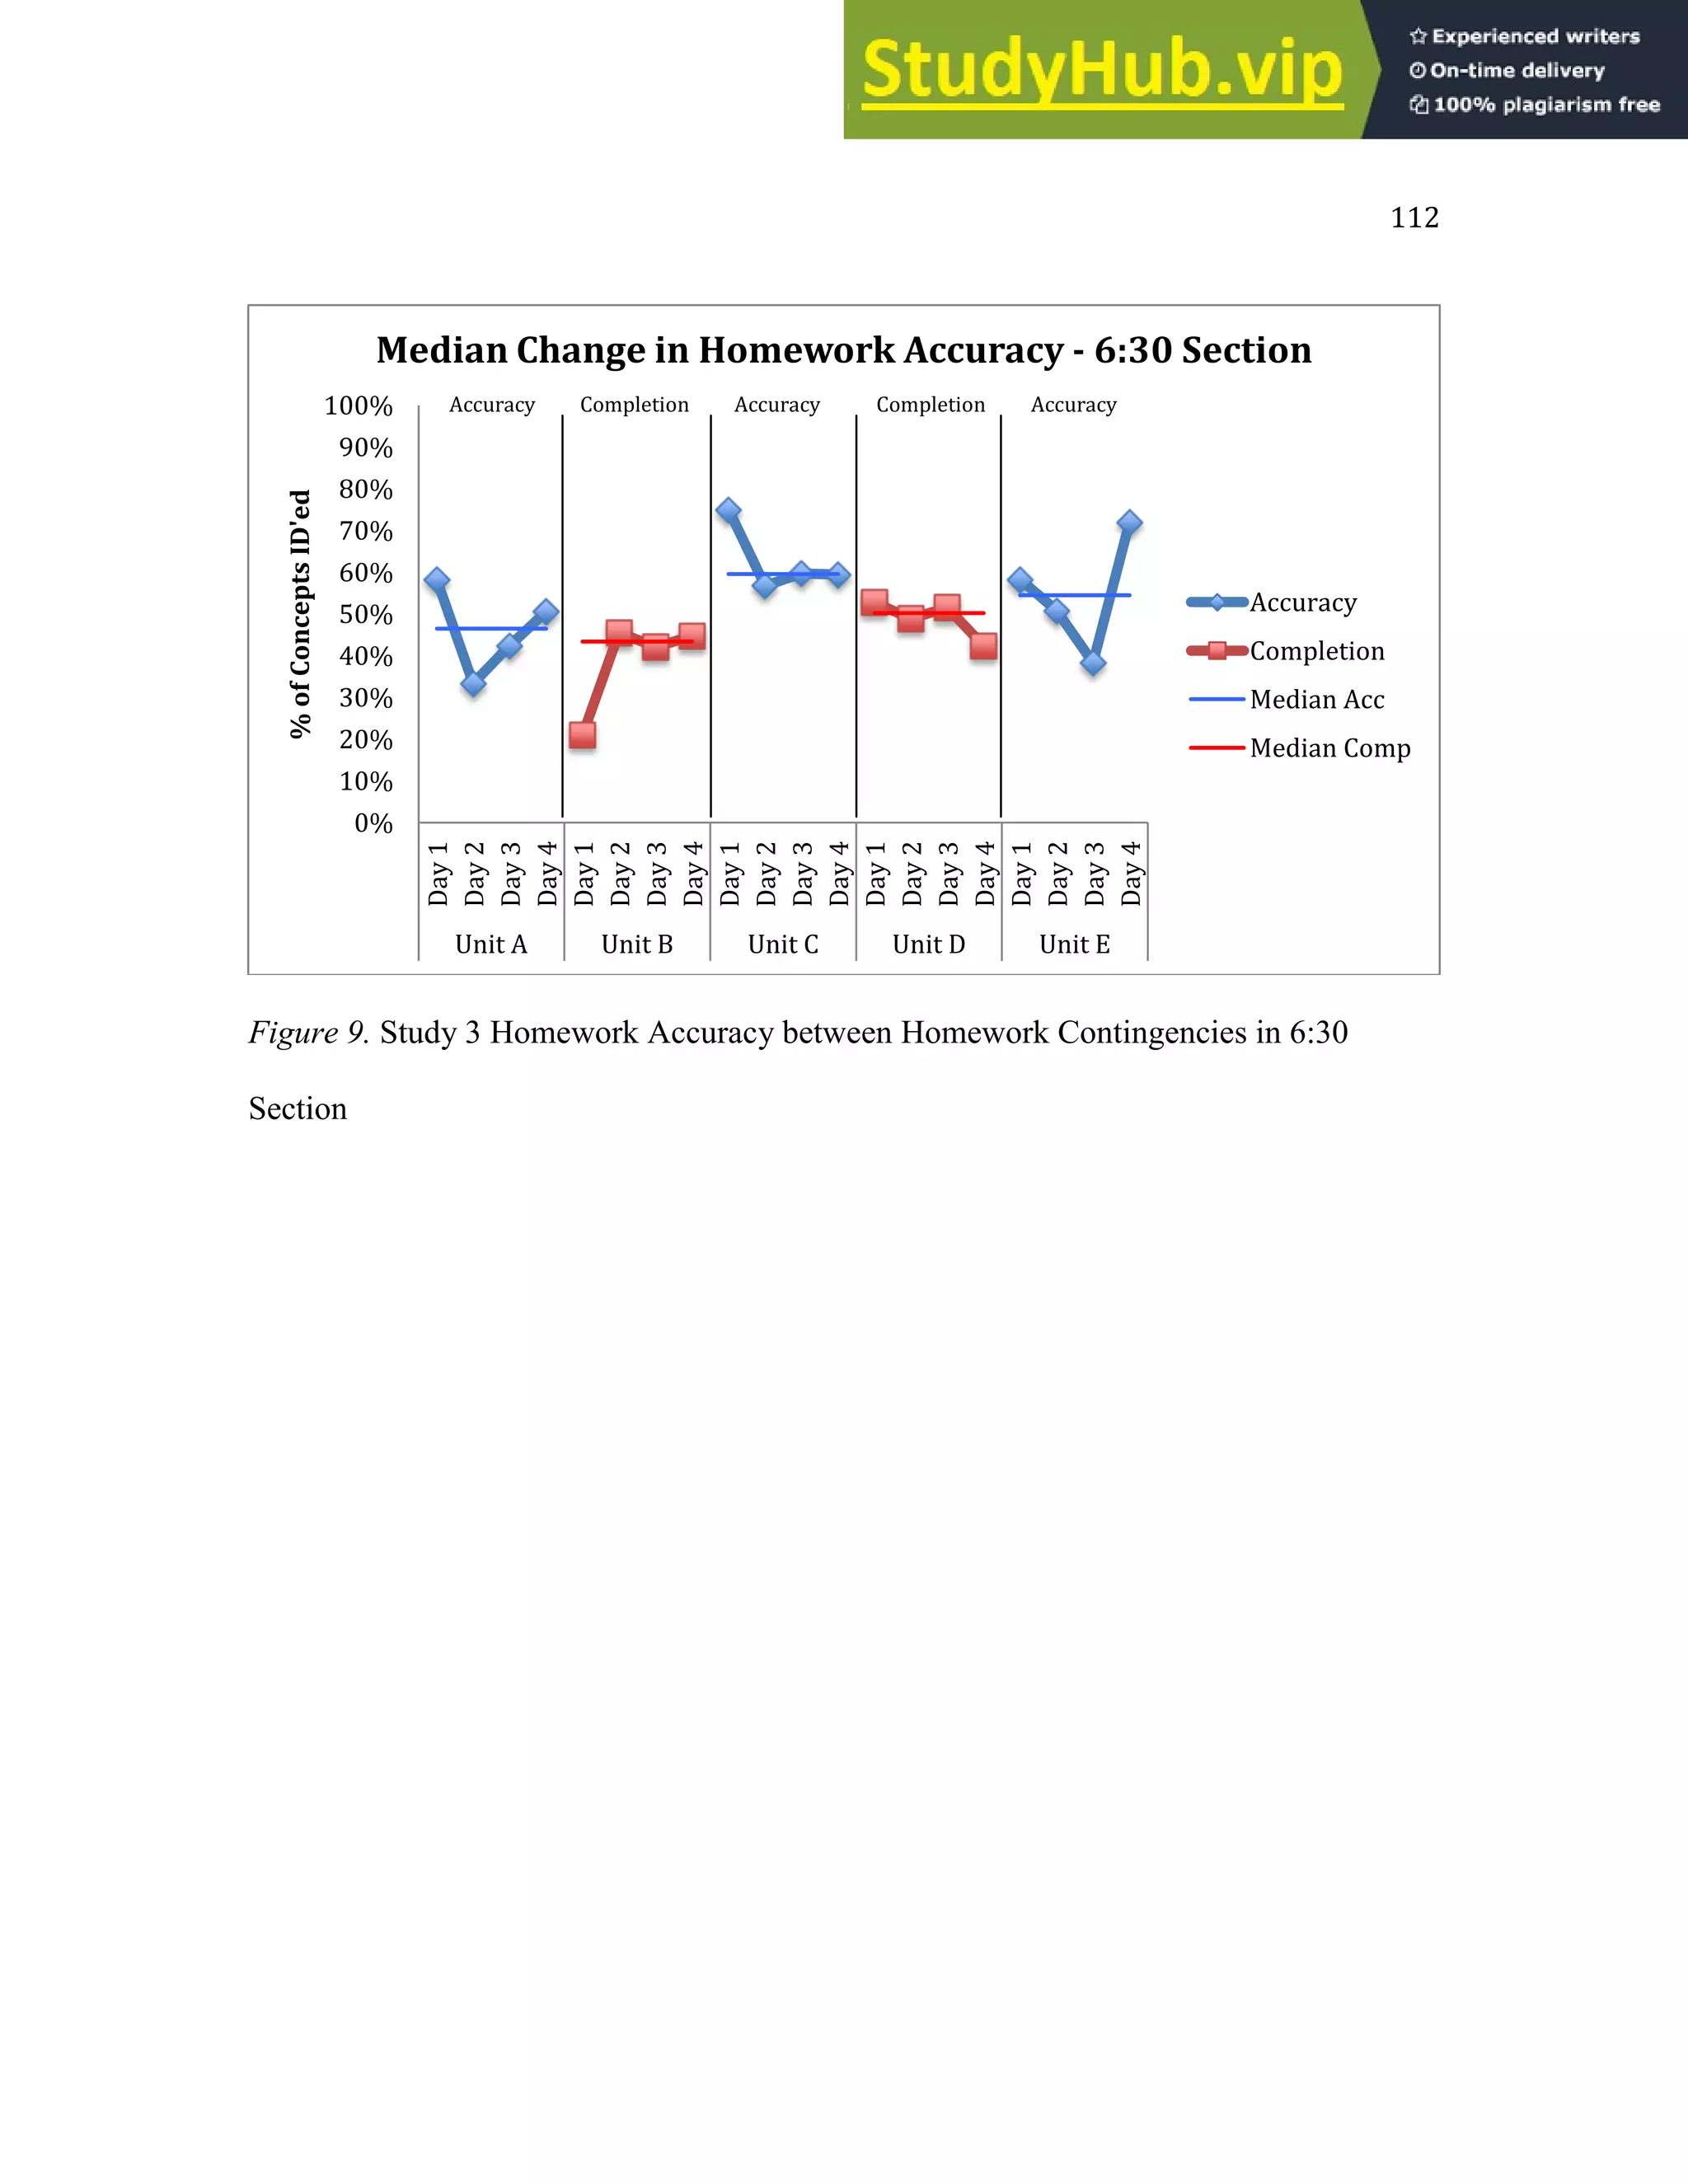
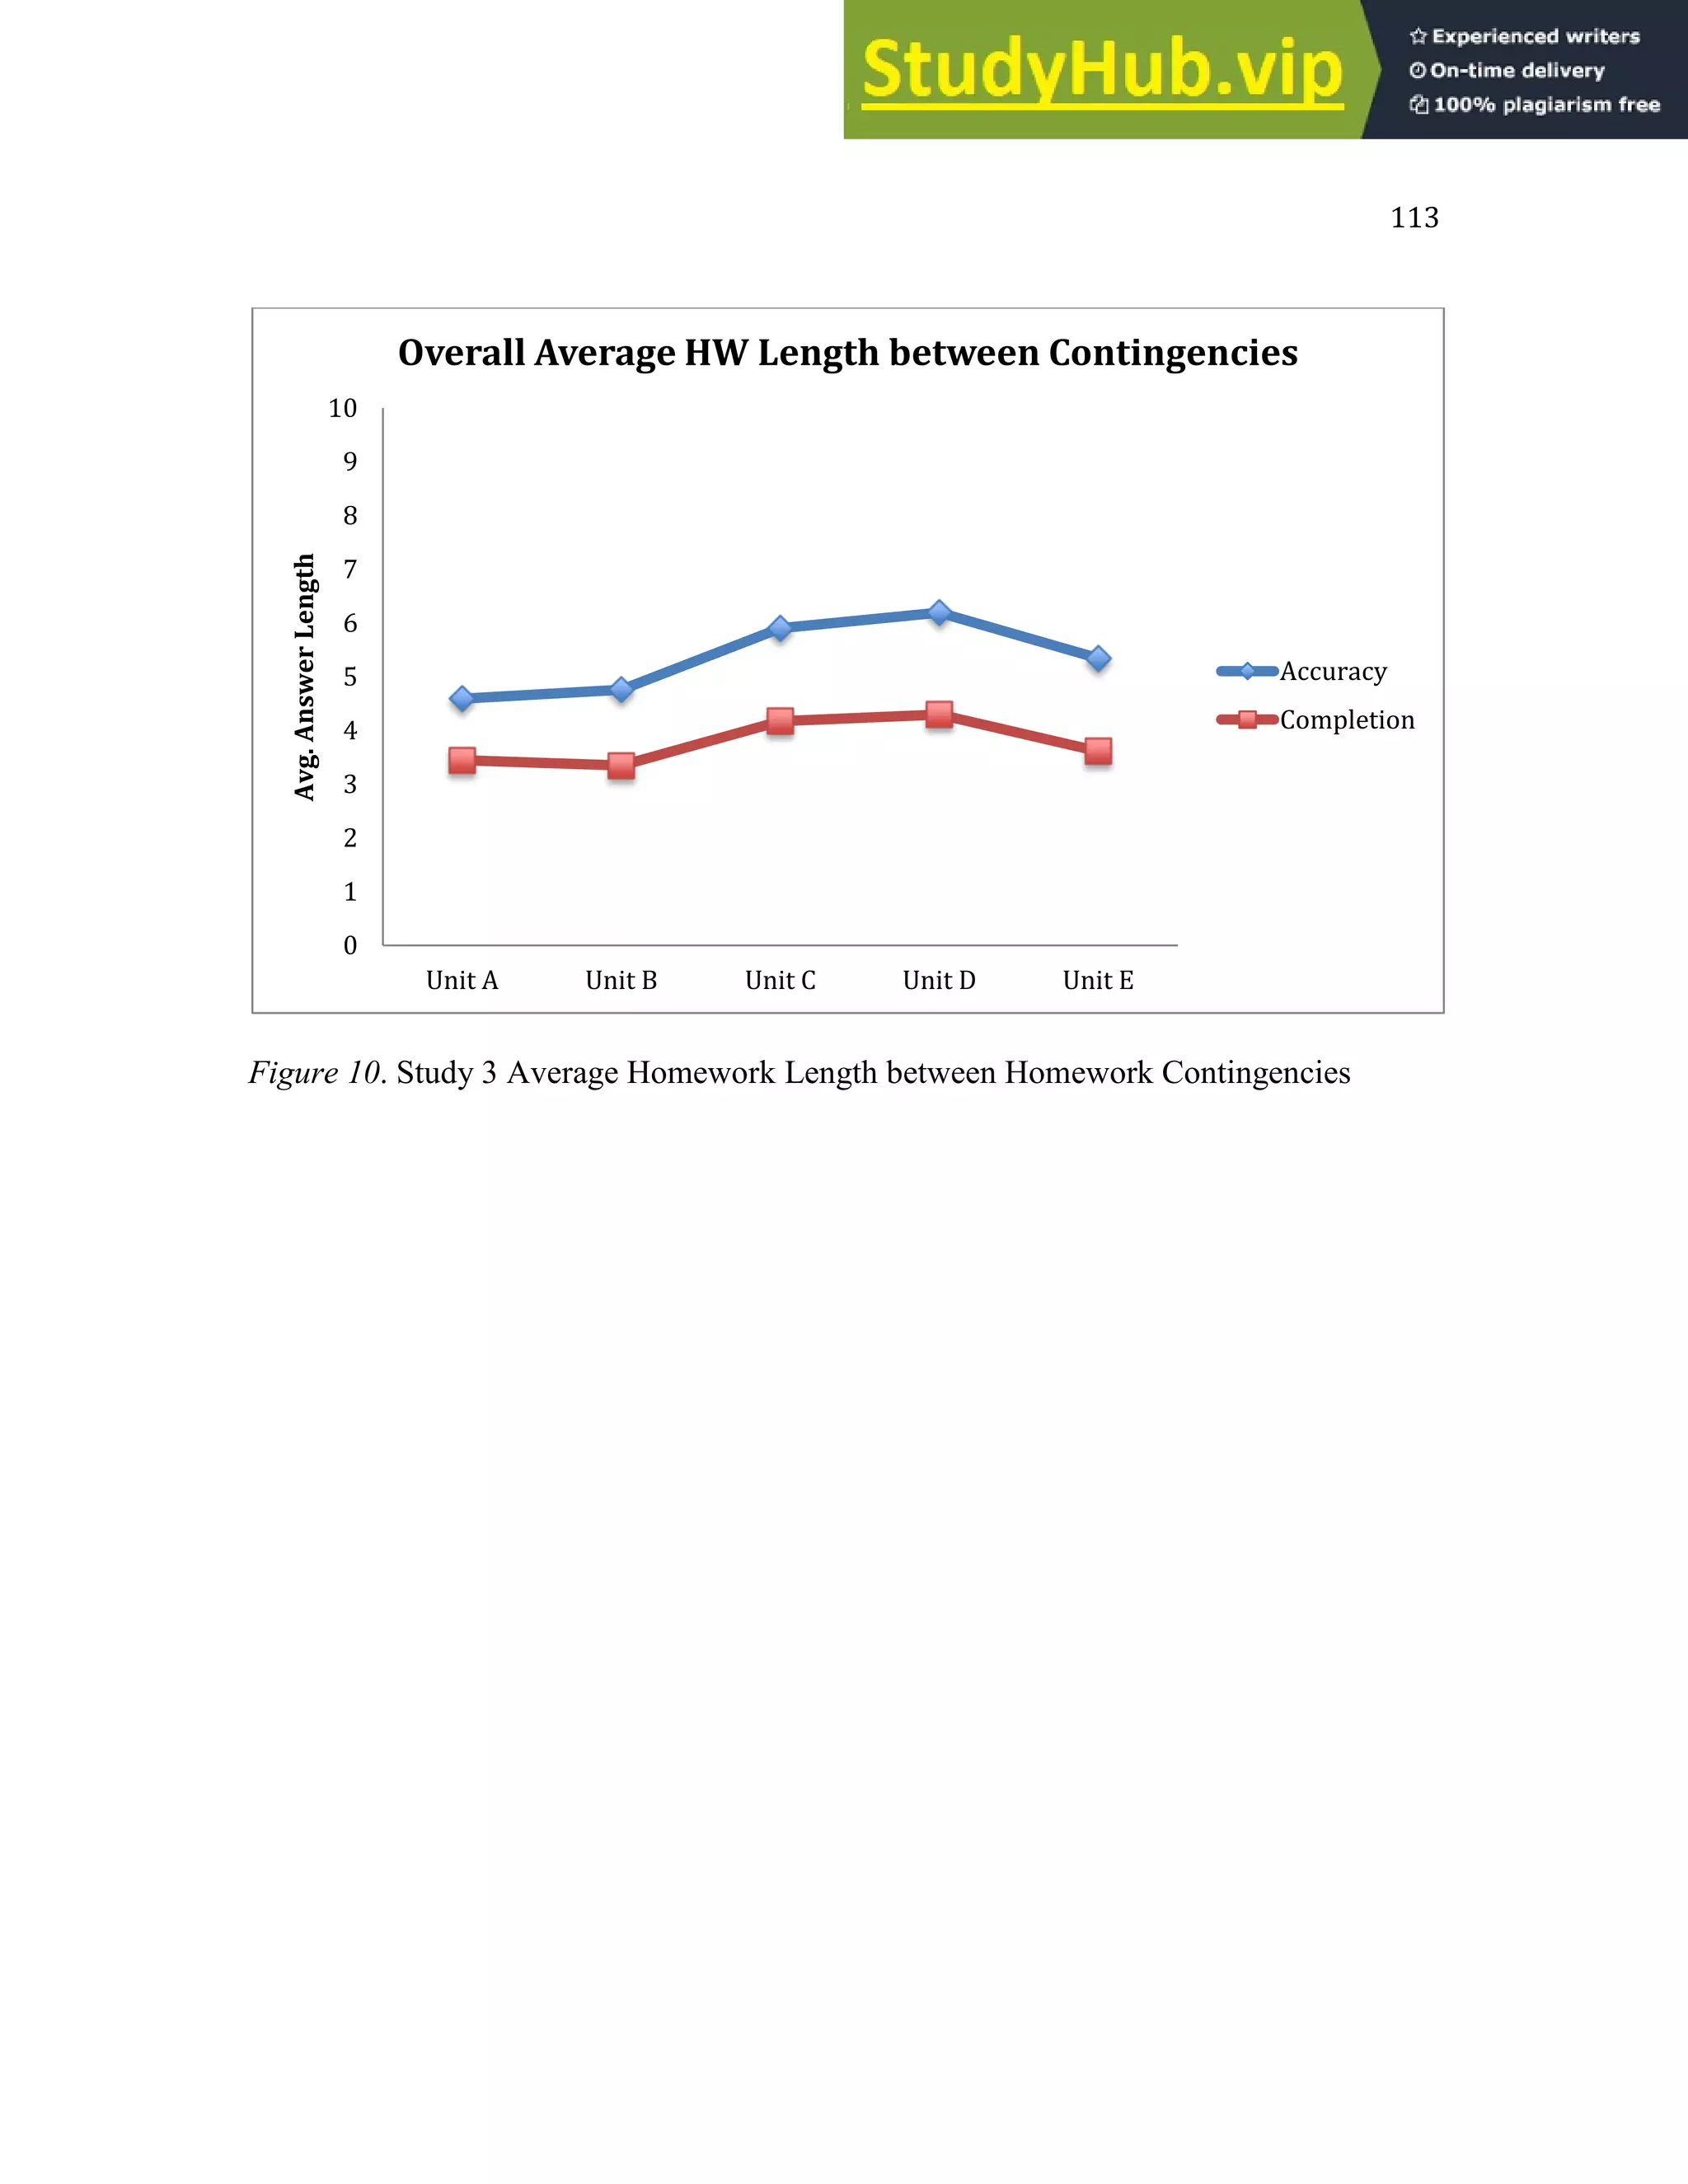
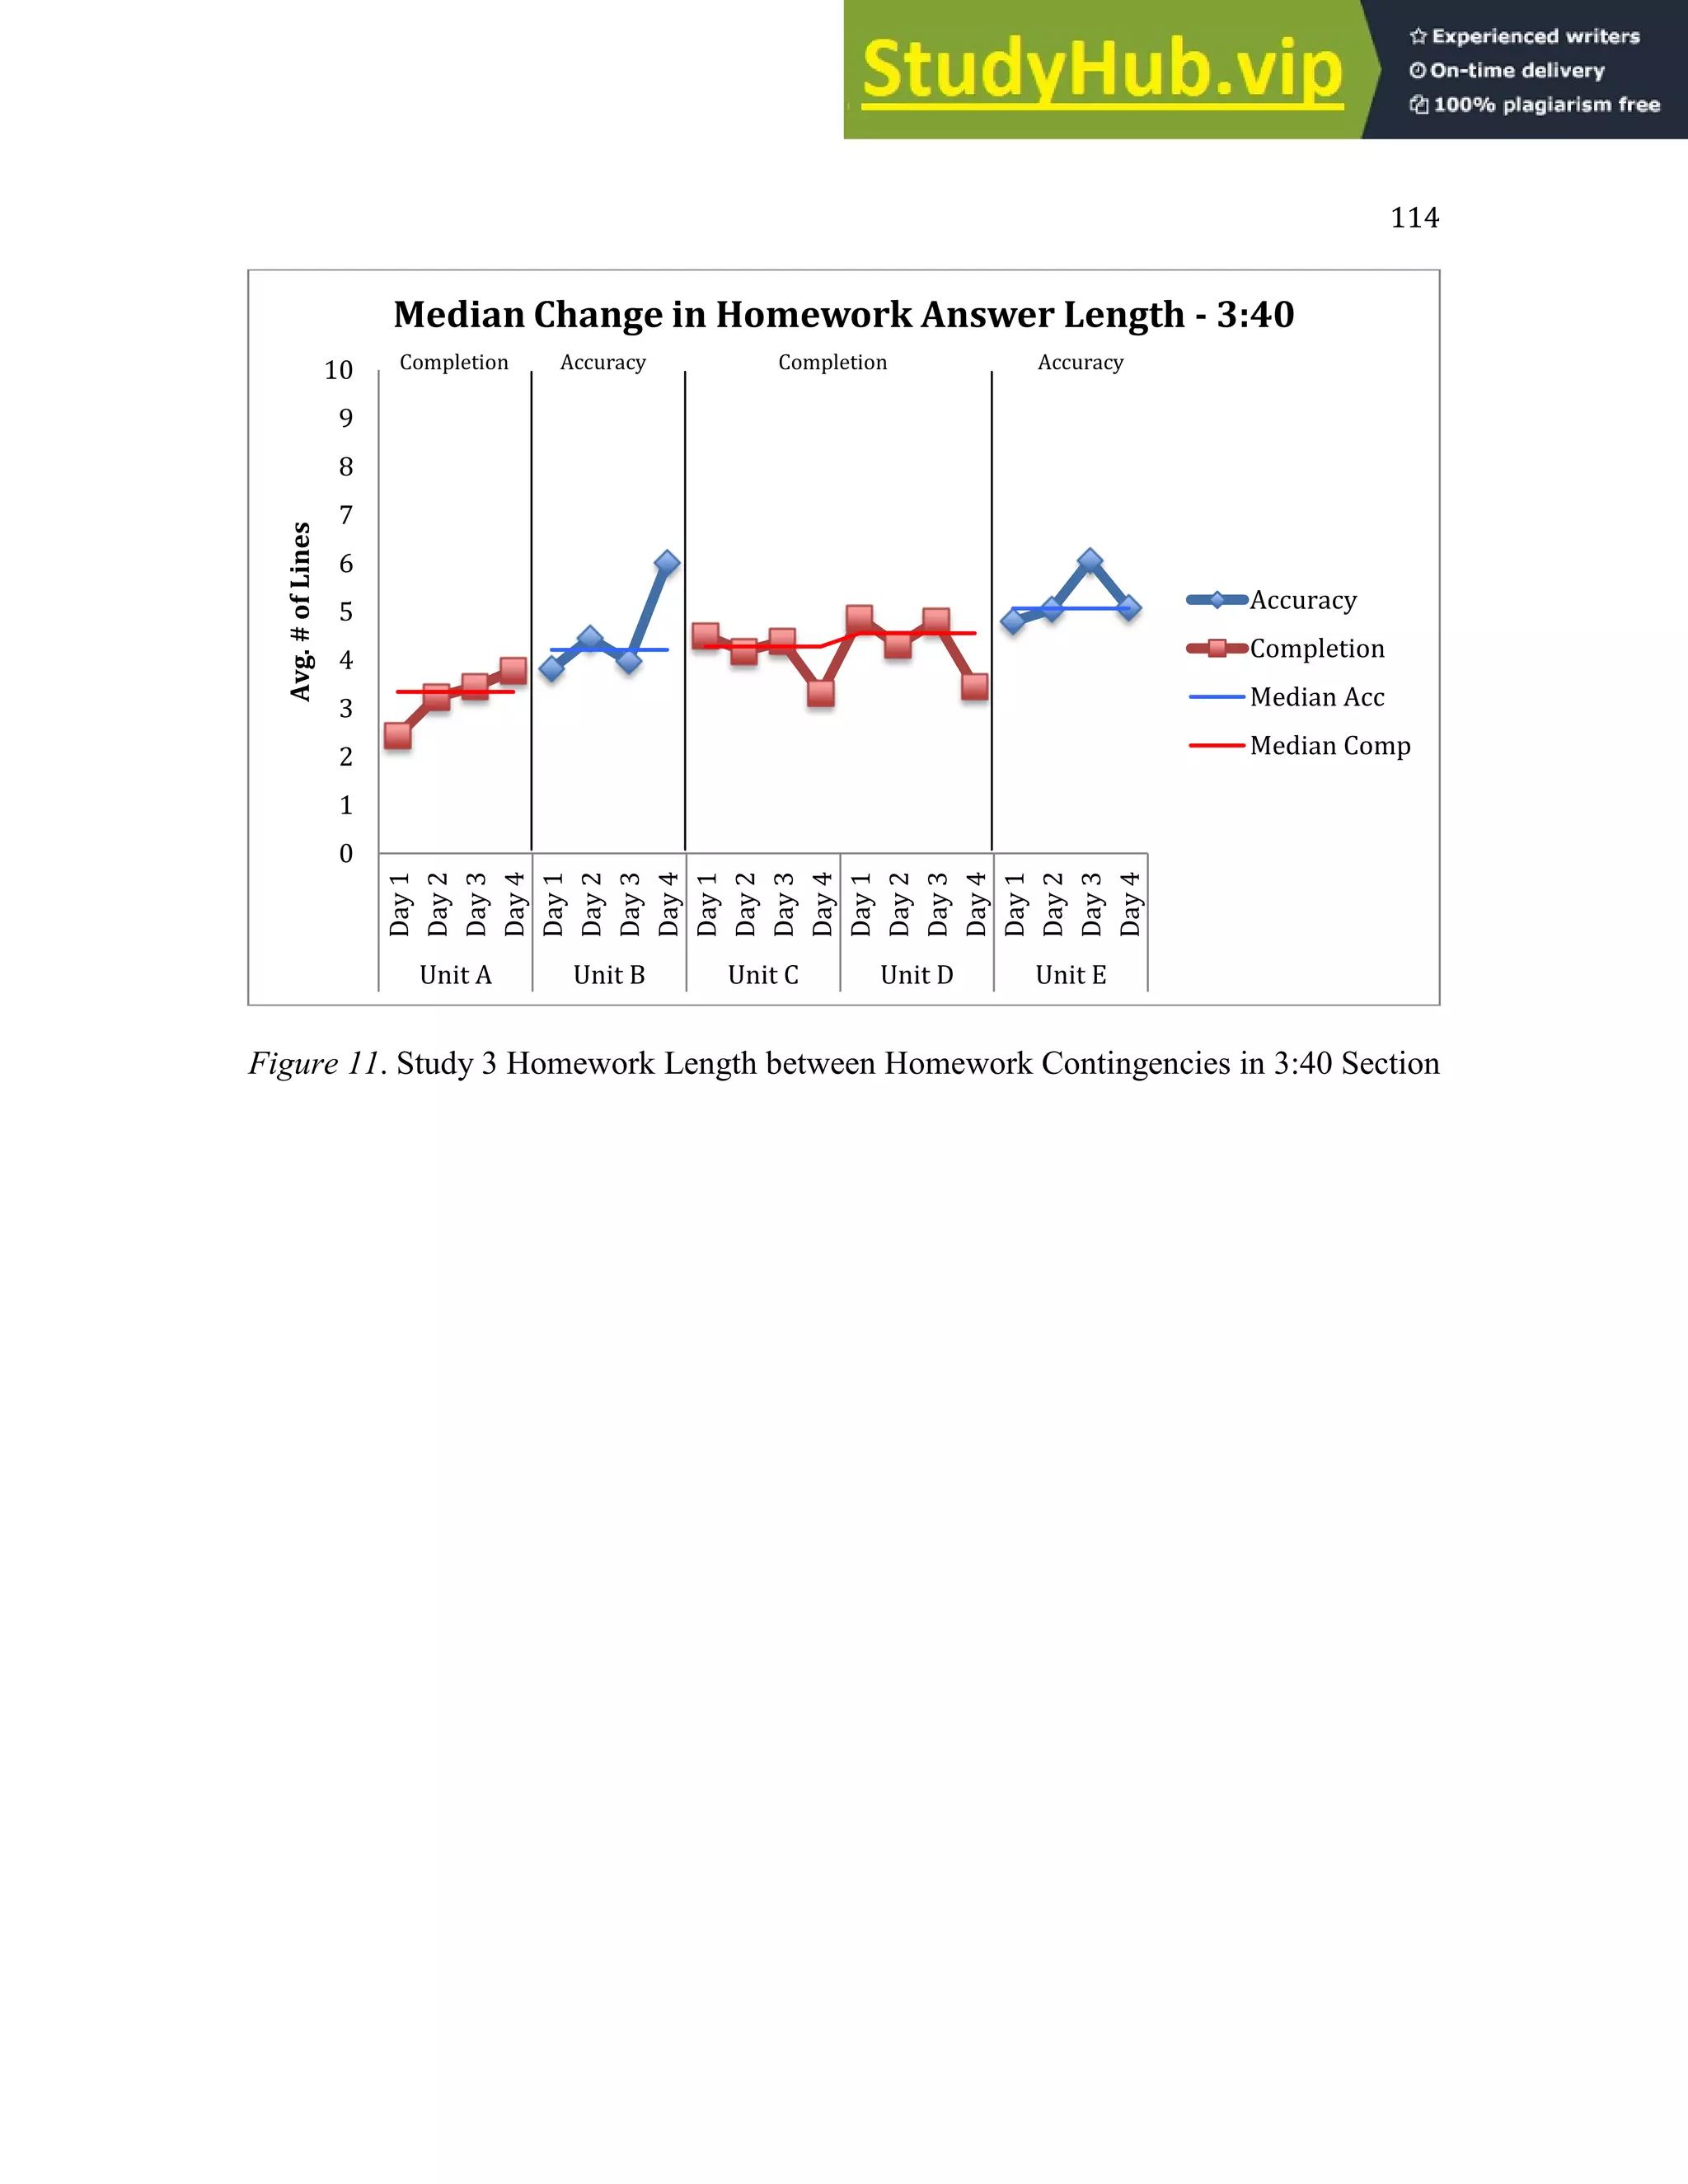
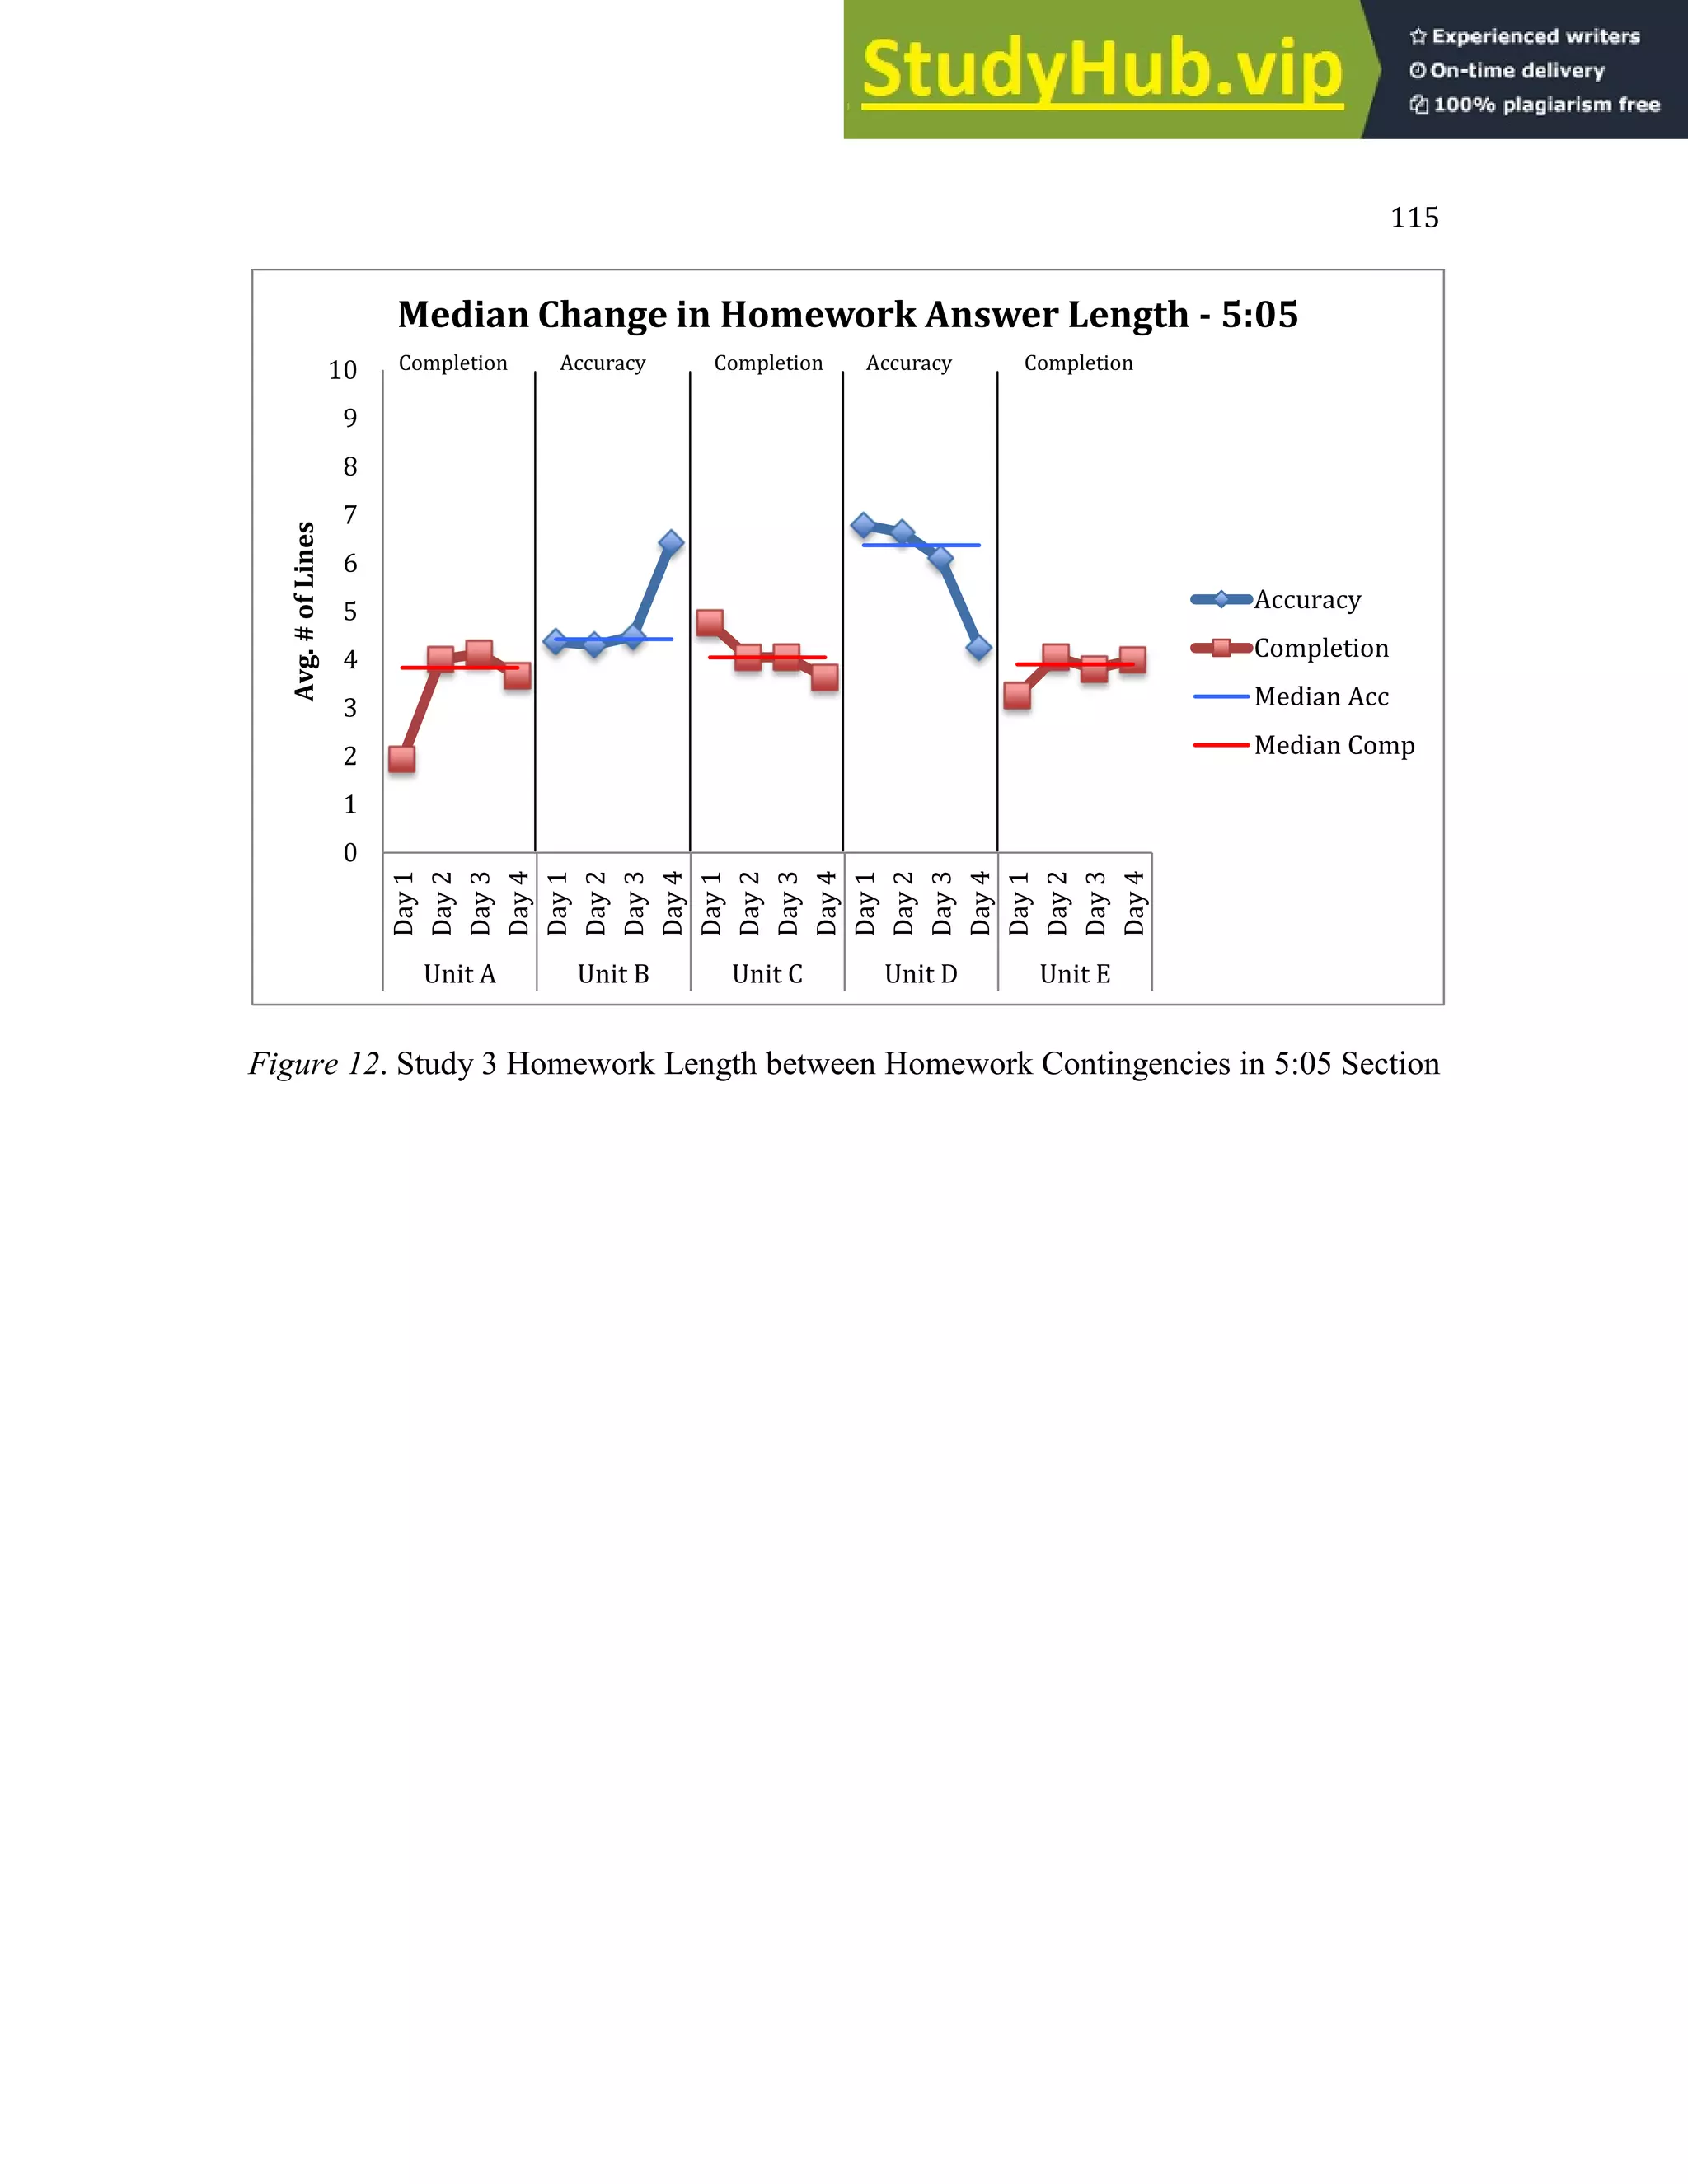
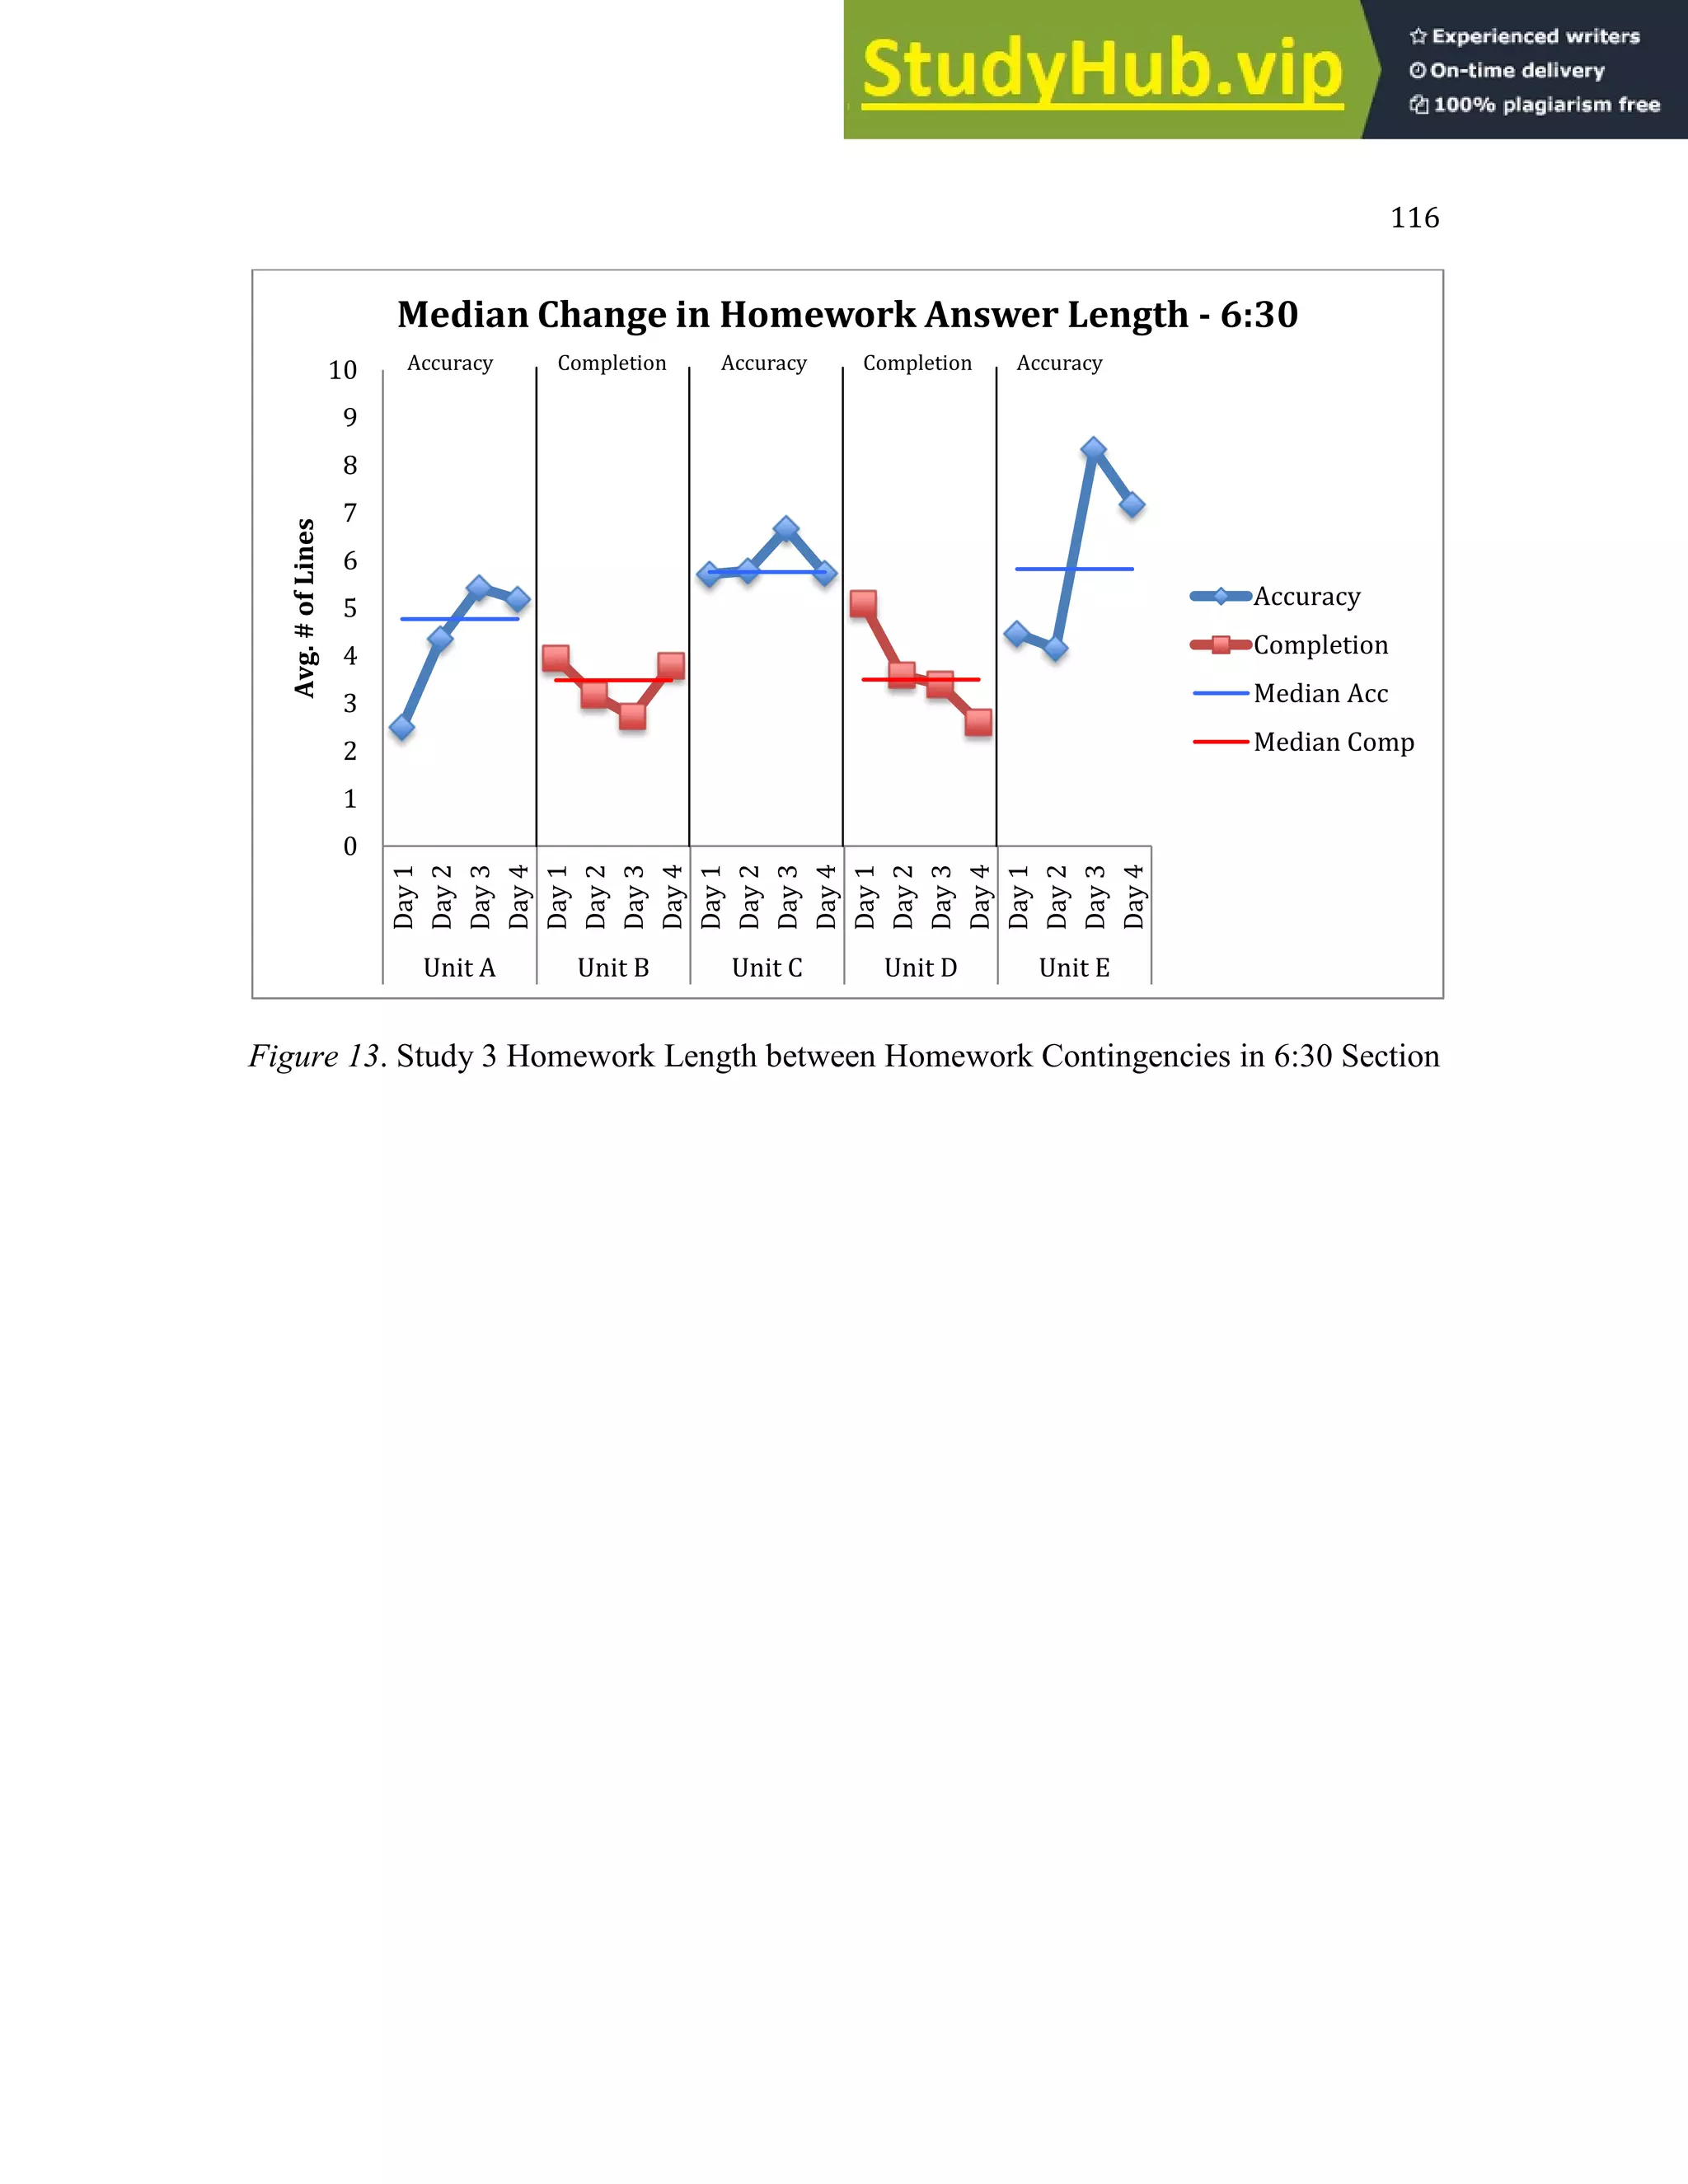
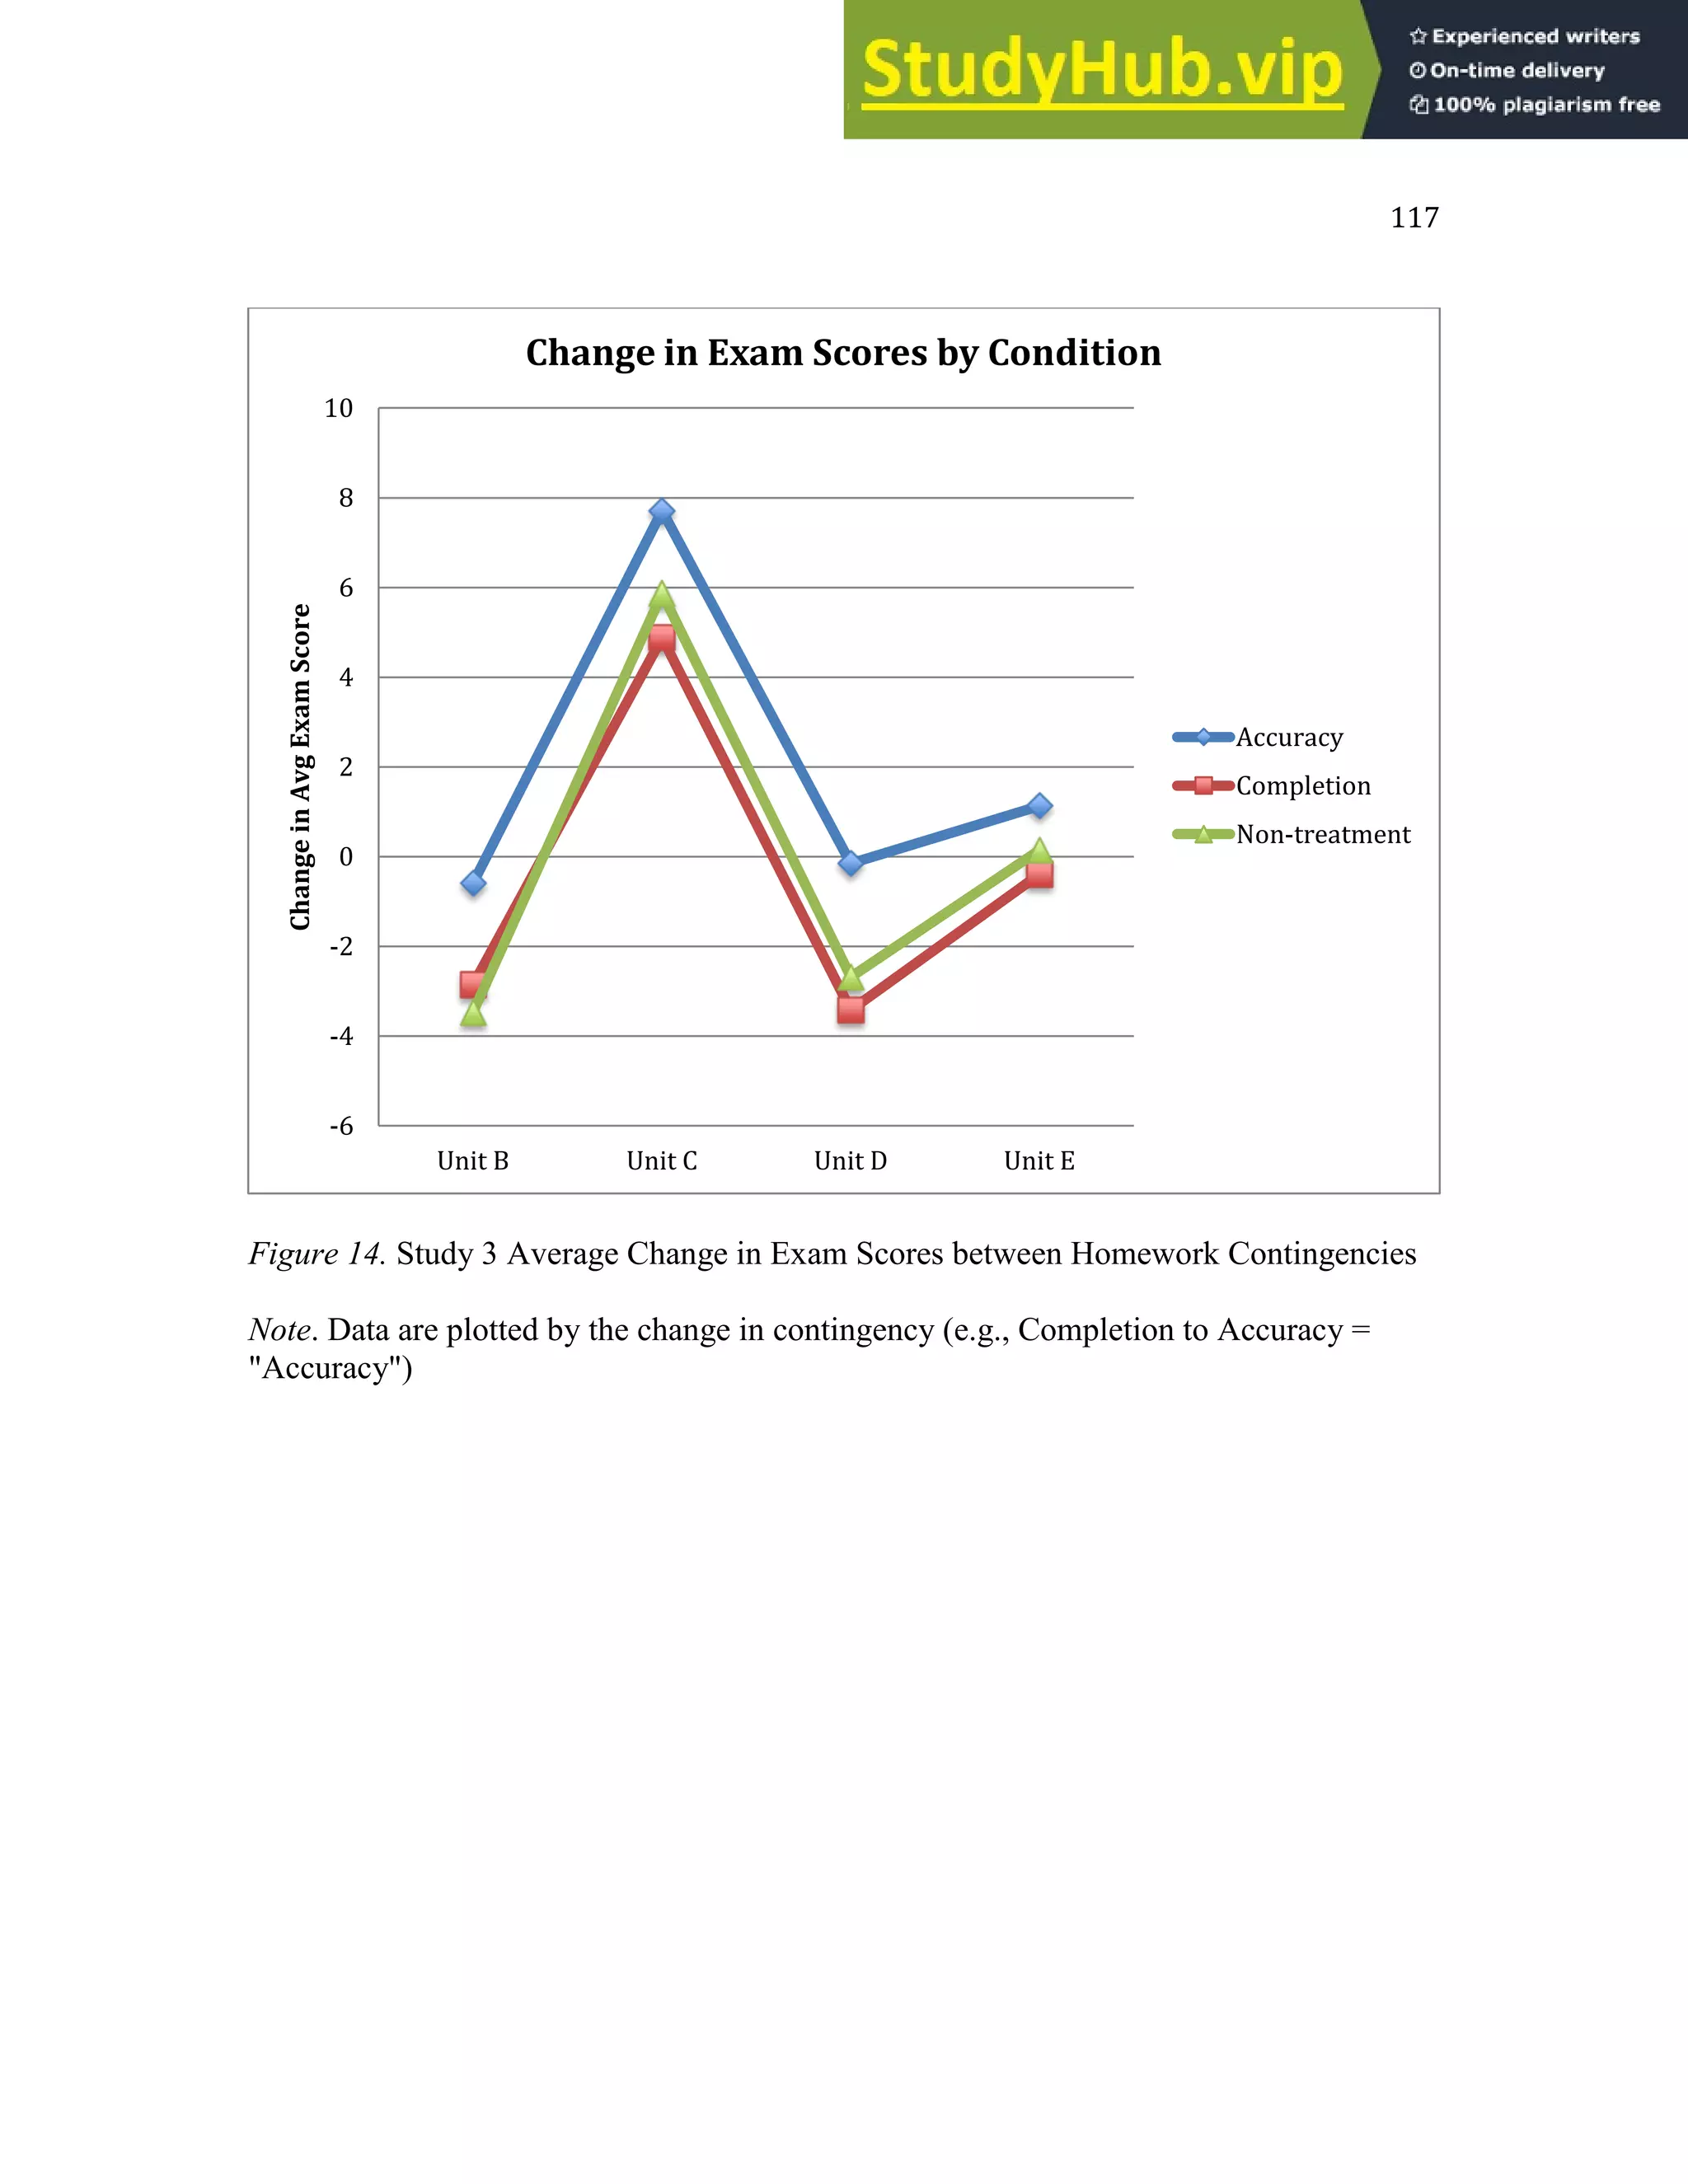


This dissertation examined the role of homework in predicting and improving exam performance for students in an undergraduate educational psychology course over multiple years. Study 1 analyzed exam scores, critical thinking skills, and GPA data from over 3,500 students across seven years. It found distinctive patterns in exam scores across course units and differences between early-career and late-career students. Study 2 (N=167) evaluated relationships between critical thinking, class participation, homework accuracy, and exam performance. It found homework accuracy significantly predicted exam scores, sometimes more strongly than critical thinking. Study 3 (N=71) found making course credit contingent on accurate homework increased both homework accuracy and thoroughness, and improved overall exam scores, breaking a historical pattern of lower scores


![Homework[1]](https://cdn.slidesharecdn.com/ss_thumbnails/homework1-100225164653-phpapp02-thumbnail.jpg?width=640&height=640&fit=bounds)


