
Recommended
More Related Content
What's hot
Viewers also liked
Viewers also liked (10)
Similar to Analysis of questionnaire results
Similar to Analysis of questionnaire results (20)
More from haajira
Analysis of questionnaire results
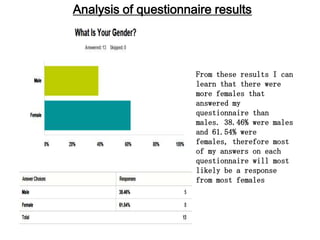
- 1. Analysis of questionnaire results From these results I can learn that there were more females that answered my questionnaire than males. 38.46% were males and 61.54% were females, therefore most of my answers on each questionnaire will most likely be a response from most females
- 2. From these results I can learn that the majority of people who answered my questionnaire are from ages 16-18 therefore a minority were 19-21. 84.62% were 16-18 and 15.38% were 19-21
- 3. From these results it is evident that a large number of people who answered my questionnaire do buy magazines. 62.93% answered Yes and 30.77% answered No
- 4. By analysing this graph I can identify from it that a majority of people purchase Fashion magazines, which proves to be the most popular. In comparison to a sports magazine where there is a 30% difference, making it clear that it is the least popular, along with Entertainment at 20% and Music at 30%.
- 5. From these results it is evident that a majority of people listen to Hip-Hop and Pop rather than rock and dance. Both genres received the same response of 41.67% whereas rock and dance came in at 8.33% and Indie 0%. This is clear that people enjoy listening to Hip-Hop and Pop rather than Indie.
- 6. By looking at this graph I can clearly see that majority of people prefer to listen to Rihanna whereas not many would listen to One Direction. I have concluded this based on the questionnaire responses with Rihanna at 38.46% and One Direction at 0% proving to be least popular amongst the others. 30.77% answered Eminem and Chris Brown, Lana Del Rey sitting on 15.38%
- 7. From this graph I can see that a majority do not go to concerts and a minority do. 53.85% of people answered No and 46.15% answered Yes
- 8. By looking at this graph I can see that a majority of people would like to see CD’s/MP3’s as a freebie to come with their music magazine. Whereas only a minority chose posters. 53.85% answered CD’s/MP3’s, 30.77% answered Brand Merchandise and 15.38% answering Postings evidently being the least popular.
- 9. From these results I can learn that large amount of people will spend about £1- £3 on a magazine and only a minority will spend nothing. 84.62% of people will pay £1 - £3, whereas15.38% of people will not spend anything and nobody will spend above £3 on a magazine.
- 10. From these results I can see that a majority of people Socialise With Friends in their spare time whereas only a minority will Go To The Leisure Centre. 0% of people will go clubbing proving to be the least popular, 7.69% will go to the leisure centre, 23.08% will Listen To Music and 69.23% will Socialise With Friends evidently being the most popular thing to people in what they do in their spare time.