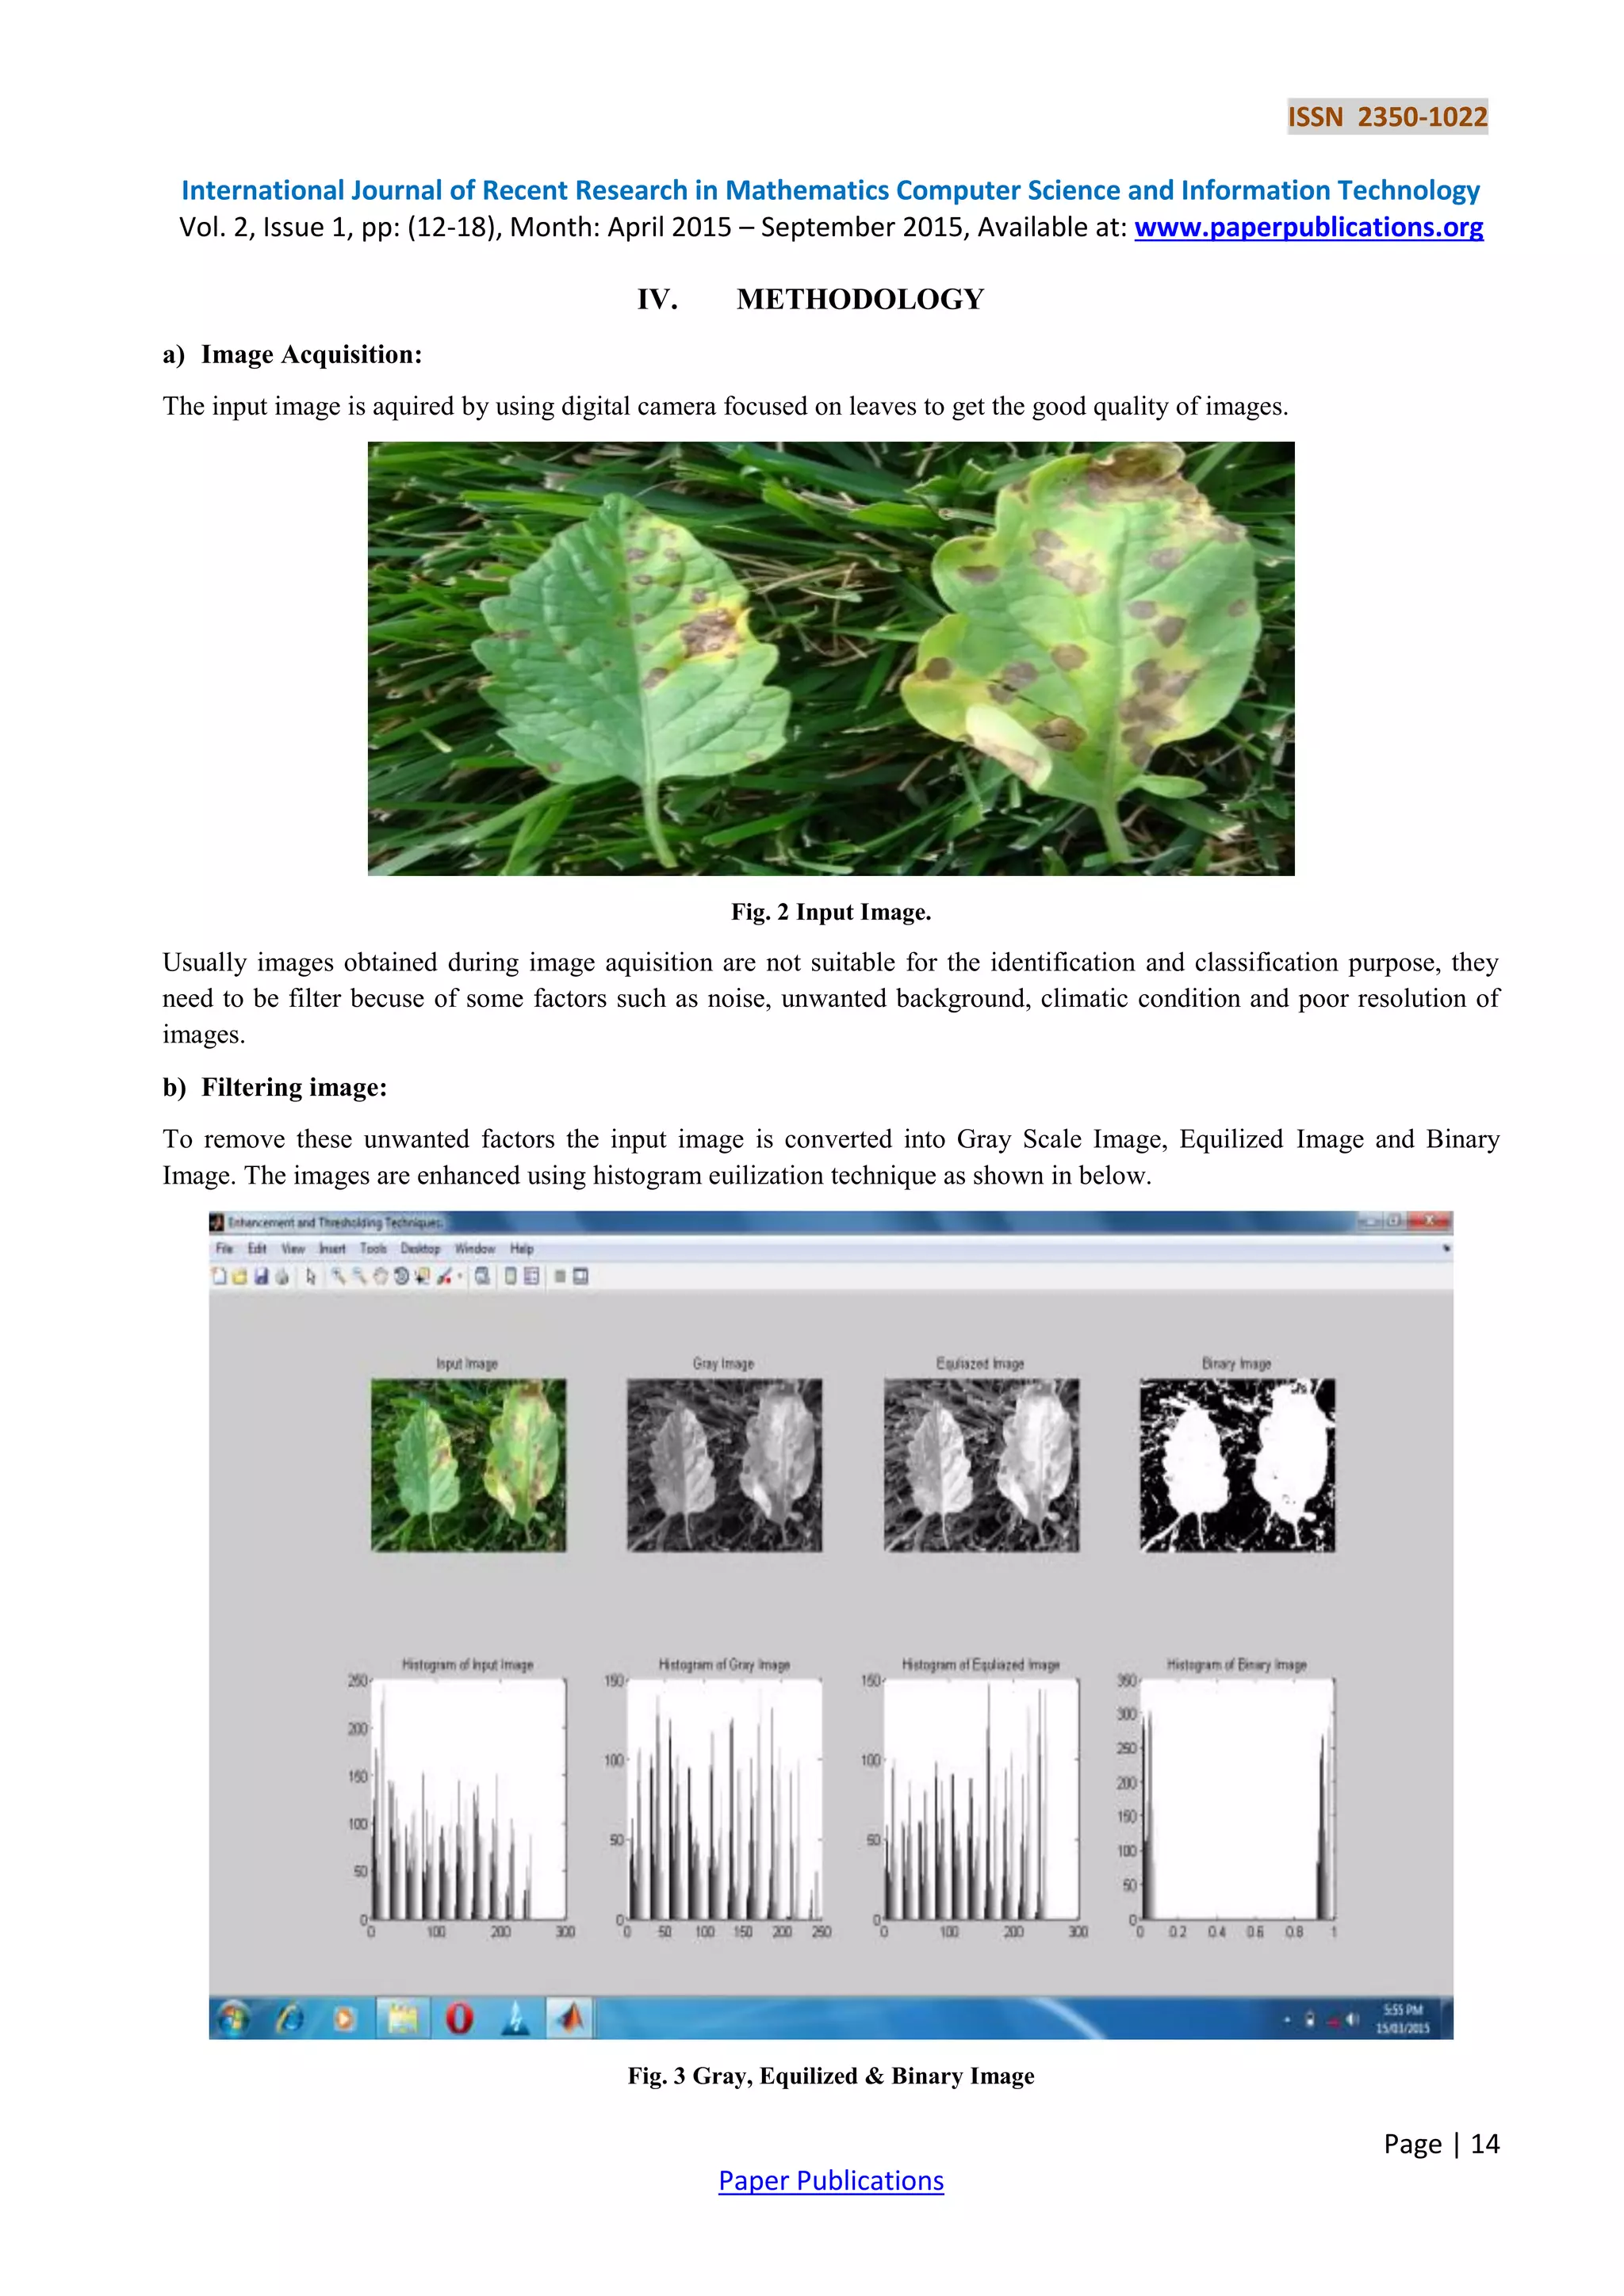
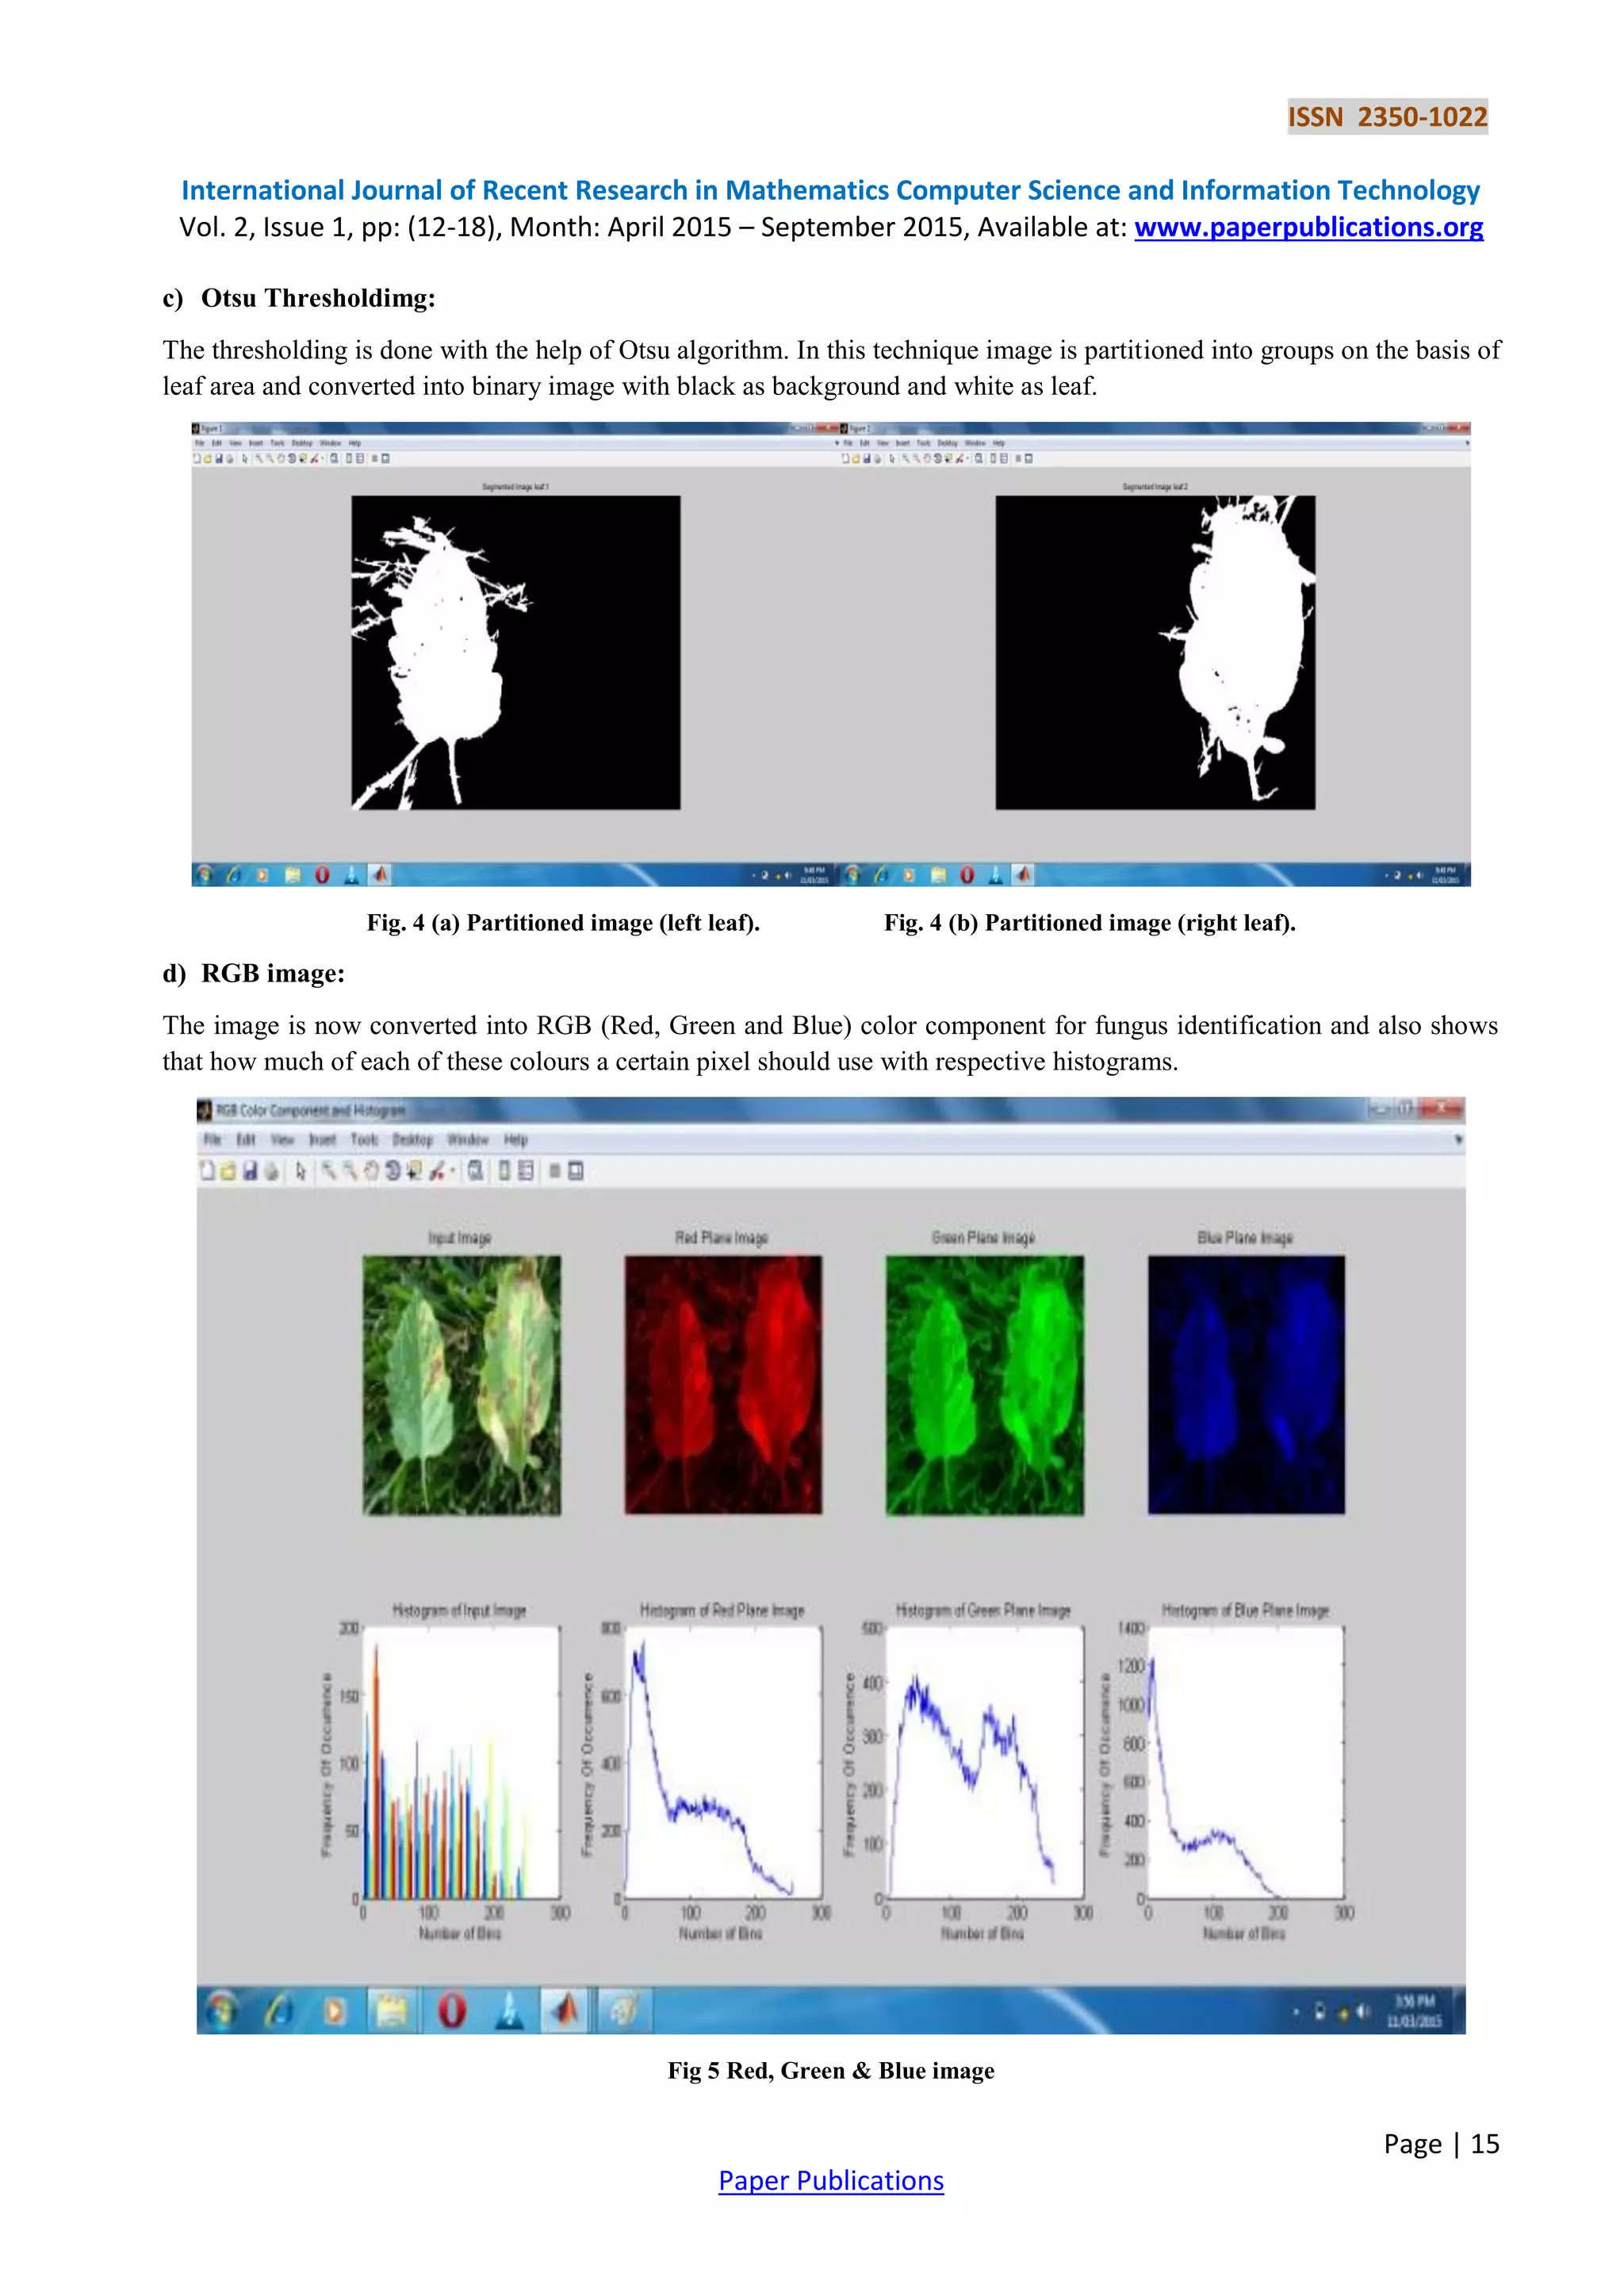
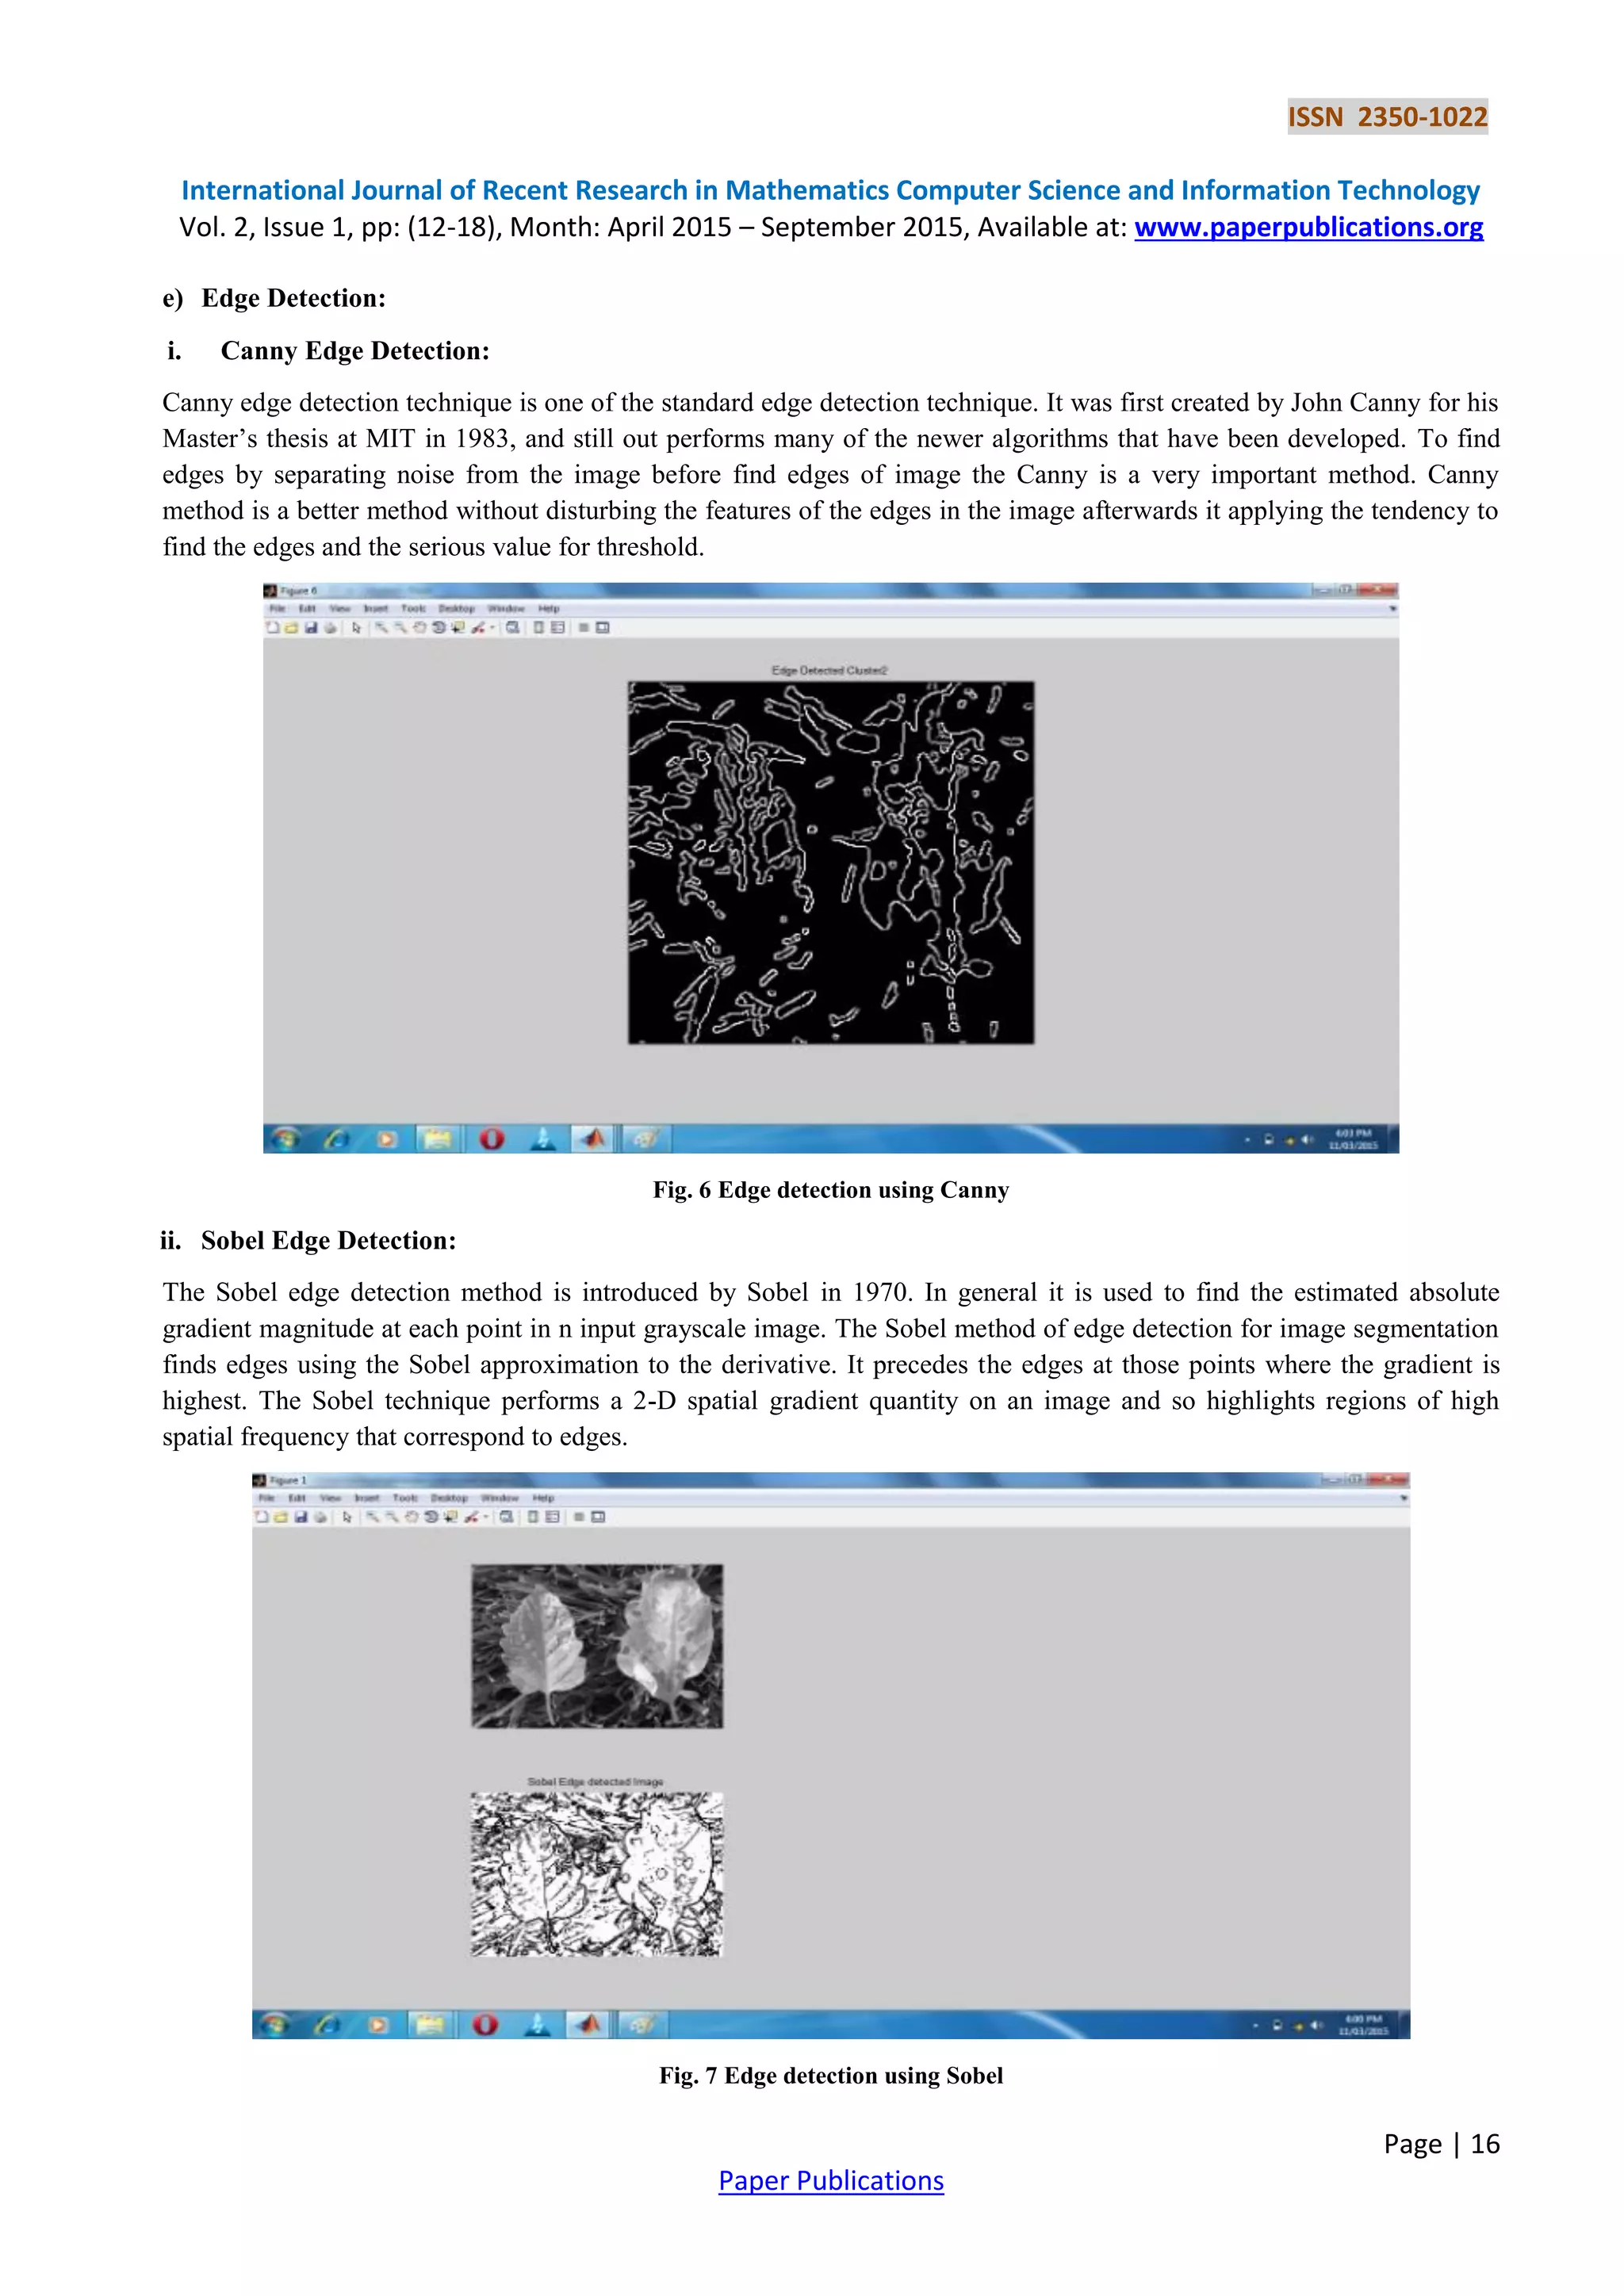
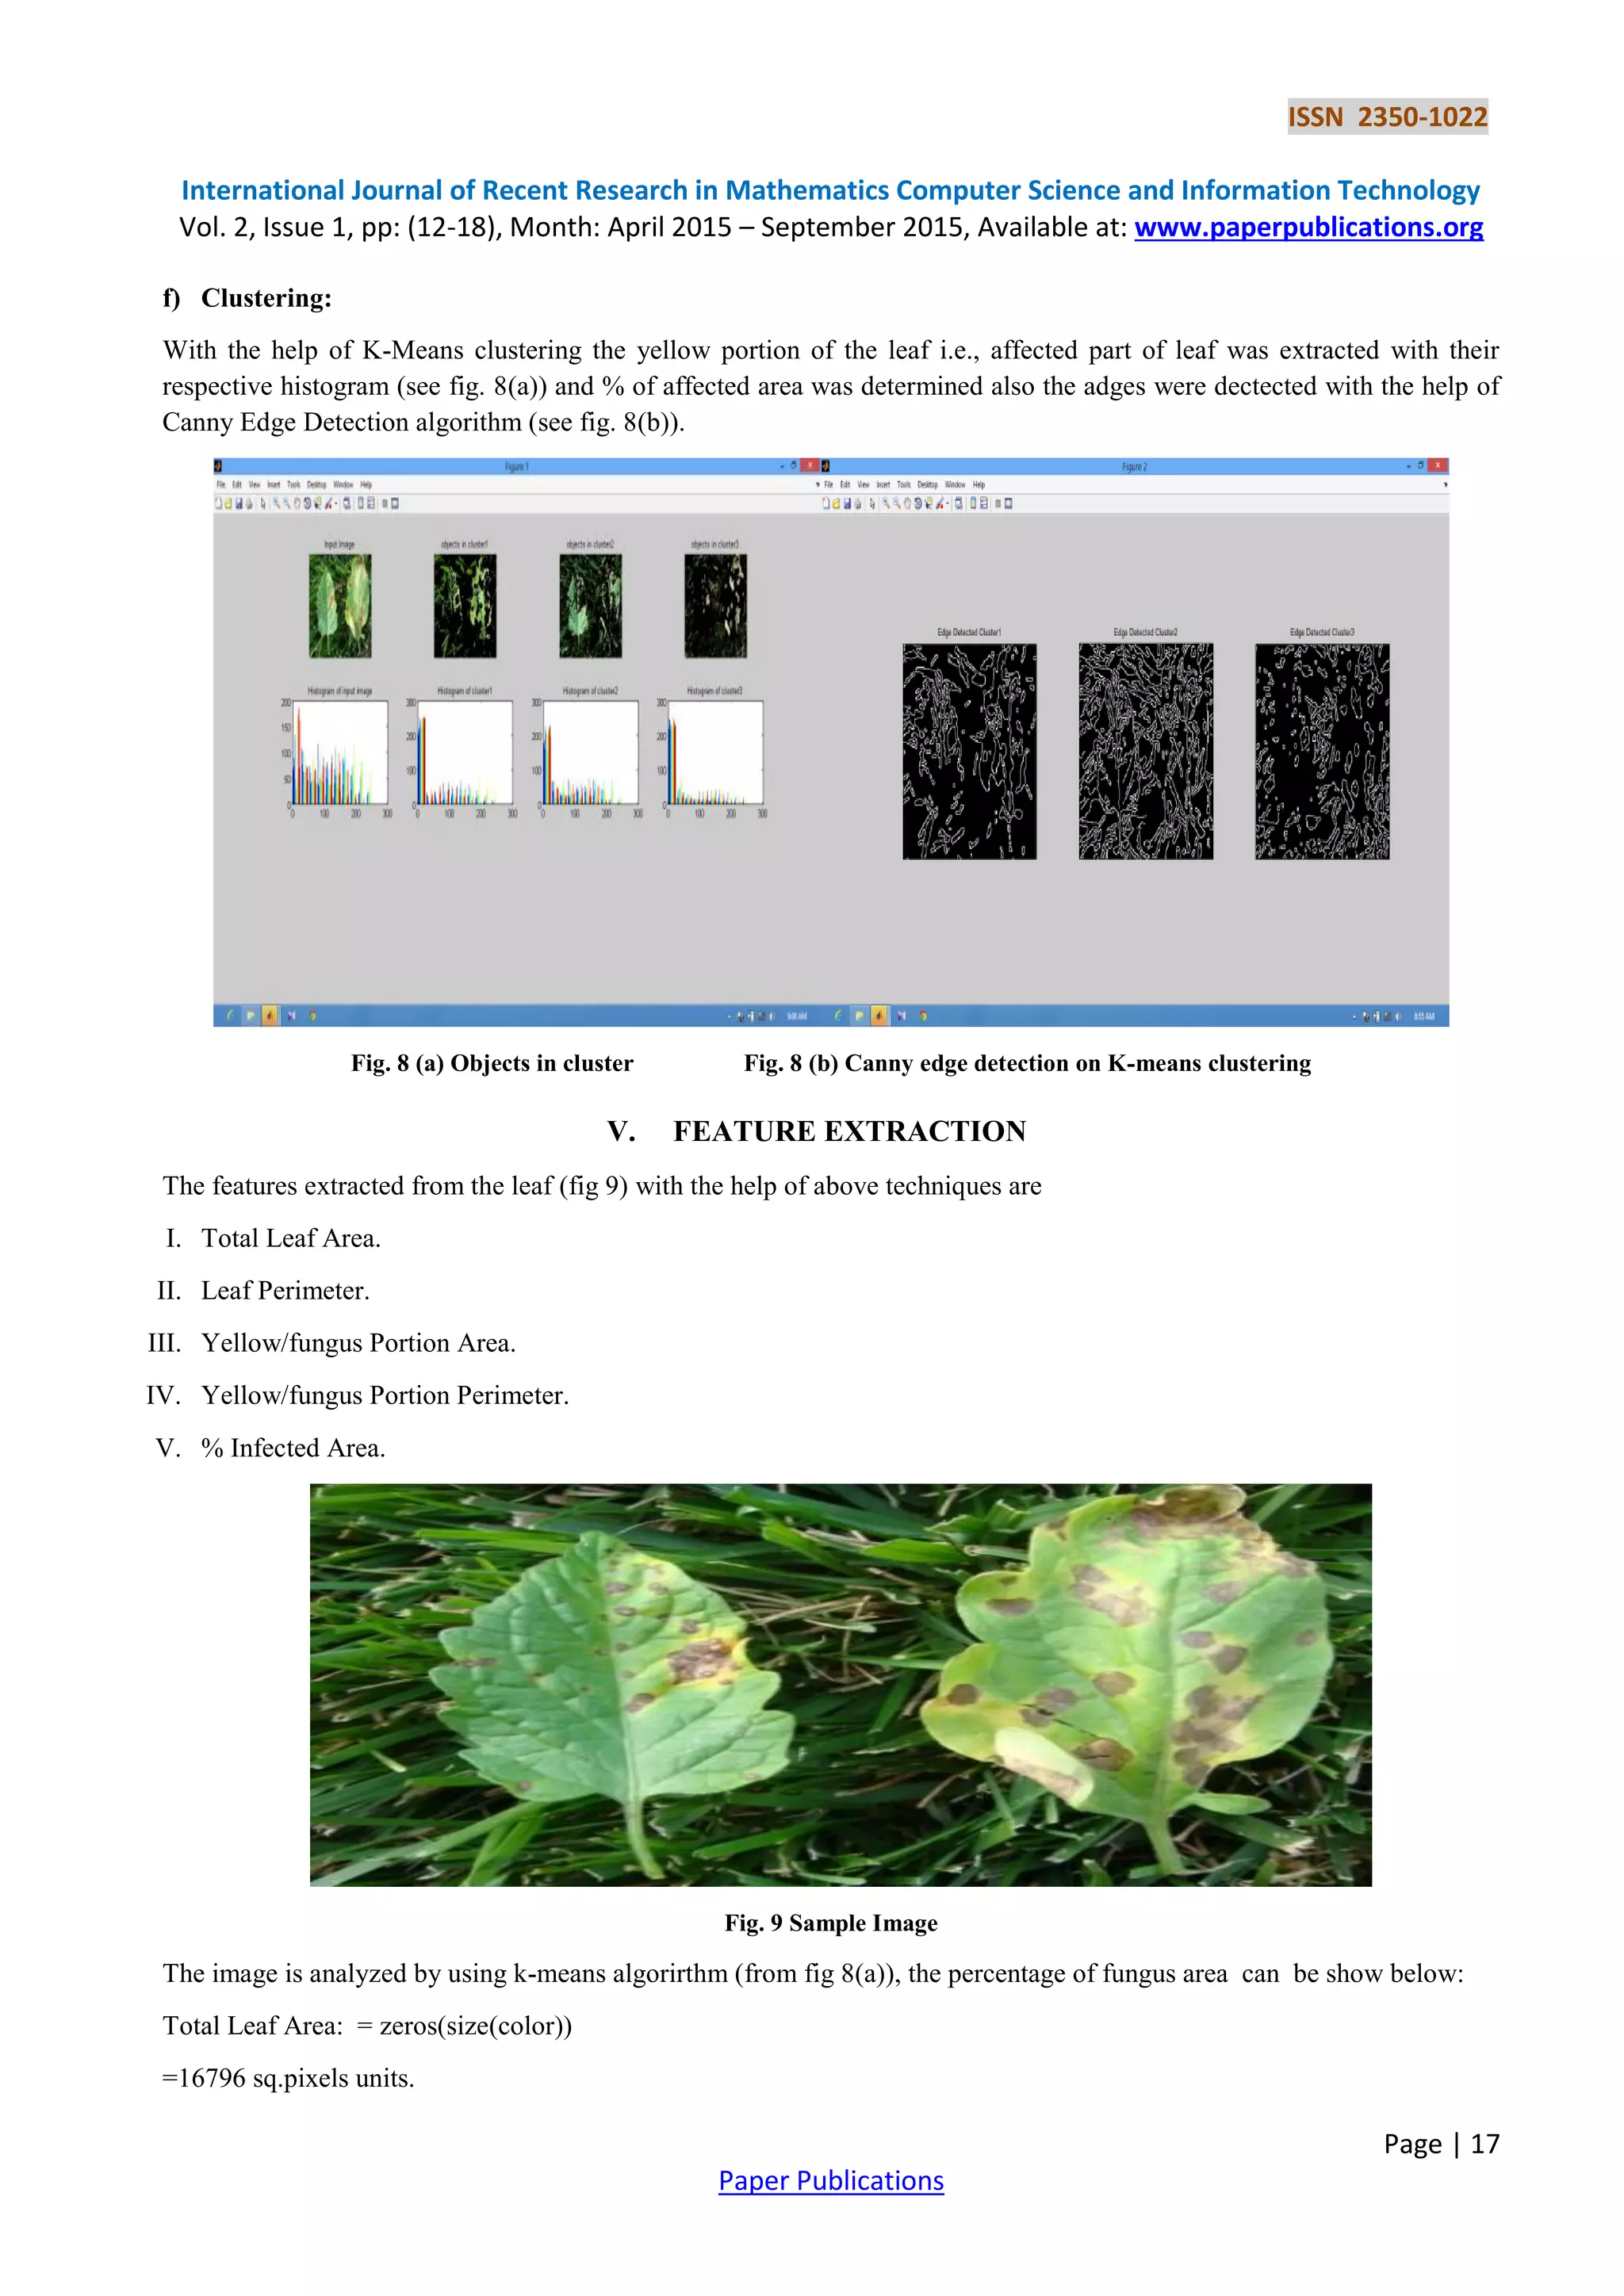
ISSN 2350-1022
International Journal of Recent Research in Mathematics Computer Science and Information Technology
Vol. 2, Issue 1, pp: (12-18), Month: April 2015 – September 2015, Available at: www.paperpublications.org
Page | 12
Paper Publications
Analysis of Fungus in Plant Using Image
Processing Techniques
Komal Bodkhe1
, Nisha Thakur2
, Shraddha Deshmukh3
, Asst. Prof. Prerana Jaipurkar4
1234
Department of Information Technology, Smt. Radhikatai Pandav College of Engineering, Rashtrasant Tukdoji Maharaj
Nagpur University, Nagpur, India
Abstract: The present work proposes a methodology for analysis of fungus in plant, using image processing
techniques. The fungus kills the young seedling; it spread by air and can also infect plant. Therefore it is very
important to monitor the leaf at regular intervals so as to keep track on quality of growth of plant. For analysis of
fungus is focused on technique using MATLAB 7.0. The image are captured by digital camera mobile and
processed using image growing, then the part of the leaf spot has been used for the classification purpose of the
trait and test. The acquired image are in jpeg format and are converted to gray scale image. The gray scale images
are enhanced and make noise free. The Ostu algorithm is applied to get threshold image. The pixel neighborhood
is applied to enhance the pixel of leaf to show clearly the fungus area. Clustering is applied to get infected part of
the leaf. RGB image is then segmented for analysis of fungus in plant. Comparative analyses of Image Edge
Detection techniques are presented. It has been observed that the Canny Edge Detection algorithm is
computationally more expensive compared to Sobel Edge Detection technique. The fungus infected area is
24.5951%.
Keywords: Edge Detection, K-Means Clustering, Otsu Thrsholding, Pixel Neighbourhood.
I. INTRODUCTION
Farmers face significant losses in agriculture in India due to the lack of appropriate technology. Vegetable quality is
frequently referred to size, shape, mass, firmness, color and bruises from which it can be classified and sorted. However,
technological implementation in that sector turns unfeasible by software, equipment as well as operational costs.
In evolution the sustainable agriculture system, the emerging technologies have made important contribution. It is found
that fungus cause heavy crop losses amounting to several billion dollars annually. With these techniques it is now possible
to reduce errors, costs to achieve ecological and economically sustainable agriculture. Using MATLAB software as a tool
in image processing, we can analyse fungus using various algorithm.
There are various techniques includes
1. Image Segmentation.
2. Edge Detection
3. K-means Clustering.
1. Image segmentation has become a very important task in today’s scenario. It is a fundamental process in many image,
video and computer vision application.
2. Edge detection refers to the process of identifying and locating sharp continuities is an image. Edge detection is used to
obtain information from the frames as a precursor step to feature extraction and object segmentation.
3. Clustering is a data mining technique of grouping sample so that the samples are similar within each group, the groups
are called cluster. K-means clustering techniques classifies the pixel with same characteristics into one cluster the forming
different clusters according to coherence between pixels in a cluster. The program supports all image manipulations as
reading and writing of image files, operation on individual pixels, image regions, whole images and volumes. Volumes
ISSN 2350-1022
International Journal of Recent Research in Mathematics Computer Science and Information Technology
Vol. 2, Issue 1, pp: (12-18), Month: April 2015 – September 2015, Available at: www.paperpublications.org
Page | 13
Paper Publications
ordered as a sequence of images can be operated upon as a whole. It also can perform basic operations as convolution,
edge detection, Fourier transform, histogram, editing and color manipulation, dilatation as well as mathematical operation
on sets of images such as multiplication and/or division.
II. RELATED WORK
Image processing has been proved to be effective tool for analysis in various fields and applications. Agriculture sector
where the parameters like canopy, were the important measures from the farmer’s point of view. The analysis of the
parameters has proved to be accurate and less time consuming as compared to traditional methods.[1]
One of the most important techniques is Edge Detection Techniques for natural image segmentation. It separates an image
into its component regions or objects. Image segmentation needs to segment the object from the background to read the
image properly & identify the content of the image carefully. Edge characterizes boundries and is therefore a problem of
fundamental importance in image processing. Image Edge Detection significantly reduces the amount of data & filters out
unless information. Since Edge Detection is in the forefront of image processing for object detection, it is crucial to have a
good understanding of Edge Detection Algorithm.[2][3][4]
The crop of Tomato is very often infected by a disease that leaves spot of brown, gray or off-white colors on the plants
leafs in winter. Scientifically, this disease is known as cerospora leaf spot or cercospora cruciferarum. It is kind of fungus
that often kills young seedlings. A novel machine has been proposed that it determines the nature of fungus & its depth
into the tomato steam. The image of the crop leaves are taken by a good quality color camera. The ability to identify the
tomatoes based on quality in the food industry which is the most important technology in the realization of automatic
tomato sorting machine in order to reduce the work of human & also time consuming. Image Histogram processing and
analysis will be used to get the exact color ranges of tomato.[5][6]
The studies of plant trait/diseases refer to the studies of visually observable patterns of a particular plant. Nowadays crop
face many disease/traits. Damage of the insect is one of the major trait/diseases. Insecticides are not always proved
efficient because insecticides may be toxic to some kind of birds. The identification of mostly green colored pixels. The
pixels are masked based on thresholding values that are computed using otsu’s method. The additional step is that pixels
with zeros red,green,blue values & the pixels on the boundries of the infected cluster. The advances in various methods
used to study plant diseases/trait using image processing.[7][8][9]
The K-means clustering algorithm is one of the most widely used algorithm. The color based segmentation method that
used k-means clustering techniques. The k-means algorithm is an iterative technique used to partition an image into k
cluster. The standard k-means algorithm produces accurate segmentation results only when applied to images defined by
homogeneous region.[10]
III. DATA FLOW DIAGRAM FOR EXISTING SYSTEM
Fig. 1 Data flow diagram
ISSN 2350-1022
International Journal of Recent Research in Mathematics Computer Science and Information Technology
Vol. 2, Issue 1, pp: (12-18), Month: April 2015 – September 2015, Available at: www.paperpublications.org
Page | 14
Paper Publications
IV. METHODOLOGY
a) Image Acquisition:
The input image is aquired by using digital camera focused on leaves to get the good quality of images.
Fig. 2 Input Image.
Usually images obtained during image aquisition are not suitable for the identification and classification purpose, they
need to be filter becuse of some factors such as noise, unwanted background, climatic condition and poor resolution of
images.
b) Filtering image:
To remove these unwanted factors the input image is converted into Gray Scale Image, Equilized Image and Binary
Image. The images are enhanced using histogram euilization technique as shown in below.
Fig. 3 Gray, Equilized & Binary Image
ISSN 2350-1022
International Journal of Recent Research in Mathematics Computer Science and Information Technology
Vol. 2, Issue 1, pp: (12-18), Month: April 2015 – September 2015, Available at: www.paperpublications.org
Page | 15
Paper Publications
c) Otsu Thresholdimg:
The thresholding is done with the help of Otsu algorithm. In this technique image is partitioned into groups on the basis of
leaf area and converted into binary image with black as background and white as leaf.
Fig. 4 (a) Partitioned image (left leaf). Fig. 4 (b) Partitioned image (right leaf).
d) RGB image:
The image is now converted into RGB (Red, Green and Blue) color component for fungus identification and also shows
that how much of each of these colours a certain pixel should use with respective histograms.
Fig 5 Red, Green & Blue image
ISSN 2350-1022
International Journal of Recent Research in Mathematics Computer Science and Information Technology
Vol. 2, Issue 1, pp: (12-18), Month: April 2015 – September 2015, Available at: www.paperpublications.org
Page | 16
Paper Publications
e) Edge Detection:
i. Canny Edge Detection:
Canny edge detection technique is one of the standard edge detection technique. It was first created by John Canny for his
Master’s thesis at MIT in 1983, and still out performs many of the newer algorithms that have been developed. To find
edges by separating noise from the image before find edges of image the Canny is a very important method. Canny
method is a better method without disturbing the features of the edges in the image afterwards it applying the tendency to
find the edges and the serious value for threshold.
Fig. 6 Edge detection using Canny
ii. Sobel Edge Detection:
The Sobel edge detection method is introduced by Sobel in 1970. In general it is used to find the estimated absolute
gradient magnitude at each point in n input grayscale image. The Sobel method of edge detection for image segmentation
finds edges using the Sobel approximation to the derivative. It precedes the edges at those points where the gradient is
highest. The Sobel technique performs a 2-D spatial gradient quantity on an image and so highlights regions of high
spatial frequency that correspond to edges.
Fig. 7 Edge detection using Sobel
ISSN 2350-1022
International Journal of Recent Research in Mathematics Computer Science and Information Technology
Vol. 2, Issue 1, pp: (12-18), Month: April 2015 – September 2015, Available at: www.paperpublications.org
Page | 17
Paper Publications
f) Clustering:
With the help of K-Means clustering the yellow portion of the leaf i.e., affected part of leaf was extracted with their
respective histogram (see fig. 8(a)) and % of affected area was determined also the adges were dectected with the help of
Canny Edge Detection algorithm (see fig. 8(b)).
Fig. 8 (a) Objects in cluster Fig. 8 (b) Canny edge detection on K-means clustering
V. FEATURE EXTRACTION
The features extracted from the leaf (fig 9) with the help of above techniques are
I. Total Leaf Area.
II. Leaf Perimeter.
III. Yellow/fungus Portion Area.
IV. Yellow/fungus Portion Perimeter.
V. % Infected Area.
Fig. 9 Sample Image
The image is analyzed by using k-means algorirthm (from fig 8(a)), the percentage of fungus area can be show below:
Total Leaf Area: = zeros(size(color))
=16796 sq.pixels units.
ISSN 2350-1022
International Journal of Recent Research in Mathematics Computer Science and Information Technology
Vol. 2, Issue 1, pp: (12-18), Month: April 2015 – September 2015, Available at: www.paperpublications.org
Page | 18
Paper Publications
Leaf Perimeter: = (Leaf_Area/4)
=4199 Pixels Units.
Yellow Portion Area: =4131 Sq.Pixels Units.
Yellow Portion Perimeter:=(Yellow_Area/4)
=1032.75 Pixels Units
% Infected Area: =(Yellow_Area/Leaf_Area)*100
=24.5951%
VI. CONCLUSION
An application of texture analysis in detecting and classifying the plant leaf fungus has been explained in this work. Thus
the algorithm was tested on sample image of tomato leaf. The fungus infected area is 24.5951%. From the comparative
analysis of edge detection techniques it is found that Canny Edge Detection technique is more accurate than the Sobel
Edge Detection Technique. The exact quantification is quite possible with suggested methodology. In future, the amount
of pesticides to be use can be detrmined with the help of this work.
REFERENCES
[1] Anup Vibhute, S. K. Bodhe “Applications of Image Processing in Agriculture: A Survey” International Journal of
Computer Applications(0975-8887) Volume 52-No.2,August 2012.
[2] Muthukrishnan. R and M. Radha “Edge Detection Techniques for Image Segmentation” International Journal of
Computer Science & Information Technology(IJCSIT) Vol.3, No.6,Dec 2011.
[3] Saiful Islam, Majdul Ahmed “A Study on Edge Detection Techniques for Natural Image Segmentation”
International Journal of Innovative Technology & Exploring Engineering”(IJITEE) ISSN:2278-3075,Volume-
2,Issue-3,February 2013.
[4] Raman Maini, Dr. Himanshu Aggrawal “Study and Comparision of Various Image Edge Detection Techniques”
International Journal of Image Processing” (IJIP), Volume-3,Issue(1).
[5] Shruti and Nidhi Seth “Fungus/Disease Analysis in Tomato Crop using Image Processing Techniques”
International Journal of Computer Trends and Technology (IJCTT) Volume-13,No.2-Jul 2014.
[6] Meenu Dadwal, V. K. Banga “Estimate Ripness Level of Fruits Using RGB Color Space and Fuzzy Logic
Tecnique” International Journal of Engineering and Advanced Technology(IJEAT) ISSN:2249-8958, Volume-
2,Issue-1,October 2012.
[7] R. Kalaivani, Dr. S. Muruganand, Dr. Azha Periasamy “Identification the Quality of Tomatoes in Image
Processing Using Matlab” International Journal of Advanced Research in Electrical, Electronics & Instrumentation
Engineering Vol.2, Issue 8, August 2013.
[8] Smita Naikwadi, Niket Amoda “Advances in Image Processing For Detection of Plant Diseases” International
Journal of Application or Innovation in Engineering & Management(IJAIEM) ISSN 2319-4847 Volume-2,Issue
11,November 2013.
[9] Jaymala K. Patil, Raj Kumar, “Advances in Image Processing For Detection of Plant Diseases” International
Journal of Advanced Bioinformatics Applications and Research ISSN 0976-2604 Vol-2, Issue 2,June 2011,PP-
135-141.
[10] Ms. Chinki Chandhok, Mrs. Soni Chaturvedi, Dr. A. A. Khurshid “An Approach to Image Segmentation Using K-
means Clustering Algorithm” International Journal of Information Technology (IJIT) ,Volume-1,Issue-1,August
2012, ISSN 2279-008X.

Analysis of Fungus in Plant Using Image Processing Techniques

  • 1.
    ISSN 2350-1022 International Journalof Recent Research in Mathematics Computer Science and Information Technology Vol. 2, Issue 1, pp: (12-18), Month: April 2015 – September 2015, Available at: www.paperpublications.org Page | 12 Paper Publications Analysis of Fungus in Plant Using Image Processing Techniques Komal Bodkhe1 , Nisha Thakur2 , Shraddha Deshmukh3 , Asst. Prof. Prerana Jaipurkar4 1234 Department of Information Technology, Smt. Radhikatai Pandav College of Engineering, Rashtrasant Tukdoji Maharaj Nagpur University, Nagpur, India Abstract: The present work proposes a methodology for analysis of fungus in plant, using image processing techniques. The fungus kills the young seedling; it spread by air and can also infect plant. Therefore it is very important to monitor the leaf at regular intervals so as to keep track on quality of growth of plant. For analysis of fungus is focused on technique using MATLAB 7.0. The image are captured by digital camera mobile and processed using image growing, then the part of the leaf spot has been used for the classification purpose of the trait and test. The acquired image are in jpeg format and are converted to gray scale image. The gray scale images are enhanced and make noise free. The Ostu algorithm is applied to get threshold image. The pixel neighborhood is applied to enhance the pixel of leaf to show clearly the fungus area. Clustering is applied to get infected part of the leaf. RGB image is then segmented for analysis of fungus in plant. Comparative analyses of Image Edge Detection techniques are presented. It has been observed that the Canny Edge Detection algorithm is computationally more expensive compared to Sobel Edge Detection technique. The fungus infected area is 24.5951%. Keywords: Edge Detection, K-Means Clustering, Otsu Thrsholding, Pixel Neighbourhood. I. INTRODUCTION Farmers face significant losses in agriculture in India due to the lack of appropriate technology. Vegetable quality is frequently referred to size, shape, mass, firmness, color and bruises from which it can be classified and sorted. However, technological implementation in that sector turns unfeasible by software, equipment as well as operational costs. In evolution the sustainable agriculture system, the emerging technologies have made important contribution. It is found that fungus cause heavy crop losses amounting to several billion dollars annually. With these techniques it is now possible to reduce errors, costs to achieve ecological and economically sustainable agriculture. Using MATLAB software as a tool in image processing, we can analyse fungus using various algorithm. There are various techniques includes 1. Image Segmentation. 2. Edge Detection 3. K-means Clustering. 1. Image segmentation has become a very important task in today’s scenario. It is a fundamental process in many image, video and computer vision application. 2. Edge detection refers to the process of identifying and locating sharp continuities is an image. Edge detection is used to obtain information from the frames as a precursor step to feature extraction and object segmentation. 3. Clustering is a data mining technique of grouping sample so that the samples are similar within each group, the groups are called cluster. K-means clustering techniques classifies the pixel with same characteristics into one cluster the forming different clusters according to coherence between pixels in a cluster. The program supports all image manipulations as reading and writing of image files, operation on individual pixels, image regions, whole images and volumes. Volumes
  • 2.
    ISSN 2350-1022 International Journalof Recent Research in Mathematics Computer Science and Information Technology Vol. 2, Issue 1, pp: (12-18), Month: April 2015 – September 2015, Available at: www.paperpublications.org Page | 13 Paper Publications ordered as a sequence of images can be operated upon as a whole. It also can perform basic operations as convolution, edge detection, Fourier transform, histogram, editing and color manipulation, dilatation as well as mathematical operation on sets of images such as multiplication and/or division. II. RELATED WORK Image processing has been proved to be effective tool for analysis in various fields and applications. Agriculture sector where the parameters like canopy, were the important measures from the farmer’s point of view. The analysis of the parameters has proved to be accurate and less time consuming as compared to traditional methods.[1] One of the most important techniques is Edge Detection Techniques for natural image segmentation. It separates an image into its component regions or objects. Image segmentation needs to segment the object from the background to read the image properly & identify the content of the image carefully. Edge characterizes boundries and is therefore a problem of fundamental importance in image processing. Image Edge Detection significantly reduces the amount of data & filters out unless information. Since Edge Detection is in the forefront of image processing for object detection, it is crucial to have a good understanding of Edge Detection Algorithm.[2][3][4] The crop of Tomato is very often infected by a disease that leaves spot of brown, gray or off-white colors on the plants leafs in winter. Scientifically, this disease is known as cerospora leaf spot or cercospora cruciferarum. It is kind of fungus that often kills young seedlings. A novel machine has been proposed that it determines the nature of fungus & its depth into the tomato steam. The image of the crop leaves are taken by a good quality color camera. The ability to identify the tomatoes based on quality in the food industry which is the most important technology in the realization of automatic tomato sorting machine in order to reduce the work of human & also time consuming. Image Histogram processing and analysis will be used to get the exact color ranges of tomato.[5][6] The studies of plant trait/diseases refer to the studies of visually observable patterns of a particular plant. Nowadays crop face many disease/traits. Damage of the insect is one of the major trait/diseases. Insecticides are not always proved efficient because insecticides may be toxic to some kind of birds. The identification of mostly green colored pixels. The pixels are masked based on thresholding values that are computed using otsu’s method. The additional step is that pixels with zeros red,green,blue values & the pixels on the boundries of the infected cluster. The advances in various methods used to study plant diseases/trait using image processing.[7][8][9] The K-means clustering algorithm is one of the most widely used algorithm. The color based segmentation method that used k-means clustering techniques. The k-means algorithm is an iterative technique used to partition an image into k cluster. The standard k-means algorithm produces accurate segmentation results only when applied to images defined by homogeneous region.[10] III. DATA FLOW DIAGRAM FOR EXISTING SYSTEM Fig. 1 Data flow diagram
  • 3.
    ISSN 2350-1022 International Journalof Recent Research in Mathematics Computer Science and Information Technology Vol. 2, Issue 1, pp: (12-18), Month: April 2015 – September 2015, Available at: www.paperpublications.org Page | 14 Paper Publications IV. METHODOLOGY a) Image Acquisition: The input image is aquired by using digital camera focused on leaves to get the good quality of images. Fig. 2 Input Image. Usually images obtained during image aquisition are not suitable for the identification and classification purpose, they need to be filter becuse of some factors such as noise, unwanted background, climatic condition and poor resolution of images. b) Filtering image: To remove these unwanted factors the input image is converted into Gray Scale Image, Equilized Image and Binary Image. The images are enhanced using histogram euilization technique as shown in below. Fig. 3 Gray, Equilized & Binary Image
  • 4.
    ISSN 2350-1022 International Journalof Recent Research in Mathematics Computer Science and Information Technology Vol. 2, Issue 1, pp: (12-18), Month: April 2015 – September 2015, Available at: www.paperpublications.org Page | 15 Paper Publications c) Otsu Thresholdimg: The thresholding is done with the help of Otsu algorithm. In this technique image is partitioned into groups on the basis of leaf area and converted into binary image with black as background and white as leaf. Fig. 4 (a) Partitioned image (left leaf). Fig. 4 (b) Partitioned image (right leaf). d) RGB image: The image is now converted into RGB (Red, Green and Blue) color component for fungus identification and also shows that how much of each of these colours a certain pixel should use with respective histograms. Fig 5 Red, Green & Blue image
  • 5.
    ISSN 2350-1022 International Journalof Recent Research in Mathematics Computer Science and Information Technology Vol. 2, Issue 1, pp: (12-18), Month: April 2015 – September 2015, Available at: www.paperpublications.org Page | 16 Paper Publications e) Edge Detection: i. Canny Edge Detection: Canny edge detection technique is one of the standard edge detection technique. It was first created by John Canny for his Master’s thesis at MIT in 1983, and still out performs many of the newer algorithms that have been developed. To find edges by separating noise from the image before find edges of image the Canny is a very important method. Canny method is a better method without disturbing the features of the edges in the image afterwards it applying the tendency to find the edges and the serious value for threshold. Fig. 6 Edge detection using Canny ii. Sobel Edge Detection: The Sobel edge detection method is introduced by Sobel in 1970. In general it is used to find the estimated absolute gradient magnitude at each point in n input grayscale image. The Sobel method of edge detection for image segmentation finds edges using the Sobel approximation to the derivative. It precedes the edges at those points where the gradient is highest. The Sobel technique performs a 2-D spatial gradient quantity on an image and so highlights regions of high spatial frequency that correspond to edges. Fig. 7 Edge detection using Sobel
  • 6.
    ISSN 2350-1022 International Journalof Recent Research in Mathematics Computer Science and Information Technology Vol. 2, Issue 1, pp: (12-18), Month: April 2015 – September 2015, Available at: www.paperpublications.org Page | 17 Paper Publications f) Clustering: With the help of K-Means clustering the yellow portion of the leaf i.e., affected part of leaf was extracted with their respective histogram (see fig. 8(a)) and % of affected area was determined also the adges were dectected with the help of Canny Edge Detection algorithm (see fig. 8(b)). Fig. 8 (a) Objects in cluster Fig. 8 (b) Canny edge detection on K-means clustering V. FEATURE EXTRACTION The features extracted from the leaf (fig 9) with the help of above techniques are I. Total Leaf Area. II. Leaf Perimeter. III. Yellow/fungus Portion Area. IV. Yellow/fungus Portion Perimeter. V. % Infected Area. Fig. 9 Sample Image The image is analyzed by using k-means algorirthm (from fig 8(a)), the percentage of fungus area can be show below: Total Leaf Area: = zeros(size(color)) =16796 sq.pixels units.
  • 7.
    ISSN 2350-1022 International Journalof Recent Research in Mathematics Computer Science and Information Technology Vol. 2, Issue 1, pp: (12-18), Month: April 2015 – September 2015, Available at: www.paperpublications.org Page | 18 Paper Publications Leaf Perimeter: = (Leaf_Area/4) =4199 Pixels Units. Yellow Portion Area: =4131 Sq.Pixels Units. Yellow Portion Perimeter:=(Yellow_Area/4) =1032.75 Pixels Units % Infected Area: =(Yellow_Area/Leaf_Area)*100 =24.5951% VI. CONCLUSION An application of texture analysis in detecting and classifying the plant leaf fungus has been explained in this work. Thus the algorithm was tested on sample image of tomato leaf. The fungus infected area is 24.5951%. From the comparative analysis of edge detection techniques it is found that Canny Edge Detection technique is more accurate than the Sobel Edge Detection Technique. The exact quantification is quite possible with suggested methodology. In future, the amount of pesticides to be use can be detrmined with the help of this work. REFERENCES [1] Anup Vibhute, S. K. Bodhe “Applications of Image Processing in Agriculture: A Survey” International Journal of Computer Applications(0975-8887) Volume 52-No.2,August 2012. [2] Muthukrishnan. R and M. Radha “Edge Detection Techniques for Image Segmentation” International Journal of Computer Science & Information Technology(IJCSIT) Vol.3, No.6,Dec 2011. [3] Saiful Islam, Majdul Ahmed “A Study on Edge Detection Techniques for Natural Image Segmentation” International Journal of Innovative Technology & Exploring Engineering”(IJITEE) ISSN:2278-3075,Volume- 2,Issue-3,February 2013. [4] Raman Maini, Dr. Himanshu Aggrawal “Study and Comparision of Various Image Edge Detection Techniques” International Journal of Image Processing” (IJIP), Volume-3,Issue(1). [5] Shruti and Nidhi Seth “Fungus/Disease Analysis in Tomato Crop using Image Processing Techniques” International Journal of Computer Trends and Technology (IJCTT) Volume-13,No.2-Jul 2014. [6] Meenu Dadwal, V. K. Banga “Estimate Ripness Level of Fruits Using RGB Color Space and Fuzzy Logic Tecnique” International Journal of Engineering and Advanced Technology(IJEAT) ISSN:2249-8958, Volume- 2,Issue-1,October 2012. [7] R. Kalaivani, Dr. S. Muruganand, Dr. Azha Periasamy “Identification the Quality of Tomatoes in Image Processing Using Matlab” International Journal of Advanced Research in Electrical, Electronics & Instrumentation Engineering Vol.2, Issue 8, August 2013. [8] Smita Naikwadi, Niket Amoda “Advances in Image Processing For Detection of Plant Diseases” International Journal of Application or Innovation in Engineering & Management(IJAIEM) ISSN 2319-4847 Volume-2,Issue 11,November 2013. [9] Jaymala K. Patil, Raj Kumar, “Advances in Image Processing For Detection of Plant Diseases” International Journal of Advanced Bioinformatics Applications and Research ISSN 0976-2604 Vol-2, Issue 2,June 2011,PP- 135-141. [10] Ms. Chinki Chandhok, Mrs. Soni Chaturvedi, Dr. A. A. Khurshid “An Approach to Image Segmentation Using K- means Clustering Algorithm” International Journal of Information Technology (IJIT) ,Volume-1,Issue-1,August 2012, ISSN 2279-008X.