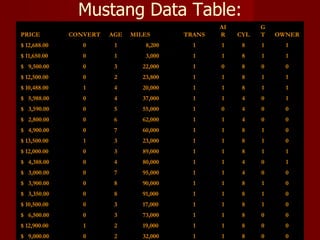
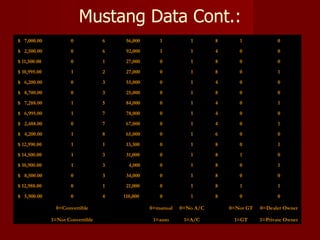
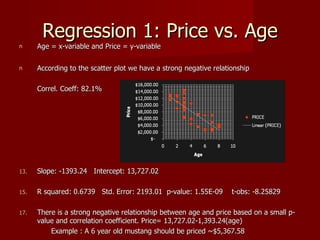
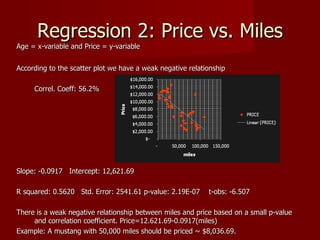
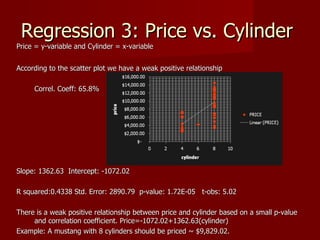
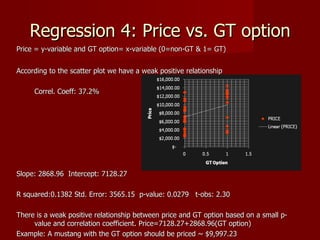
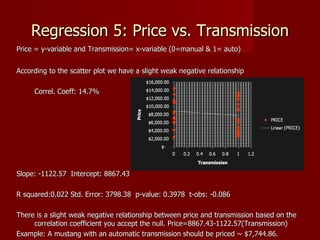
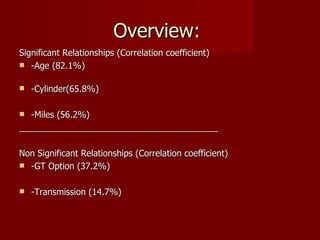
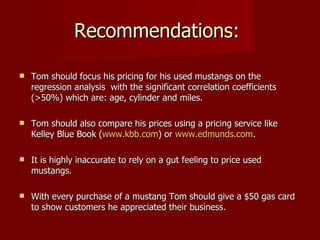
America’s Pony Car For
       Sale….


      Marc Kostelansky
              &
      Aniello Tambasco
Background:
   First Introduced to the public by the Ford Motor Company on April
    17, 1964 at the New York World’s Fair.*

   Created the “ pony car” class of the automotive world –coupes
    with long hoods and short rear decks.*

   The Mustang has been in the lives of the American People for the
    past forty years acting as a pillar of American lore.**

   It has been Ford’s most famous vehicle since the Model A and the
    best thing is that its success has made it the companies second
    model to still be in production.*

   It was the first car to bring sporty class and style with a price that
    most can afford.**

            *http://en.wikipedia.org/wiki/Ford_Mustang
            **http://www.edmunds.com/ford/mustang/history.html
Background Cont.:
   Tom has followed his dream on opening a car lot that sells vintage
    and classical cars but he knows little about the business world. He
    has enrolled in a local community college to take a few business
    classes.

   Tom is very knowledgeable on the nuts and bolts that makeup the
    physical features of vintage cars but lacks the skills of the American
    Business professional.

   Tom has been eyeing the competitors and local advertisement to
    promote his business and to maximize profits but his strategy is not
    working.

   Tom’s inability to price his car competitively has caused many
    complaints from customers.
How can we help Tom drive
  his business to success
Data Provided:
   Tom has provided information on 35 used Mustangs
    – Which includes:
           Price
           Convertible or non-convertible
           Age
           Miles
           Transmission
           A/C or no A/C
           4, 6 or 8 cylinder
           GT or non-GT model
           Privately owned or Dealer owned
Mustang Data Table:
                                                  AI         G
PRICE         CONVERT   AGE   MILES       TRANS   R    CYL   T   OWNER
$ 12,688.00      0       1        8,200     1     1     8    1     1
$ 11,650.00      0       1        3,000     1     1     8    1     1
$ 9,500.00       0       3       22,000     1     0     8    0     0
$ 12,500.00      0       2       23,800     1     1     8    1     1
$ 10,488.00      1       4       20,000     1     1     8    1     1
$ 5,988.00       0       4       37,000     1     1     4    0     1
$ 3,590.00       0       5       55,000     1     0     4    0     0
$ 2,800.00       0       6       62,000     1     1     4    0     0
$ 4,900.00       0       7       60,000     1     1     8    1     0
$ 13,500.00      1       3       23,000     1     1     8    1     0
$ 12,000.00      0       3       89,000     1     1     8    1     1
$ 4,388.00       0       4       80,000     1     1     4    0     1
$ 3,000.00       0       7       95,000     1     1     4    0     0
$ 3,900.00       0       8       90,000     1     1     8    1     0
$ 3,350.00       0       8       91,000     1     1     8    1     0
$ 10,500.00      0       3       17,000     1     1     8    1     0
$ 6,500.00       0       3       73,000     1     1     8    0     0
$ 12,900.00      1       2       19,000     1     1     8    0     0
$ 9,000.00       0       2       32,000     1     1     8    0     0
Mustang Data Cont.:
$ 7,000.00           0            6    56,000      1          1       8      1              0
$ 2,500.00           0            6    92,000      1          1       4      0              0
$ 11,500.00          0            1    27,000      0          1       8      0              0
$ 10,995.00           1           2    27,000      0          1       8      0              1
$ 6,200.00           0            3    55,000      0          1       4      0              0
$ 8,700.00           0            3    25,000      0          1       8      0              0
$ 7,288.00            1           5    84,000      0          1       4      0              1
$ 6,995.00            1           7    78,000      0          1       4      0              0
$ 2,488.00           0            7    67,000      0          1       4      0              1
$ 4,200.00            1           8    65,000      0          1       6      0              0
$ 12,990.00           1           1    13,300      0          1       8      0              1
$ 14,500.00           1           3    31,000      0          1       8      1              0
$ 10,900.00           1           3     4,000      0          1       8      0              1
$ 8,500.00           0            3    34,000      0          1       8      0              0
$ 12,988.00          0            1    21,000      0          1       8      1              1
$ 5,900.00           0            4   110,000      0          1       8      0              0

               0=Convertible                    0=manual   0=No A/C       0=Not GT   0=Dealer Owner

              1=Not Convertible                  1=auto     1=A/C          1=GT      1=Private Owner
Data Analysis: Simple Linear
        Regression
    §   Define the variables

    §   Describe the relationships

    §   Calculate the regression coefficient

    §   How good is the model?

    §   Is the model significant?
        - General null hypothesis β=0, there is no relationship between x and y
Regression 1: Price vs. Age
n     Age = x-variable and Price = y-variable

n     According to the scatter plot we have a strong negative relationship

      Correl. Coeff: 82.1%


13.   Slope: -1393.24 Intercept: 13,727.02

15.   R squared: 0.6739 Std. Error: 2193.01 p-value: 1.55E-09       t-obs: -8.25829

17.   There is a strong negative relationship between age and price based on a small p-
      value and correlation coefficient. Price= 13,727.02-1,393.24(age)
          Example : A 6 year old mustang should be priced ~$5,367.58
Regression 2: Price vs. Miles
Age = x-variable and Price = y-variable


According to the scatter plot we have a weak negative relationship

     Correl. Coeff: 56.2%


Slope: -0.0917 Intercept: 12,621.69

R squared: 0.5620 Std. Error: 2541.61 p-value: 2.19E-07     t-obs: -6.507

There is a weak negative relationship between miles and price based on a small p-value
     and correlation coefficient. Price=12.621.69-0.0917(miles)
Example: A mustang with 50,000 miles should be priced ~ $8,036.69.
Regression 3: Price vs. Cylinder
Price = y-variable and Cylinder = x-variable


According to the scatter plot we have a weak positive relationship

     Correl. Coeff: 65.8%


Slope: 1362.63 Intercept: -1072.02

R squared:0.4338 Std. Error: 2890.79 p-value: 1.72E-05 t-obs: 5.02

There is a weak positive relationship between price and cylinder based on a small p-value
     and correlation coefficient. Price=-1072.02+1362.63(cylinder)
Example: A mustang with 8 cylinders should be priced ~ $9,829.02.
Regression 4: Price vs. GT option
Price = y-variable and GT option= x-variable (0=non-GT & 1= GT)


According to the scatter plot we have a weak positive relationship

     Correl. Coeff: 37.2%


Slope: 2868.96 Intercept: 7128.27

R squared:0.1382 Std. Error: 3565.15 p-value: 0.0279 t-obs: 2.30

There is a weak positive relationship between price and GT option based on a small p-
     value and correlation coefficient. Price=7128.27+2868.96(GT option)
Example: A mustang with the GT option should be priced ~ $9,997.23
Regression 5: Price vs. Transmission
Price = y-variable and Transmission= x-variable (0=manual & 1= auto)


According to the scatter plot we have a slight weak negative relationship

     Correl. Coeff: 14.7%


Slope: -1122.57 Intercept: 8867.43

R squared:0.022 Std. Error: 3798.38 p-value: 0.3978 t-obs: -0.086

There is a slight weak negative relationship between price and transmission based on the
     correlation coefficient you accept the null. Price=8867.43-1122.57(Transmission)
Example: A mustang with an automatic transmission should be priced ~ $7,744.86.
Overview:
Significant Relationships (Correlation coefficient)
 -Age (82.1%)


   -Cylinder(65.8%)

 -Miles (56.2%)
_________________________________________

Non Significant Relationships (Correlation coefficient)
 -GT Option (37.2%)


   -Transmission (14.7%)
Recommendations:

   Tom should focus his pricing for his used mustangs on the
    regression analysis with the significant correlation coefficients
    (>50%) which are: age, cylinder and miles.

   Tom should also compare his prices using a pricing service like
    Kelley Blue Book (www.kbb.com) or www.edmunds.com.

   It is highly inaccurate to rely on a gut feeling to price used
    mustangs.

   With every purchase of a mustang Tom should give a $50 gas card
    to show customers he appreciated their business.

Americaspony

  • 1.
    America’s Pony CarFor Sale…. Marc Kostelansky & Aniello Tambasco
  • 2.
    Background:  First Introduced to the public by the Ford Motor Company on April 17, 1964 at the New York World’s Fair.*  Created the “ pony car” class of the automotive world –coupes with long hoods and short rear decks.*  The Mustang has been in the lives of the American People for the past forty years acting as a pillar of American lore.**  It has been Ford’s most famous vehicle since the Model A and the best thing is that its success has made it the companies second model to still be in production.*  It was the first car to bring sporty class and style with a price that most can afford.** *http://en.wikipedia.org/wiki/Ford_Mustang **http://www.edmunds.com/ford/mustang/history.html
  • 3.
    Background Cont.:  Tom has followed his dream on opening a car lot that sells vintage and classical cars but he knows little about the business world. He has enrolled in a local community college to take a few business classes.  Tom is very knowledgeable on the nuts and bolts that makeup the physical features of vintage cars but lacks the skills of the American Business professional.  Tom has been eyeing the competitors and local advertisement to promote his business and to maximize profits but his strategy is not working.  Tom’s inability to price his car competitively has caused many complaints from customers.
  • 4.
    How can wehelp Tom drive his business to success
  • 5.
    Data Provided:  Tom has provided information on 35 used Mustangs – Which includes:  Price  Convertible or non-convertible  Age  Miles  Transmission  A/C or no A/C  4, 6 or 8 cylinder  GT or non-GT model  Privately owned or Dealer owned
  • 6.
    Mustang Data Table: AI G PRICE CONVERT AGE MILES TRANS R CYL T OWNER $ 12,688.00 0 1 8,200 1 1 8 1 1 $ 11,650.00 0 1 3,000 1 1 8 1 1 $ 9,500.00 0 3 22,000 1 0 8 0 0 $ 12,500.00 0 2 23,800 1 1 8 1 1 $ 10,488.00 1 4 20,000 1 1 8 1 1 $ 5,988.00 0 4 37,000 1 1 4 0 1 $ 3,590.00 0 5 55,000 1 0 4 0 0 $ 2,800.00 0 6 62,000 1 1 4 0 0 $ 4,900.00 0 7 60,000 1 1 8 1 0 $ 13,500.00 1 3 23,000 1 1 8 1 0 $ 12,000.00 0 3 89,000 1 1 8 1 1 $ 4,388.00 0 4 80,000 1 1 4 0 1 $ 3,000.00 0 7 95,000 1 1 4 0 0 $ 3,900.00 0 8 90,000 1 1 8 1 0 $ 3,350.00 0 8 91,000 1 1 8 1 0 $ 10,500.00 0 3 17,000 1 1 8 1 0 $ 6,500.00 0 3 73,000 1 1 8 0 0 $ 12,900.00 1 2 19,000 1 1 8 0 0 $ 9,000.00 0 2 32,000 1 1 8 0 0
  • 7.
    Mustang Data Cont.: $7,000.00 0 6 56,000 1 1 8 1 0 $ 2,500.00 0 6 92,000 1 1 4 0 0 $ 11,500.00 0 1 27,000 0 1 8 0 0 $ 10,995.00 1 2 27,000 0 1 8 0 1 $ 6,200.00 0 3 55,000 0 1 4 0 0 $ 8,700.00 0 3 25,000 0 1 8 0 0 $ 7,288.00 1 5 84,000 0 1 4 0 1 $ 6,995.00 1 7 78,000 0 1 4 0 0 $ 2,488.00 0 7 67,000 0 1 4 0 1 $ 4,200.00 1 8 65,000 0 1 6 0 0 $ 12,990.00 1 1 13,300 0 1 8 0 1 $ 14,500.00 1 3 31,000 0 1 8 1 0 $ 10,900.00 1 3 4,000 0 1 8 0 1 $ 8,500.00 0 3 34,000 0 1 8 0 0 $ 12,988.00 0 1 21,000 0 1 8 1 1 $ 5,900.00 0 4 110,000 0 1 8 0 0 0=Convertible 0=manual 0=No A/C 0=Not GT 0=Dealer Owner 1=Not Convertible 1=auto 1=A/C 1=GT 1=Private Owner
  • 8.
    Data Analysis: SimpleLinear Regression § Define the variables § Describe the relationships § Calculate the regression coefficient § How good is the model? § Is the model significant? - General null hypothesis β=0, there is no relationship between x and y
  • 9.
    Regression 1: Pricevs. Age n Age = x-variable and Price = y-variable n According to the scatter plot we have a strong negative relationship Correl. Coeff: 82.1% 13. Slope: -1393.24 Intercept: 13,727.02 15. R squared: 0.6739 Std. Error: 2193.01 p-value: 1.55E-09 t-obs: -8.25829 17. There is a strong negative relationship between age and price based on a small p- value and correlation coefficient. Price= 13,727.02-1,393.24(age) Example : A 6 year old mustang should be priced ~$5,367.58
  • 10.
    Regression 2: Pricevs. Miles Age = x-variable and Price = y-variable According to the scatter plot we have a weak negative relationship Correl. Coeff: 56.2% Slope: -0.0917 Intercept: 12,621.69 R squared: 0.5620 Std. Error: 2541.61 p-value: 2.19E-07 t-obs: -6.507 There is a weak negative relationship between miles and price based on a small p-value and correlation coefficient. Price=12.621.69-0.0917(miles) Example: A mustang with 50,000 miles should be priced ~ $8,036.69.
  • 11.
    Regression 3: Pricevs. Cylinder Price = y-variable and Cylinder = x-variable According to the scatter plot we have a weak positive relationship Correl. Coeff: 65.8% Slope: 1362.63 Intercept: -1072.02 R squared:0.4338 Std. Error: 2890.79 p-value: 1.72E-05 t-obs: 5.02 There is a weak positive relationship between price and cylinder based on a small p-value and correlation coefficient. Price=-1072.02+1362.63(cylinder) Example: A mustang with 8 cylinders should be priced ~ $9,829.02.
  • 12.
    Regression 4: Pricevs. GT option Price = y-variable and GT option= x-variable (0=non-GT & 1= GT) According to the scatter plot we have a weak positive relationship Correl. Coeff: 37.2% Slope: 2868.96 Intercept: 7128.27 R squared:0.1382 Std. Error: 3565.15 p-value: 0.0279 t-obs: 2.30 There is a weak positive relationship between price and GT option based on a small p- value and correlation coefficient. Price=7128.27+2868.96(GT option) Example: A mustang with the GT option should be priced ~ $9,997.23
  • 13.
    Regression 5: Pricevs. Transmission Price = y-variable and Transmission= x-variable (0=manual & 1= auto) According to the scatter plot we have a slight weak negative relationship Correl. Coeff: 14.7% Slope: -1122.57 Intercept: 8867.43 R squared:0.022 Std. Error: 3798.38 p-value: 0.3978 t-obs: -0.086 There is a slight weak negative relationship between price and transmission based on the correlation coefficient you accept the null. Price=8867.43-1122.57(Transmission) Example: A mustang with an automatic transmission should be priced ~ $7,744.86.
  • 14.
    Overview: Significant Relationships (Correlationcoefficient)  -Age (82.1%)  -Cylinder(65.8%)  -Miles (56.2%) _________________________________________ Non Significant Relationships (Correlation coefficient)  -GT Option (37.2%)  -Transmission (14.7%)
  • 15.
    Recommendations:  Tom should focus his pricing for his used mustangs on the regression analysis with the significant correlation coefficients (>50%) which are: age, cylinder and miles.  Tom should also compare his prices using a pricing service like Kelley Blue Book (www.kbb.com) or www.edmunds.com.  It is highly inaccurate to rely on a gut feeling to price used mustangs.  With every purchase of a mustang Tom should give a $50 gas card to show customers he appreciated their business.