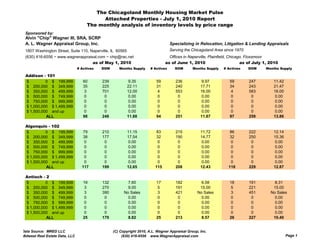
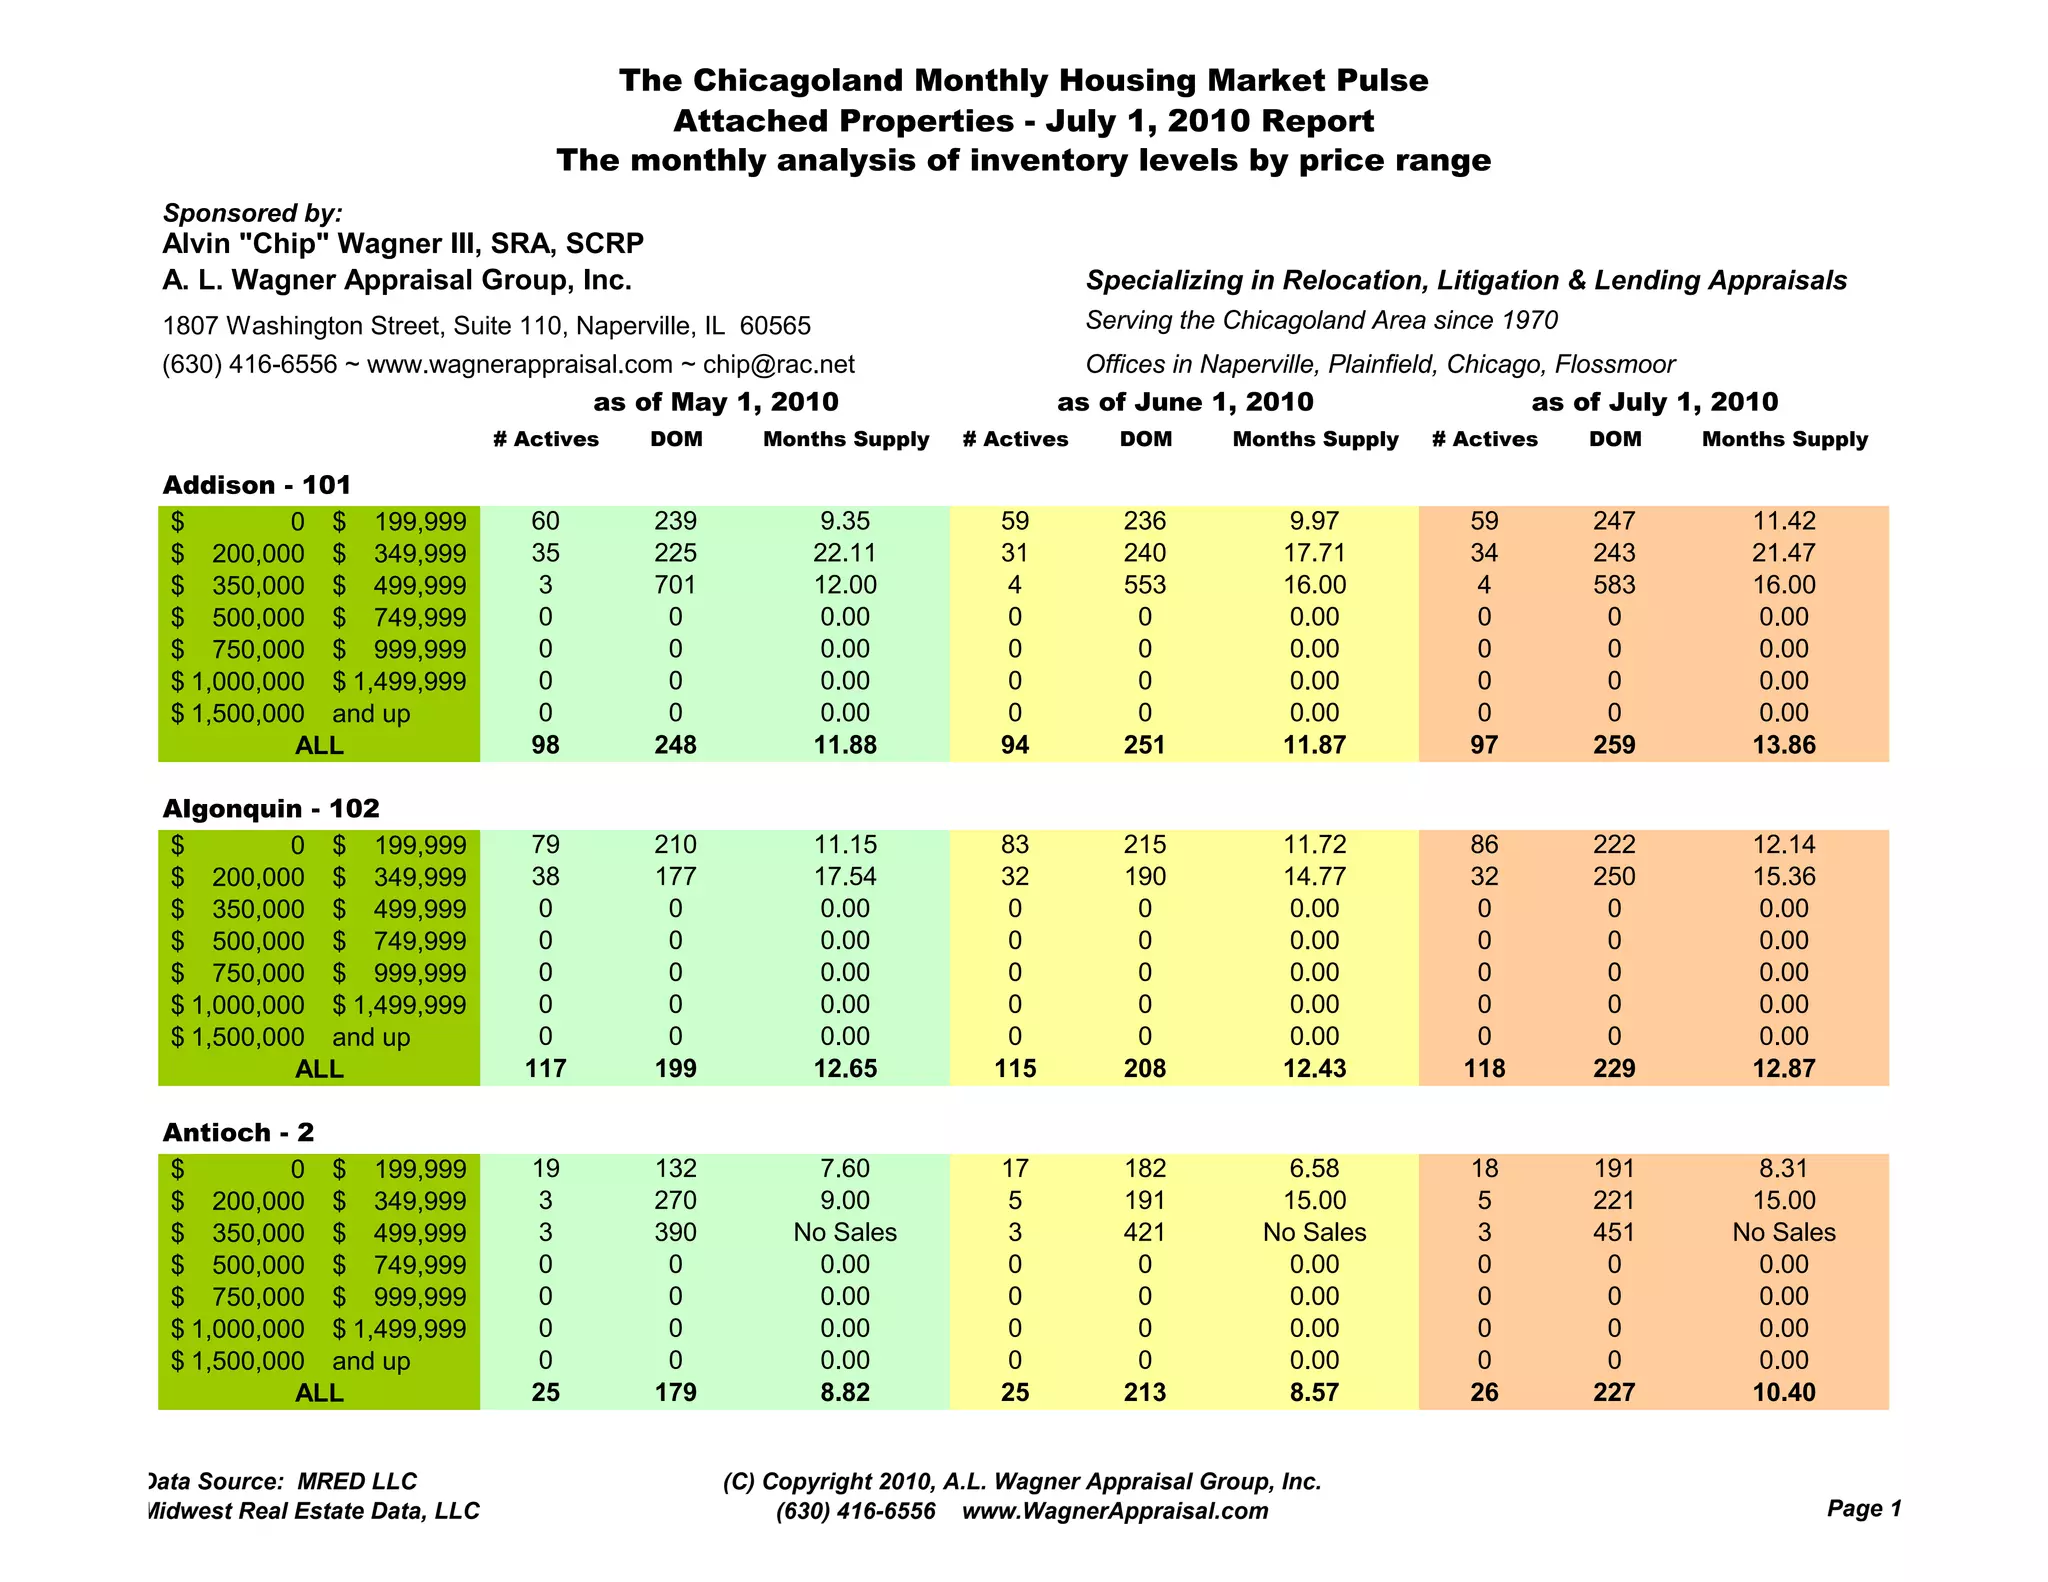
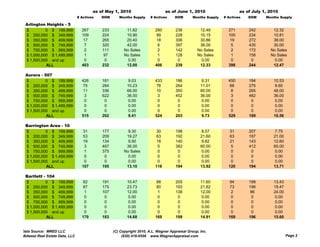
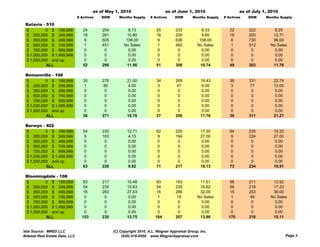
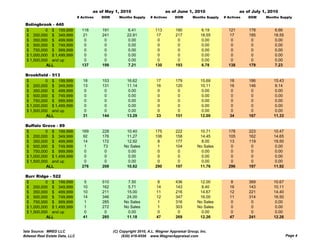
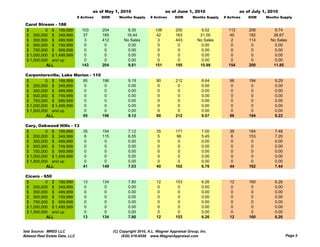
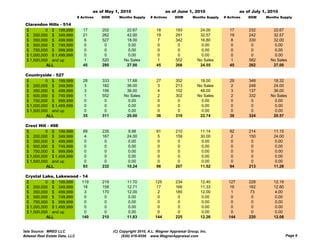
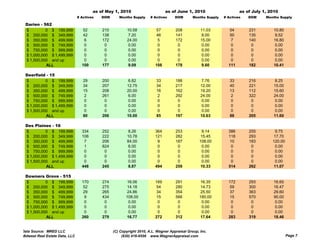
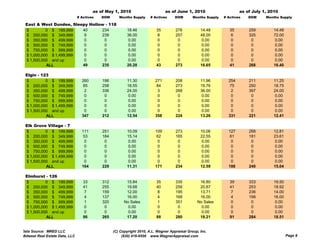
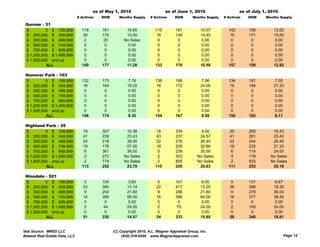
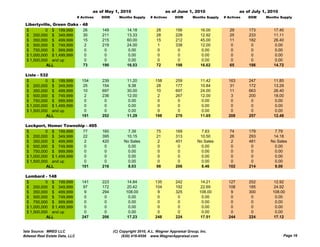
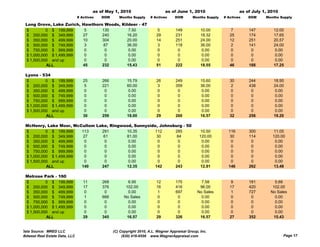
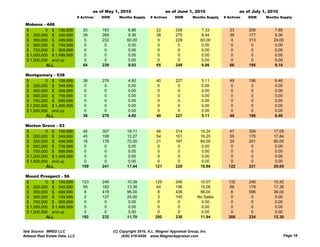
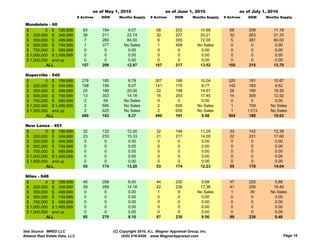
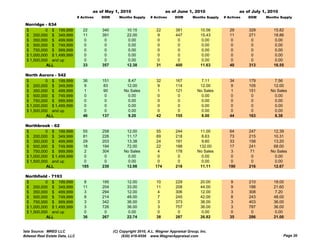
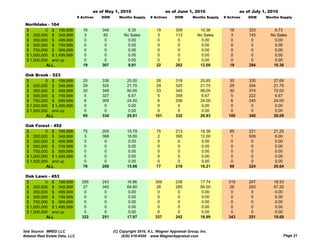
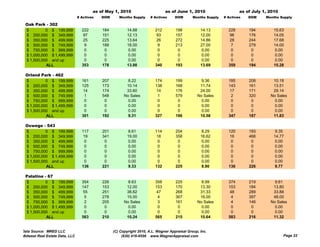
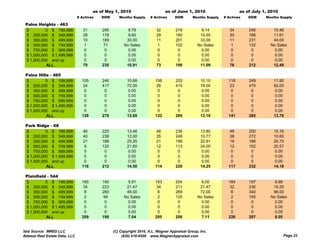
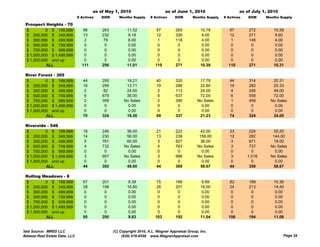
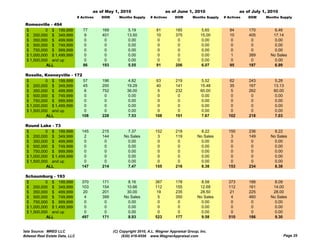
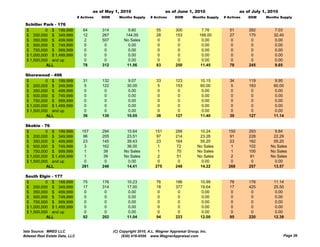
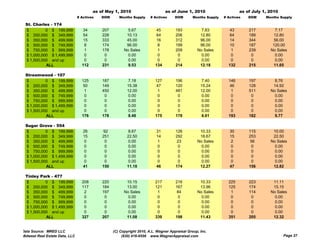
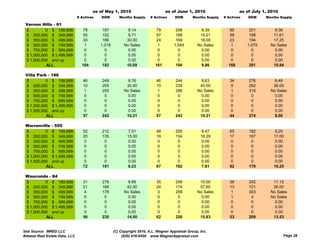
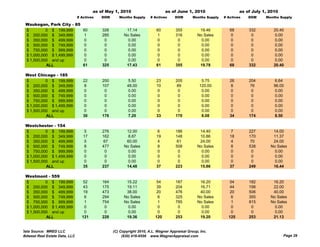
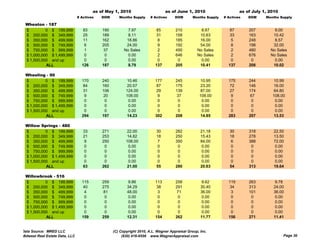
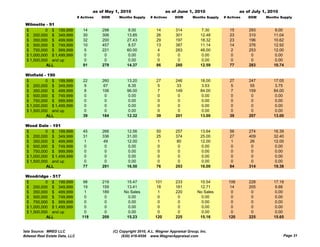
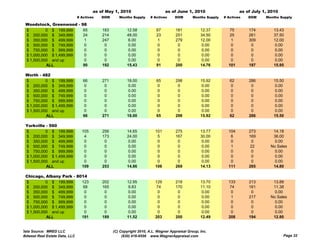
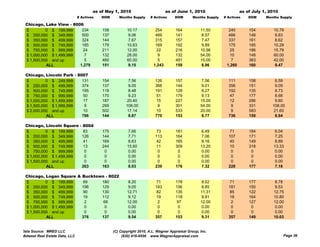
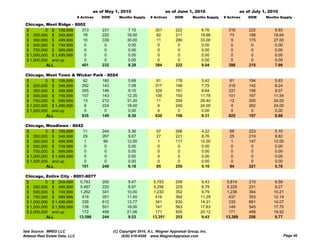
The document analyzes housing inventory levels by price range for several Chicagoland municipalities in May, June, and July 2010. It shows the number of active listings, average days on market, and months of supply for different price brackets. In most areas, inventory levels were stable or increased slightly over the three months. Average days on market remained largely similar, while months of supply increased modestly in many price categories.