
Download as PDF, PPTX

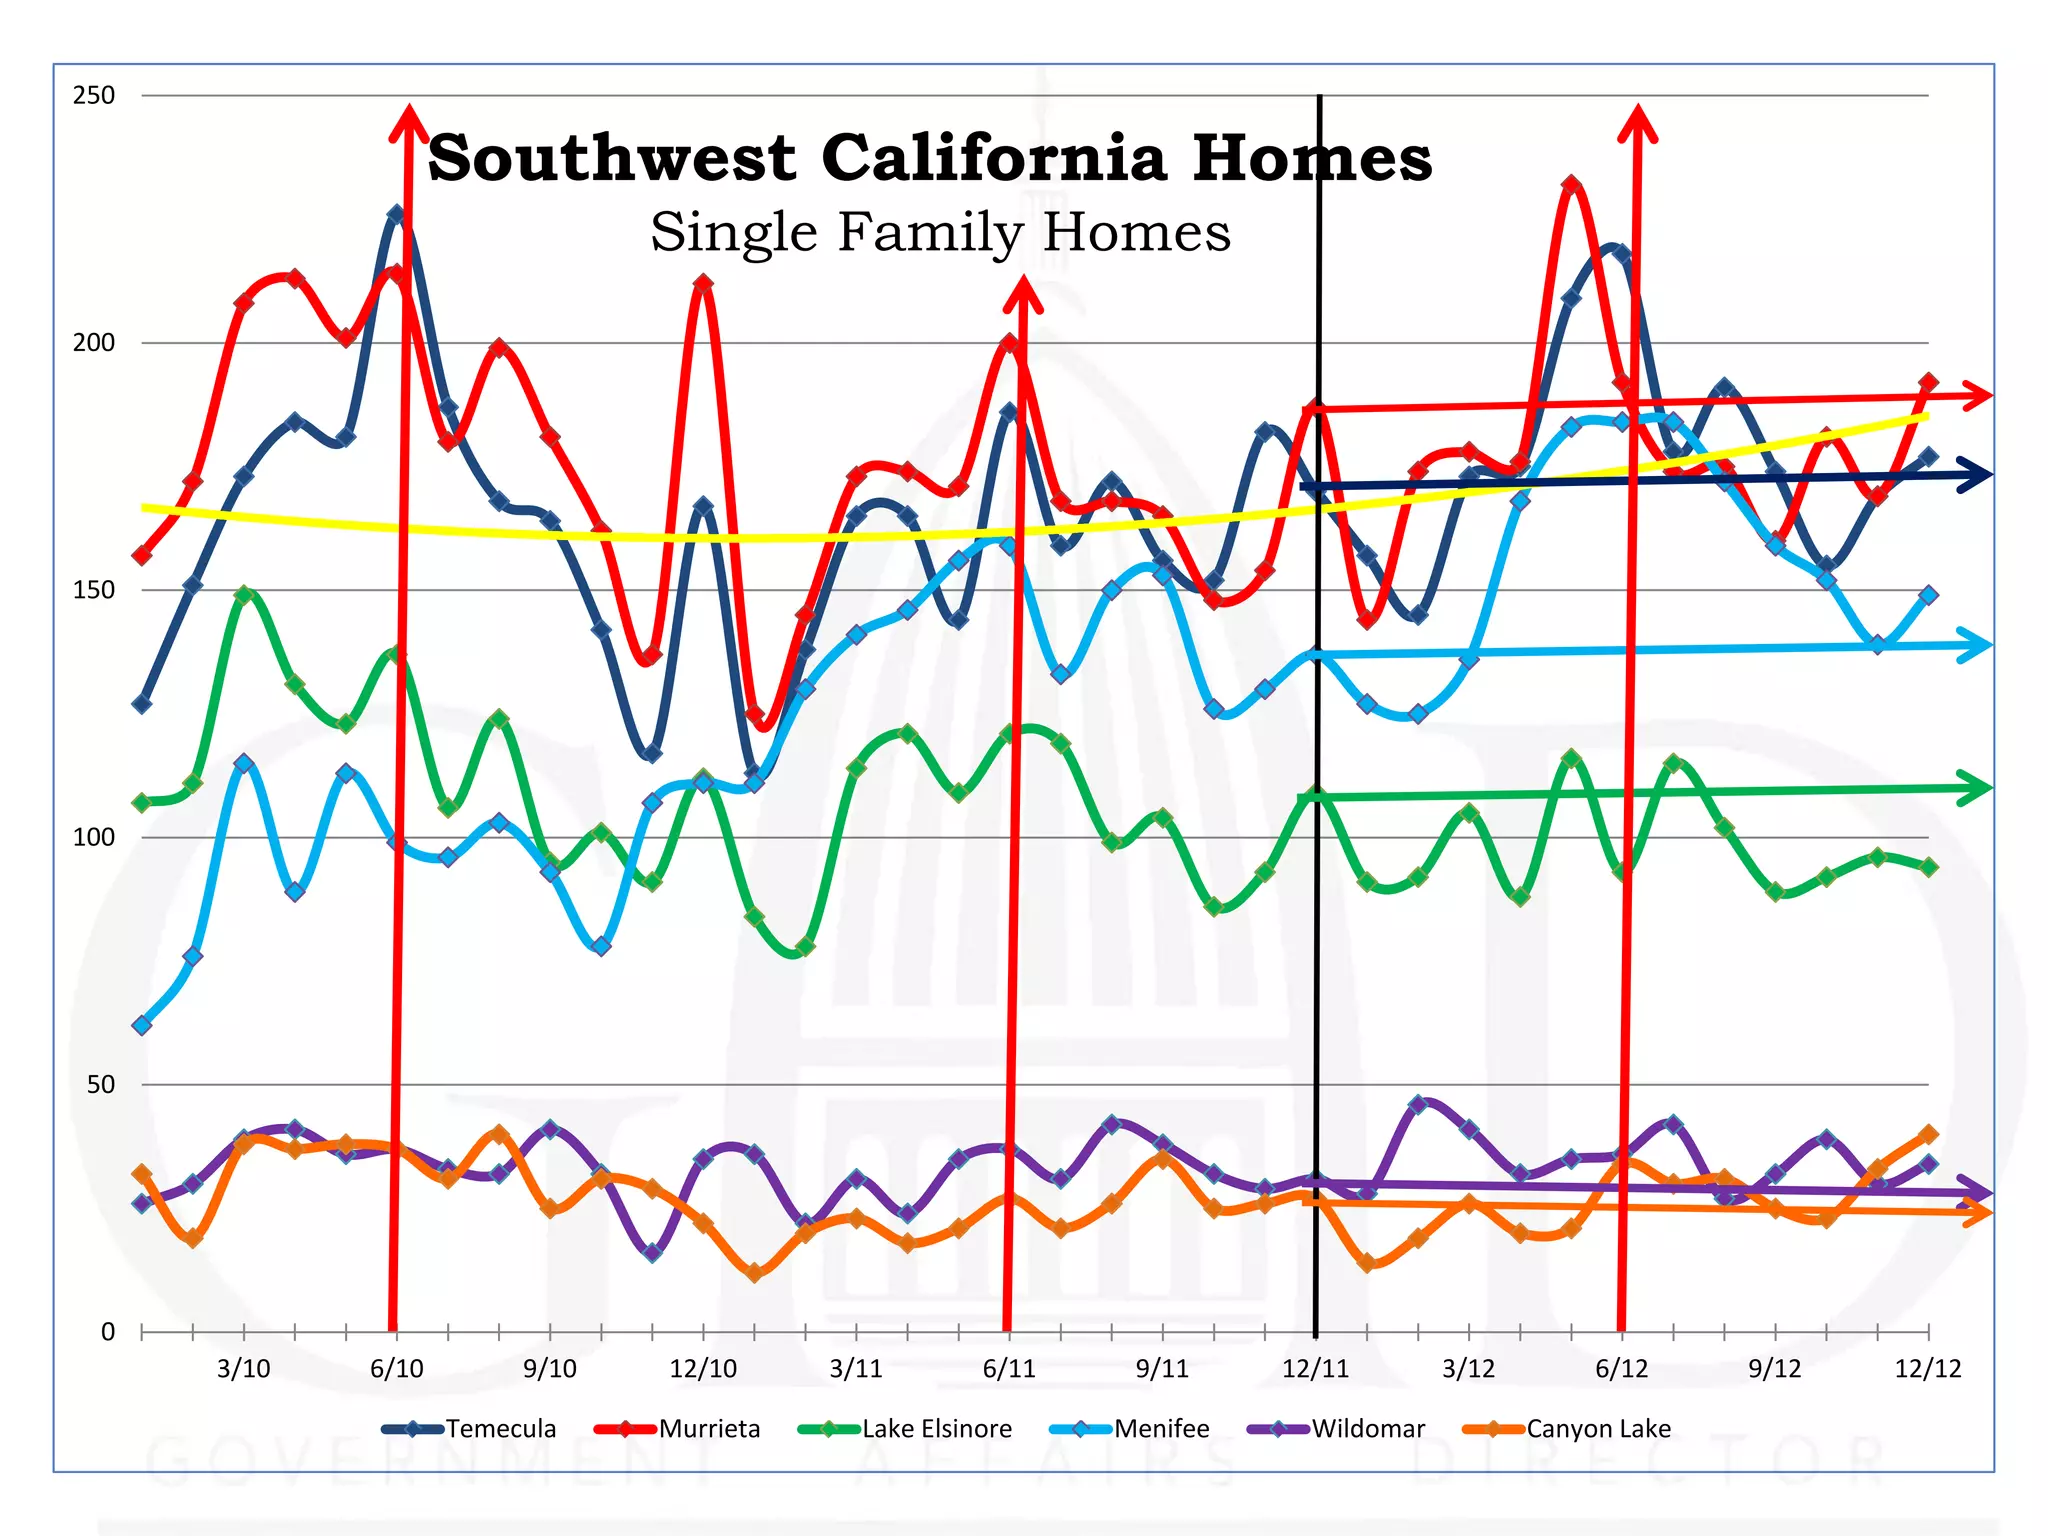
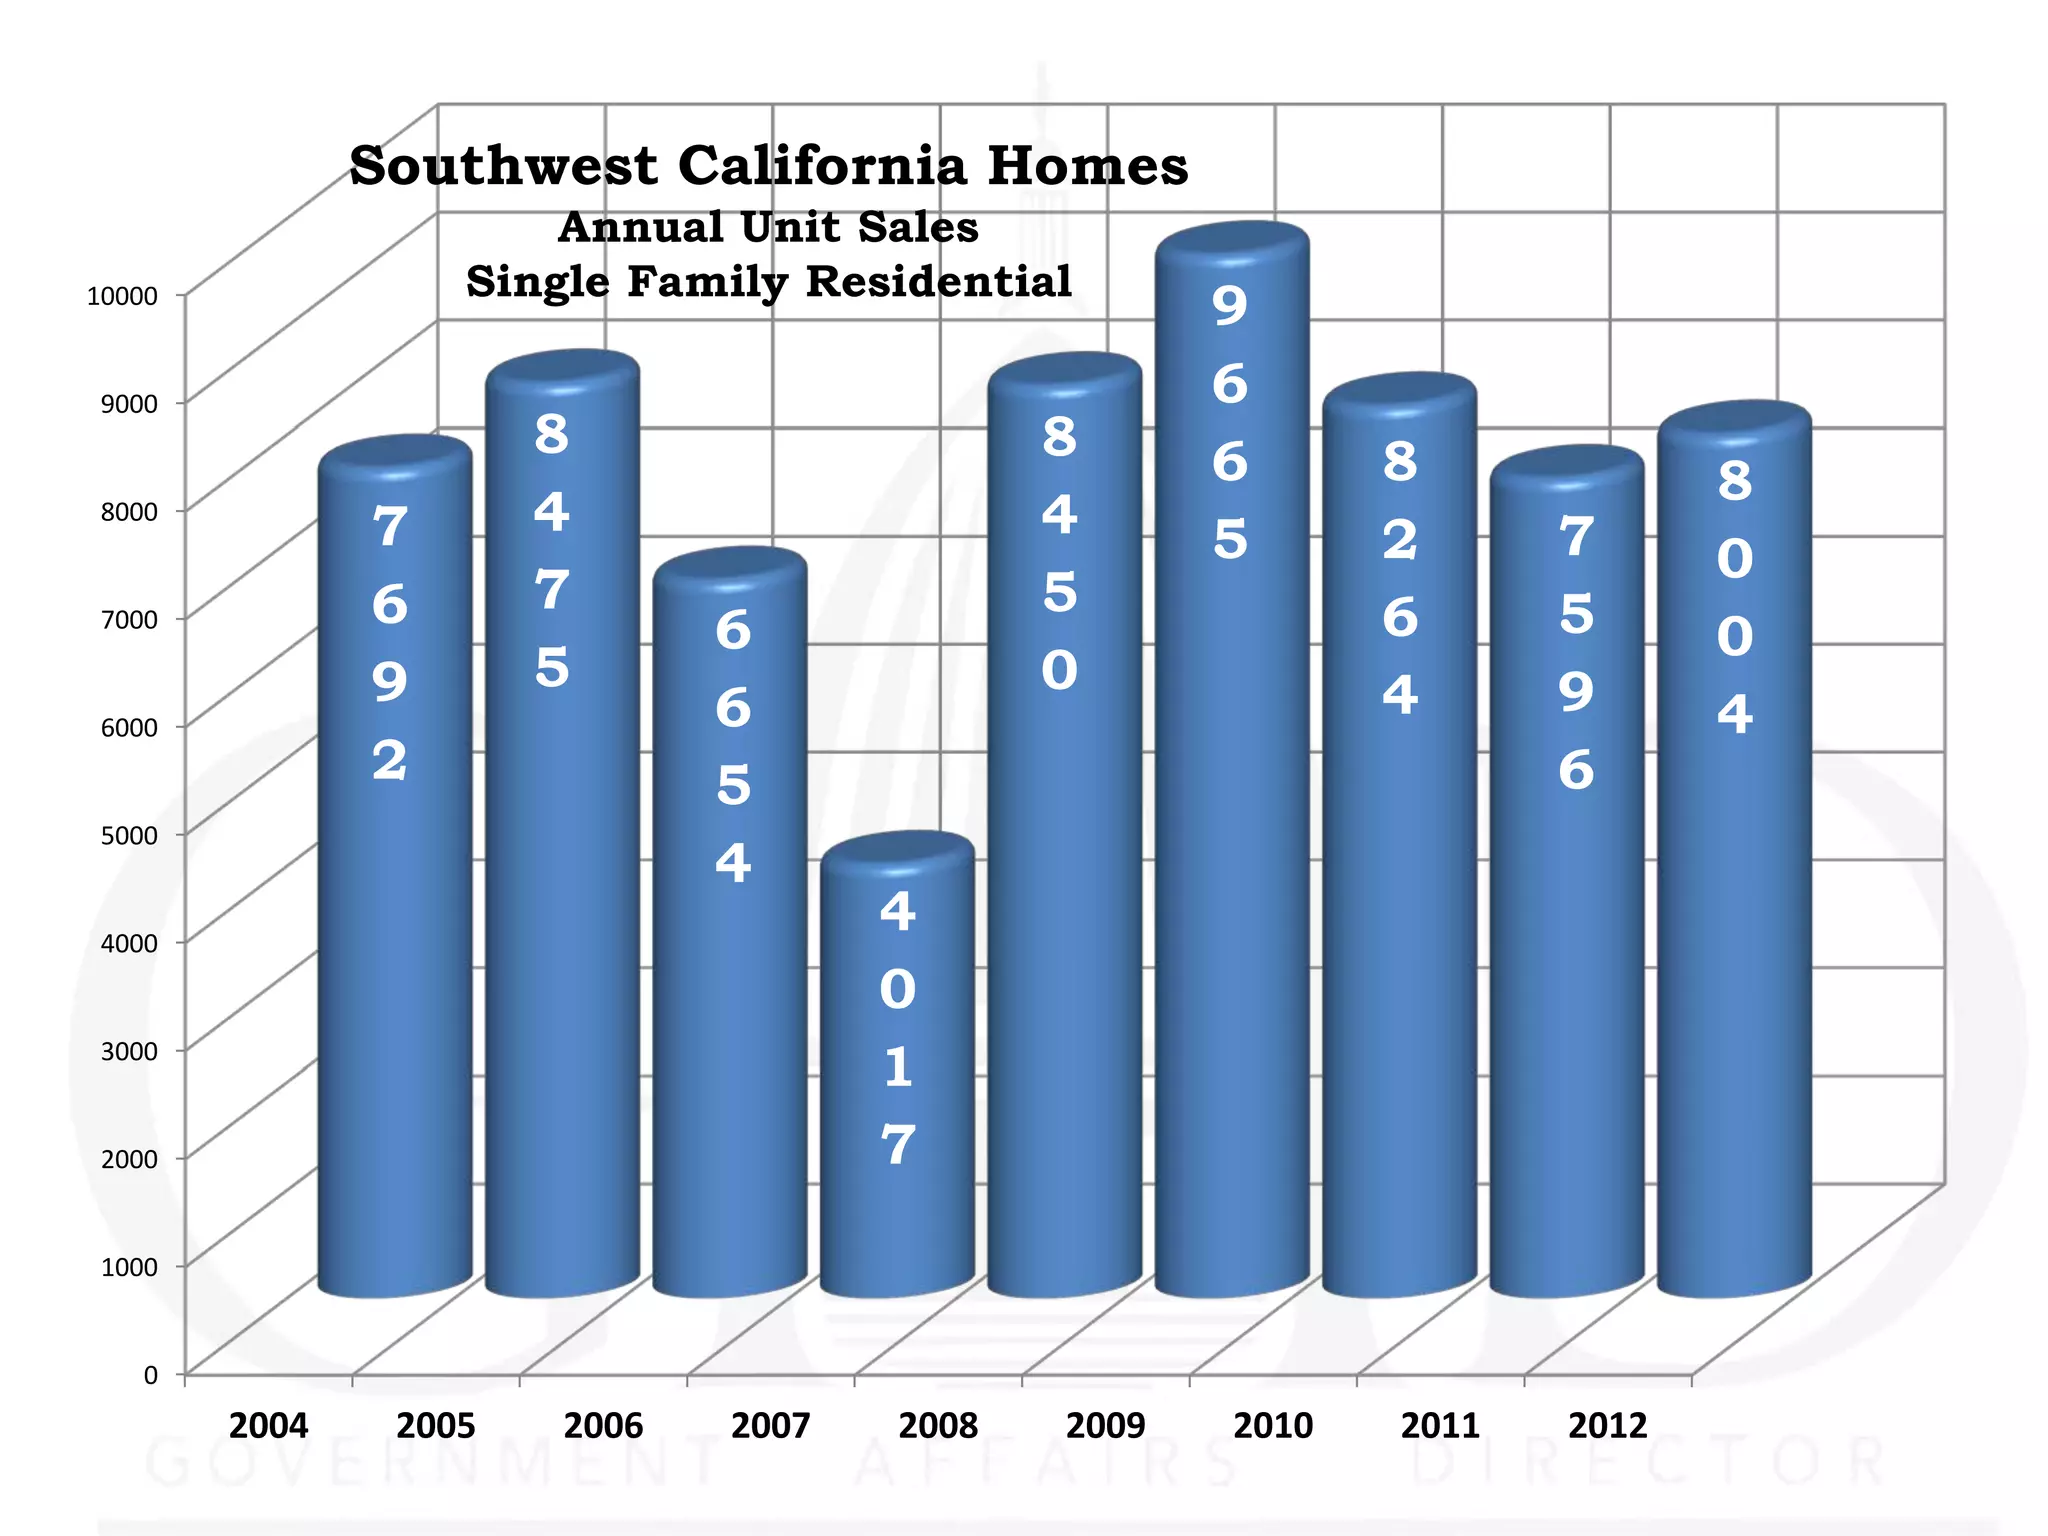
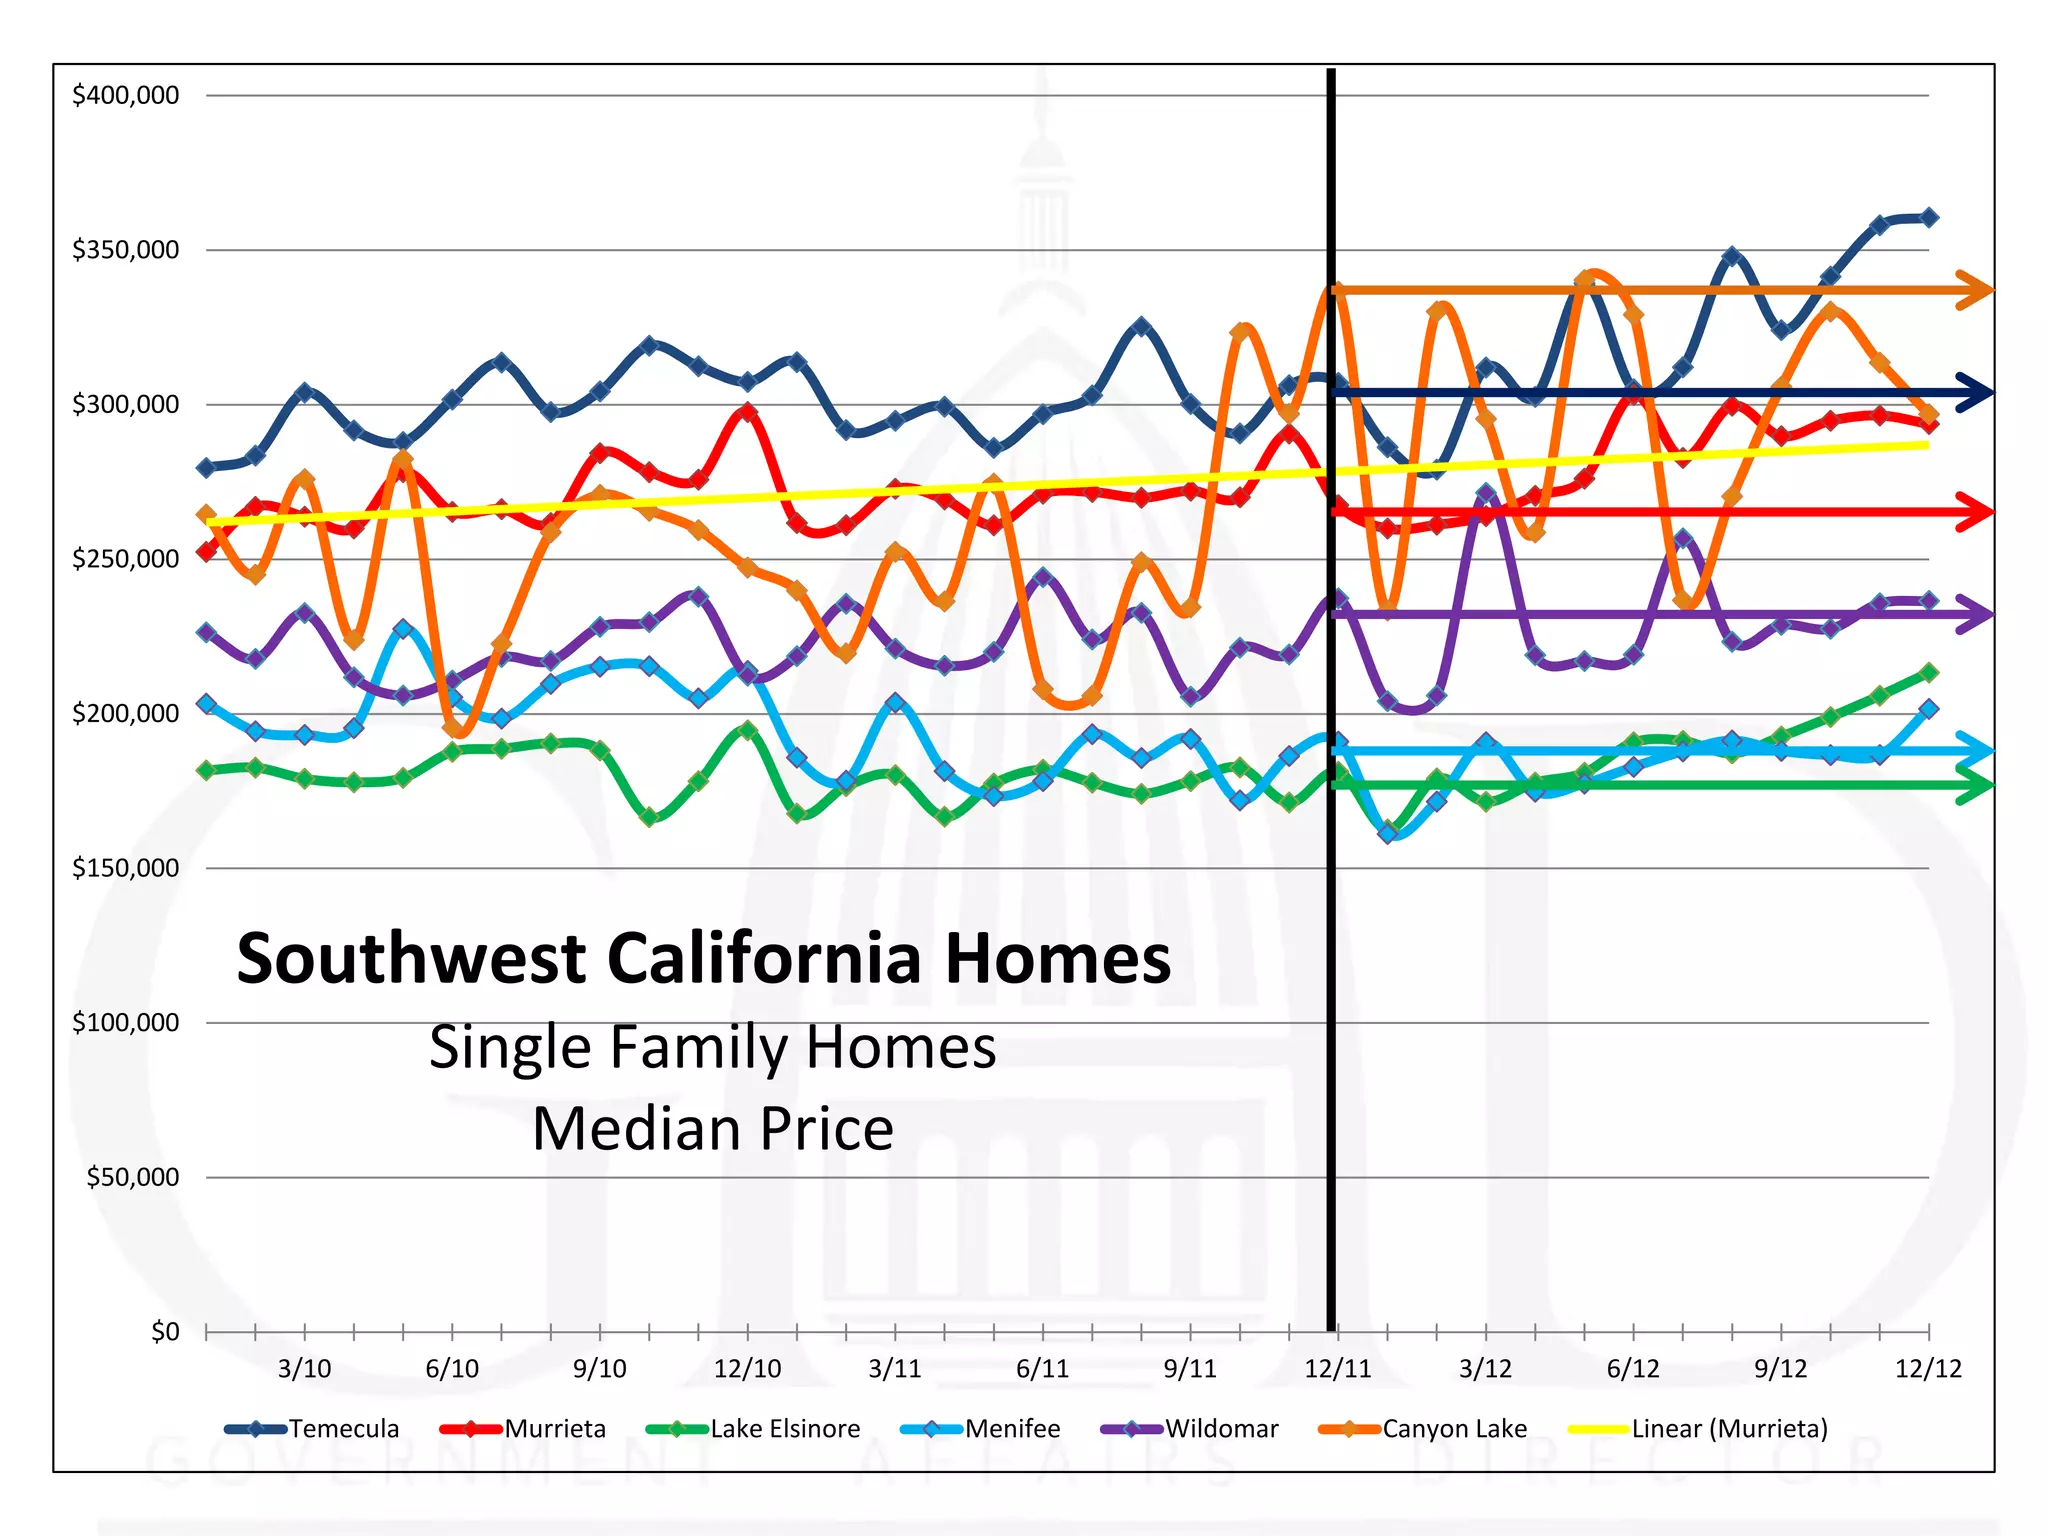
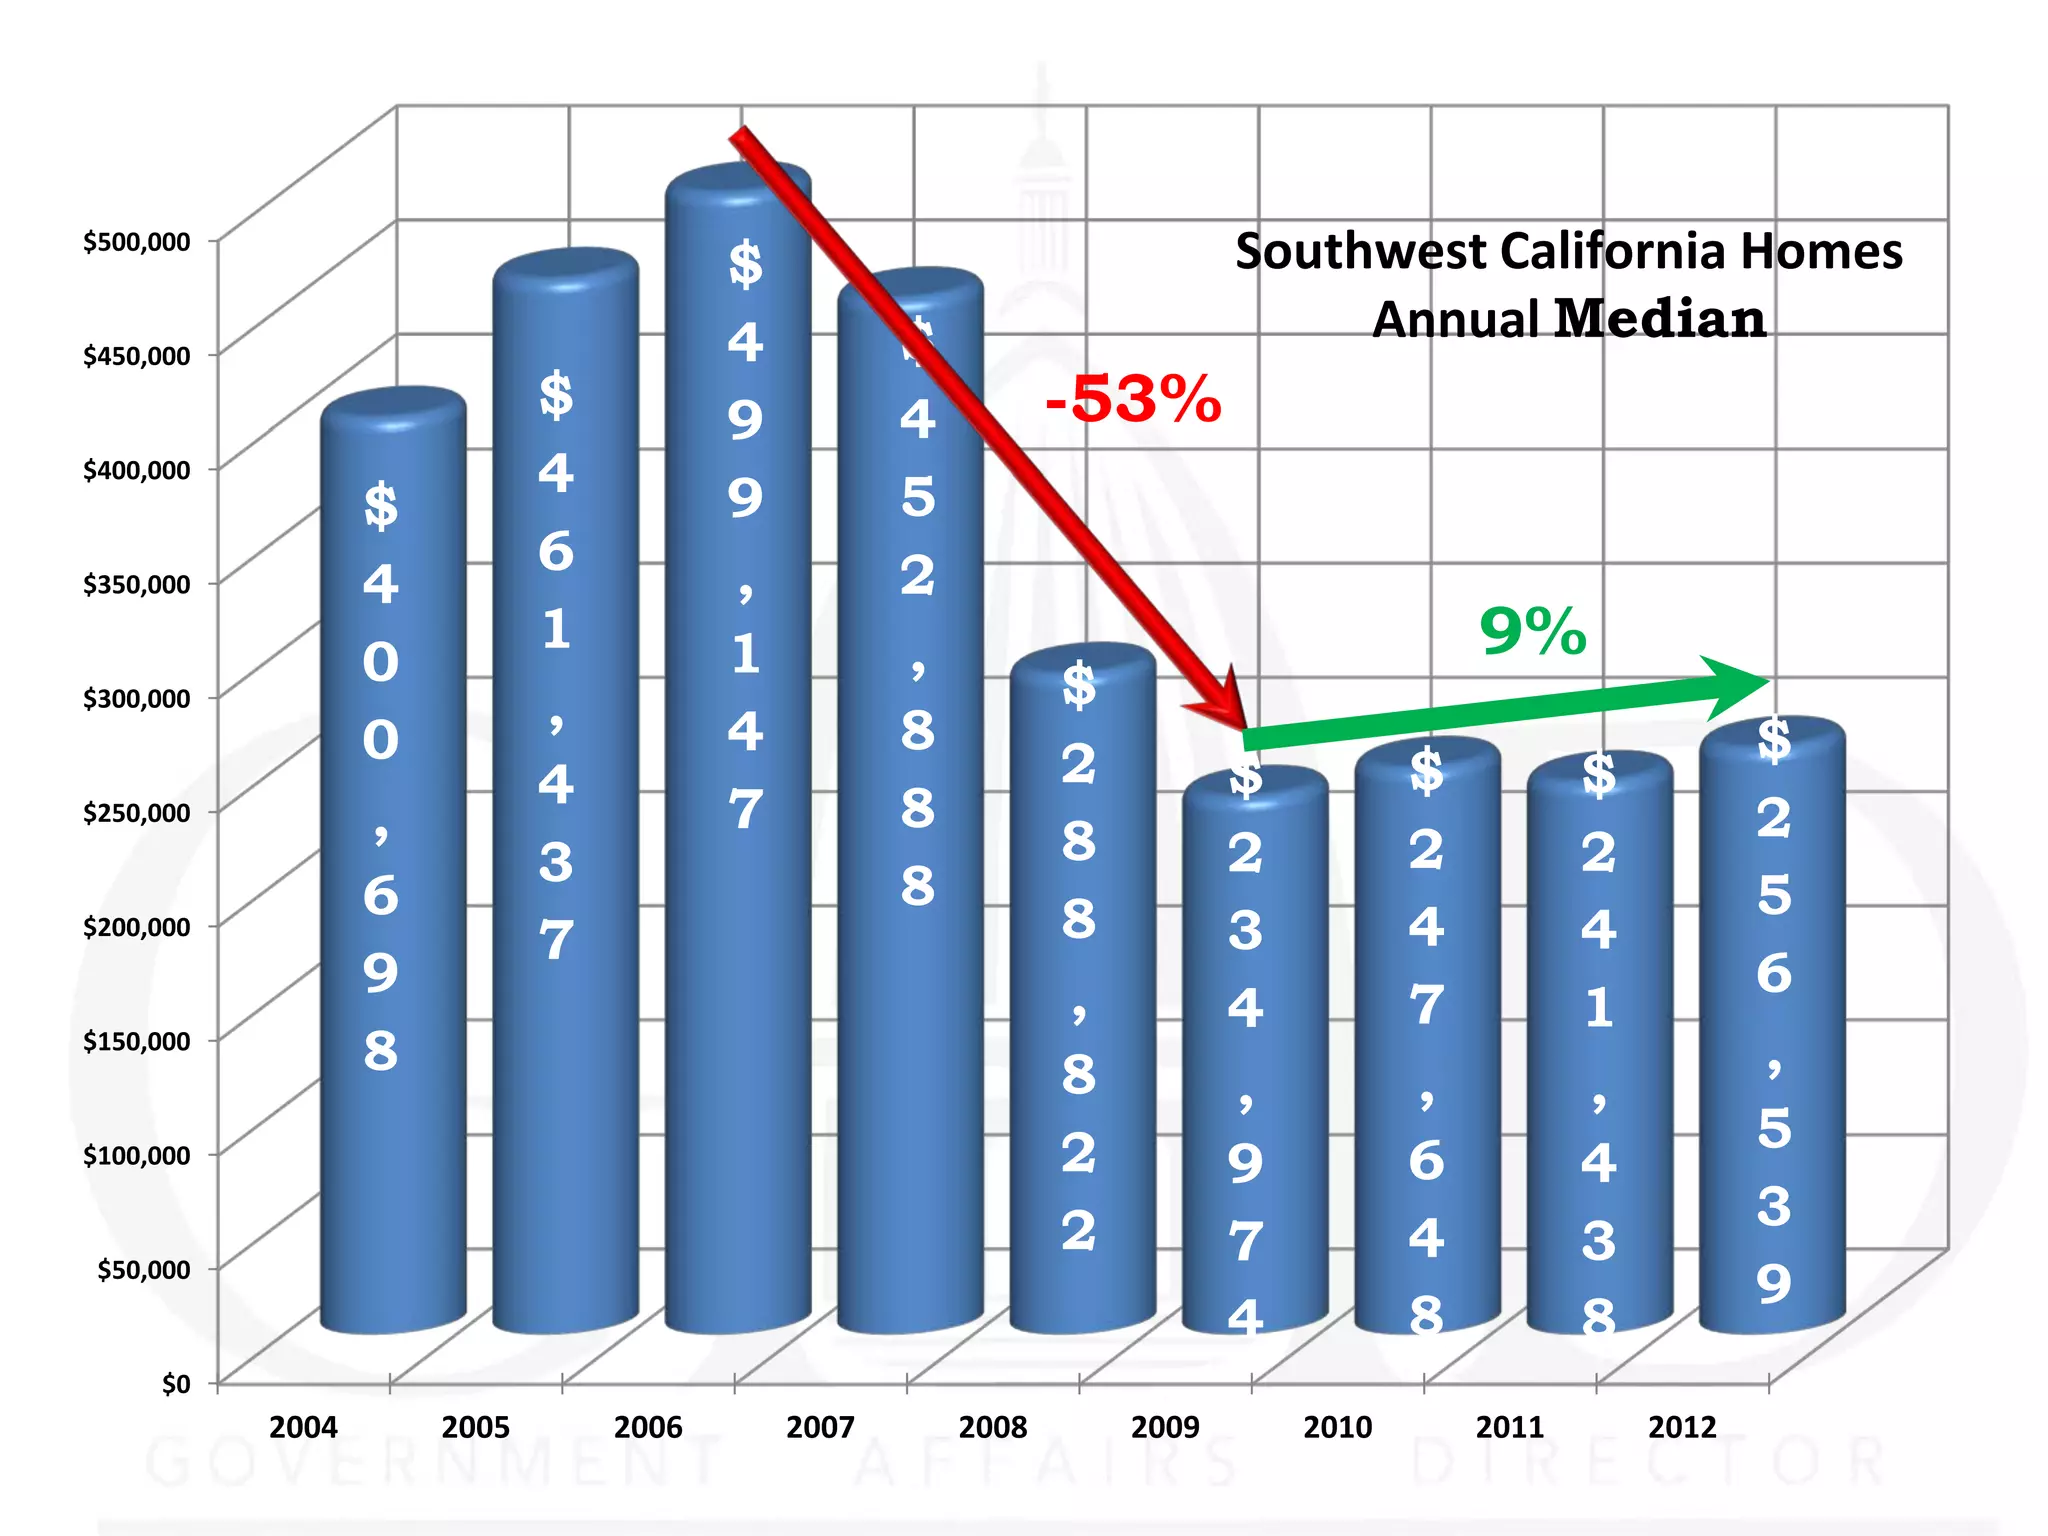
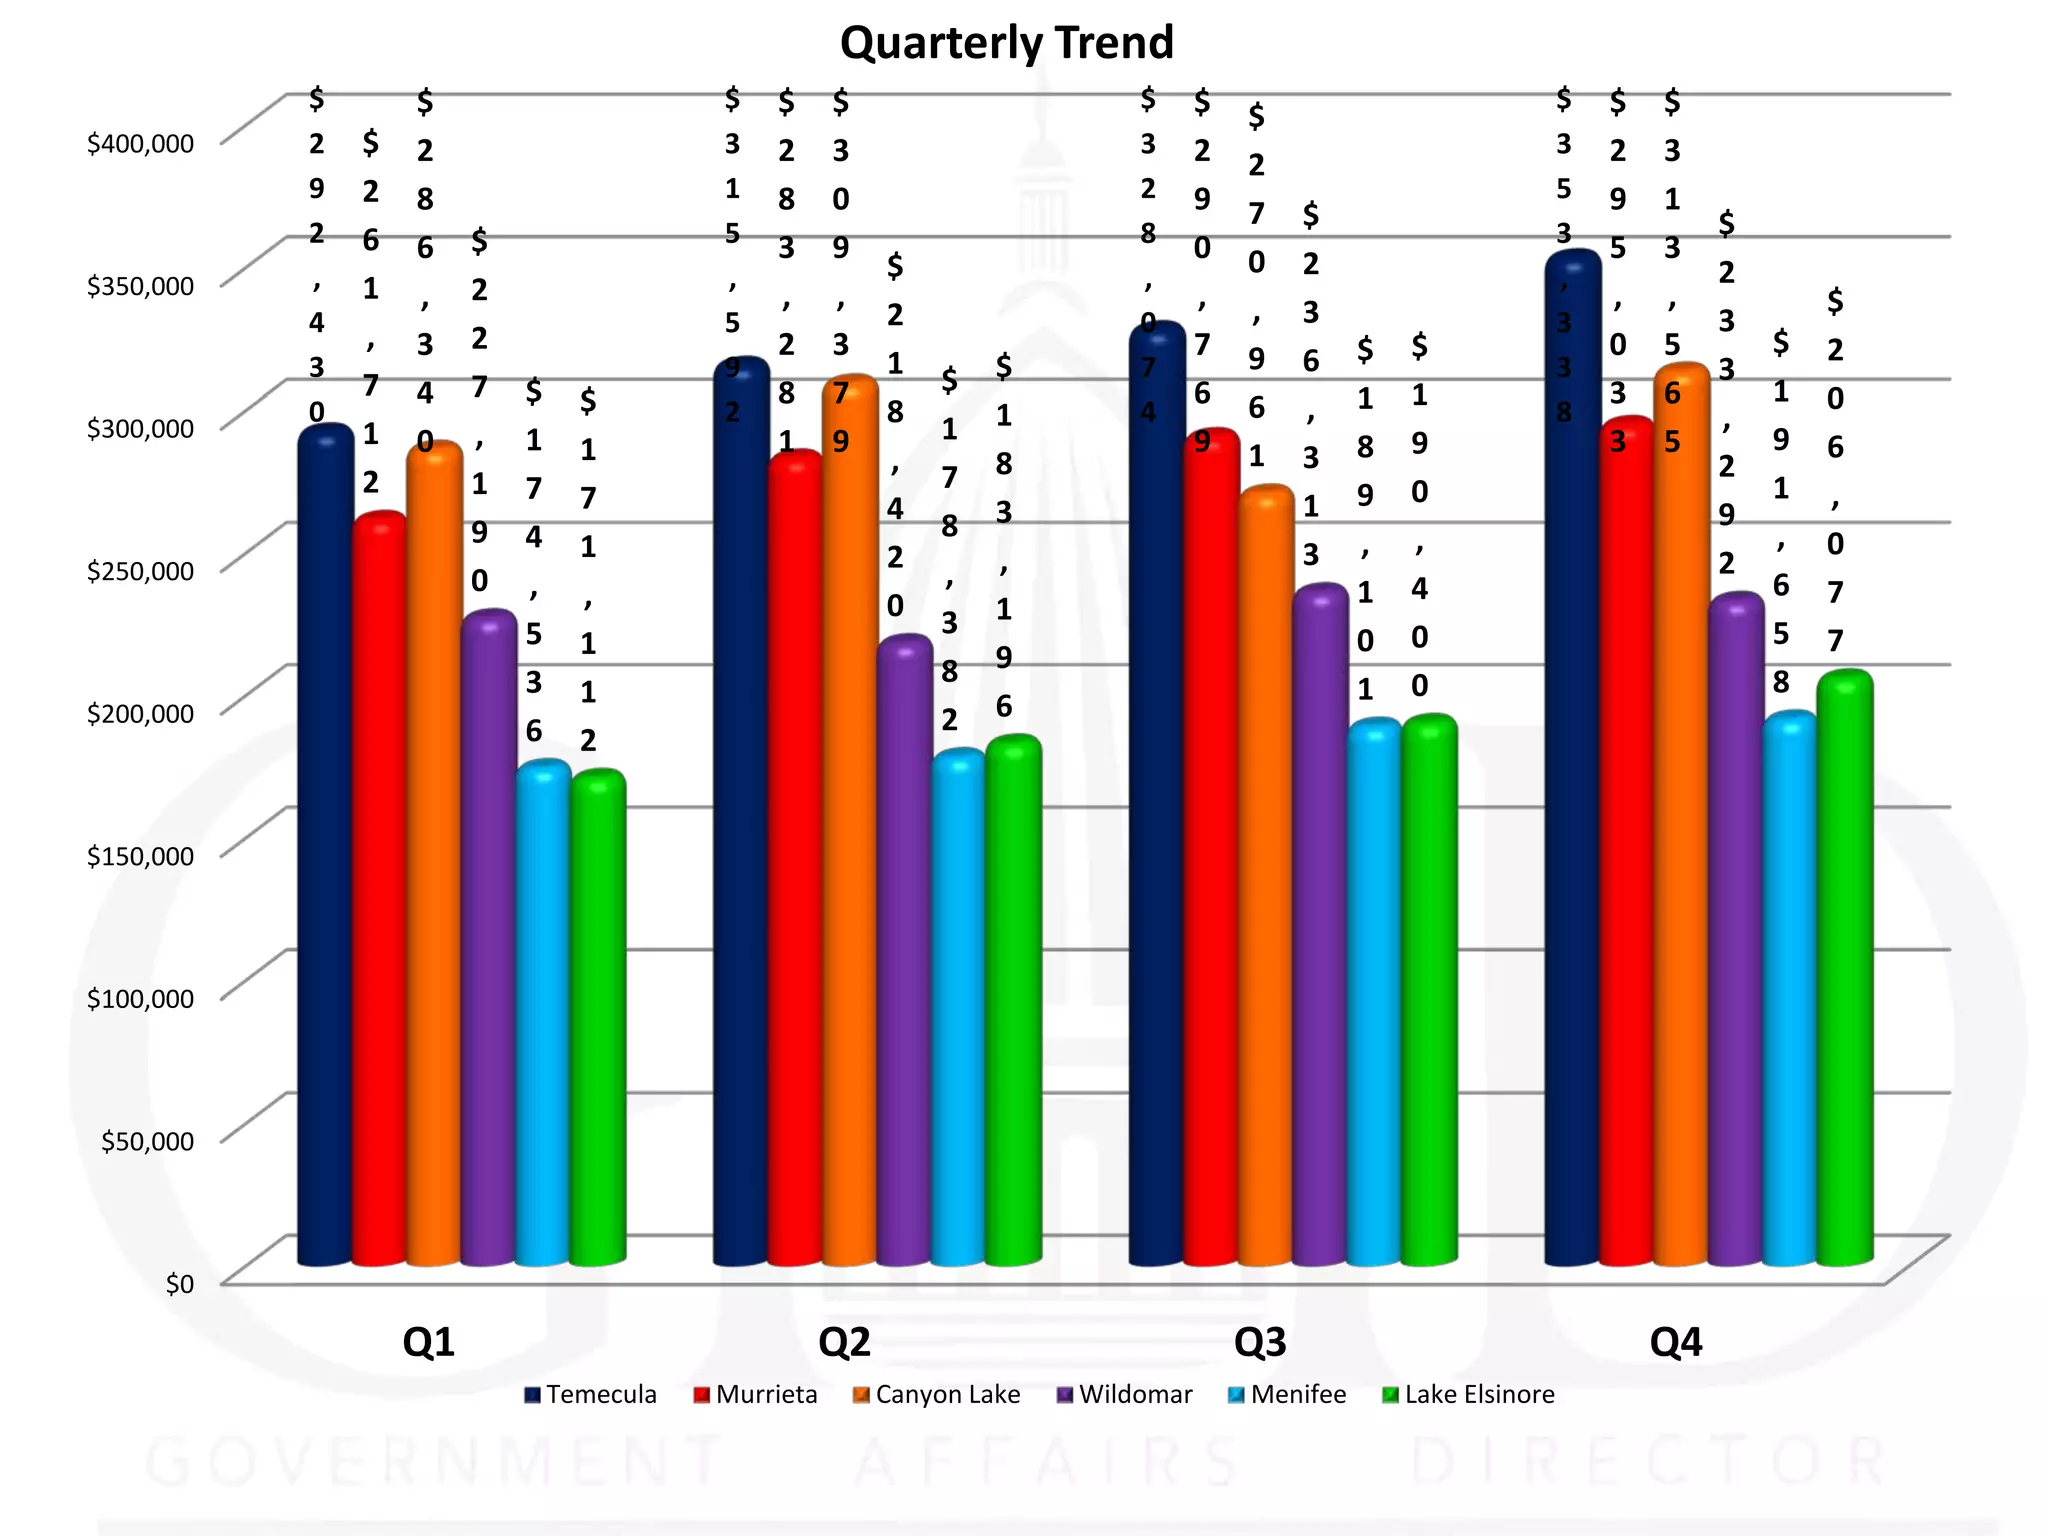
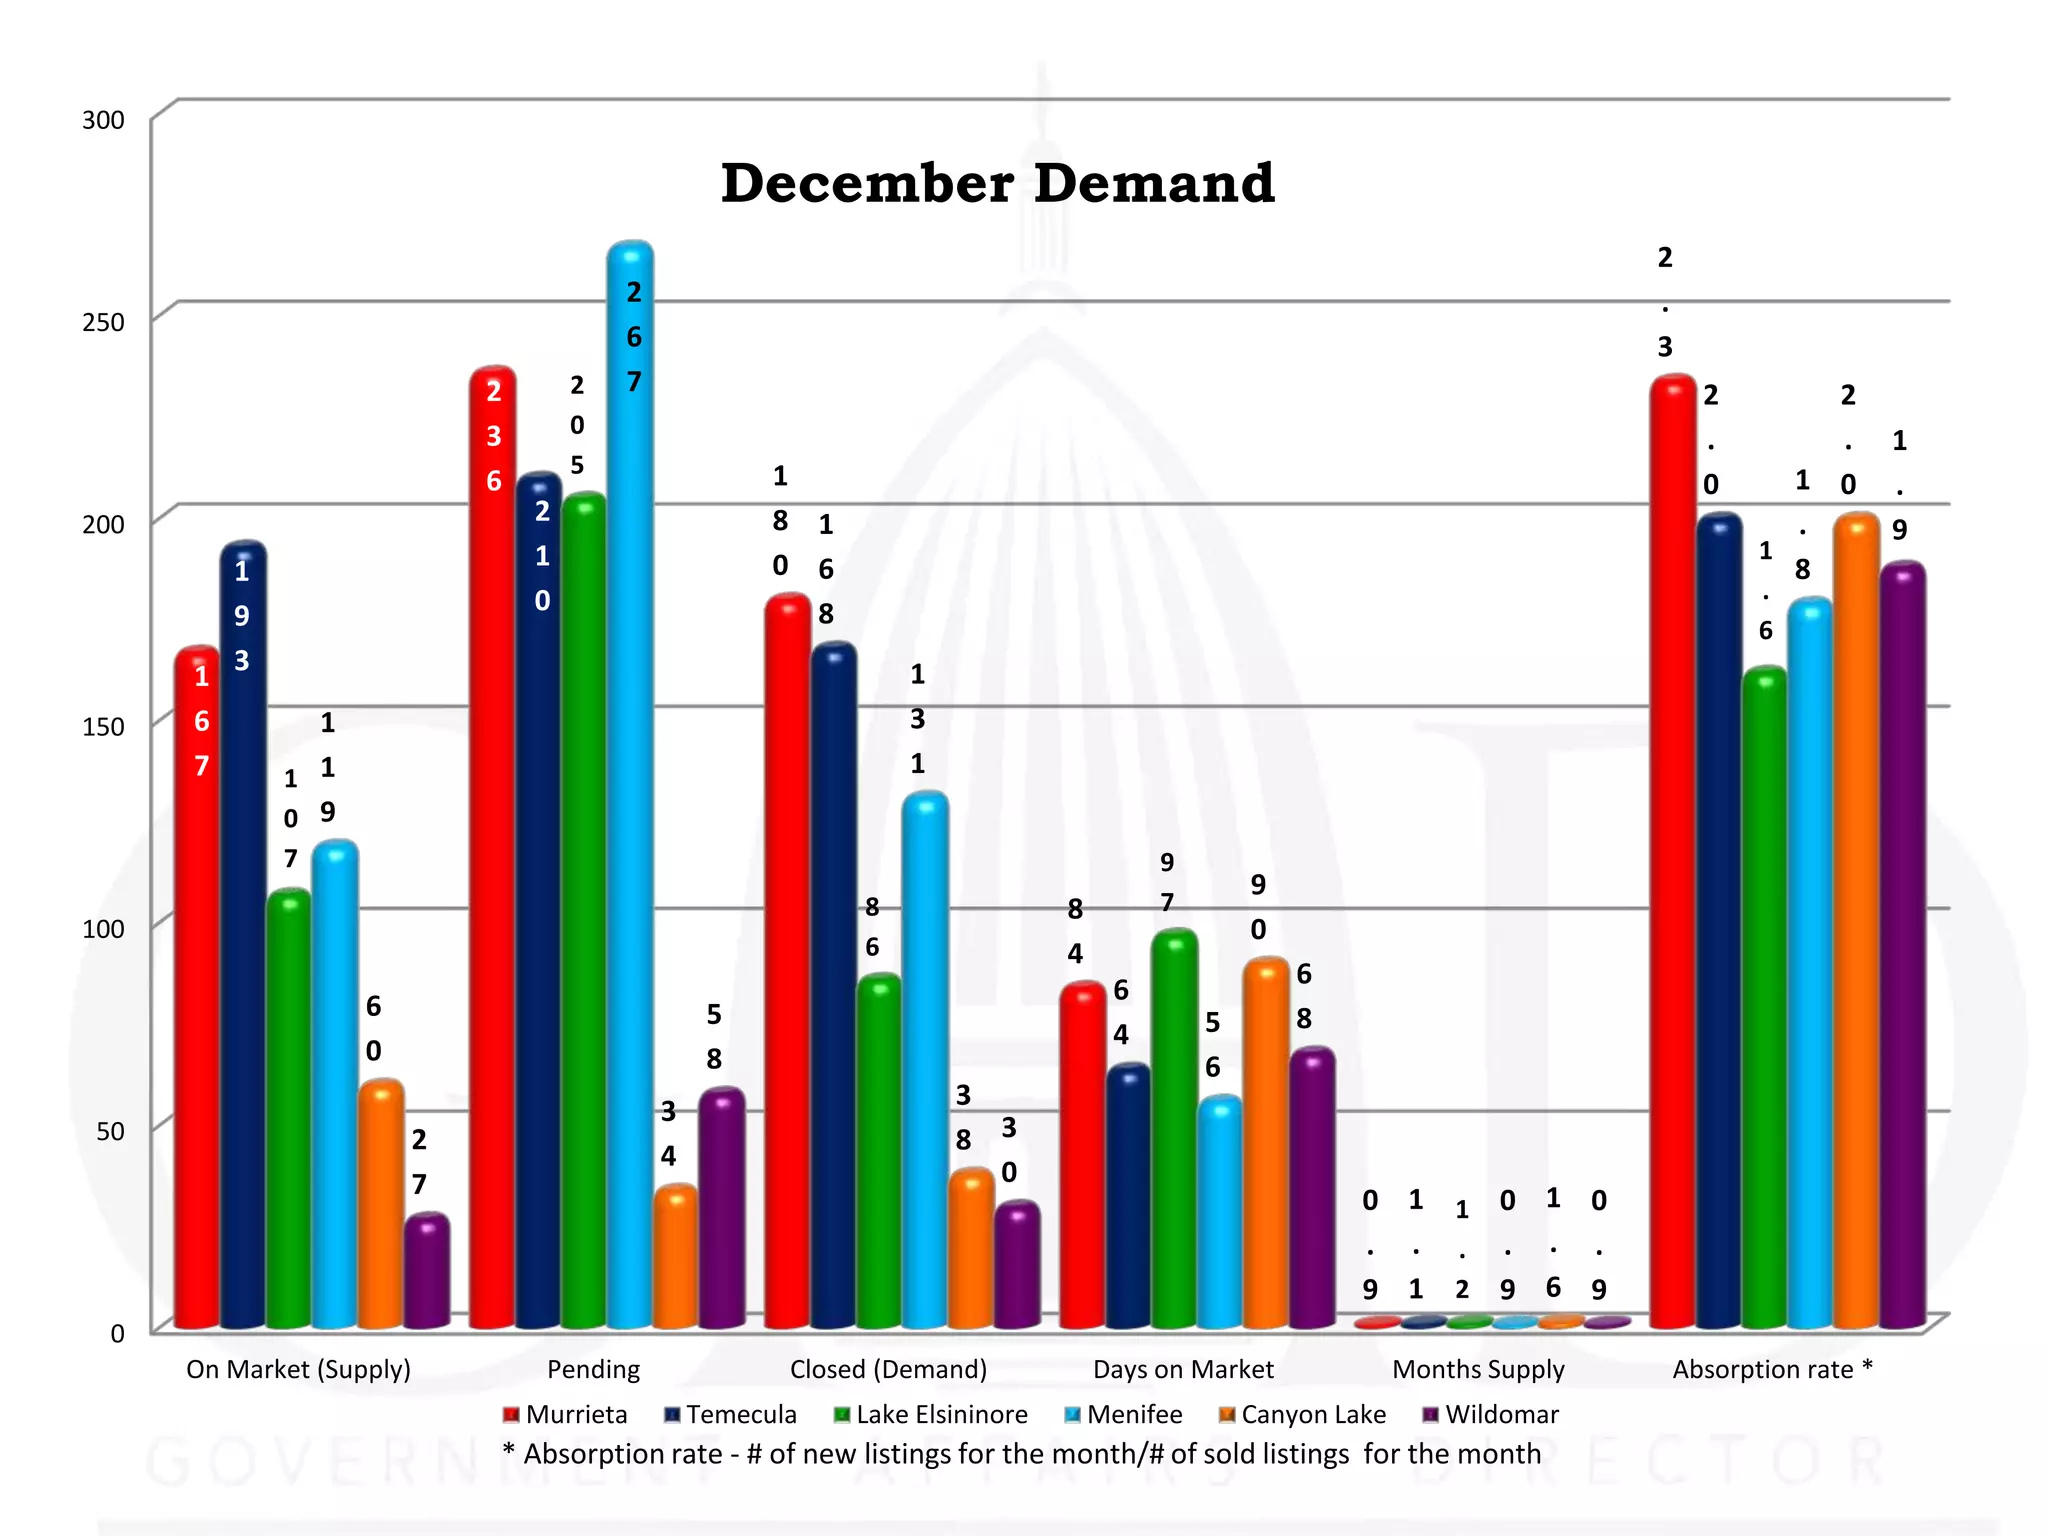
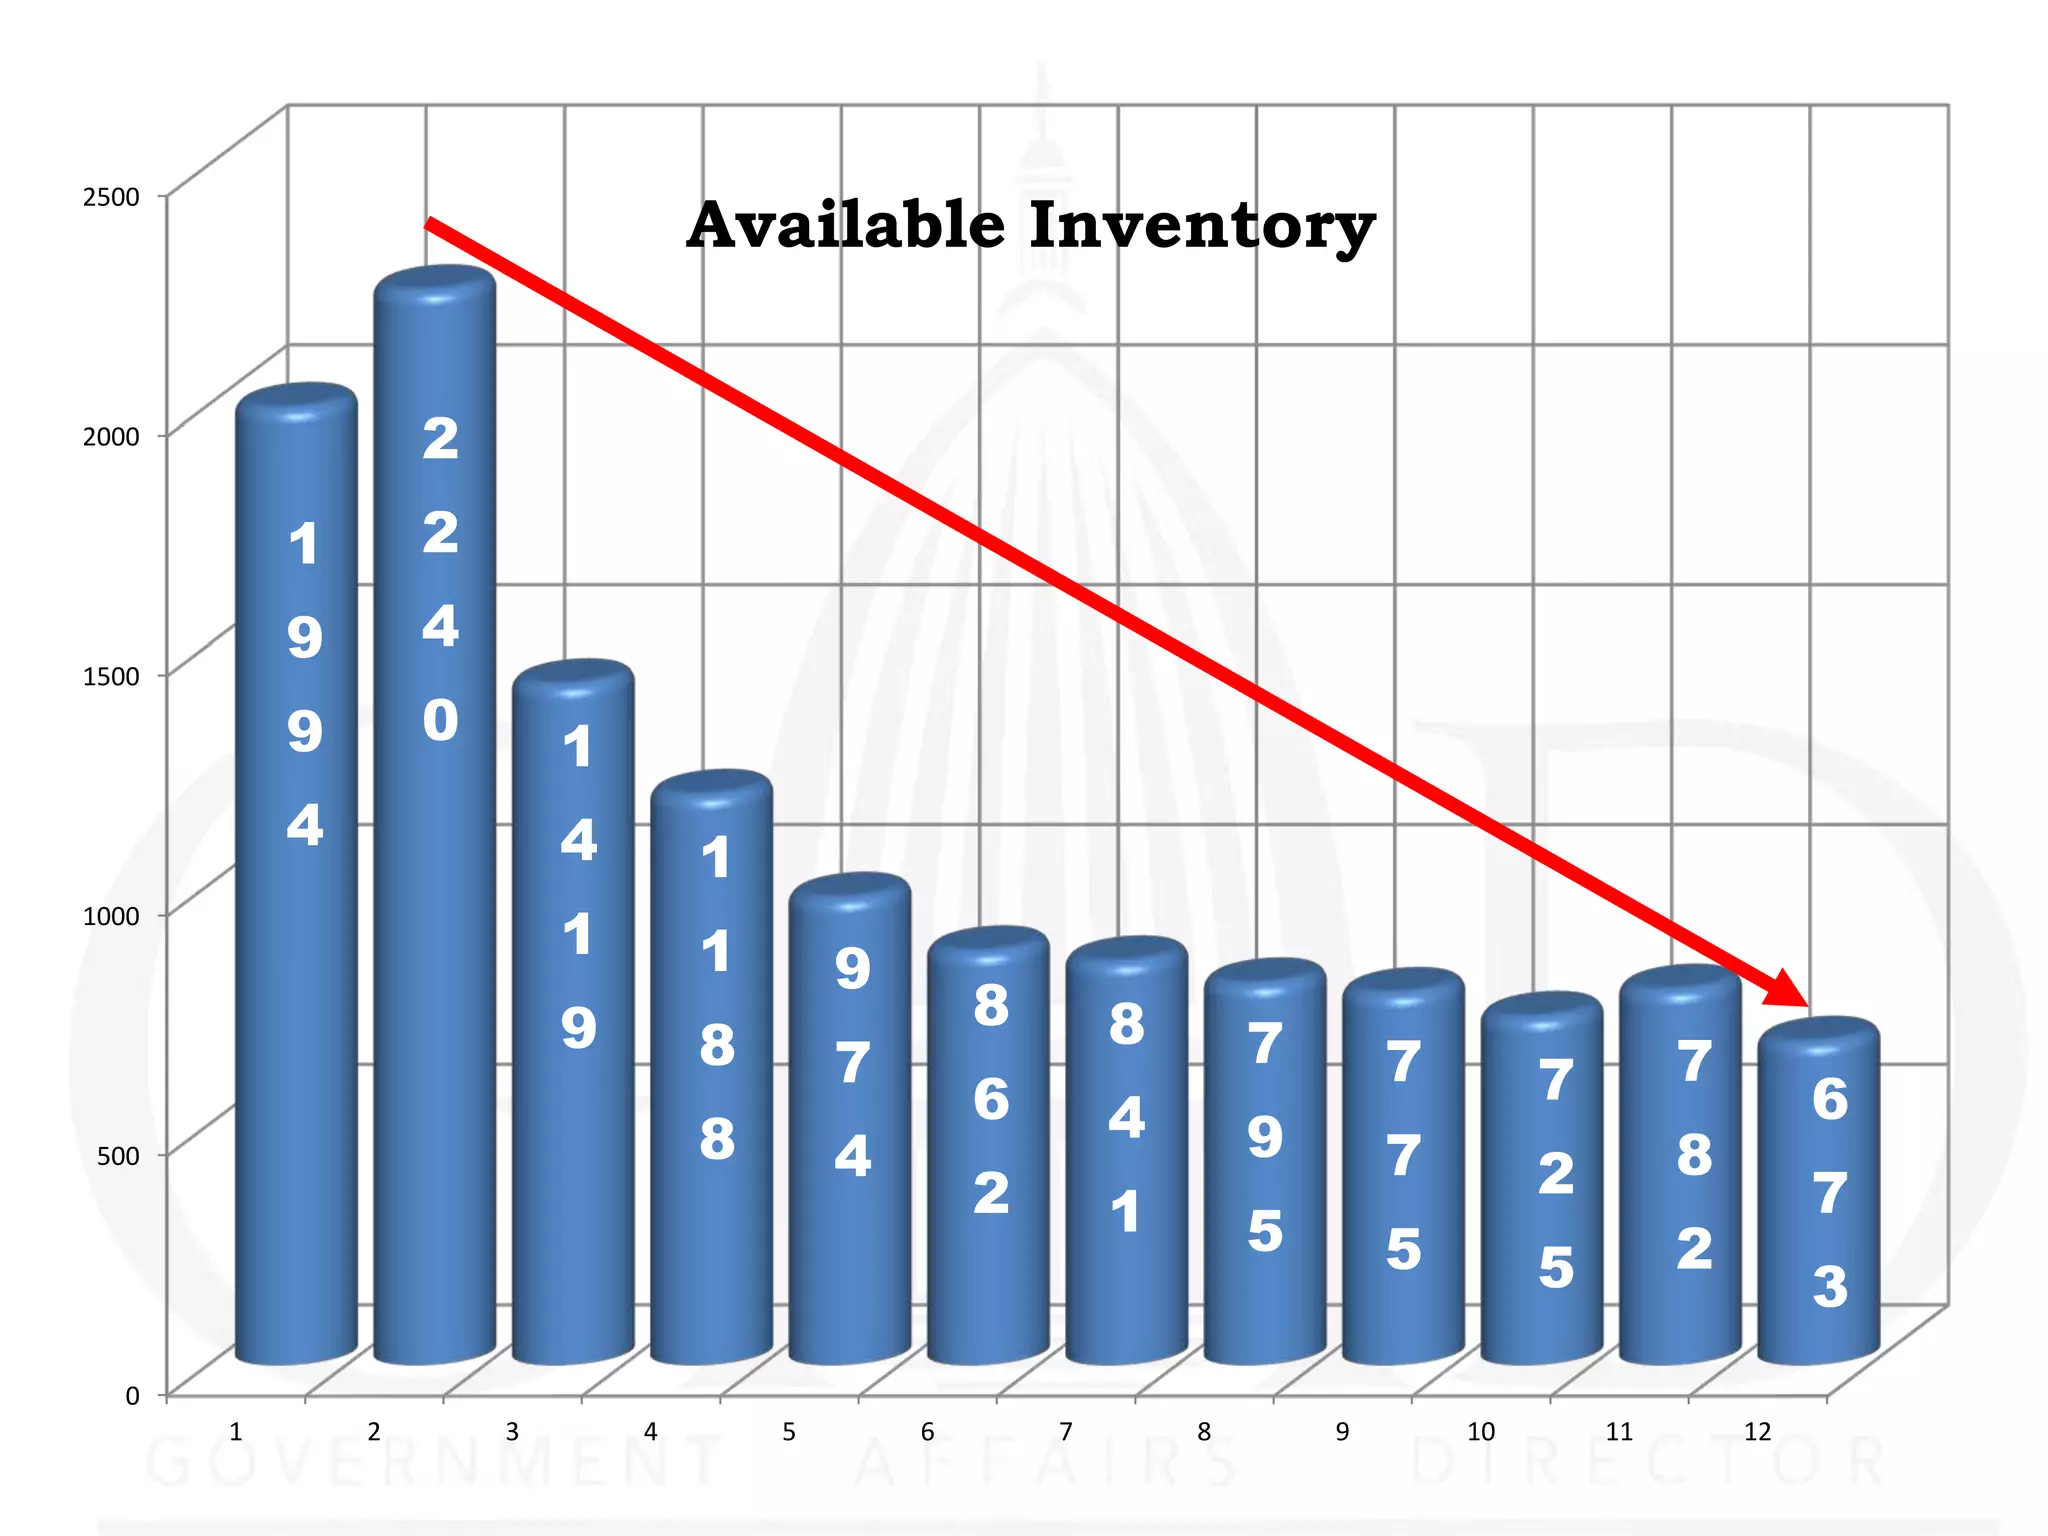
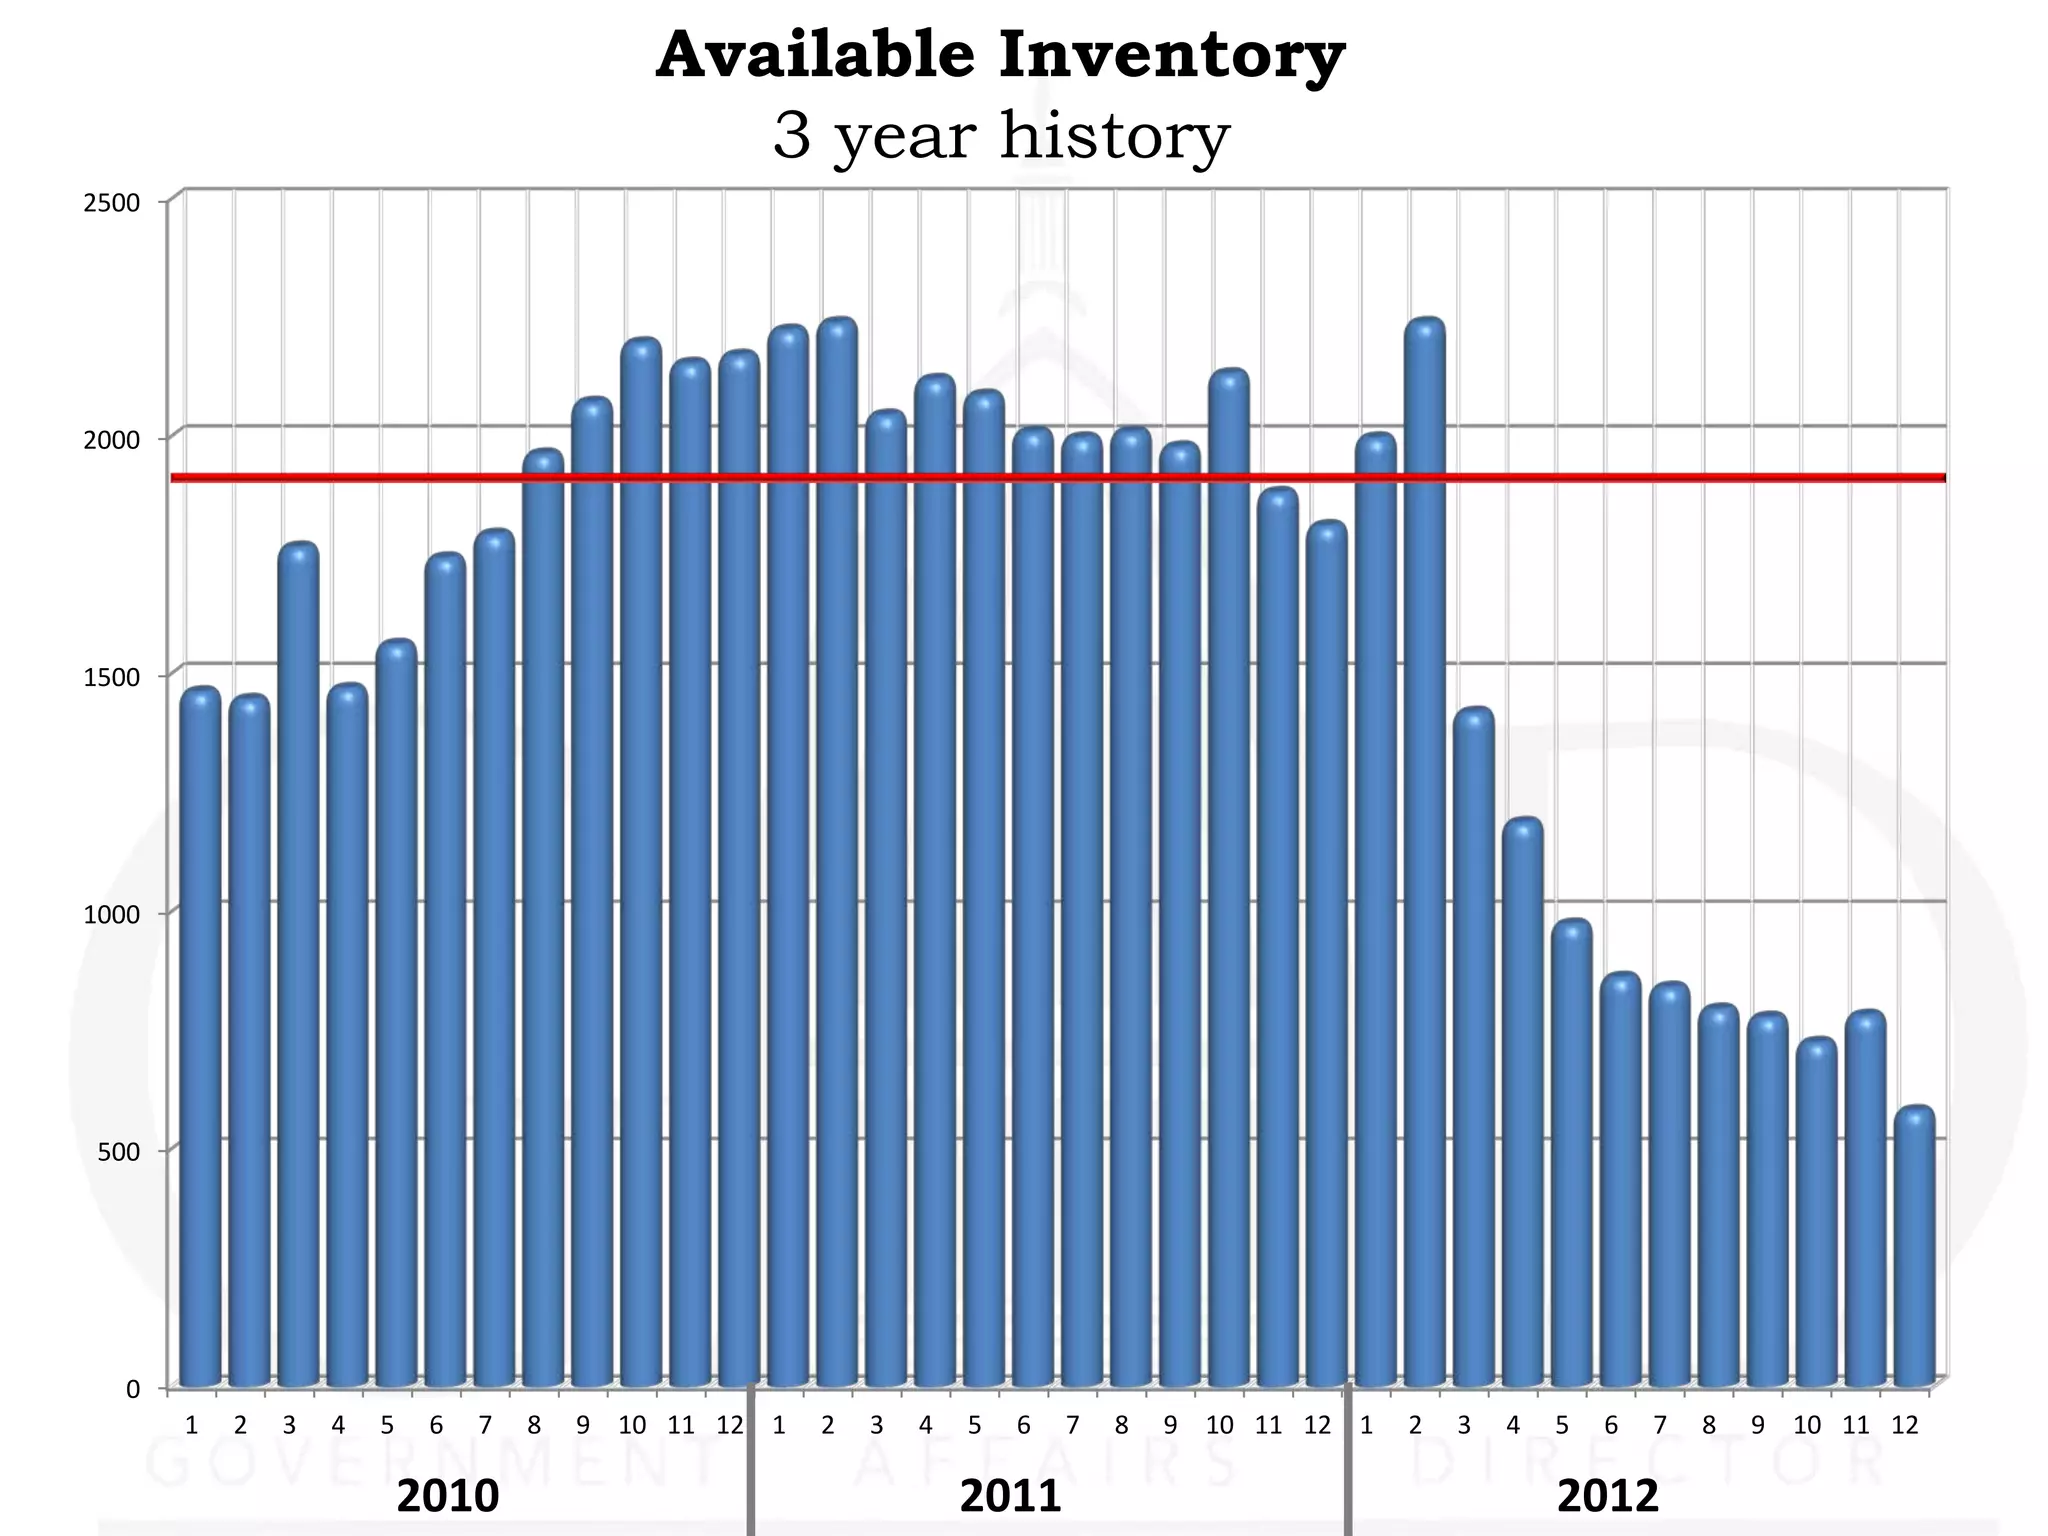
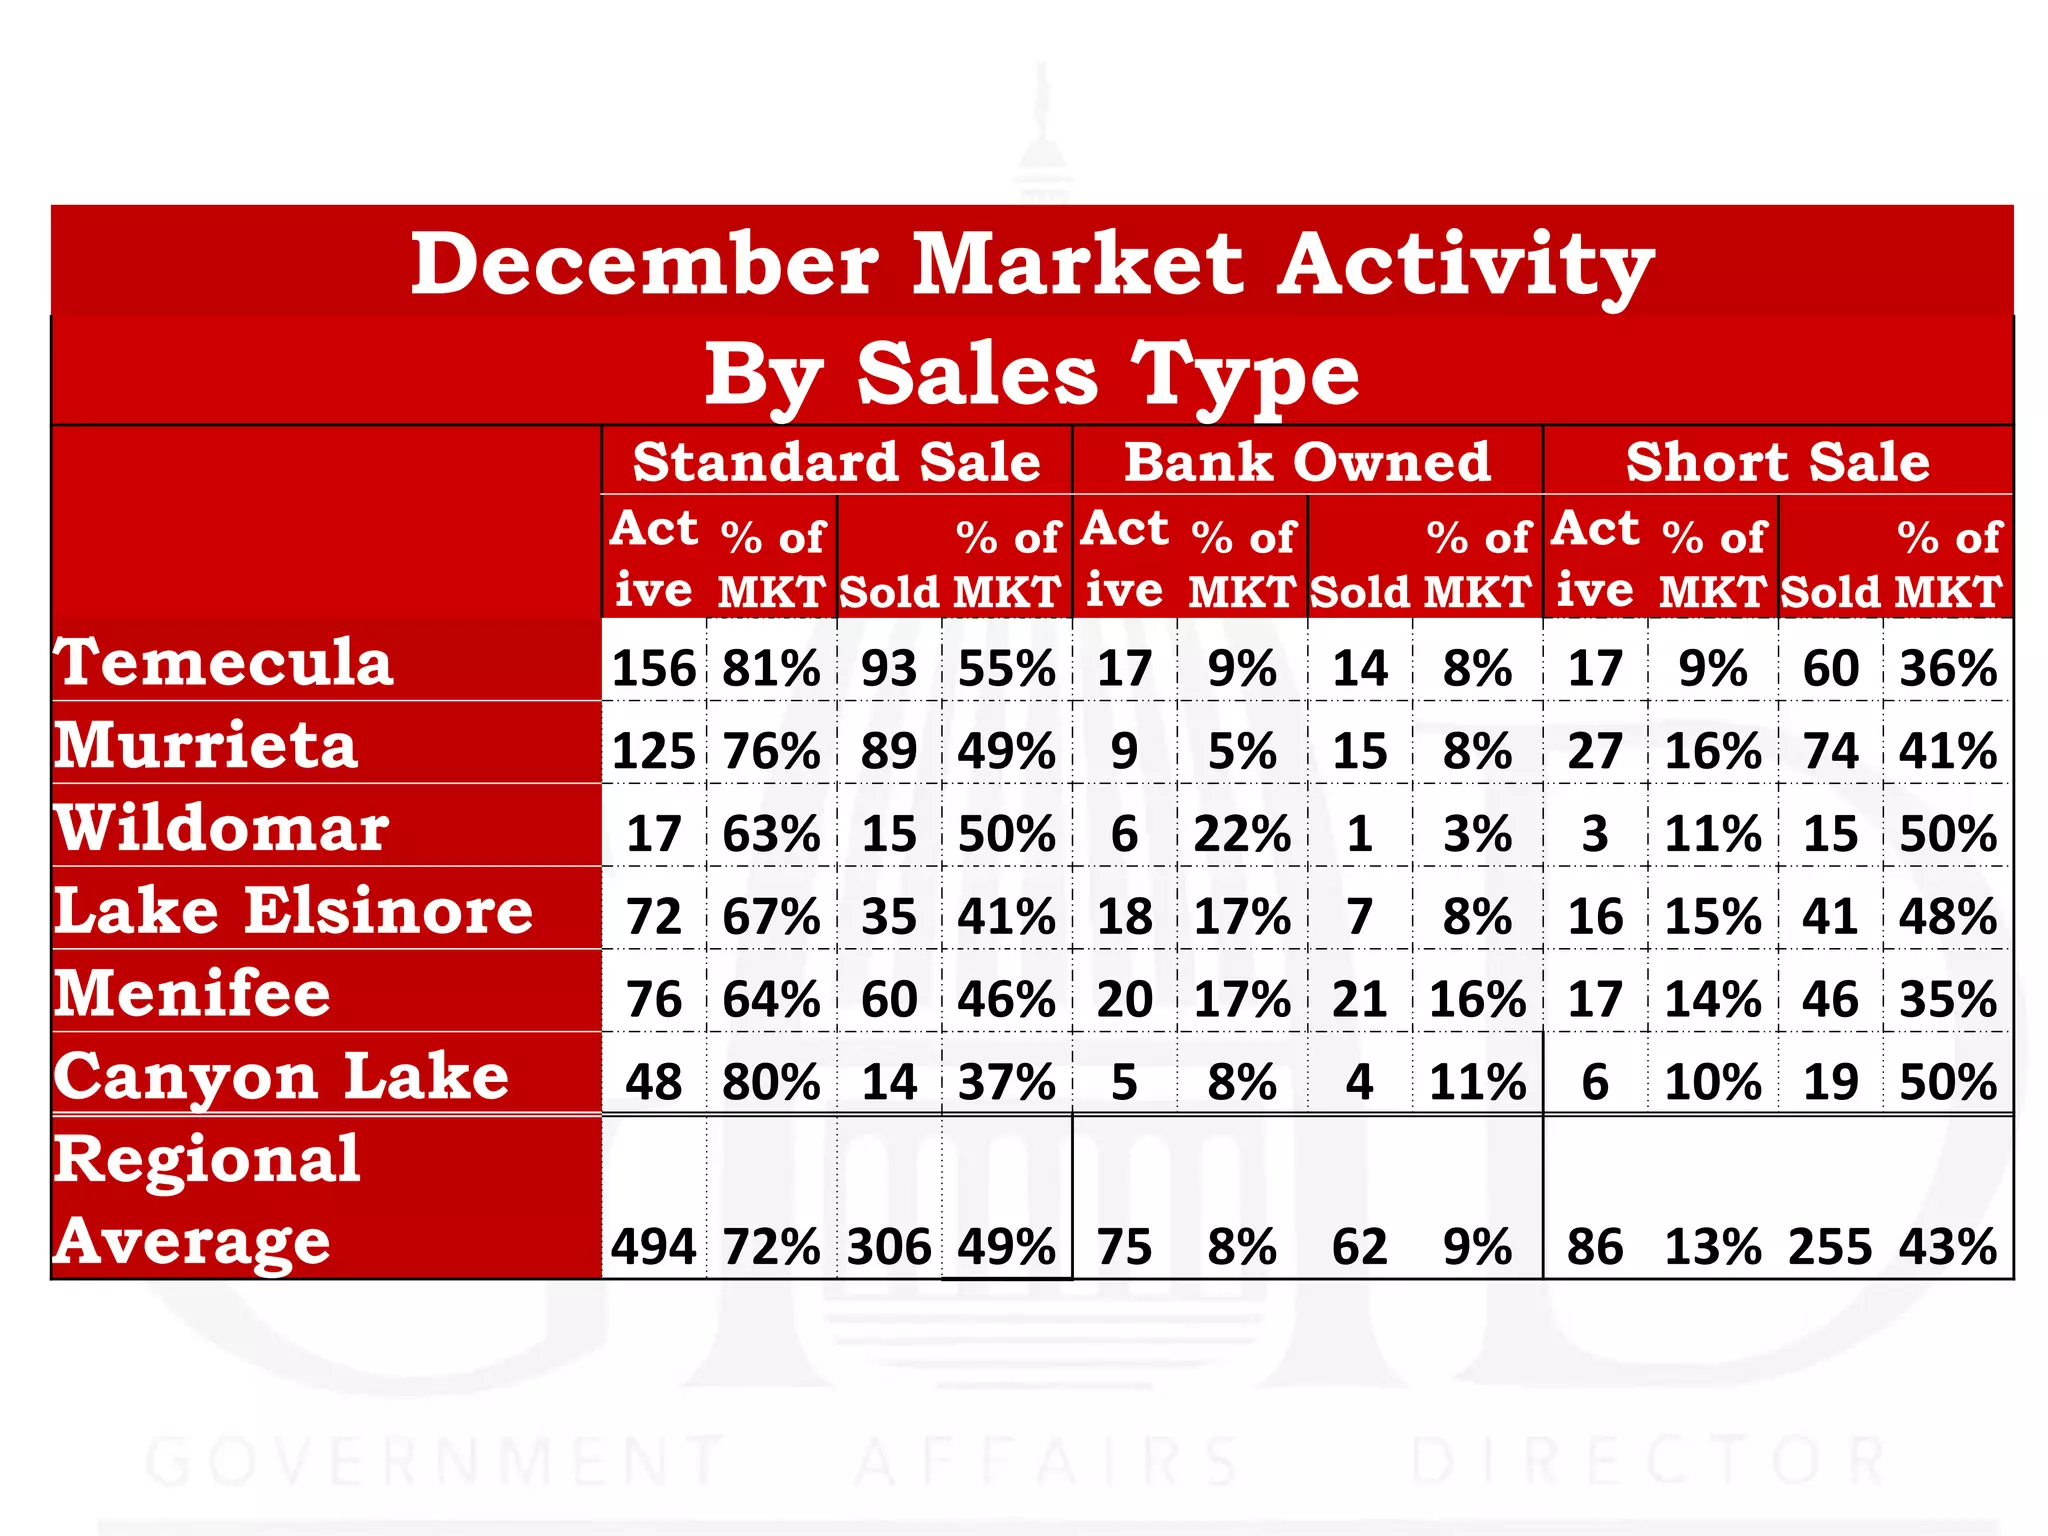
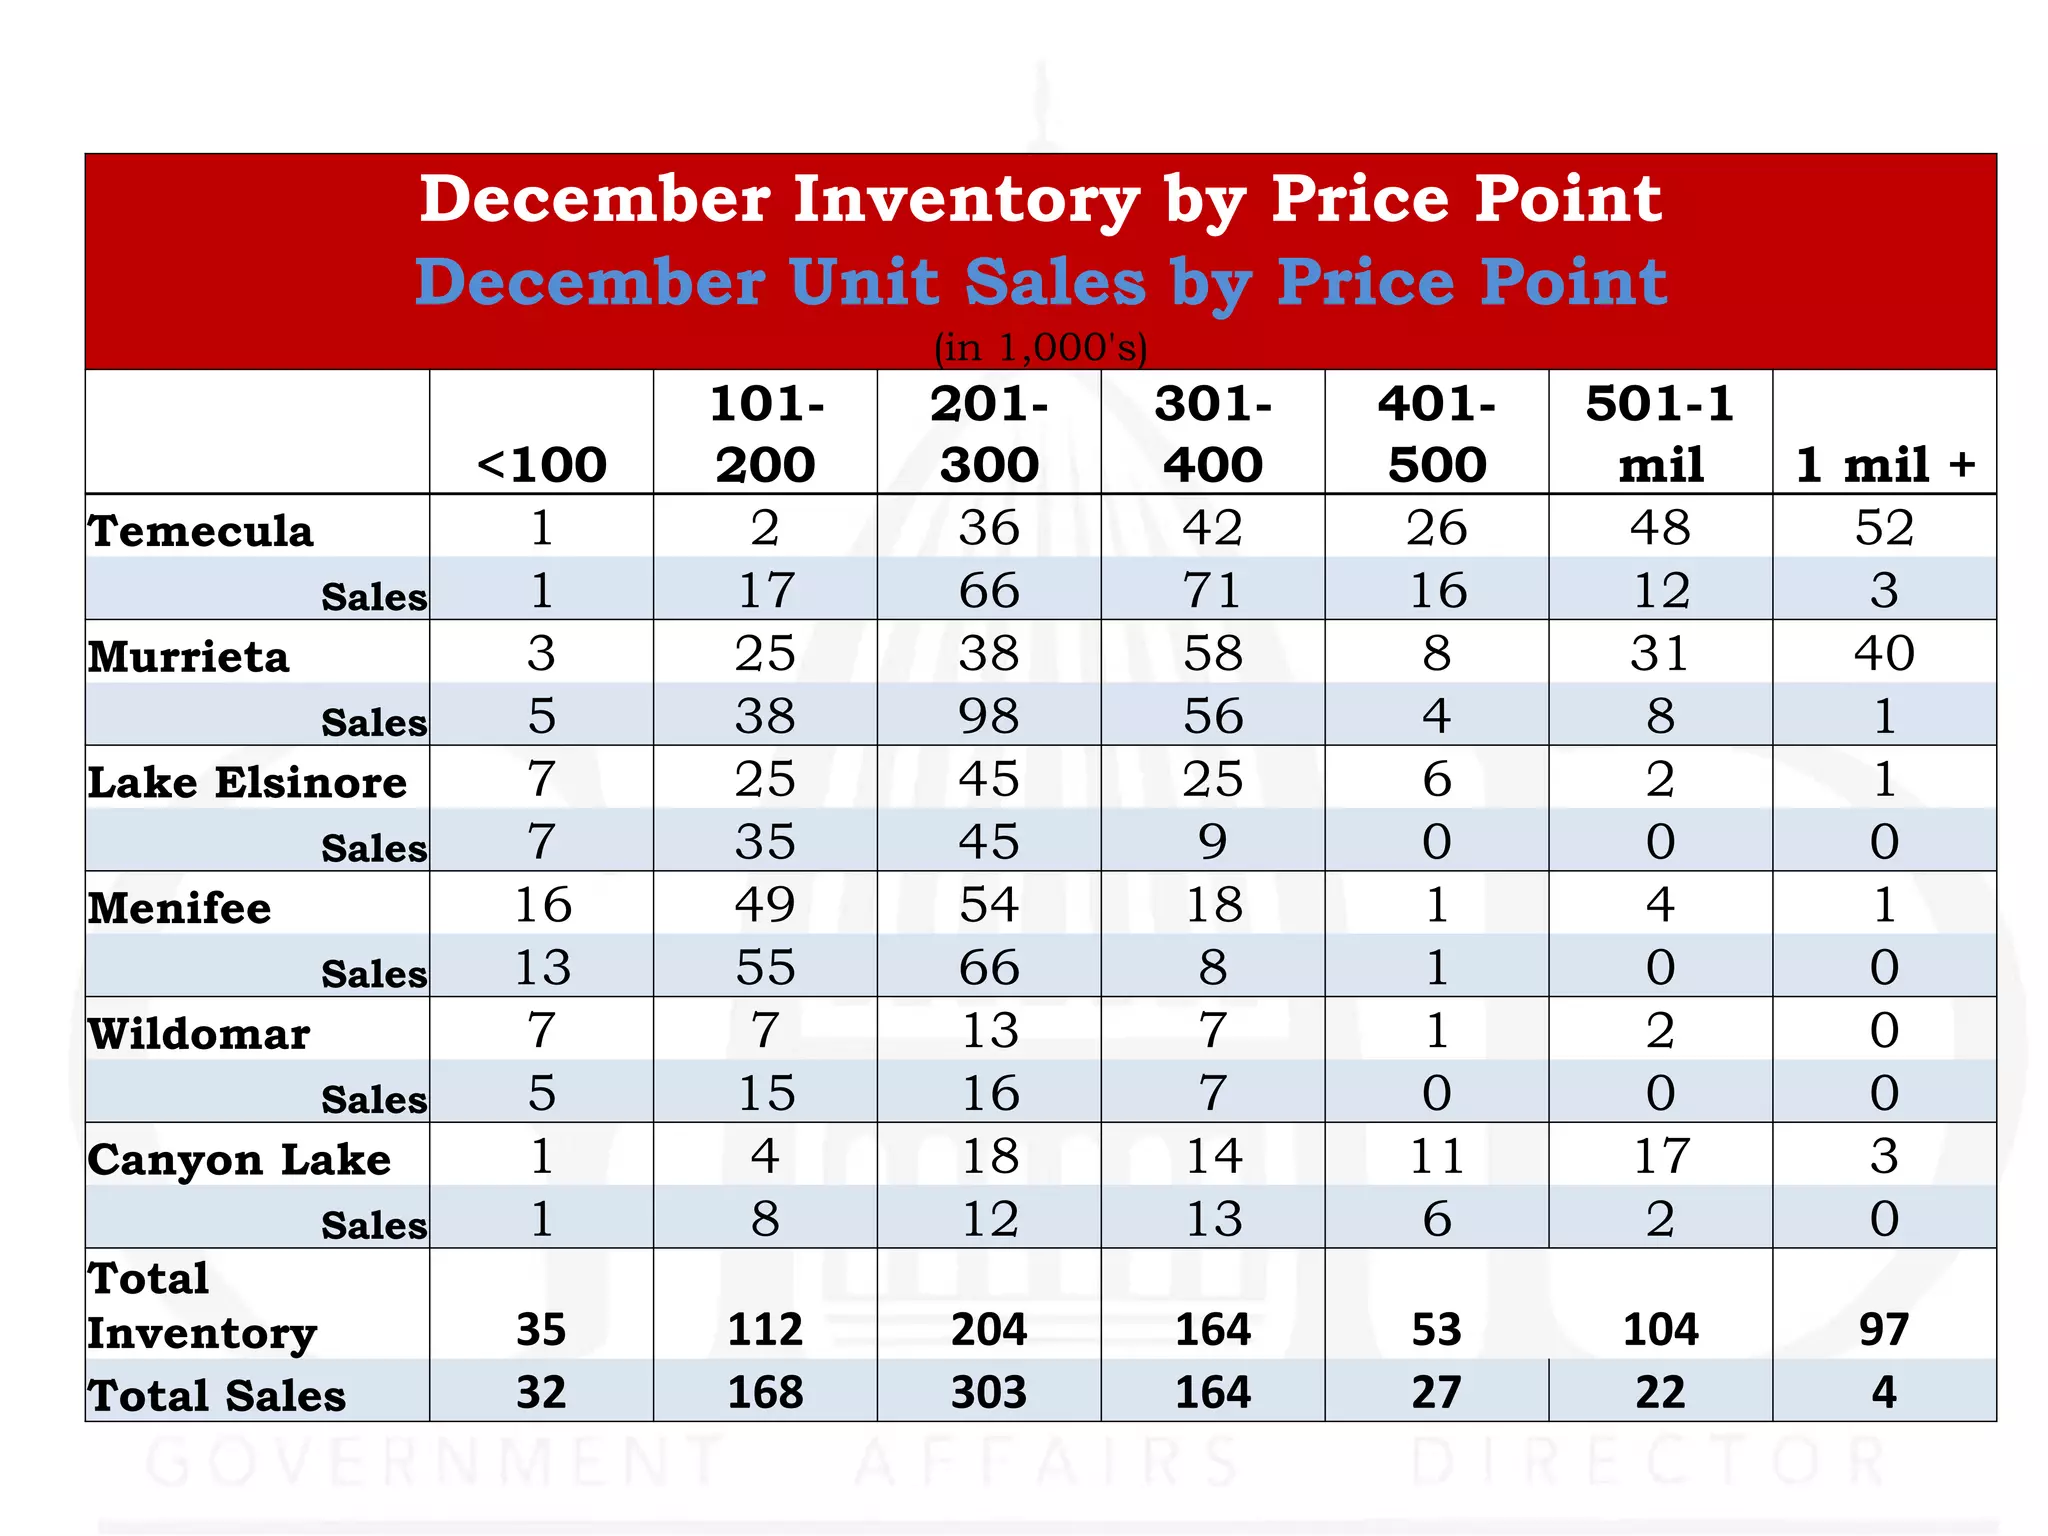

This document contains a summary and analysis of the housing market in Southwest California, including the cities of Temecula, Murrieta, Lake Elsinore, Menifee, Wildomar, and Canyon Lake. It provides data on home sales, prices, inventory levels, and market activity from 2010 to 2012. Key findings include declining home prices from 2008 to 2012, with median prices falling over 50% in some areas, as well as an increase in the percentage of short sales and bank-owned homes being sold in December 2012. Available housing inventory levels rose from 2010 to 2012 across the region.


