
More Related Content
What's hot
What's hot (20)
Viewers also liked
Viewers also liked (18)
Similar to Alinta Ltd (AAN) -Scheme Proposal recommendation
Similar to Alinta Ltd (AAN) -Scheme Proposal recommendation (20)
Alinta Ltd (AAN) -Scheme Proposal recommendation
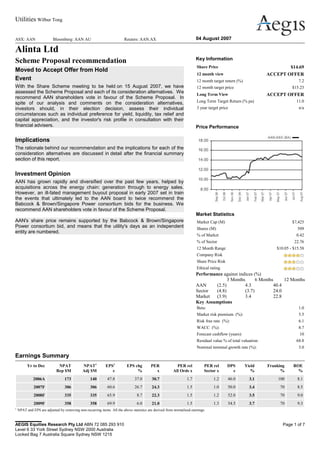
- 1. Utilities Wilbur Tong ASX: AAN Bloomberg: AAN AU Reuters: AAN.AX 04 August 2007 Alinta Ltd Scheme Proposal recommendation Moved to Accept Offer from Hold Event With the Share Scheme meeting to be held on 15 August 2007, we have assessed the Scheme Proposal and each of its consideration alternatives. We recommend AAN shareholders vote in favour of the Scheme Proposal. In spite of our analysis and comments on the consideration alternatives, investors should, in their election decision, assess their individual circumstances such as individual preference for yield, liquidity, tax relief and capital appreciation, and the investor's risk profile in consultation with their financial advisers. Implications The rationale behind our recommendation and the implications for each of the consideration alternatives are discussed in detail after the financial summary section of this report. Investment Opinion AAN has grown rapidly and diversified over the past few years, helped by acquisitions across the energy chain: generation through to energy sales. However, an ill-fated management buyout proposal in early 2007 set in train the events that ultimately led to the AAN board to twice recommend the Babcock & Brown/Singapore Power consortium bids for the business. We recommend AAN shareholders vote in favour of the Scheme Proposal. AAN's share price remains supported by the Babcock & Brown/Singapore Power consortium bid, and means that the utility's days as an independent entity are numbered. Key Information Share Price $14.69 12 month view ACCEPT OFFER 12 month target return (%) 7.2 12 month target price $15.23 Long Term View ACCEPT OFFER Long Term Target Return (% pa) 11.0 3 year target price n/a Price Performance Market Statistics Market Cap (M) $7,425 Shares (M) 509 % of Market 0.42 % of Sector 22.76 12 Month Range $10.05 - $15.58 Company Risk Share Price Risk Ethical rating Performance against indices (%) 3 Months 6 Months 12 Months AAN (2.5) 4.3 40.4 Sector (4.8) (3.7) 24.0 Market (3.9) 3.4 22.8 Key Assumptions Beta: 1.0 Market risk premium (%): 5.5 Risk free rate (%): 6.1 WACC (%): 8.7 Forecast cashflow (years): 10 Residual value % of total valuation: 68.8 Nominal terminal growth rate (%): 3.0 Earnings Summary Yr to Dec NPAT Rep $M NPAT1 Adj $M EPS1 c EPS chg % PER x PER rel All Ords x PER rel Sector x DPS c Yield % Franking % ROE % 2006A 173 140 47.8 37.0 30.7 1.7 1.2 46.0 3.1 100 8.1 2007F 306 306 60.6 26.7 24.3 1.5 1.0 50.0 3.4 70 8.5 2008F 335 335 65.9 8.7 22.3 1.5 1.2 52.0 3.5 70 9.0 2009F 358 358 69.9 6.0 21.0 1.5 1.3 54.5 3.7 70 9.3 1 NPAT and EPS are adjusted by removing non-recurring items. All the above statistics are derived from normalised earnings. AEGIS Equities Research Pty Ltd ABN 72 085 293 910 Level 6 33 York Street Sydney NSW 2000 Australia Locked Bag 7 Australia Square Sydney NSW 1215 Page 1 of 7
- 2. Phone +61 2 8296 1100 Fax +61 2 9299 3777 Email mail@aegis.com.au Web www.aegis.com.au Alinta Ltd 12M Recommendation1 : ACCEPT OFFER 12M Target: $15.23 Long Term Recommendation 2 : ACCEPT OFFER Long Term Target Return: 11.0% pa Year end Dec. All figures in A$M Profit & loss summary 2006A 2007F 2008F 2009F Operating revenue 1,507 2,114 2,399 2,630 Invest & other income 9 11 16 17 EBITDA 337 545 621 695 Depreciation/Amort (60) (116) (125) (131) EBIT 277 429 496 564 Net Interest (161) (95) (80) (100) Pre-tax profit 116 334 416 464 Tax expense 2 (50) (104) (130) Minorities/Assoc./Prefs 21 23 24 25 NPAT 140 306 335 358 Non recurring items 33 0 0 0 Reported profit 173 306 335 358 NPAT add Goodwill & Pref 0 0 0 0 Adjusted profit 140 306 335 358 Cashflow summary 2006A 2007F 2008F 2009F EBITDA 337 545 621 695 Working capital changes 40 (54) (29) (23) Interest and tax (339) (118) (155) (216) Other operating items 268 108 87 75 Operating cashflow 306 481 524 531 Required capex (386) (394) (374) (355) Maintainable cashflow (80) 88 149 175 Dividends (145) (237) (254) (266) Acq/Disp (839) (40) 0 0 Other investing items (25) 0 0 0 Free cashflow (1,089) (190) (104) (90) Equity 10 47 51 53 Debt inc/(red'n) 853 142 54 37 Balance sheet 2006A 2007F 2008F 2009F Cash & deposits 400 40 40 10 Inventories 10 31 35 39 Trade debtors 612 742 839 919 Other curr assets 638 638 638 638 Total current assets 1,659 1,451 1,552 1,605 Prop., plant & equip. 6,070 6,387 6,636 6,860 Non-curr intangibles 2,369 2,369 2,369 2,369 Non-curr investments 637 639 642 644 Other non-curr assets 266 266 266 266 Total assets 11,001 11,111 11,464 11,743 Trade creditors 458 556 629 688 Curr borrowings 1,161 1,161 1,161 1,161 Other curr liabilities 224 284 337 371 Total current liab. 1,844 2,001 2,127 2,221 Borrowings 5,100 4,882 4,936 4,943 Other non-curr liabilities 270 326 369 404 Total liabilities 7,213 7,209 7,432 7,567 Minorities/Convertibles 251 249 247 245 Shareholders equity 3,788 3,902 4,032 4,176 Ratio analysis 2006A 2007F 2008F 2009F Revenue growth (%) 7.2 40.3 13.5 9.6 EBITDA growth (%) 52.8 61.7 13.9 11.9 EPS growth (%) 37.0 26.7 8.7 6.0 EBITDA/Sales margin (%) 22.4 25.8 25.9 26.4 EBIT/Sales margin (%) 18.4 20.3 20.7 21.4 Tax rate (%) (1.9) 15.0 25.0 28.0 Net debt/equity (%) 165.8 164.4 160.0 155.0 Net debt/net debt + equity (%) 62.4 62.2 61.5 60.8 Net interest cover (x) 1.7 4.5 6.2 5.6 Payout ratio (%) 96.3 82.5 78.9 78.0 Capex to deprec'n (%) 647.2 338.1 299.3 270.7 NTA per share ($) 2.37 2.58 2.83 3.10 ROA (%) 5.3 3.9 4.4 4.9 ROE (%) 8.1 8.5 9.0 9.3 Multiple analysis 2006A 2007F 2008F 2009F Market cap (M) 7,425 Net debt ($M) 5,861 Peripheral assets ($M) 5,100 Enterprise value ($M) 8,186 EV/EBIT (x) 29.5 19.1 16.5 14.5 EV/EBITDA (x) 24.3 15.0 13.2 11.8 EV/EBITDA All Ind (x) 9.4 8.3 7.5 6.9 EV/EBITDA rel All Ind (x) 2.6 1.8 1.8 1.7 P/E (x) 30.7 24.3 22.3 21.0 P/E rel All Ind (x) 1.5 1.4 1.4 1.5 P/E rel All Ind ex banks (x) 1.4 1.3 1.4 1.5 P/E sector (x) 25.5 24.4 18.4 16.5 P/E rel sector (x) 1.2 1.0 1.2 1.3 Assumptions 2006A 2007F 2008F 2009F GDP growth (%) 2.66 2.63 3.47 3.49 Interest Rates (%) 6.05 6.41 6.30 6.30 Inflation (%) 3.54 2.51 2.50 2.50 Notes To AccountsOur initial projections of the new AAN were premised on AAN management going ahead with its proposed restructure. However, with the AAN board recommending shareholders accept a Babcock & Brown/Singapore Power bid for the company, this analysis is looking increasingly academic. Notes: 1. The 12M recommendation rates stocks on a 12 month, absolute basis based on the total return (capital and dividends). BUY denotes an expectation of 15% or more total return; SELL 5% or less; HOLD within the range of 5-15%. ACCEPT OFFER relates to a situation where there is a public offer for shares and our view is to accept that offer.
- 3. 2. The Long Term Recommendation rates stocks on a long term, absolute basis based on the average total return per annum (capital and dividends). BUY denotes a long term expectation of 1% or more above the cost of equity (also known as the required return, which measures the the return required by investors given the company's risk); HOLD within the range of 1% above and 3% below the cost of equity; SELL more than 3% below the cost of equity but above a total forecast annual return for the stock of 0%; AVOID denotes a long term expectation of a total annual return below 0%. ACCEPT OFFER relates to a situation where there is a public offer for shares and our view is to accept that offer. Copyright © 2000 - 2007 Aegis Equities Holdings Pty Limited. All rights reserved. This information must be read in conjunction with the Legal Notice which can be located at http://www.aegis.com.au/public/disclaimer.aspx. Page 2 of 7 Alinta Ltd Recommendation We recommend AAN shareholders vote in favour of the Scheme Proposal, based on the following: the Scheme Proposal values AAN shares at a significant premium to the trading prices of AAN shares prior to the MBO Proposal announcement. The value ($15.91) based on five business day VWAPs to 27 June 2007, represents a 47% premium over the 30 business day VWAP ($10.79) prior to the announcement of the potential MBO Proposal on 9 January 2007. If the Scheme Proposal is not approved and no alternative proposal emerges, AAN's share price is likely to fall. the value of the consideration is attractive relative to most other recent energy infrastructure transactions at a 15.2x Price/EBITA multiple. AAN shareholders who wish to retain ongoing exposure to certain AAN assets and the energy infrastructure sector have the opportunity to do so by electing an alternative that includes receiving B&B Fund Securities. Shareholders have the option to choose amongst consideration alternatives to maximise different component of the Share Scheme Consideration based on their individual circumstances such as individual preference for yield, liquidity, tax relief and capital appreciation, and the investor's risk profile. While there are risks that may result from the implementation of the Scheme Proposal (including integration risks), we believe the advantages outweigh these risks, and the management expertise of B&B is capable of successfully integrating the AAN assets into their funds. FIGURE 1: KEY DATES TIMETABLE Source: Alinta Scheme Booklet
- 4. Copyright © 2000 - 2007 Aegis Equities Holdings Pty Limited. All rights reserved. This information must be read in conjunction with the Legal Notice which can be located at http://www.aegis.com.au/public/disclaimer.aspx. Page 3 of 7 Alinta Ltd The Share Scheme will become effective once: the Share Scheme is approved by the AAN shareholders and the Court; the capital reduction is approved by the AAN shareholders; and a copy of the Court Order approving the Share Scheme is lodged with ASIC. If the Scheme Proposal is implemented, the share scheme consideration and the APA distribution and the option scheme consideration will be distributed on the implementation date, 31 August 2007. If the Scheme Proposal does not proceed, the bidder will not acquire AAN. Shareholders will retain their AAN shares and optionholders will retain their AAN options. The capital reduction will not proceed. Transaction costs and a break fee of over $59.25M will be payable by AAN in connection with the Scheme Proposal. Consideration Alternatives The Consideration Alternatives are: 1. Default Consideration 2. Maximum Preference Shares Consideration 3. Maximum Cash Consideration 4. Maximum Securities Consideration 5. Cash Out Alternative (for Small Alinta Shareholders only) As the value of the Consideration Alternatives will be equal as at the record date, 23 August 2007, we are indifferent to the five alternatives from a current valuation perspective. However, our view on the attractiveness of certain underlying investment options differs based on differing expectations of future values. Shareholders should choose amongst alternatives in their election decisions based on their individual circumstances including factors such as individual preference for yield, liquidity, tax relief and capital appreciation, and the investor's risk profile. 1. Default consideration TABLE 1: DEFAULT CONSIDERATION Ratio per AAN share Value/share % of Consideration Cash $8.948 $8.95 58% BBI Securities $0.752 $1.23 8% BBP Securities $0.669 $2.03 13% BBW Securities $0.260 $0.48 3% BBI EPS $1.599 $1.60 10% APA Securities $0.301 $1.26 8% Total Value $15.54 100% Franking Credit 0.4 $0.40 Total Value $15.94 Based on Current Market Price Source: Aegis Equities Under the default consideration, AAN shareholders will maintain a reduced ongoing exposure to the energy infrastructure sector and access the management expertise of B&B. We hold a positive view on the post-acquisition outlook on the aggregate return in a 12- month horizon for all of BBI, BBP and BBW if the scheme is approved based on the current market price. Investors who wish to maximise the ongoing exposure to certain AAN assets and the energy infrastructure sector can elect for the Maximum Securities Consideration. However, in this option the majority of the consideration will result in a CGT event in AAN Shares and will not receive CGT rollover relief on the APA securities or the B&B fund securities allocations. Investors who wish to maximise the availability of CGT rollover relief can elect for the Maximum Preference Shares Alternative, however, we do not regard BBI EPS as offering a sufficient yield to compensate investors on a risk-adjusted basis. Copyright © 2000 - 2007 Aegis Equities Holdings Pty Limited. All rights reserved. This information must be read in conjunction with the Legal Notice which can be located at http://www.aegis.com.au/public/disclaimer.aspx. Page 4 of 7
- 5. Alinta Ltd TABLE 2: PRO FORMA FORECAST CASH INCOME DISTRIBUTION Year ending Year ending Pro forma distribution per security (cents) for members of: 30-Jun-07 30-Jun-08 - BBI 14.25 15 - BBI EPS - 7.57 - BBP 14 26.1 - BBW 12.5 14 - APT 28 29.3 Equivalent pro forma forecast distribution per Alinta share (cents) - 0.752 * BBI 11.280 - 1.599 * BBI EPS 12.104 - 0.669 * BBP 17.461 - 0.26 * BBW 3.640 - 0.301 * APT 8.819 Total pro forma forecast securities distribution (cents) 53.305 $8.948 cash at 6.25% 55.925 Total pro forma forecast cash income distribution (cents) 109.230 Source: Aegis Equities FIGURE 2: FORECAST CONSIDERATION DISTRIBUTION YIELDS Source: Alinta Scheme Booklet AAN shareholders will expect to receive a higher aggregate future income distribution relative to Alinta’s historic dividends. With an assumed return of 6.25% on the cash component ($8.948 per Alinta Share) and the B&B securities forecast distributions, the total equivalent FY08 forecast distribution per AAN share will be 109.229 cents (Refer to Table 2 above). Prior to the post- acquisition proposed internal restructure, Alinta’s 50 cps fully franked FY07 dividend forecast (for the 12 months ending 31 December 2007) would only be equal to a fully franked yield of 4.6% based on the 30 business day VWAP of Alinta Shares prior to the MBO Proposal announcement. The distribution of the APA Securities is an in-specie distribution and is in addition to (and not part of) the Share Scheme Consideration to be provided to AAN shareholders. The APA Distribution is a dividend (expected to be $0.93 per share) and capital return. The dividend component of the APA distribution is expected to be fully franked, meaning that AAN shareholders will also receive $0.40 per AAN share of franking credits for those who can fully utilise them. However, we hold a negative view on APA because we regard APA’s acquisitions last year have created little value for its unitholders. We are concerned with the APA’s tendency to regularly look for market support for sub-economic deals. Copyright © 2000 - 2007 Aegis Equities Holdings Pty Limited. All rights reserved. This information must be read in conjunction with the Legal Notice which can be located at http://www.aegis.com.au/public/disclaimer.aspx. Page 5 of 7
- 6. Alinta Ltd 2. Maximum Preference Shares Consideration In this option, shareholders will receive a larger portion of the share scheme consideration in BBI EPS. BBI EPS are new exchangeable preference shares which will trade on the ASX. BBI EPS are expected to provide CGT rollover relief for the portion of AAN shares for which shareholders receive BBI EPS until they are sold, redeemed or converted into BBI stapled securities. However, BBI EPS are a fixed income security and will not participate in any increases or decreases in the price of BBI stapled securities, which may or may not suit individual shareholders’ investment objectives BBI EPS are valued at their issue price of $1.00. Distributions on BBI EPS will be based on the 90 day bank bill swap rate at the commencement of each quarter (being 1 July, 1 October, 1 January, 1 April) plus an initial 1.15% margin, which as at 27 June 2007 would have equated to a total rate of 7.57%. These distributions will be unfranked. BBI EPS includes a 3.75% cash redemption discount which, when combined with the 1.15% margin, provides an effective margin equivalent of 1.81%. BBI EPS have a 60-year final maturity but have terms that will be reset periodically, the first reset date being 1 July 2012. CGT rollover relief is expected to apply to the extent that consideration is taken as BBI EPS. Notwithstanding the potential attraction to some investors of obtaining CGT rollover relief, we believe BBI EPS' yield to maturity inadequately compensates investors on a risk-adjusted basis. 3. Maximum Cash Consideration Shareholders will receive a larger portion of the Share Scheme Consideration in cash in this option. Shareholders who prefer cash certainty can crystallise the capital appreciation in AAN shares under this consideration. The exact mix of cash and securities will depend on the collective outcome of the election of the AAN shareholders. Therefore, AAN shareholders may not receive the maximum allocation of their preferred form of consideration. If AAN shareholders who elect this consideration have any parcel worth less than $500 (an unmarketable parcel) of B&B Fund Securities, BBI EPS or APA and wish to cash out, we encourage shareholders to take advantage of the offer to have the unmarketable parcel sold on their behalf. FIGURE 3: MAXIMUM CASH CONSIDERATION Source: Alinta Scheme Booklet Copyright © 2000 - 2007 Aegis Equities Holdings Pty Limited. All rights reserved. This information must be read in conjunction with the Legal Notice which can be located at http://www.aegis.com.au/public/disclaimer.aspx. Page 6 of 7
- 7. Alinta Ltd 4. Maximum Securities Consideration Shareholders will receive a larger portion of the Share Scheme consideration in B&B Fund Securities. Investors who wish to maximise the ongoing exposure to certain AAN assets and the energy infrastructure sector can elect for the Maximum Securities Consideration. For those who would like to maximise B&B Fund Securities in the consideration, note that we hold either neutral or positive views, on both 12 month and three year investment horizons, on the post-acquisition outlook for all of BBI, BBP and BBW based on the current market price if the scheme is approved. The BBI Alinta assets will increase the geographic diversity of the BBI portfolio and expand BBI business into the growing Western Australian energy infrastructure market. It will enhance the natural gas infrastructure operational capability within the BBI portfolio. In particular, it can leverage existing Powerco and WestNet Rail operations and management structures and expertise in Australia; and consolidate BBI’s strategic position in the developing Tasmanian natural gas market. We believe the BBP Alinta Assets will enhance BBP’s diversity of assets by adding further gas-fired power stations and cogeneration plants. BBP and AAN currently have large gas-fired generating portfolios and combining them will significantly increase the scale of BBP and the geographic coverage of BBP’s portfolio. The AlintaAGL business provides the potential to acquire a significant retail position in the Western Australian market. This retail exposure can underpin the development of new generation capacity in Western Australia. As for BBW, it will receive $211 million of the sale proceeds in consideration for the issue of 130.1 million BBW stapled securities and net payment of $9.5 million in cash. The Scheme Proposal would partially fund the proposed acquisition of the Enersis Wind Farm and the US07 Class B Interest, and this would provide BBW with exposure to further diversification across wind resource, turbine suppliers and regulatory regime. FIGURE 4: MAXIMUM SECURITIES CONSIDERATION Source: Alinta Scheme Booklet 5. The Cash Out Alternative for an Alinta Shareholder (with 1,000 shares or less) Under this consideration option, shareholders will receive the Default Consideration and the consideration securities will be sold on the shareholders’ behalf. Shareholders will receive all of the share scheme consideration and the APA Distribution in cash, and will crystallise the capital appreciation in AAN Shares without paying brokerage. Shareholders who do not want to hold multiple small parcels of different securities may wish to elect this option. It is worth noting that the total cash received will depend on the prices at which the consideration securities can be sold. Shareholders will expect to receive the cash consideration within one month of the implementation date. Copyright © 2000 - 2007 Aegis Equities Holdings Pty Limited. All rights reserved. This information must be read in conjunction with the Legal Notice which can be located at http://www.aegis.com.au/public/disclaimer.aspx. Page 7 of 7