SFW - FOFA implications, Sum of parts valuation, possible acquirers
•
1 like•185 views

This research note analyses potential acquirer of the SFW business, and looks at Future of Financial Advice (FOFA) reforms and values SFW on a sum of the parts basis (a relevant valuation methodology for any business with multiple business segments).

Recommended
Recommended
More Related Content
What's hot
What's hot (18)
Similar to SFW - FOFA implications, Sum of parts valuation, possible acquirers
Similar to SFW - FOFA implications, Sum of parts valuation, possible acquirers (20)
More from George Gabriel
More from George Gabriel (20)
Recently uploaded
Recently uploaded (8)
SFW - FOFA implications, Sum of parts valuation, possible acquirers
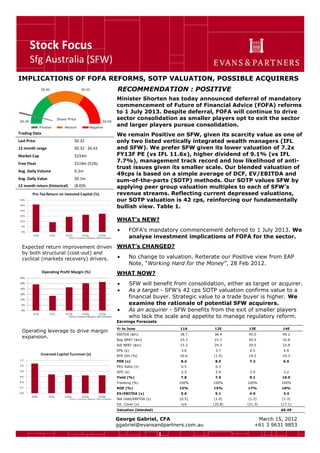
- 1. Stock Focus Sfg Australia (SFW) 1 IMPLICATIONS OF FOFA REFORMS, SOTP VALUATION, POSSIBLE ACQUIRERS RECOMMENDATION : POSITIVE Minister Shorten has today announced deferral of mandatory commencement of Future of Financial Advice (FOFA) reforms to 1 July 2013. Despite deferral, FOFA will continue to drive sector consolidation as smaller players opt to exit the sector and larger players pursue consolidation. We remain Positive on SFW, given its scarcity value as one of only two listed vertically integrated wealth managers (IFL and SFW). We prefer SFW given its lower valuation of 7.2x FY13F PE (vs IFL 11.6x), higher dividend of 9.1% (vs IFL 7.7%), management track record and low likelihood of anti- trust issues given its smaller scale. Our blended valuation of 49cps is based on a simple average of DCF, EV/EBITDA and sum-of-the-parts (SOTP) methods. Our SOTP values SFW by applying peer group valuation multiples to each of SFW’s revenue streams. Reflecting current depressed valuations, our SOTP valuation is 42 cps, reinforcing our fundamentally bullish view. Table 1. WHAT’s NEW? FOFA’s mandatory commencement deferred to 1 July 2013. We analyse investment implications of FOFA for the sector. WHAT’s CHANGED? No change to valuation. Reiterate our Positive view from EAP Note, “Working Hard for the Money”, 28 Feb 2012. WHAT NOW? SFW will benefit from consolidation, either as target or acquirer. As a target - SFW’s 42 cps SOTP valuation confirms value to a financial buyer. Strategic value to a trade buyer is higher. We examine the rationale of potential SFW acquirers. As an acquirer - SFW benefits from the exit of smaller players who lack the scale and appetite to manage regulatory reform. Trading Data Last Price $0.32 12 month range $0.32 - $0.43 Market Cap $233m Free Float $119m (51%) Avg. Daily Volume 0.2m Avg. Daily Value $0.1m 12 month return (historical) (8.0)% Expected return improvement driven by both structural (cost-out) and cyclical (markets recovery) drivers. Operating leverage to drive margin expansion. Earnings Forecasts Yr to June 11A 12E 13E 14E EBITDA ($m) 38.7 38.4 45.0 49.2 Rep NPAT ($m) 23.3 23.7 29.5 32.8 Adj NPAT ($m) 23.3 24.3 29.5 32.8 EPS (¢) 3.8 3.7 4.5 4.9 EPS Gth (%) 20.6 (1.5) 19.2 10.3 PER (x) 8.4 8.5 7.2 6.5 PEG Ratio (x) 0.5 0.3 DPS (¢) 2.5 2.4 2.9 3.2 Yield (%) 7.8 7.5 9.1 10.0 Franking (%) 100% 100% 100% 100% ROE (%) 15% 15% 17% 18% EV/EBITDA (x) 5.6 5.1 4.0 3.4 Net Debt/EBITDA (x) (0.5) (1.0) (1.2) (1.3) Int. Cover (x) n/a (35.8) (21.3) (17.1) Valuation (blended) $0.49 George Gabriel, CFA ggabriel@evansandpartners.com.au March 15, 2012 +61 3 9631 9853
- 2. 2 IMPLICATIONS OF Future of Financial Advice (FOFA) reforms 1. Public policy rationale According to Minister Shorten, the public policy rationale of the FOFA reforms is to “restore trust in the system”, expand the availability of advice and reduce conflicts of interest between financial advisers and their clients. "The FOFA reforms are about making sure more Australians can access affordable and better quality financial advice, free from the conflicts of interest created by commissions and other product payments. These reforms will drive greater competition and innovation and are a long term growth strategy for this important industry," said Minister Shorten. 2. Key FOFA reforms include: (i) A ban on commissions/volume payments to financial advisers from platforms and funds managers. (ii) A requirement for advisers to obtain client agreement to ongoing advice fees every two years and the annual provision of a fees statement. (iii) The expansion of limited advice (eg. insurance sales). 3. Eight investment themes apply to wealth management stocks through to 2013-14: (i) Uncertainty as earnings re-base. (ii) Continued transition to fee-for-service revenue model, creating customer retention risks and a drive for scale. (iii) Product manufacturing and platforms will be key to revenue and margin capture. (iv) Dealer groups to pursue either backward vertical integration (starting/acquiring a platform or managed funds business) or sale to a larger diversified group. (v) Sector consolidation to continue (eg. sale of COU to CBA; sale of DKN to IFL; acquisitions of unlisted wealth management firms). (vi) New growth option for advisers through the introduction of scaled advice. (vii) Insurance sales outside of super funds to benefit. (viii) Major banks will benefit overall given their platform market dominance. 4. Our preferred business models have the following characteristics: (i) Vertically integrated (across product manufacture, platforms and distribution). (ii) Less focus on distribution revenue relative to overall revenue. (iii) An existing fee-for-service revenue model. (iv) A strong balance sheet to facilitate sector consolidation. 5. Investment implications are: (i) Buy stocks with valuation support to protect against the risk of earnings re-basing to the downside. (ii) Buy vertically integrated stocks given they will face less exposure to margin squeeze in vulnerable elements of the value chain (eg. distribution) and are more likely to be acquired.
- 3. 3 VALUATION Our sum-of-the-parts (SOTP) valuation confirms our view that SFW offers upside to a strategic buyer, either to be integrated into a wider business franchise or even possibly as a break-up play for a financial buyer/private equity. Table 1. TABLE 1: SUM-OF-THE-PARTS VALUATION TABLE 2: BLENDED VALUATION Methodology Key Inputs Value ($ps) Discounted Cash Flow 13.5% WACC $0.59 Capitalisation of Earnings 7.5x FY12E EV/EBITDA $0.45 SOTP Valuation Table 1 $0.42 Average $0.49 Source: EAP estimates POSSIBLE ACQUIRERS The following categories of buyer would likely consider SFW as a target: Regional banks (BEN BOQ SUN) who are looking for new growth options given the challenge of a low credit growth environment. Third tier lending institutions (MYS WBB) who lack a broad wealth management offering. Trustee companies (EQT TRU) seeking revenue diversification. Diversified wealth managers (PPT BTT) seeking increased distribution networks, revenue diversification and mitigation of key person risk (ie. star funds management talent). Historically, financial planners linked to large wealth management groups will allocate ~70% of their sales to their group’s own products. Private equity buyers with financial services experience seeking either a break-up play or “buy and build” bolt-on acquisition eg. CHAMP, Ironbridge, Propel etc.. “Back door listing” vehicle for a private wealth management business. A listed merger partner, such as PLB and SFW. We expect that major banks and AMP would struggle to overcome anti-trust issues in acquiring SFW.
- 4. 4 FINANCIAL SUMMARY Sfg Australia SFW As at: 15/03/2012 Recommendation: Positive Share Price $0.32 Year end June 2011A 2012E 2013E 2014E INCOME STATEMENT Sales Revenue $m 127 128 131 138 Consolidated EBITDA $m 39 38 45 49 D&A $m (3) (5) (6) (6) Consolidated EBIT $m 21 33 40 44 Net Interest $m 0 1 2 3 Tax Expense $m 3 (10) (12) (14) Associates/Minorities $m 0 0 0 0 Adj NPAT $m 23 24 29 33 NRIs $m 0 (1) 0 0 Reported NPAT $m 23 24 29 33 Shares on Issue (end period) m 727 727 727 727 EFPOWA m 559 727 727 727 EPS ¢ 3.8 3.7 4.5 4.9 DPS ¢ 2.5 2.4 2.9 3.2 Franking % 100% 100% 100% 100% GROWTH/PROFITABILITY RATIOS Sales Growth % 48.4% 1.1% 1.8% 5.4% EBITDA Growth % 42.4% (0.7)% 17.2% 9.2% EBIT Growth % (16.6)% 60.1% 19.6% 10.3% EPS Growth % 20.6% (1.5)% 19.2% 10.3% EBITDA/Sales % 30.5% 30.0% 34.5% 35.8% EBIT/Sales % 16.3% 25.7% 30.3% 31.7% EBIT Interest Cover x 20,636.0 (35.8) (21.3) (17.1) Tax Rate % (12.7%) 30.0% 30.0% 30.0% ROE % 15.1% 14.8% 17.2% 18.1% ROFE % 25.8% 28.7% 36.6% 41.8% CASH FLOW EBITDA $m 39 38 45 49 Change in Working Capital $m 4 0 0 0 Other $m (18) 0 0 0 Gross Operating Cash Flow $m 24 38 45 49 Net Interest Paid $m 1 1 2 3 Tax Paid $m (8) (4) (11) (12) Net Operating Cash Flow $m 17 35 36 40 Maintenance Capex $m (3) (2) (2) (2) Free Cash Flow $m 14 33 34 37 Dividends Paid $m (13) (15) (18) (22) Expansionary Capex $m 0 0 0 0 Acquisitions $m 9 0 0 (3) Asset Sales $m 0 0 0 0 Dividends Received $m 0 0 0 0 Shares Issues/Buybacks $m (12) 0 0 0 Other $m 1 0 0 0 Increase in Net Cash/(Debt) $m 0 19 16 13 GOCF/EBITDA % 63% 100% 100% 100% Total Capex/Sales % 2.1% 1.9% 1.6% 1.6% Total Capex/Depreciation x 0.9 0.4 0.4 0.4 Year end June 2011A 2012E 2013E 2014E VALUATION METRICS PER x 8.4 8.5 7.2 6.5 P/EG (2YR) x 0.5 0.3 Dividend Yield % 7.8% 7.5% 9.1% 10.0% EV/EBITDA x 5.6 5.1 4.0 3.4 EV/EBIT x 10.4 5.9 4.6 3.8 P/FCF x 16.2 7.1 6.9 6.2 P/BV x 1.5 1.4 1.4 1.3 BALANCE SHEET Assets Cash $m 33 52 68 80 Working Capital $m 15 16 16 17 PP&E $m 6 7 8 12 Intangibles $m 144 140 136 132 Investments $m 6 6 6 7 Other $m 7 6 4 3 Total Assets $m 211 226 238 250 Liabilities Debt $m 15 15 15 15 Working Capital $m 25 34 37 39 Other $m 17 17 17 17 Total Liabilities $m 57 66 69 71 Equity $m 154 160 169 178 Capital Employed $m 136 123 116 113 Net Debt/(Cash) $m (18) (37) (53) (66) Net Debt/Equity % (12.0%) (23.1%) (31.4%) (36.9%) Net Debt/Debt+Equity % (13.6)% (30.0)% (45.9)% (58.4)% Net Debt/EBITDA x (0.5) (1.0) (1.2) (1.3) Working Capital/Sales % (7.7%) (14.0%) (16.1%) (16.3%) D&A/PP&E % 48.2% 77.7% 71.0% 48.6% DCF VALUATION $m $/share Risk Free Rate 6.5% Equity Value 370 $0.51 Market Risk Premium 6.0% (Net Debt)/Cash 18 $0.03 Beta 1.30 Franking Credits $0.08 WACC 13.5% DCF Valuation $0.59 Group Revenue $m 127 128 131 138 Group EBITDA $m 0 0 0 0 Group EBITDA/Sales % 0.0% 0.0% 0.0% 0.0% DIVISIONAL SUMMARY 14% 18% 22% 26% 30% 34% 38% 2010 2011 2012 2013 2014 Margin Trends EBITDA/Sales EBIT/Sales -2,090 2,040 6,170 10,300 14,430 18,560 22,690 -95% -80% -65% -50% -35% -20% -5% 2010 2011 2012 2013 2014 Gearing & Interest Cover Net Debt/Net Debt+Equity (%) EBIT Interest Cover (x) 0% 10% 20% 30% 40% 50% 60% 2010 2011 2012 2013 2014 Return Trends ROE ROA ROFE - Reported
- 5. 5 RESEARCH RECOMMENDATION DEFINITIONS Positive Stock is expected to outperform the S&P/ASX 200 over the coming 24 months Neutral Stock expected to perform in line with the S&P/ASX 200 over the coming 24 months Negative Stock is expected to underperform the S&P/ASX 200 over the coming 24 months Speculative Stock has limited history from which to derive a fundamental investment view or its prospects are highly dependent on event risk, eg. Successful exploration, scientific breakthrough, high commodity prices, regulatory change, etc. Suspended Stock is temporarily suspended due to compliance with applicable regulatory and/or Evans & Partners policies in circumstances where Evans & Partners is acting in an advisory capacity. Not Rated Stock is not included in our investment research universe. Research Criteria Definitions Recommendations are primarily determined with reference to how a stock ranks relative to the S&P/ASX 200 on the following criteria: Valuation Rolling 12 month prospective multiples (composite of Price-to-Earnings Ratio, Dividend Yield and EV/EBITDA), or long-term NPV for resource stocks. Earnings Outlook Forecast 2 year EPS growth. Earnings Momentum Percentage change in the current consensus EPS estimate for the stock (rolling 1 year forward basis) over the consensus EPS estimate for the stock 3 months ago. Shareholder Returns Composite of forecast ROE (rolling 1 year forward basis) and the percentage change in ROE over 2 years. Debt Servicing Capacity Rolling 12 month EBIT Interest Cover ratio. Cyclical Risk Qualitative assessment of the 2 year outlook for a stock/industry’s profit cycle. Industry Quality Qualitative assessment of an industry’s growth/returns potential and company specific management capability. Financial Transparency If we don’t understand it, we won’t recommend it. For stocks where Evans & Partners does not generate its own forecasts, Bloomberg consensus data is used. Analysts can introduce other factors when determining their recommendation, with any material factors stated in the written research where appropriate.
- 6. 6 GENERAL RESEARCH DISCLAIMER, WARNING & DISCLOSURES This document is provided by Evans and Partners ABN 85 125 338 785, holder of AFSL 318075. The information is general advice only and does not take into consideration an investor’s objectives, financial situation or needs. Before acting on the advice, investors should consider the appropriateness of the advice, having regard to the investor’s objectives, financial situation and needs. If the advice relates to a financial product that is the subject of a Product Disclosure Statement (e.g. unlisted managed funds) investors should obtain the PDS and consider it before making any decision about whether to acquire the product. The material contained in this document is for information purposes only and does not constitute an offer, solicitation or recommendation with respect to the purchase or sale of securities. It should not be regarded by recipients as a substitute for the exercise of their own judgment. Investors should be aware that past performance is not an infallible indicator of future performance and future returns are not guaranteed. Any opinions and/or recommendations expressed in this material are subject to change without notice and Evans and Partners is not under any obligation to update or keep current the information contained herein. References made to third parties are based on information believed to be reliable but are not guaranteed as being accurate. This document is provided to the recipient only and is not to be distributed to third parties without the prior consent of Evans and Partners. EVANS AND PARTNERS DISCLOSURE OF INTERESTS Evans and Partners and its respective officers and associates may have an interest in the securities or derivatives of any entities referred to in this material. Evans and Partners does, and seeks to do, business with companies that are the subject of its research reports. EVANS AND PARTNERS CORPORATE RELATIONSHIP DISCLOSURE AFI: Evans and Partners have arranged, managed or co-managed a public offering of the company or its affiliates in the past 12 months. AYUHA: Evans and Partners have arranged, managed or co-managed a public offering of the company or its affiliates in the past 12 months. BHP: A director of Evans and Partners Pty Ltd Advisory Board is a director of BHP Billiton Ltd. BSL: A director of Evans and Partners Pty Ltd Advisory Board is a director of BlueScope Steel Ltd. BOQ, BOQPA, BOQPC: A director of Evans and Partners Pty Ltd Advisory Board is a director of Bank of Queensland. CBA: Evans and Partners managed or co-managed a public offering of securities of the company or its affiliates in the past 12 months. CBAHA: Evans and Partners managed or co-managed a public offering of securities of the company or its affiliates in the past 12 months. HHY: Evans and Partners have been appointed by the Issuer as Broker to an on-market buy-back. Accordingly, Evans and Partners are unable to give Sellers advice in respect of a sale of this security. LLC: A director of Evans and Partners Pty Ltd Advisory Board is a director of Lend Lease Corporation Ltd. MQG: MQCPA: A director of Evans and Partners Pty Ltd Advisory Board is a director of Macquarie Group Ltd. ORG: A director of Evans and Partners Pty Ltd Advisory Board is a director of Origin Energy Ltd. PPC: Evans and Partners managed or co-managed a public offering of securities of the company or its affiliates in the past 12 months. OOH: Evans and Partners have arranged, managed or co-managed a public offering of the company or its affiliates in the past 12 months. SAR: Evans and Partners managed or co-managed a public offering of securities of the company or its affiliates in the past 12 months. TOX: Evans and Partners managed or co-managed a public offering of securities of the company or its affiliates in the past 12 months. RESEARCH ANALYST CERTIFICATION I, George Gabriel, CFA, hereby certify that all the views expressed in this report accurately reflect my personal views about the subject investment theme &/or company securities. I also certify that no part of my compensation was, is, or will be, directly or indirectly, related to the specific recommendations or views expressed in this report. RESEARCH ANALYST DISCLOSURE OF INTEREST I, George Gabriel, CFA, &/or entities in which I have a pecuniary interest, have an exposure to the following securities &/or managed products: TGA. DISCLAIMER Except for any liability which cannot be excluded, Evans & Partners, its directors, employees & agents accept no liability or responsibility whatsoever for any loss or damage of any kind, direct or indirect, arising out of the use of all or any part of this material. All information is correct at the time of publication; additional information may be available upon request.