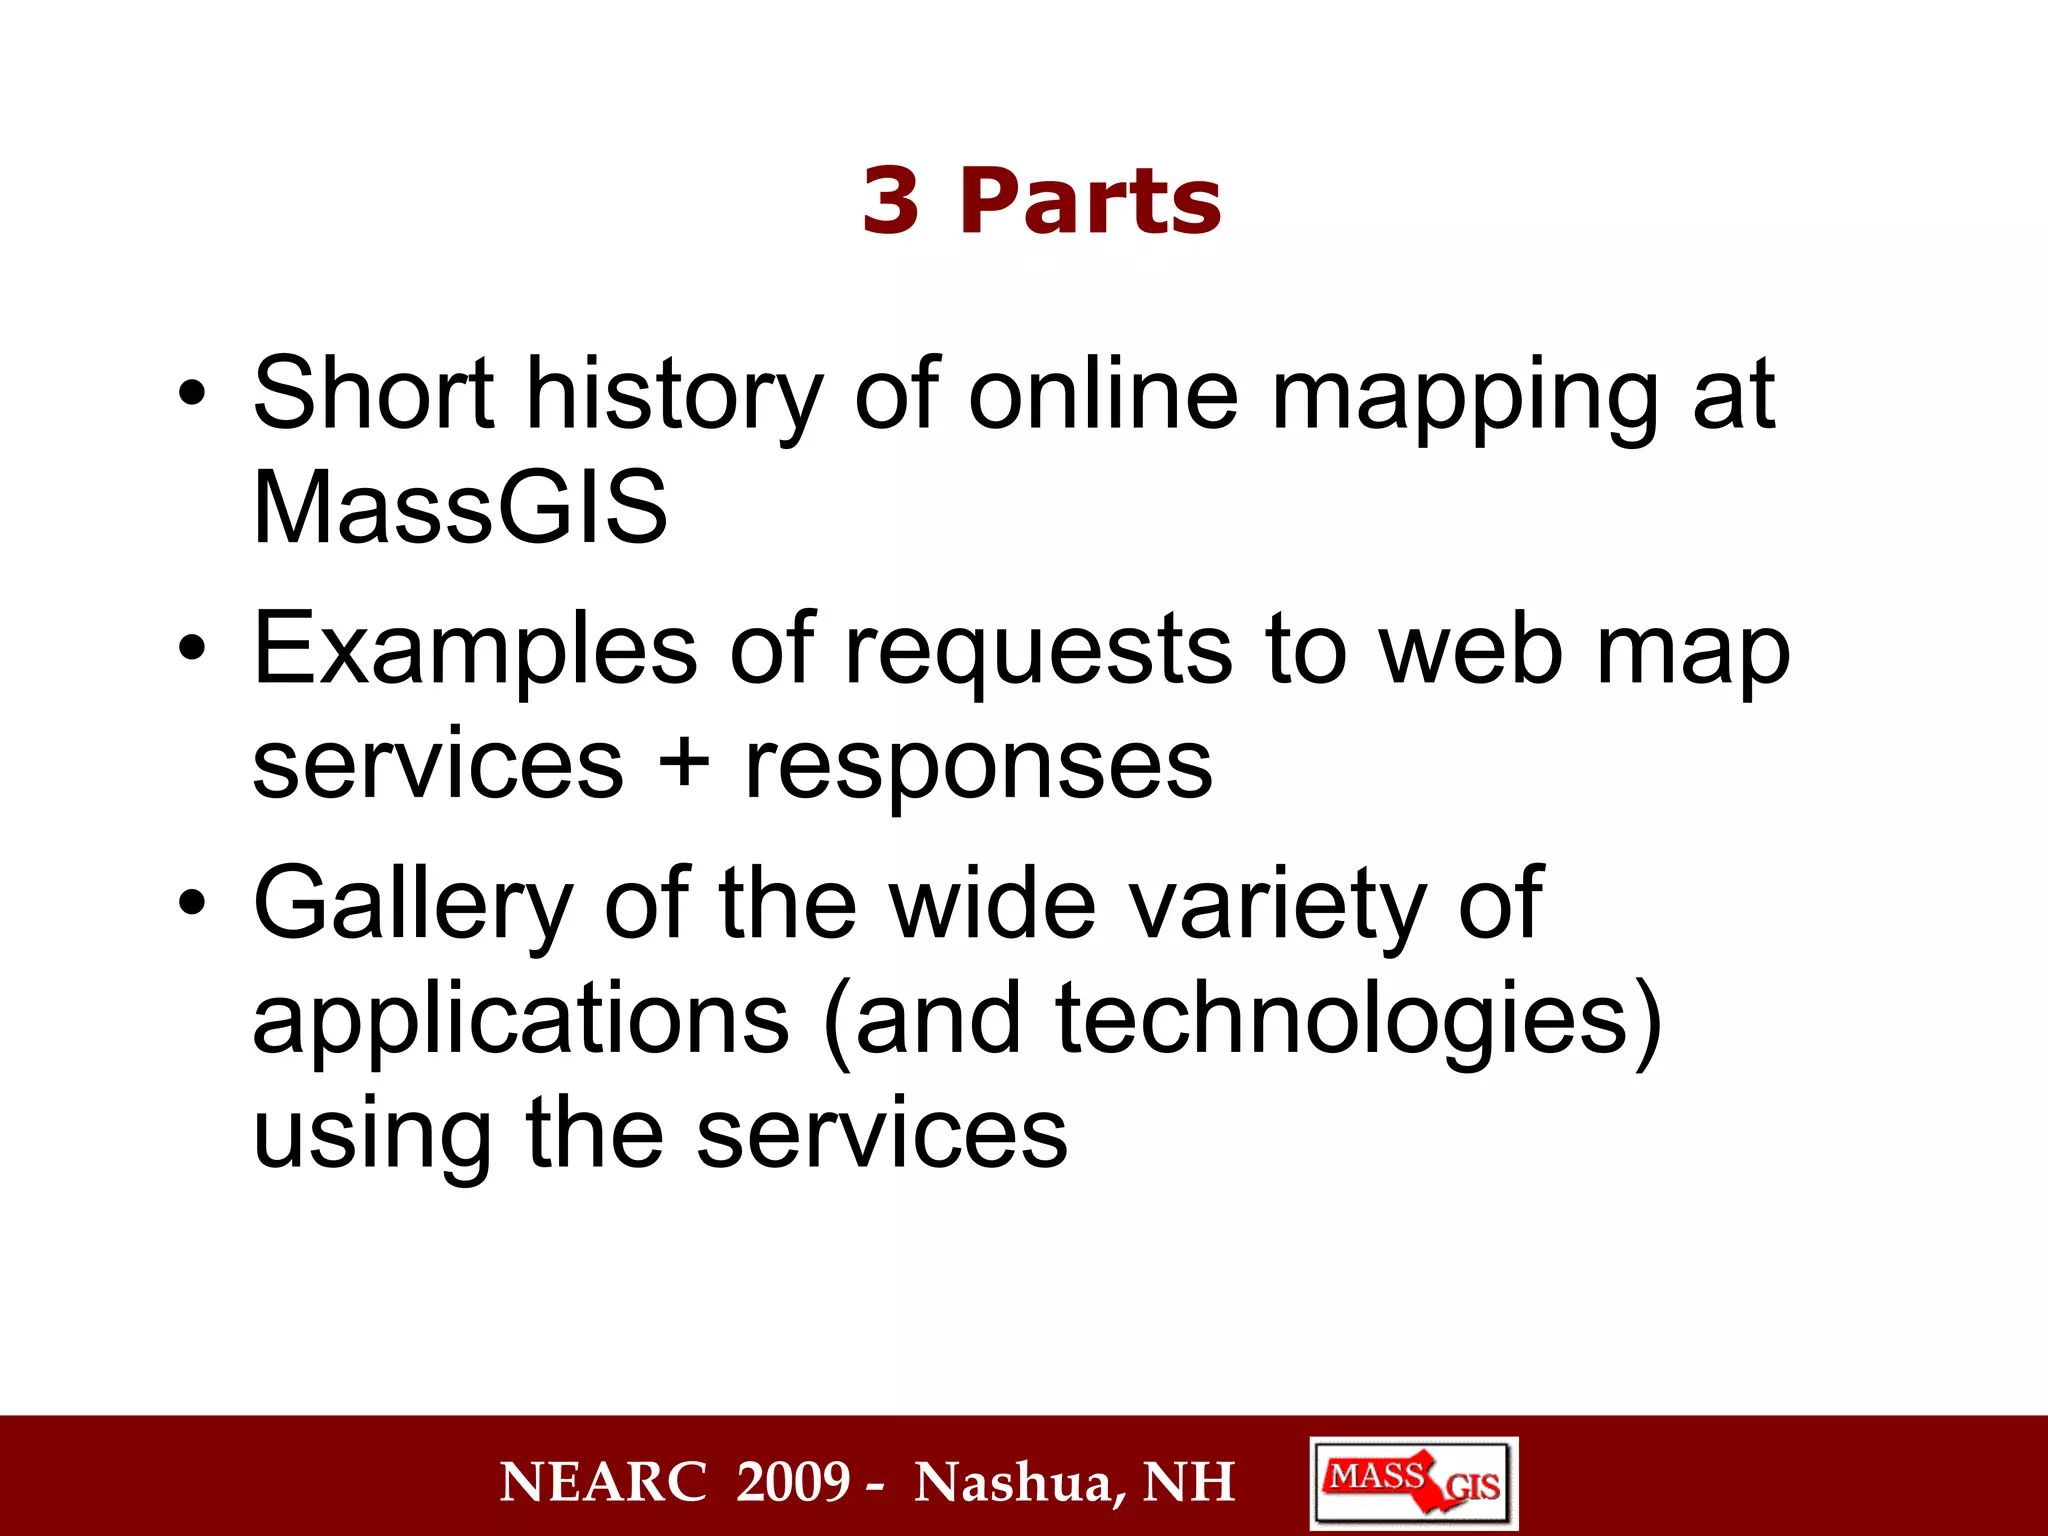
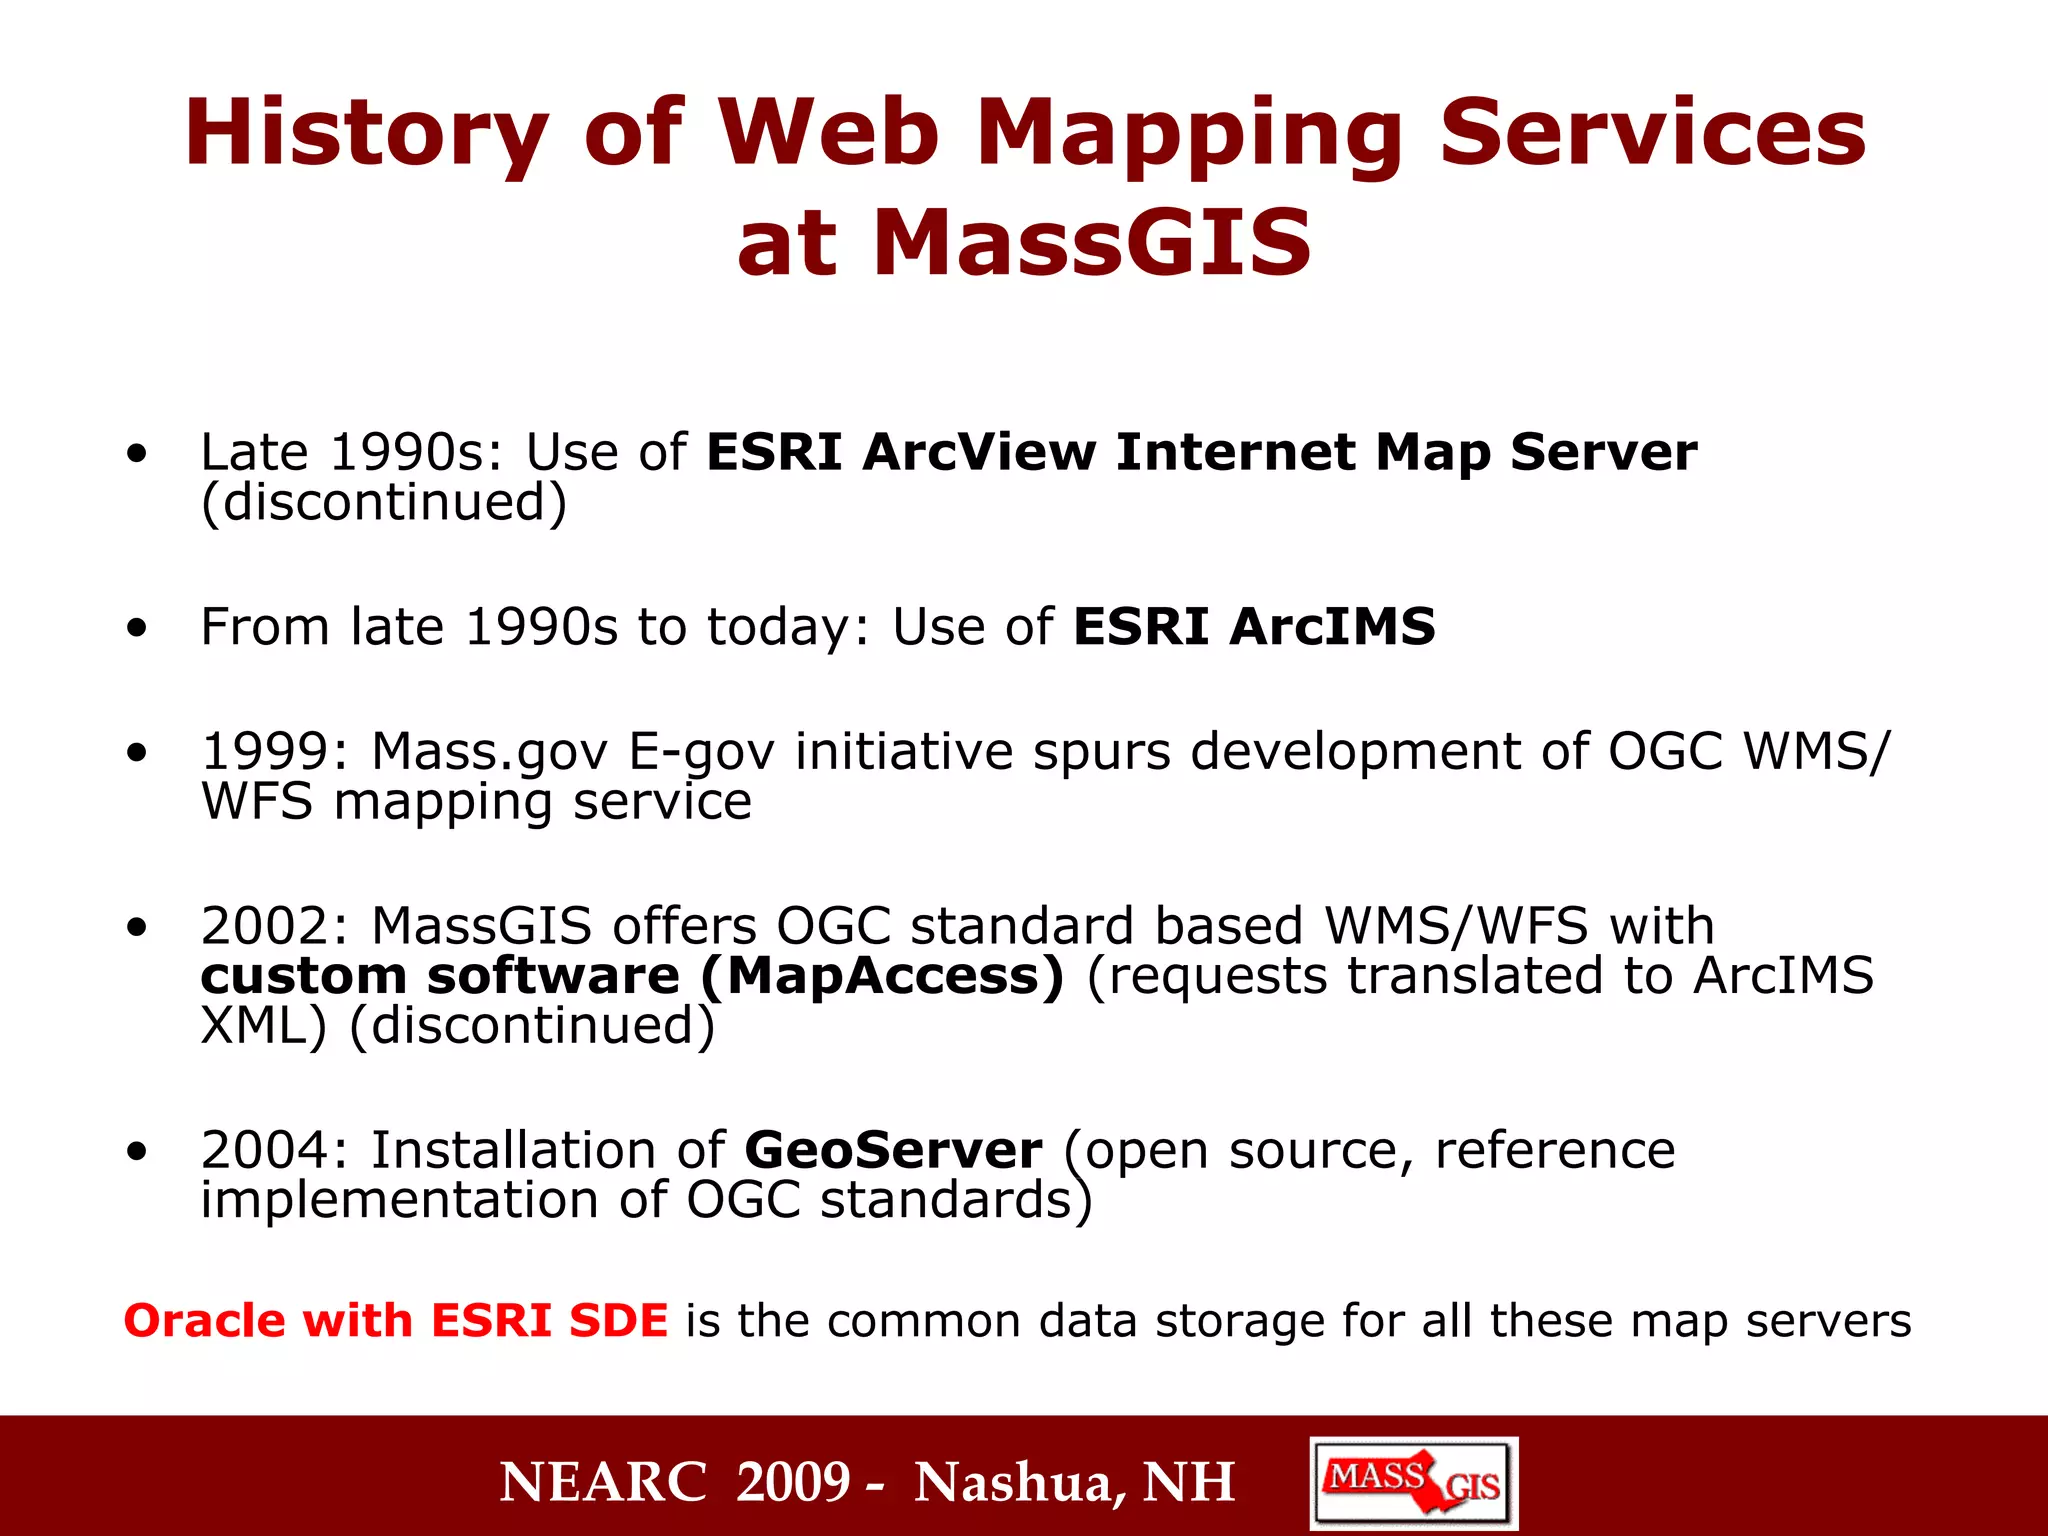
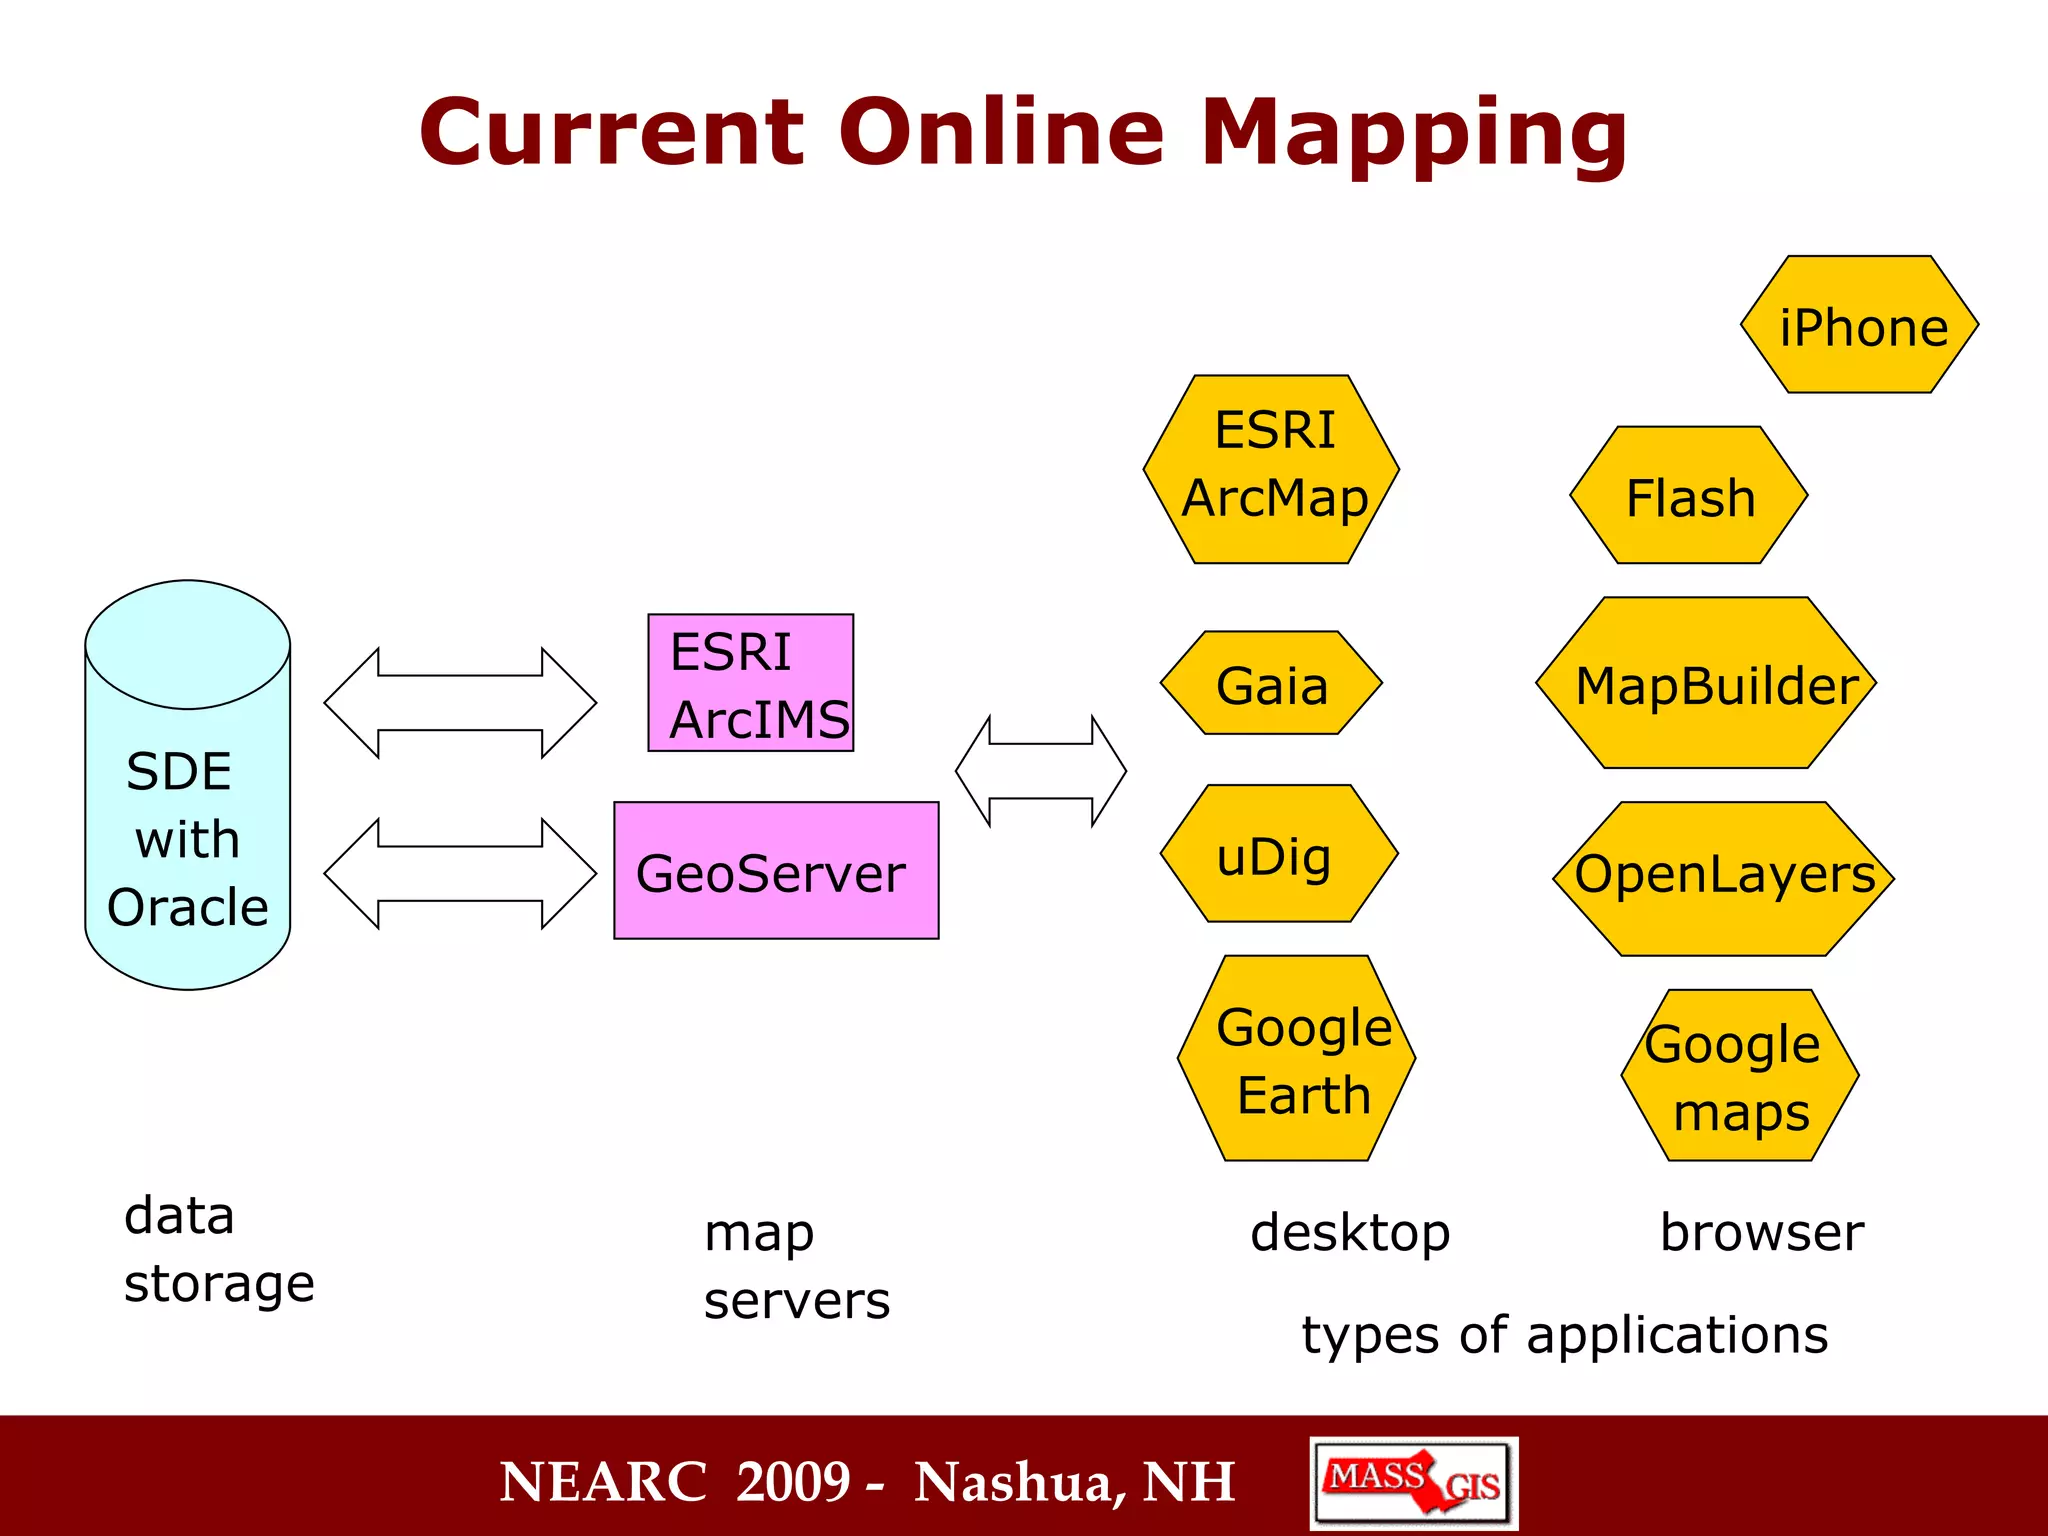
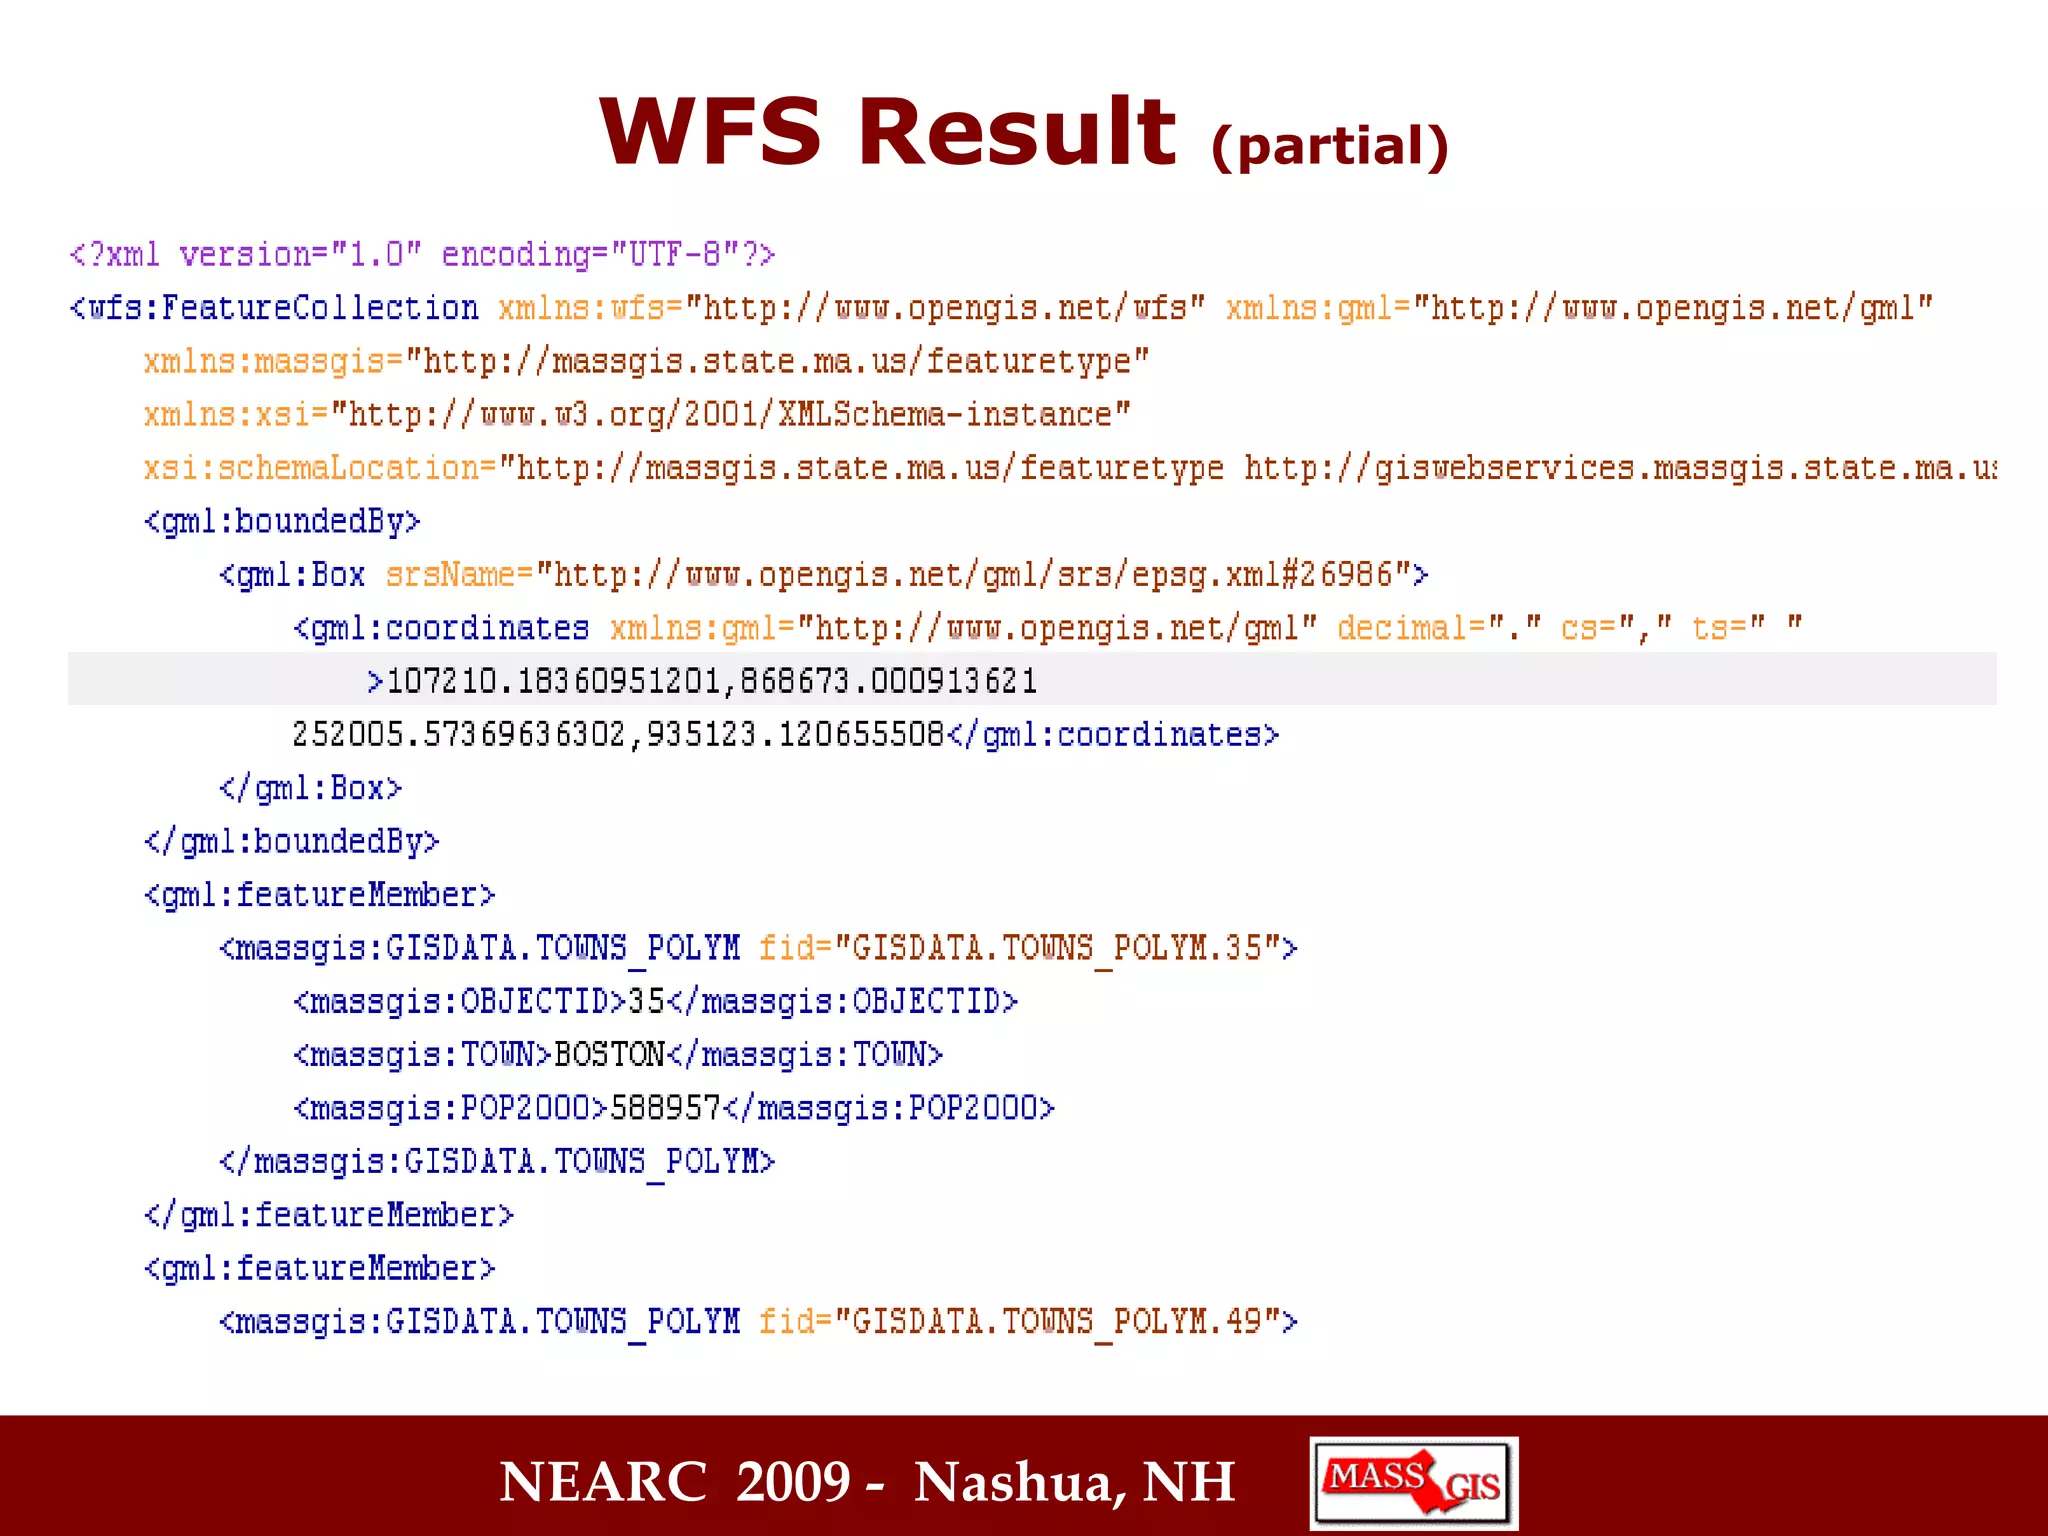
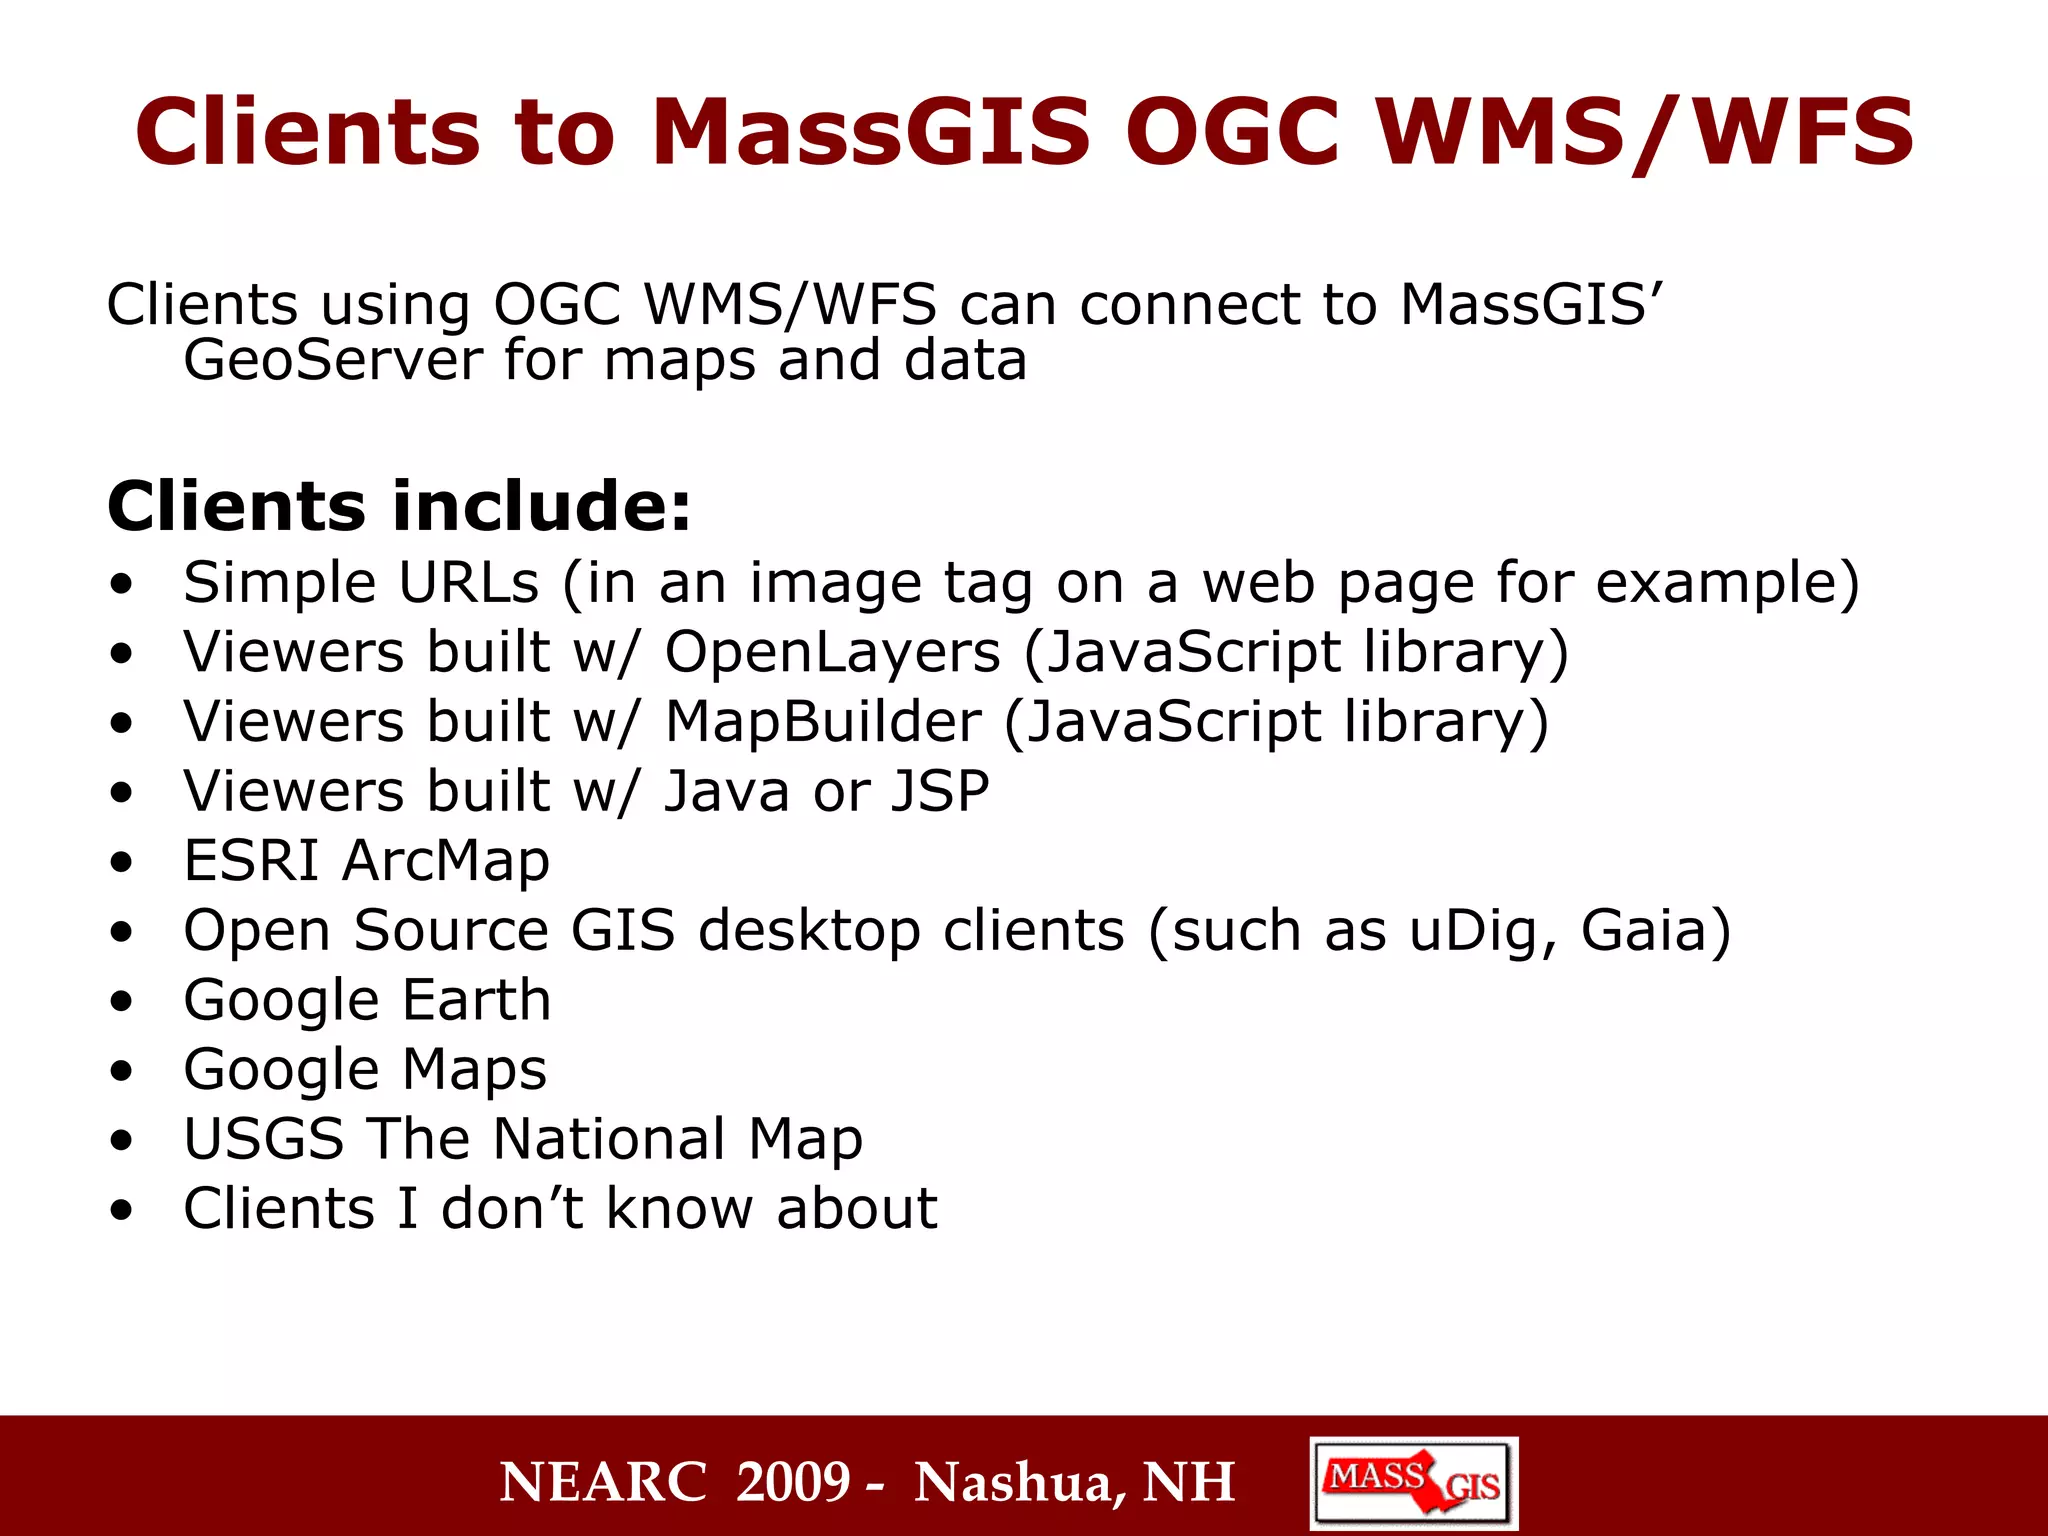
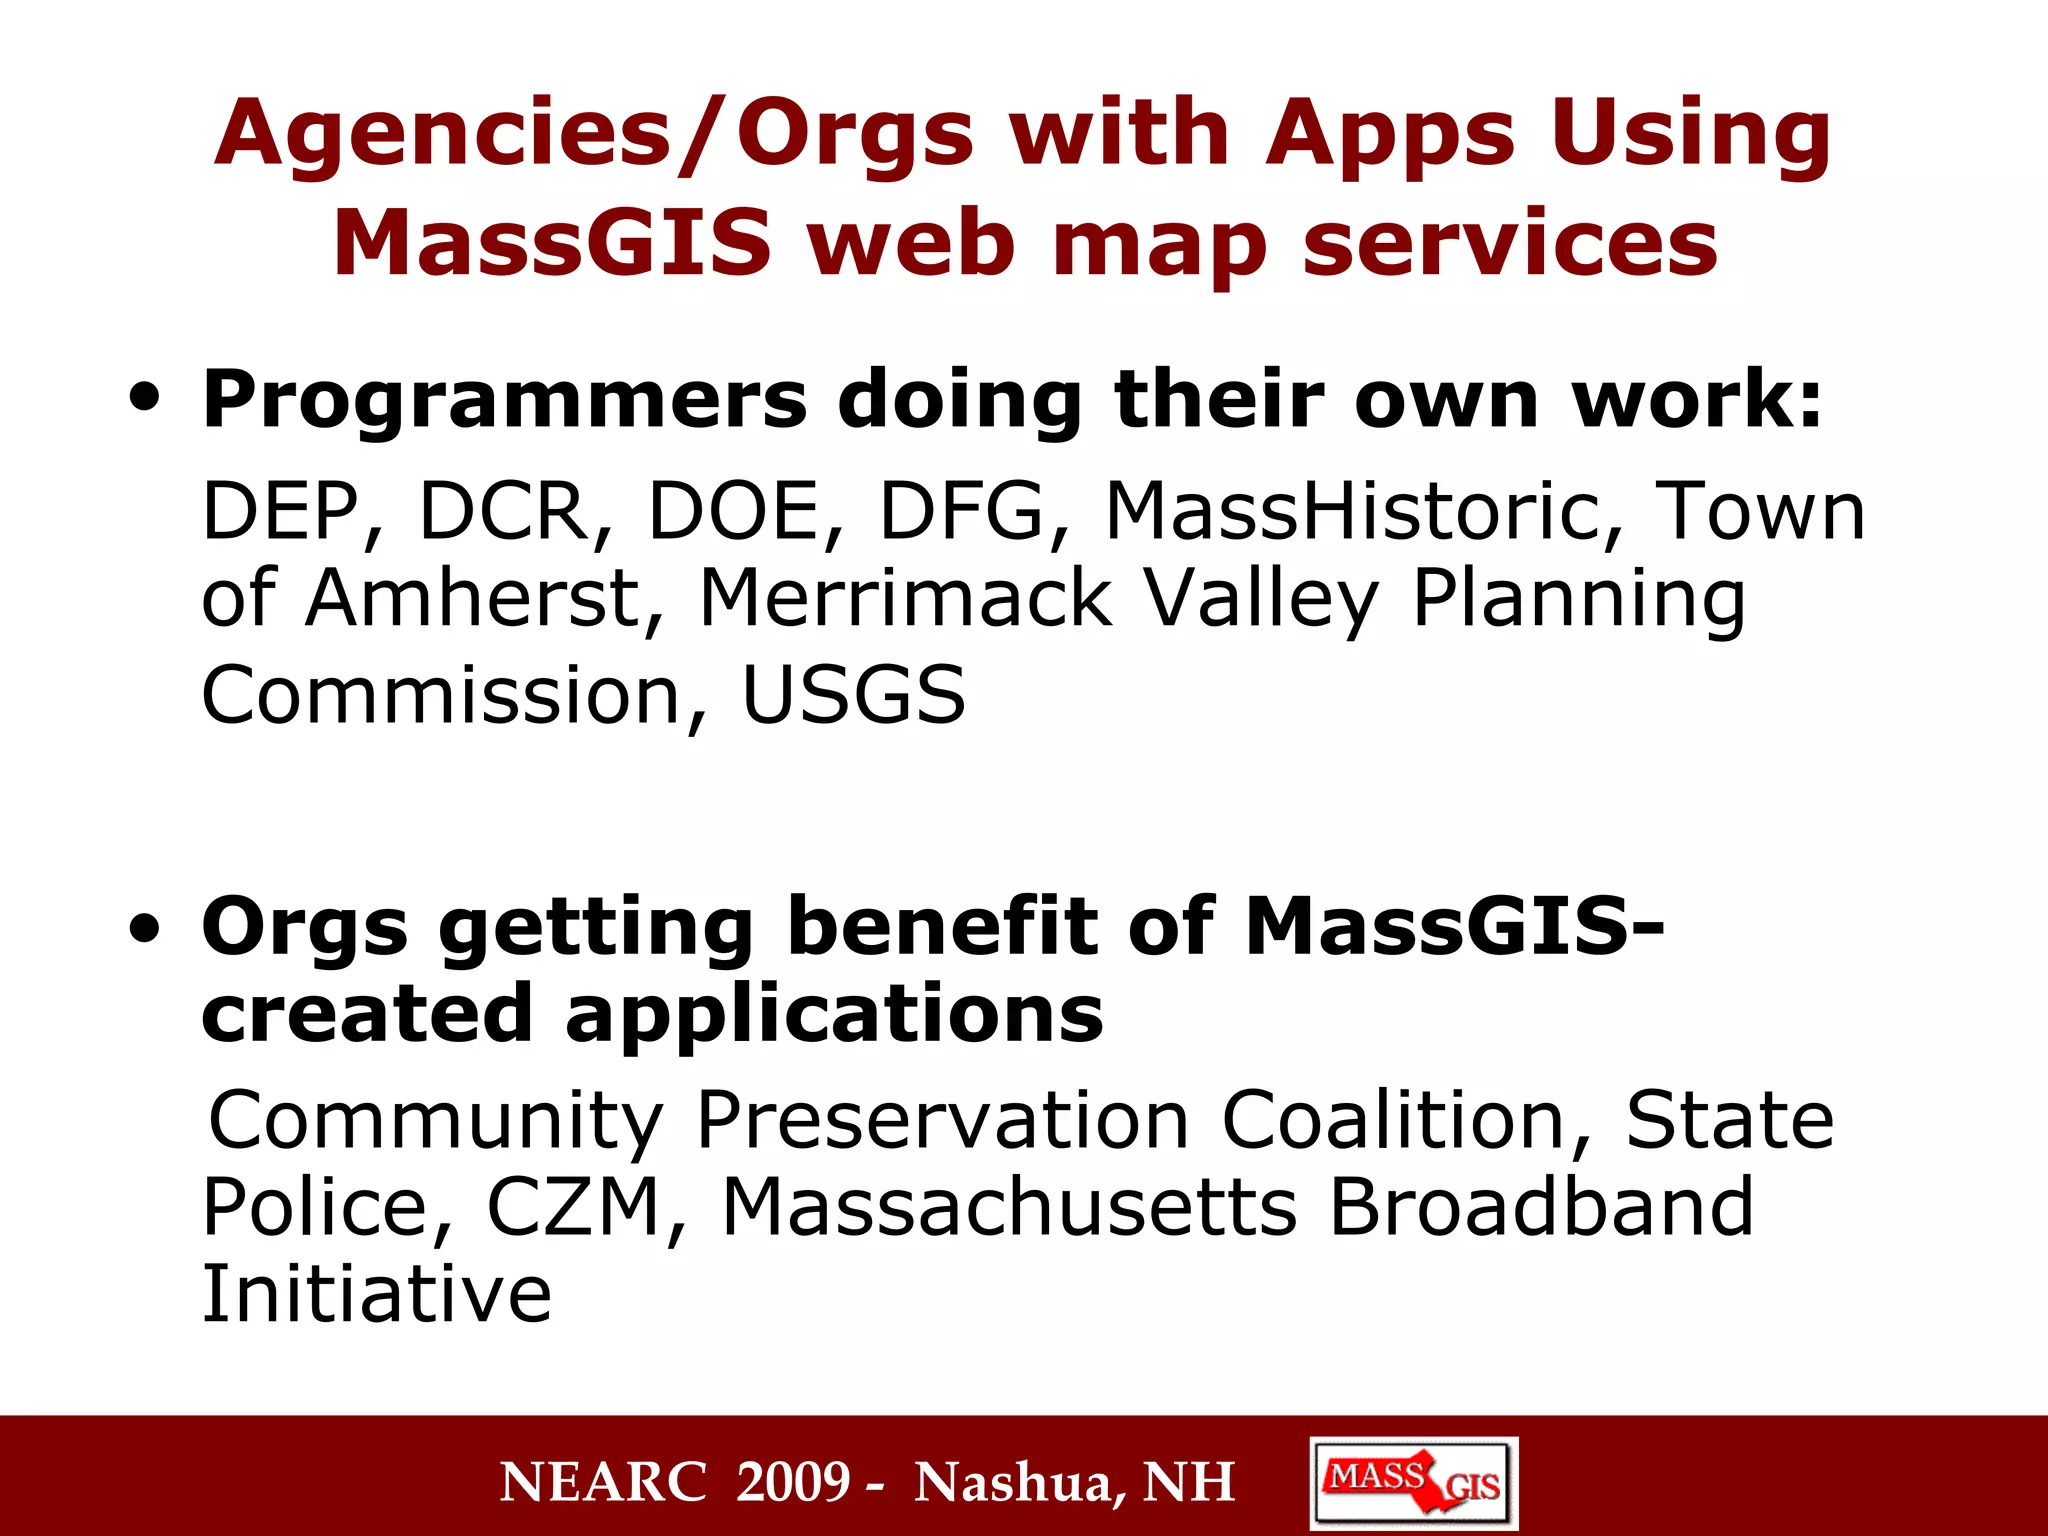
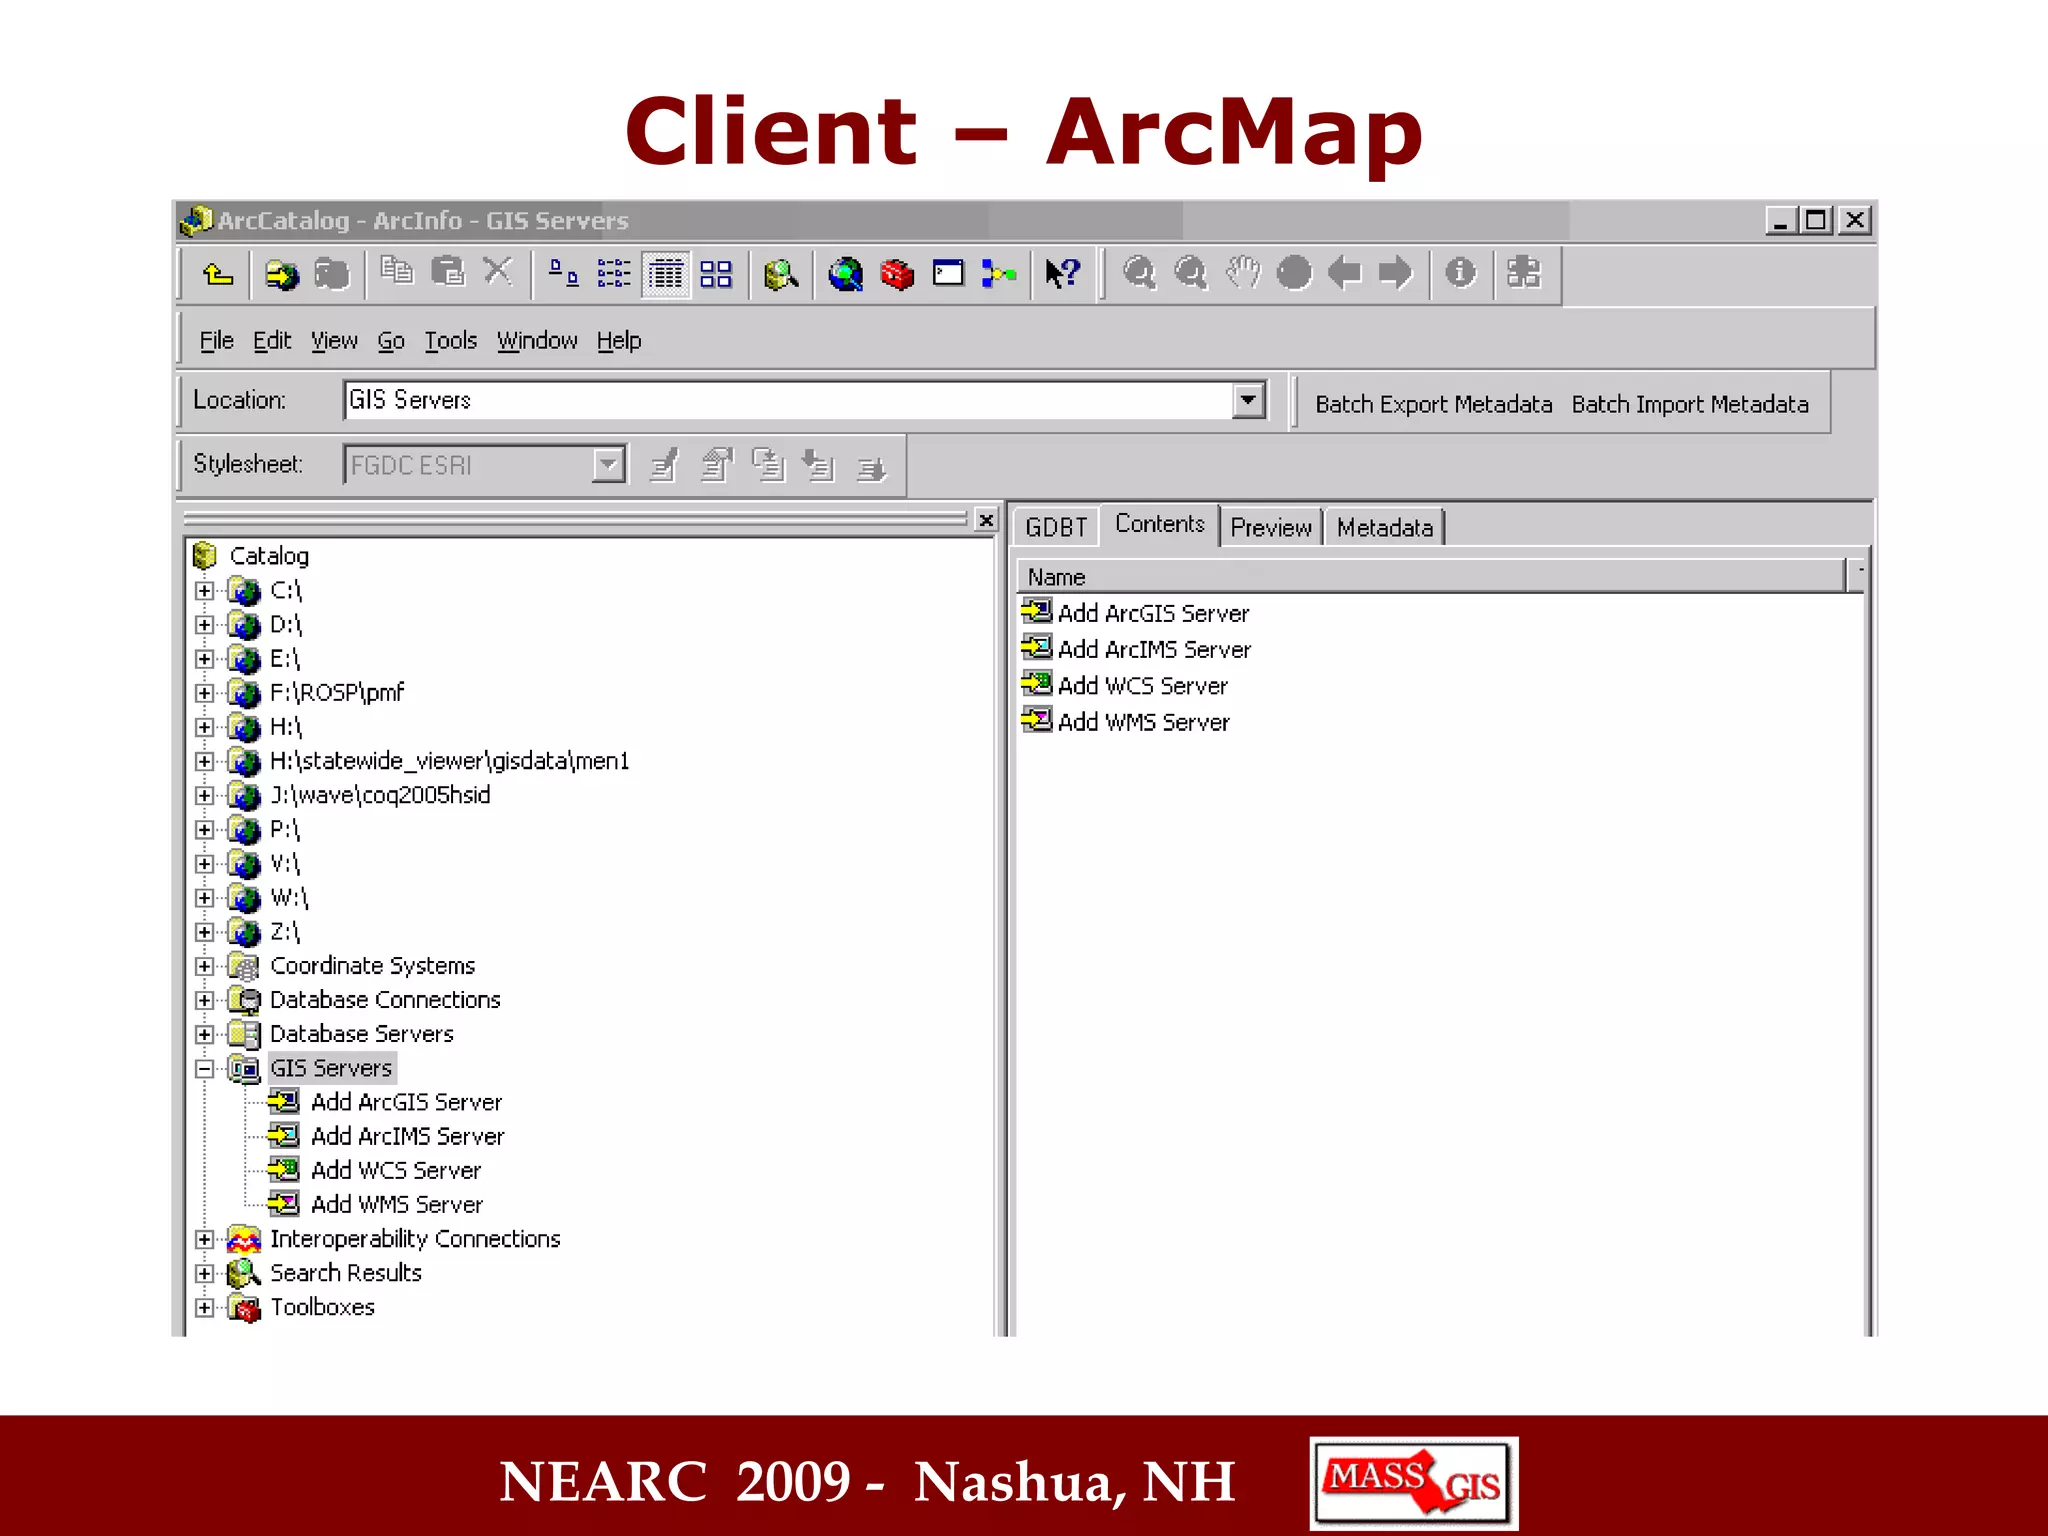
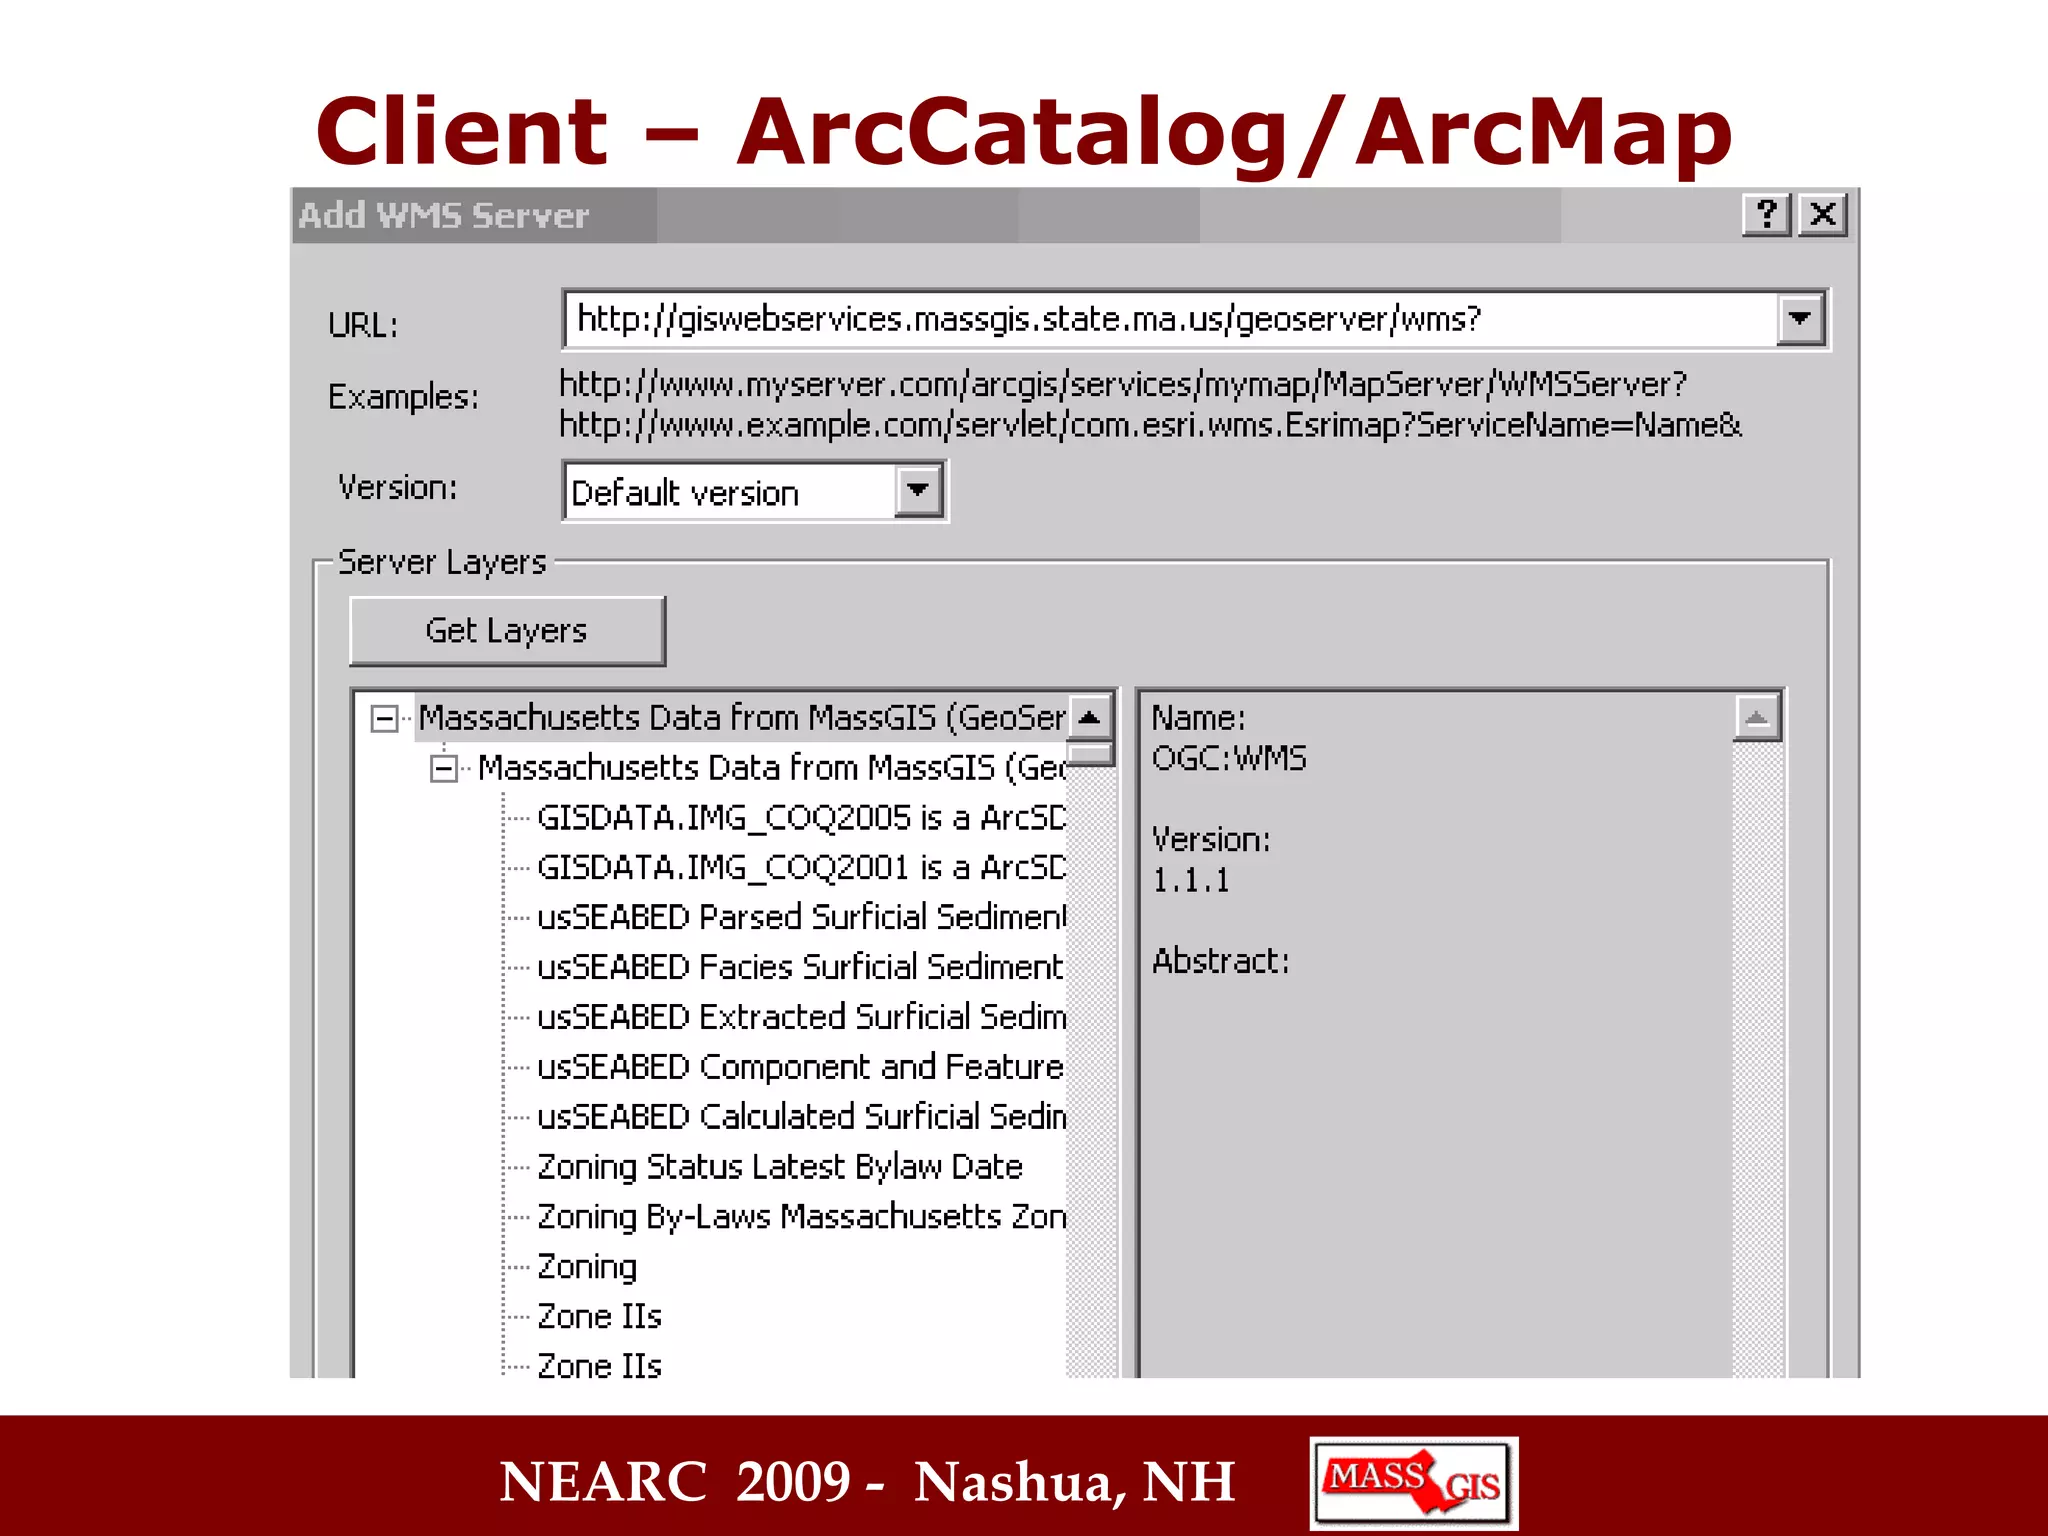
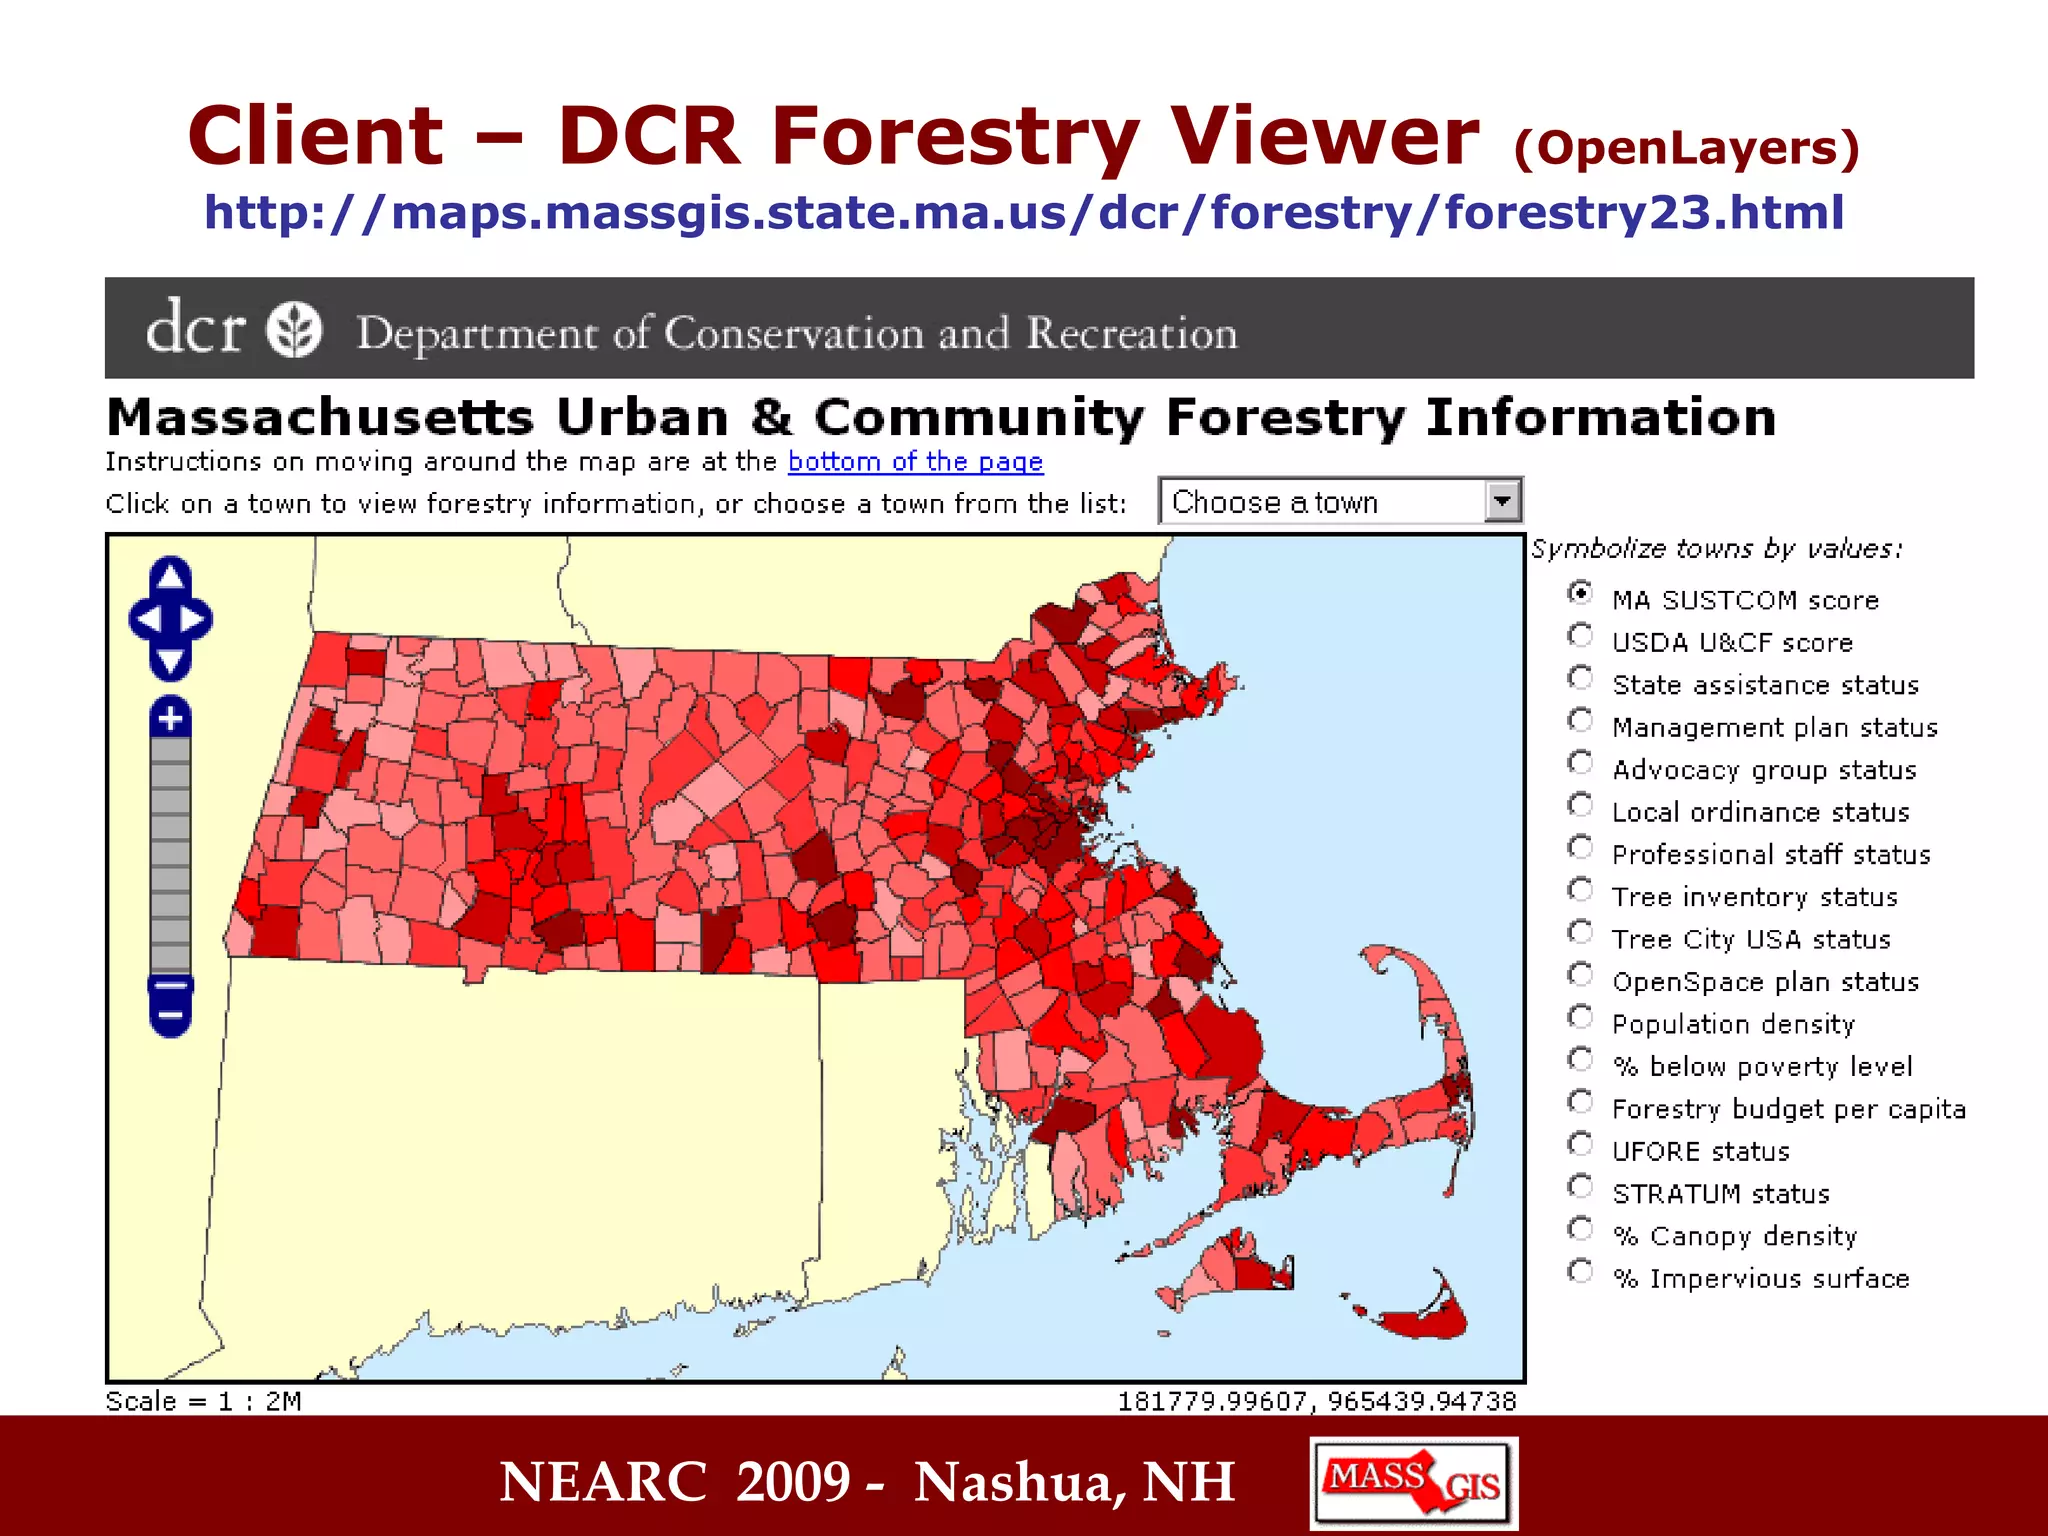
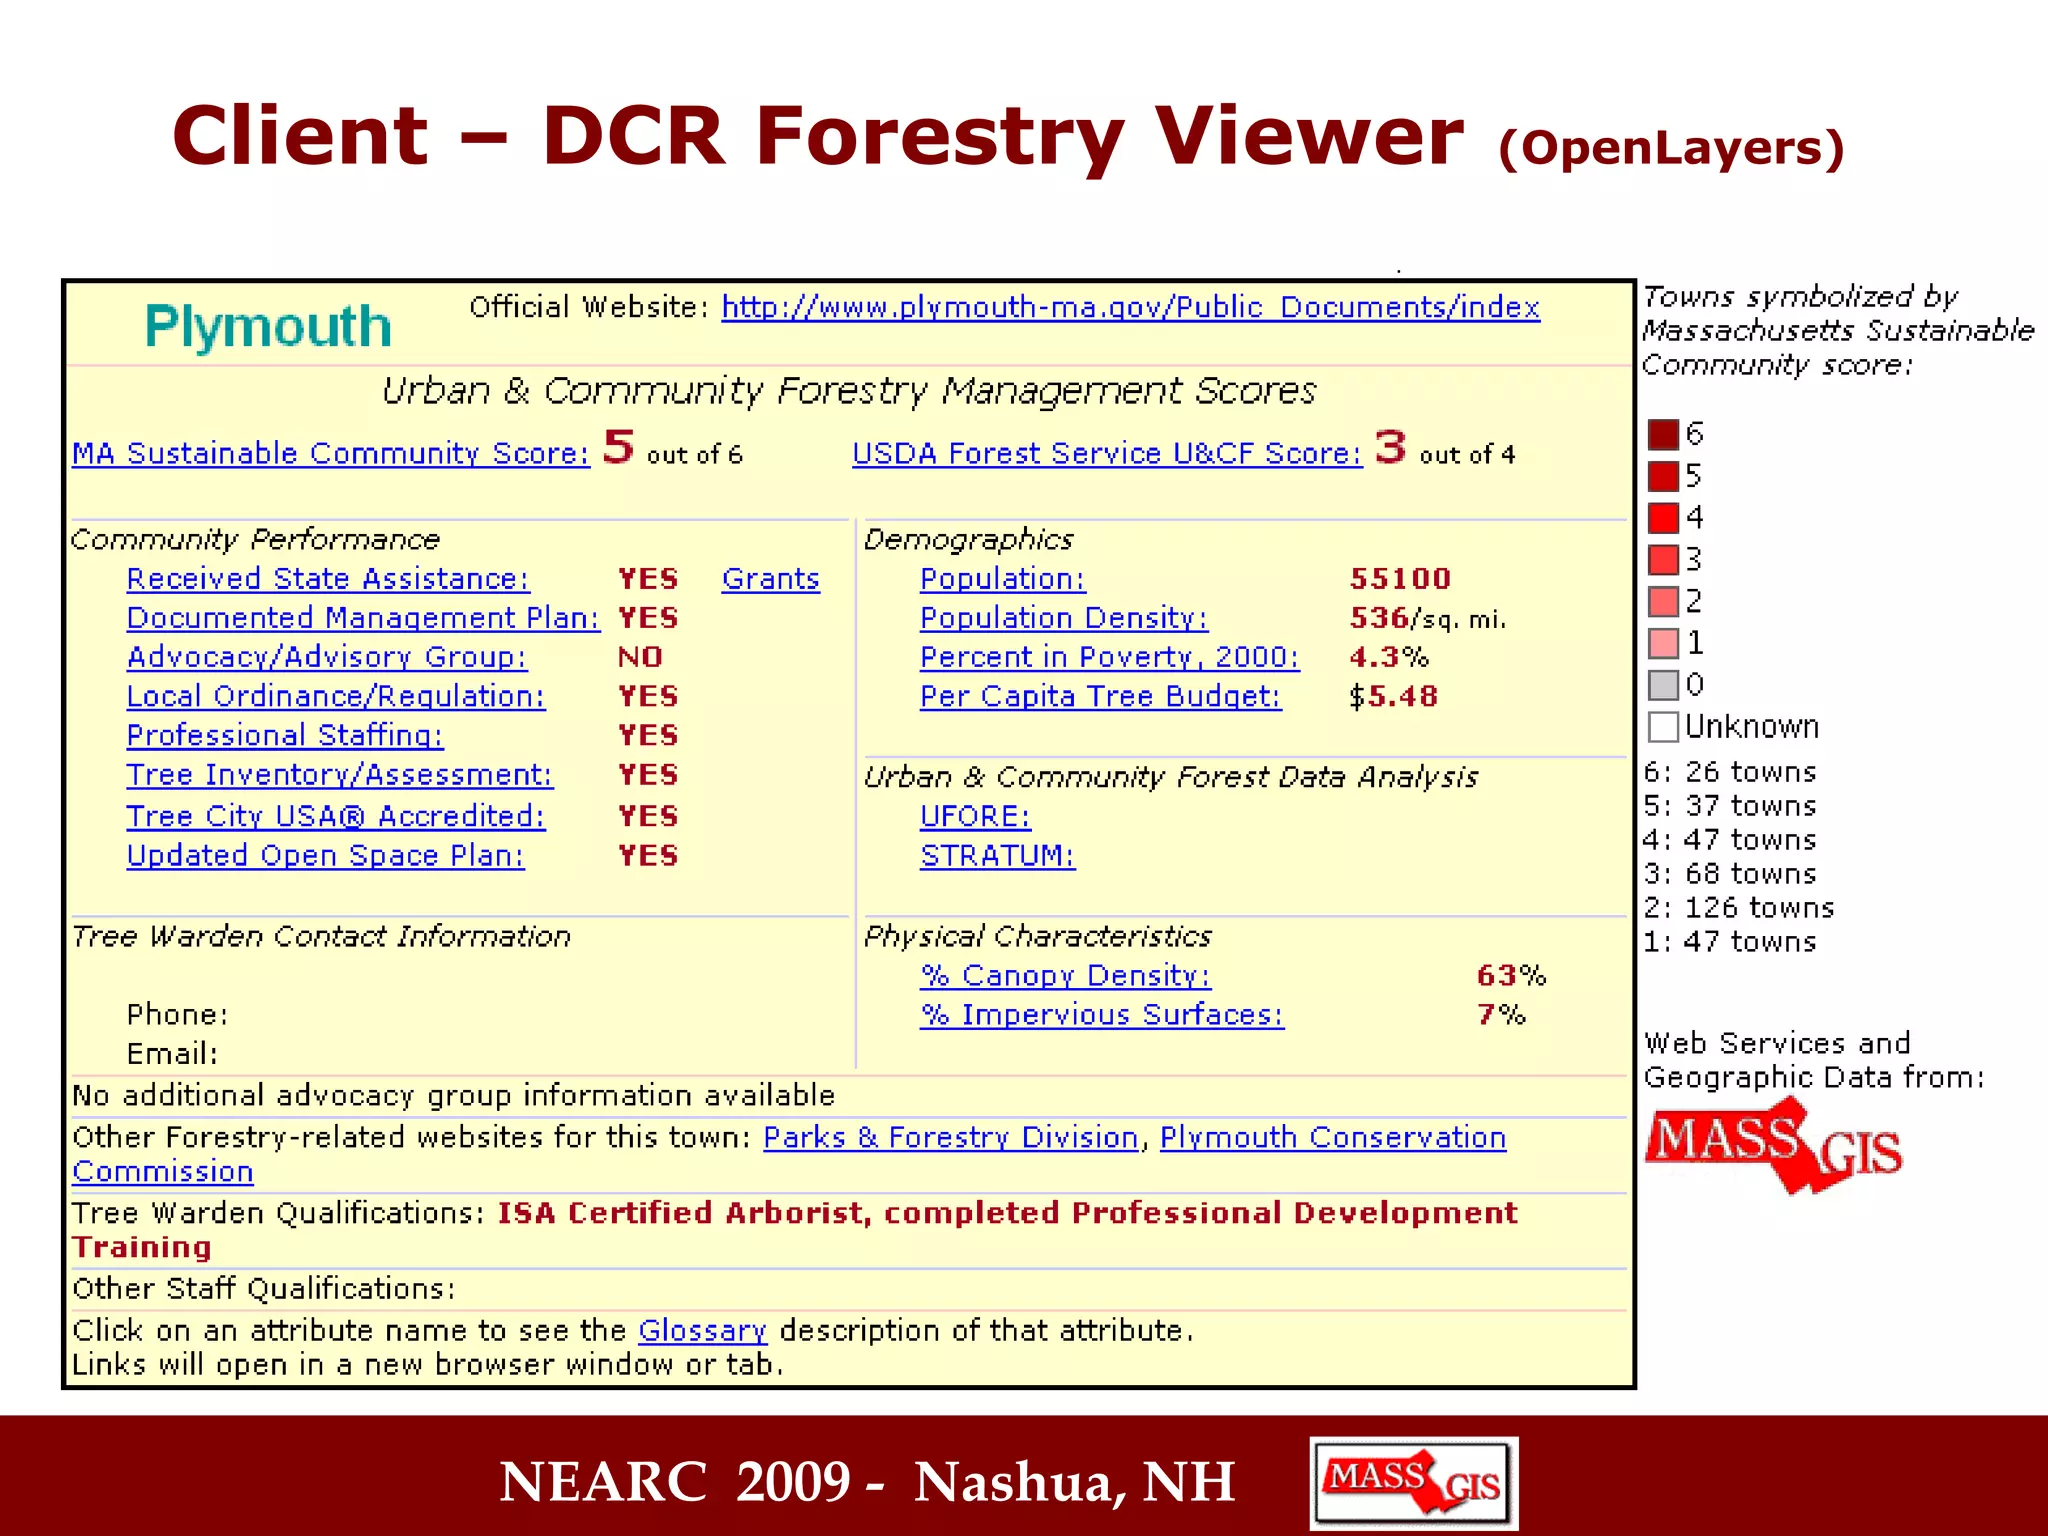
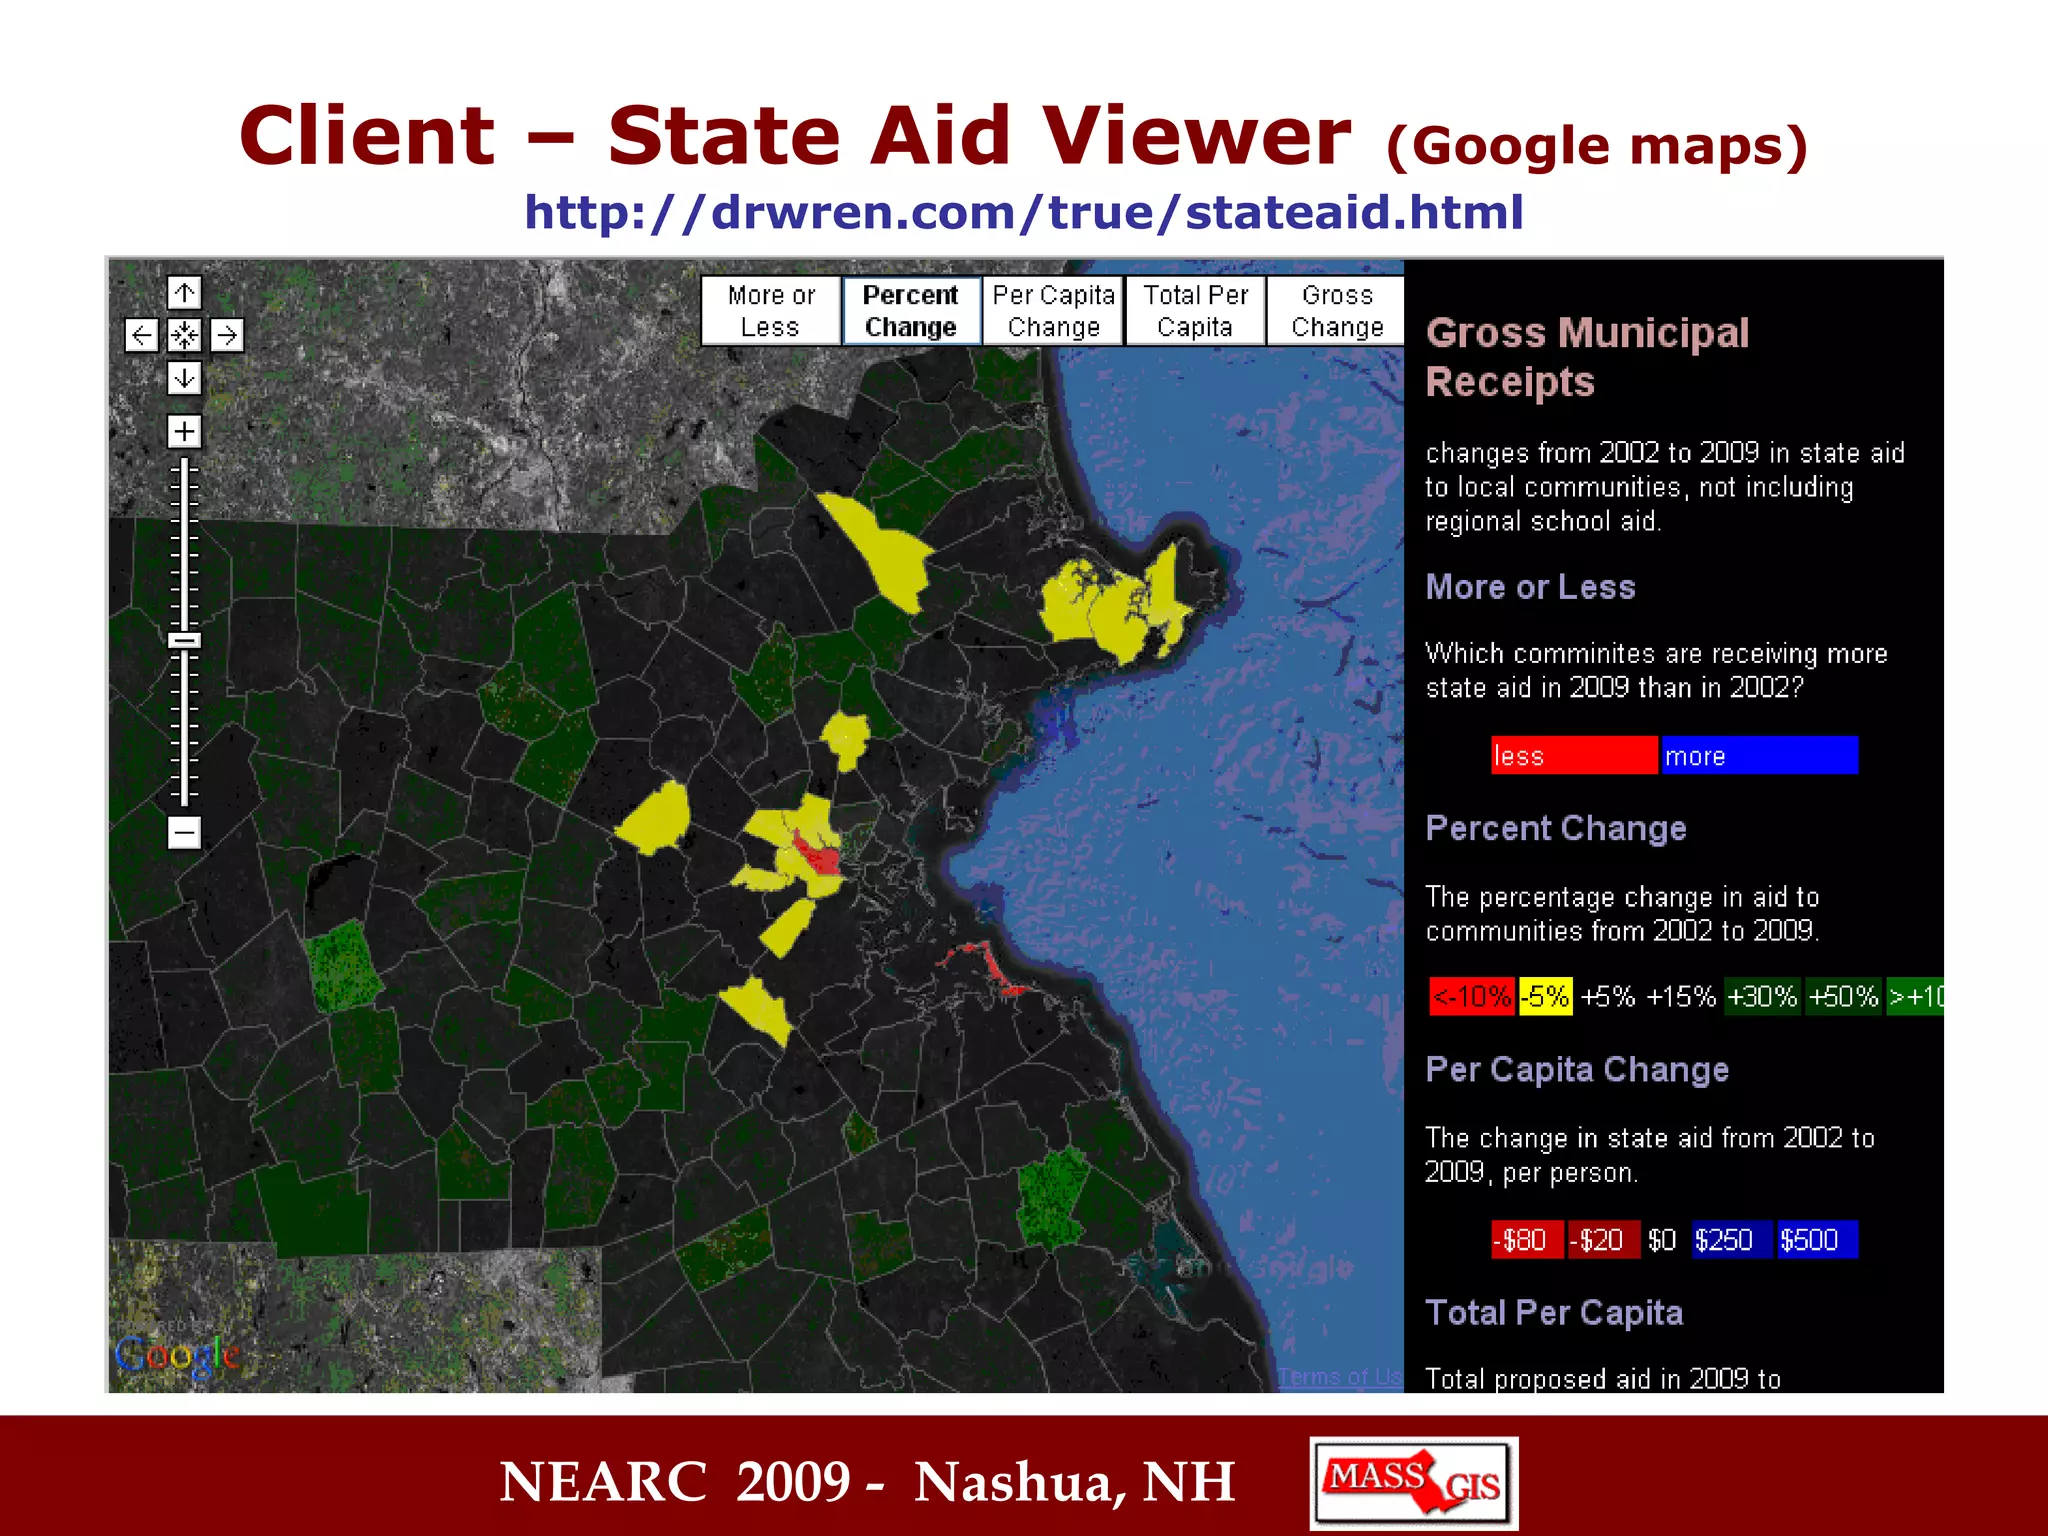
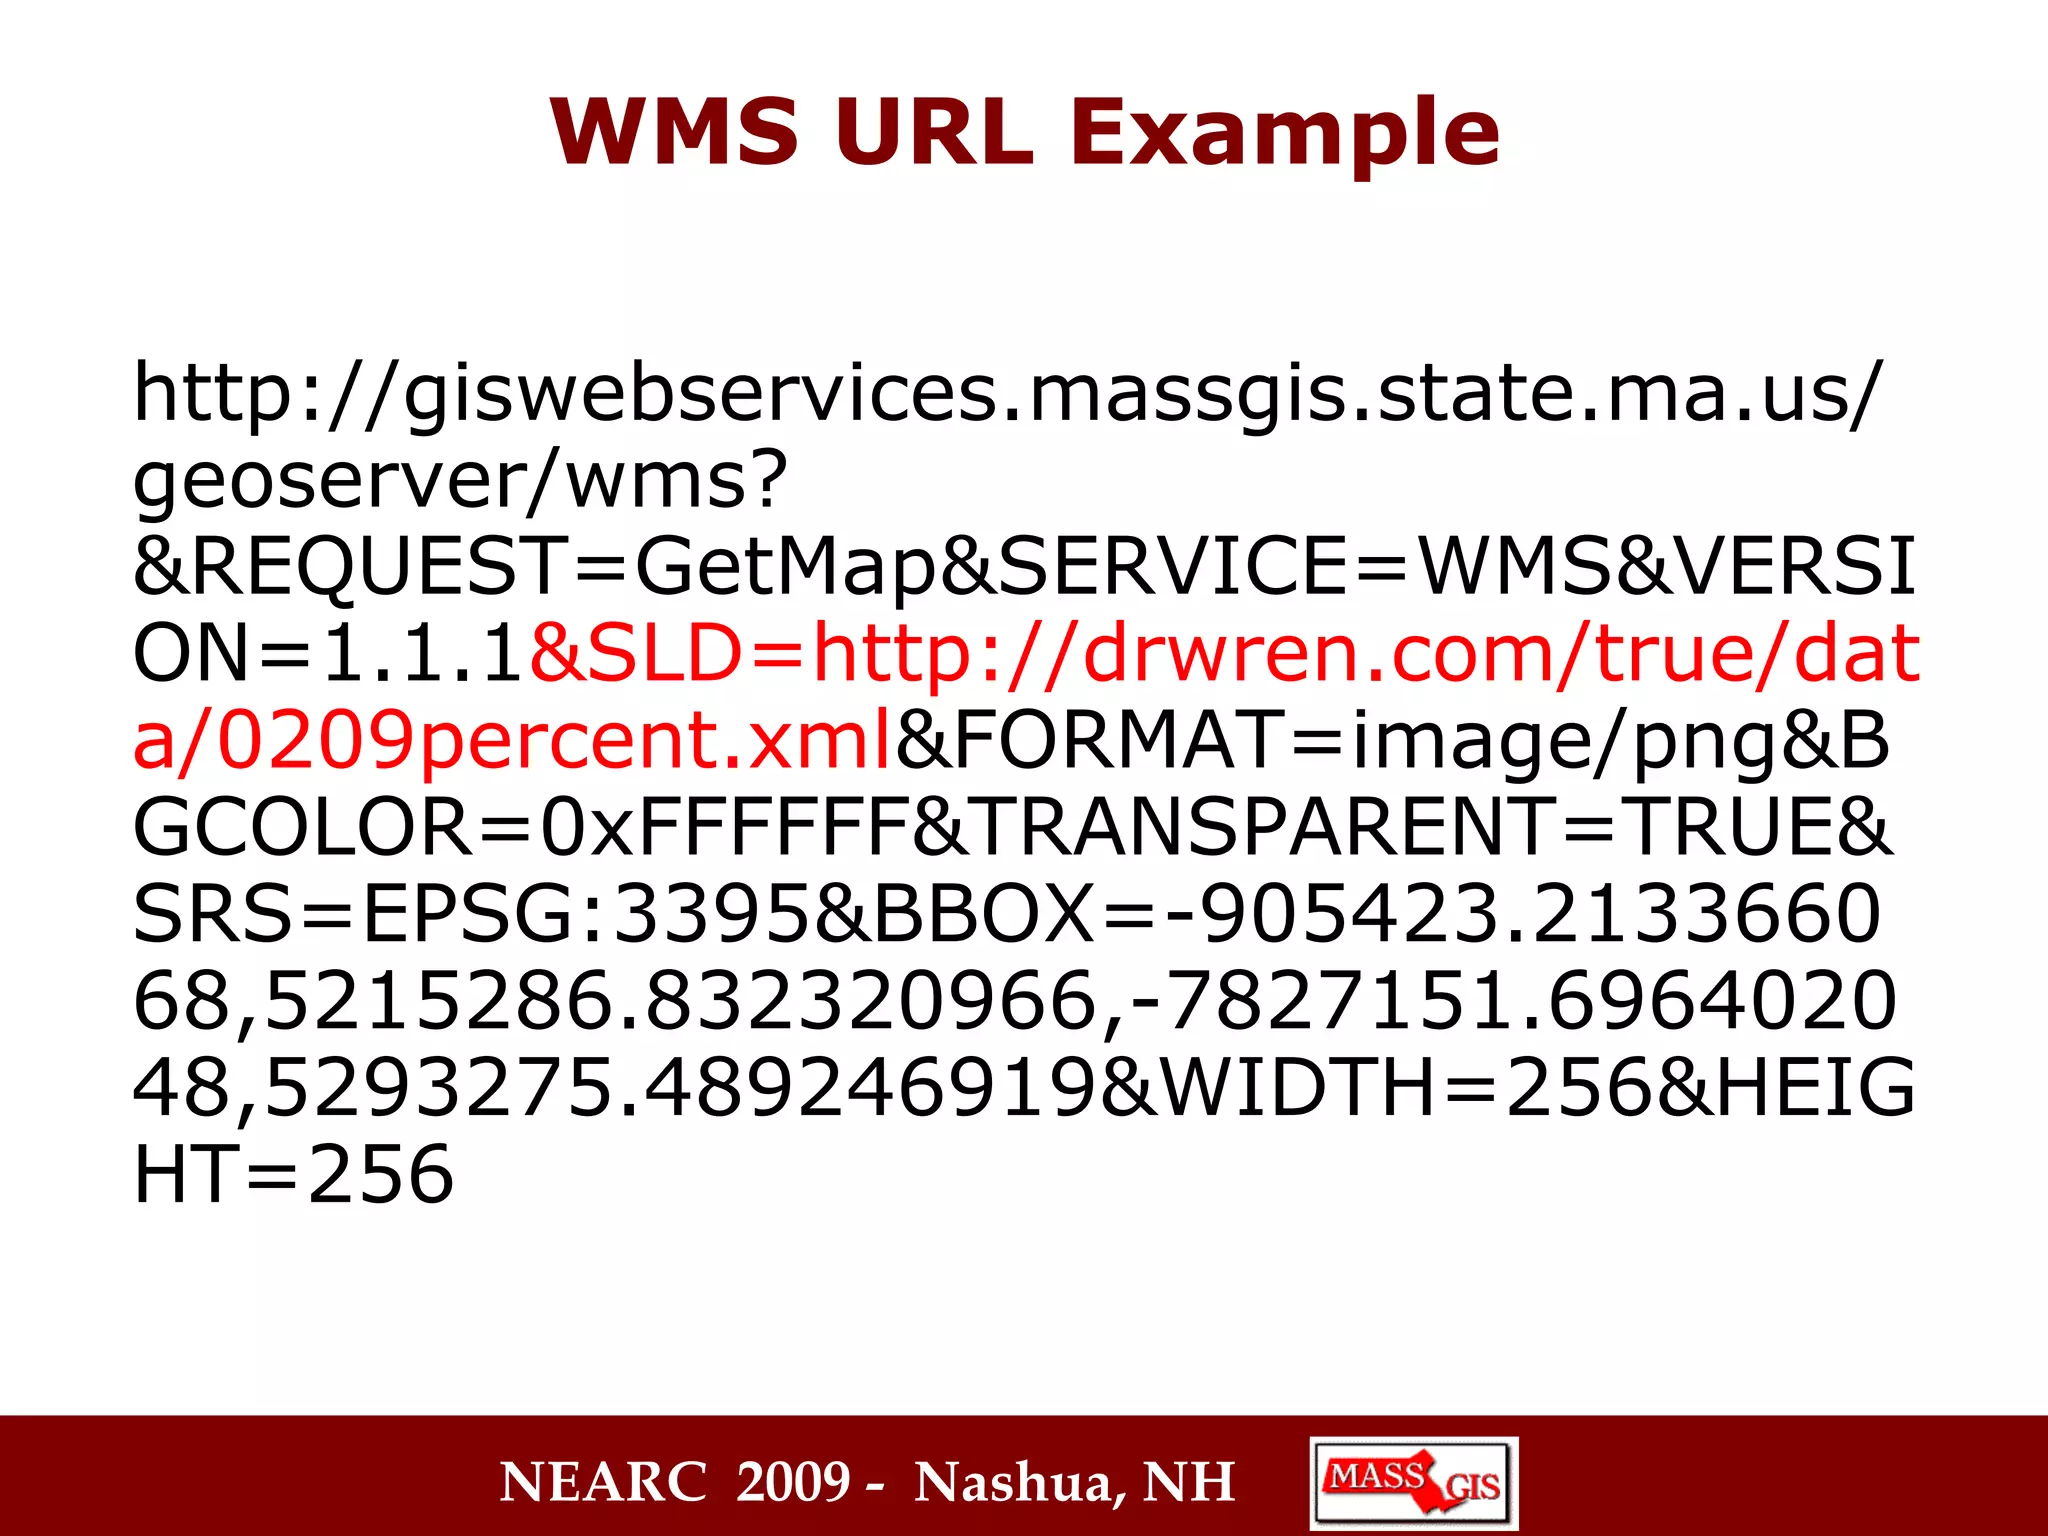
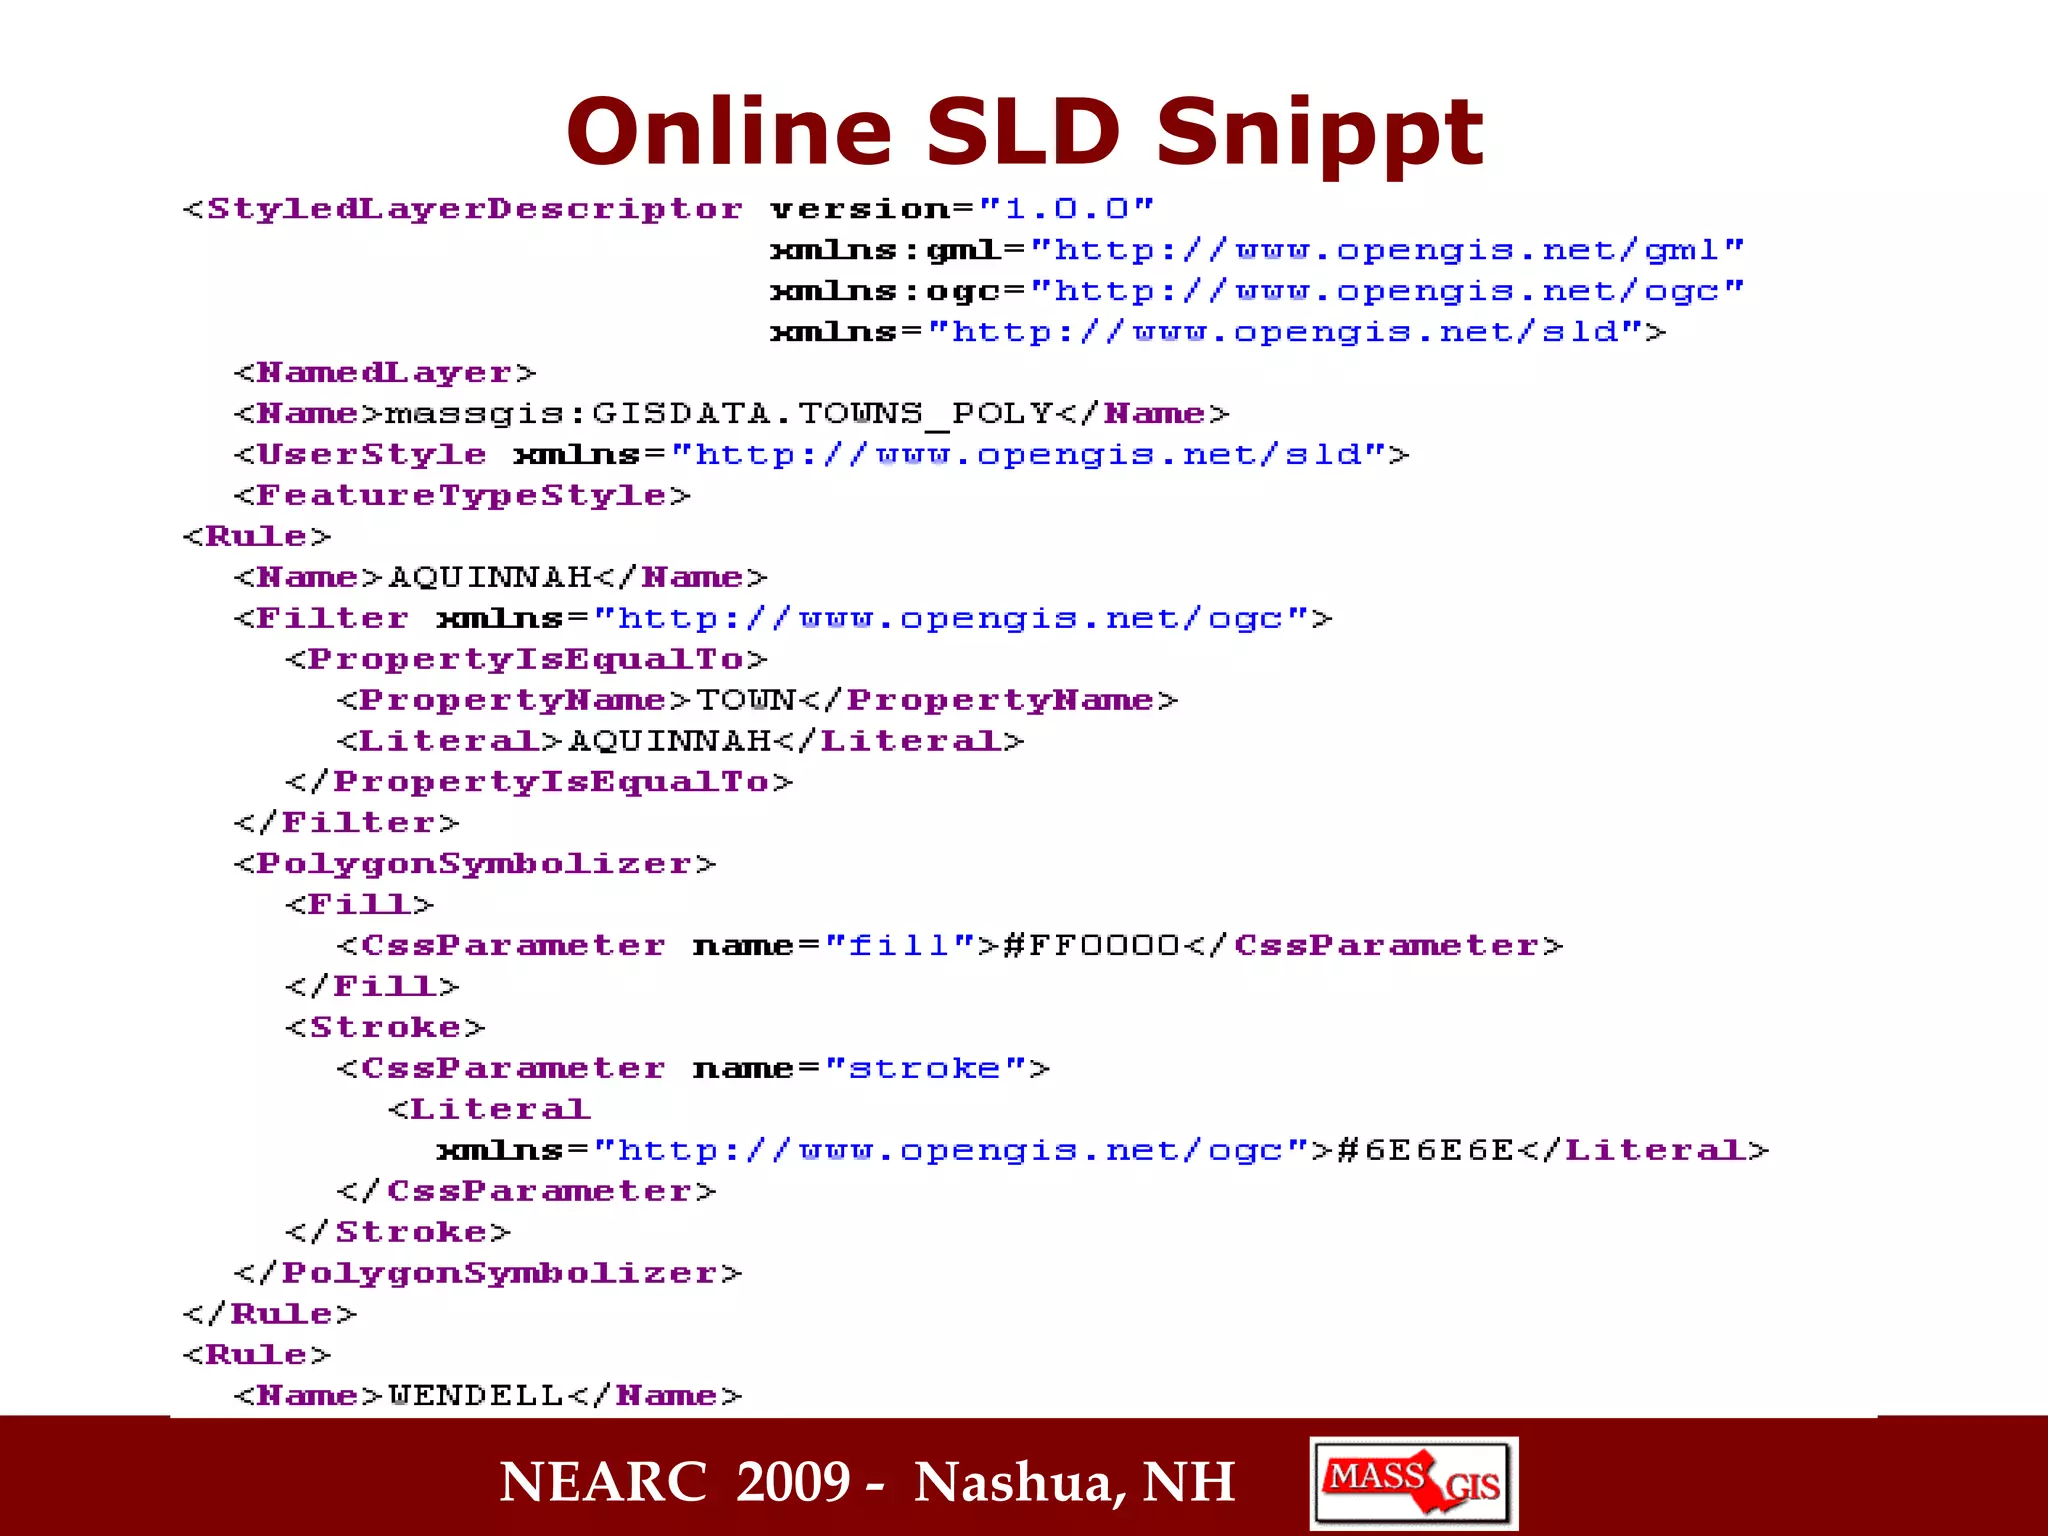
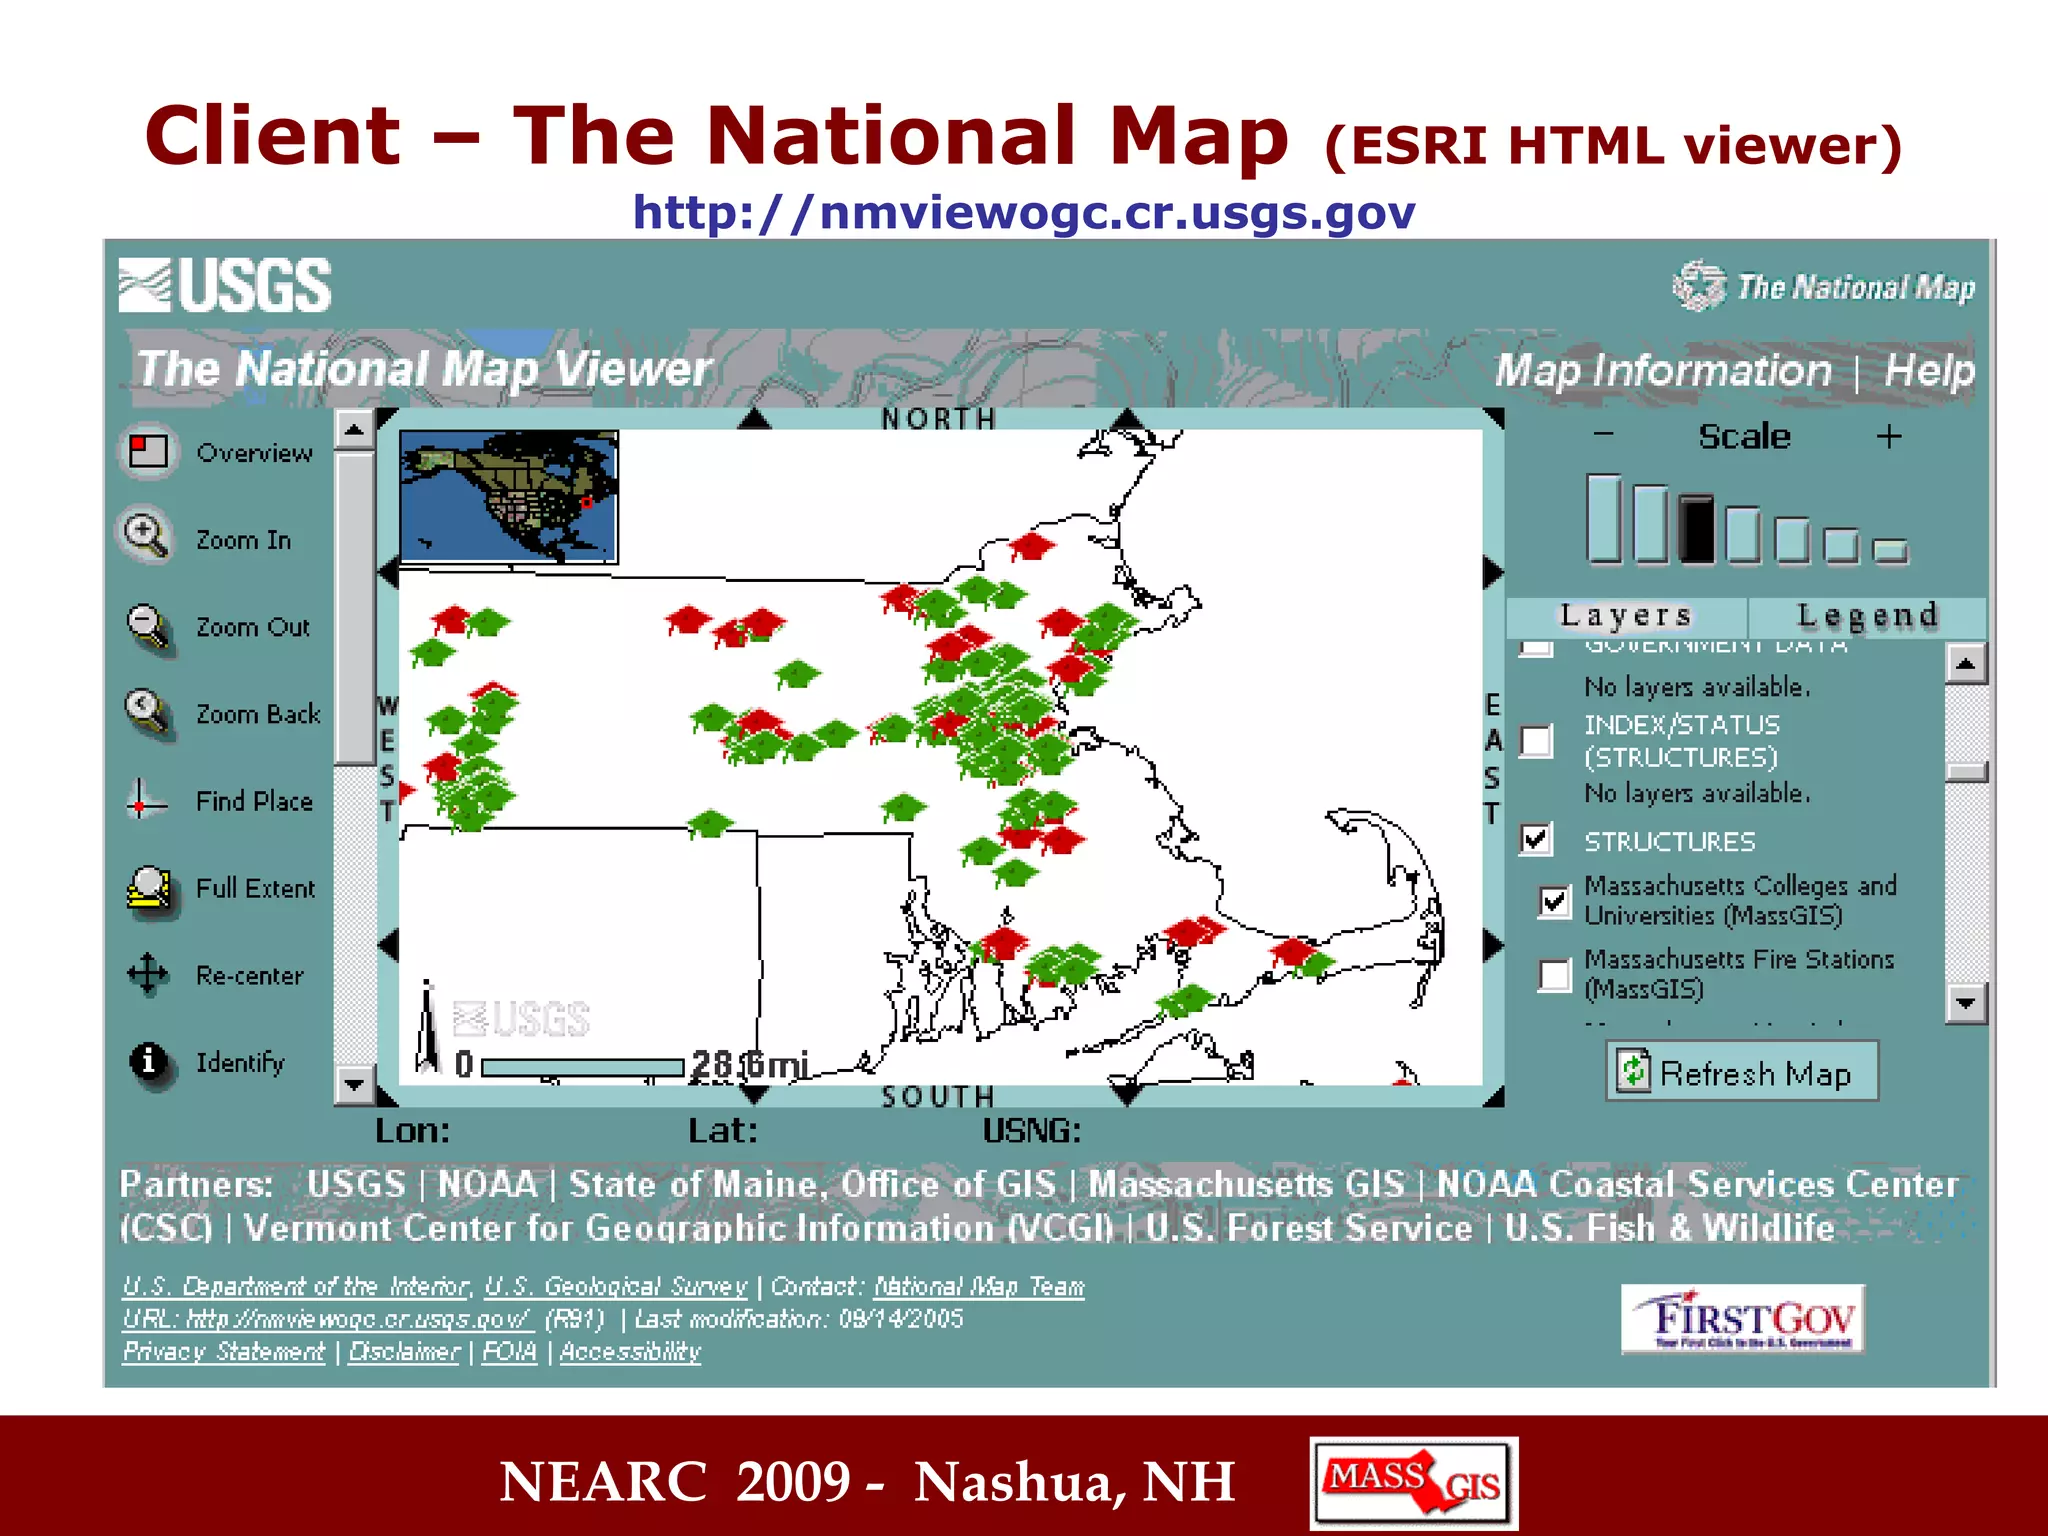
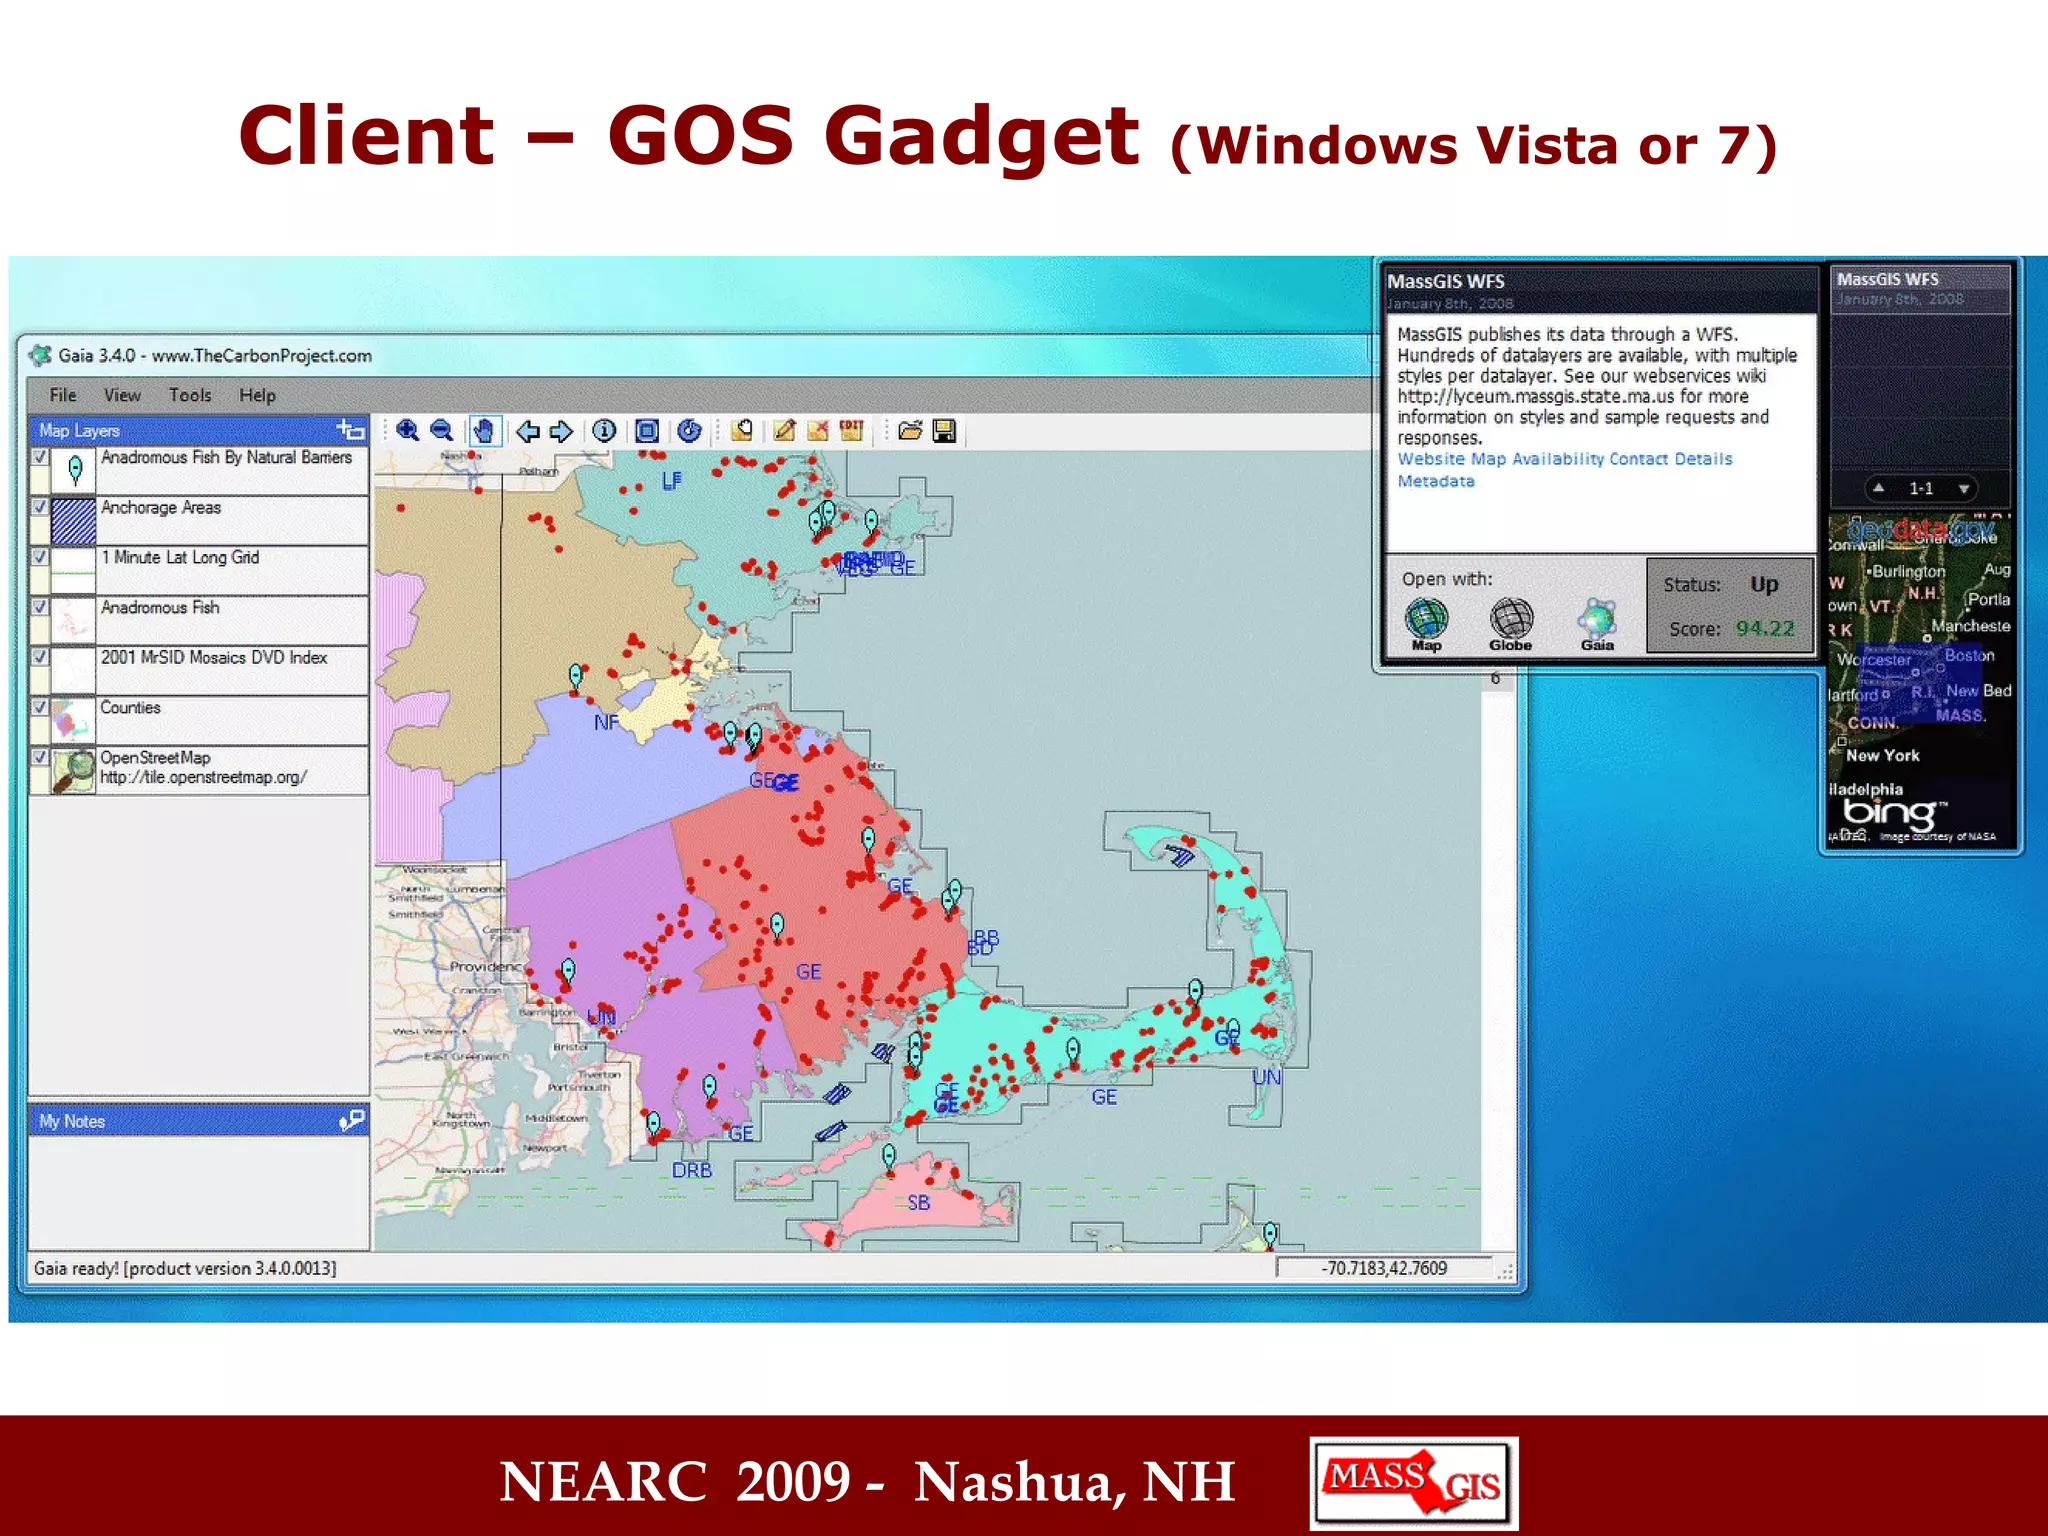
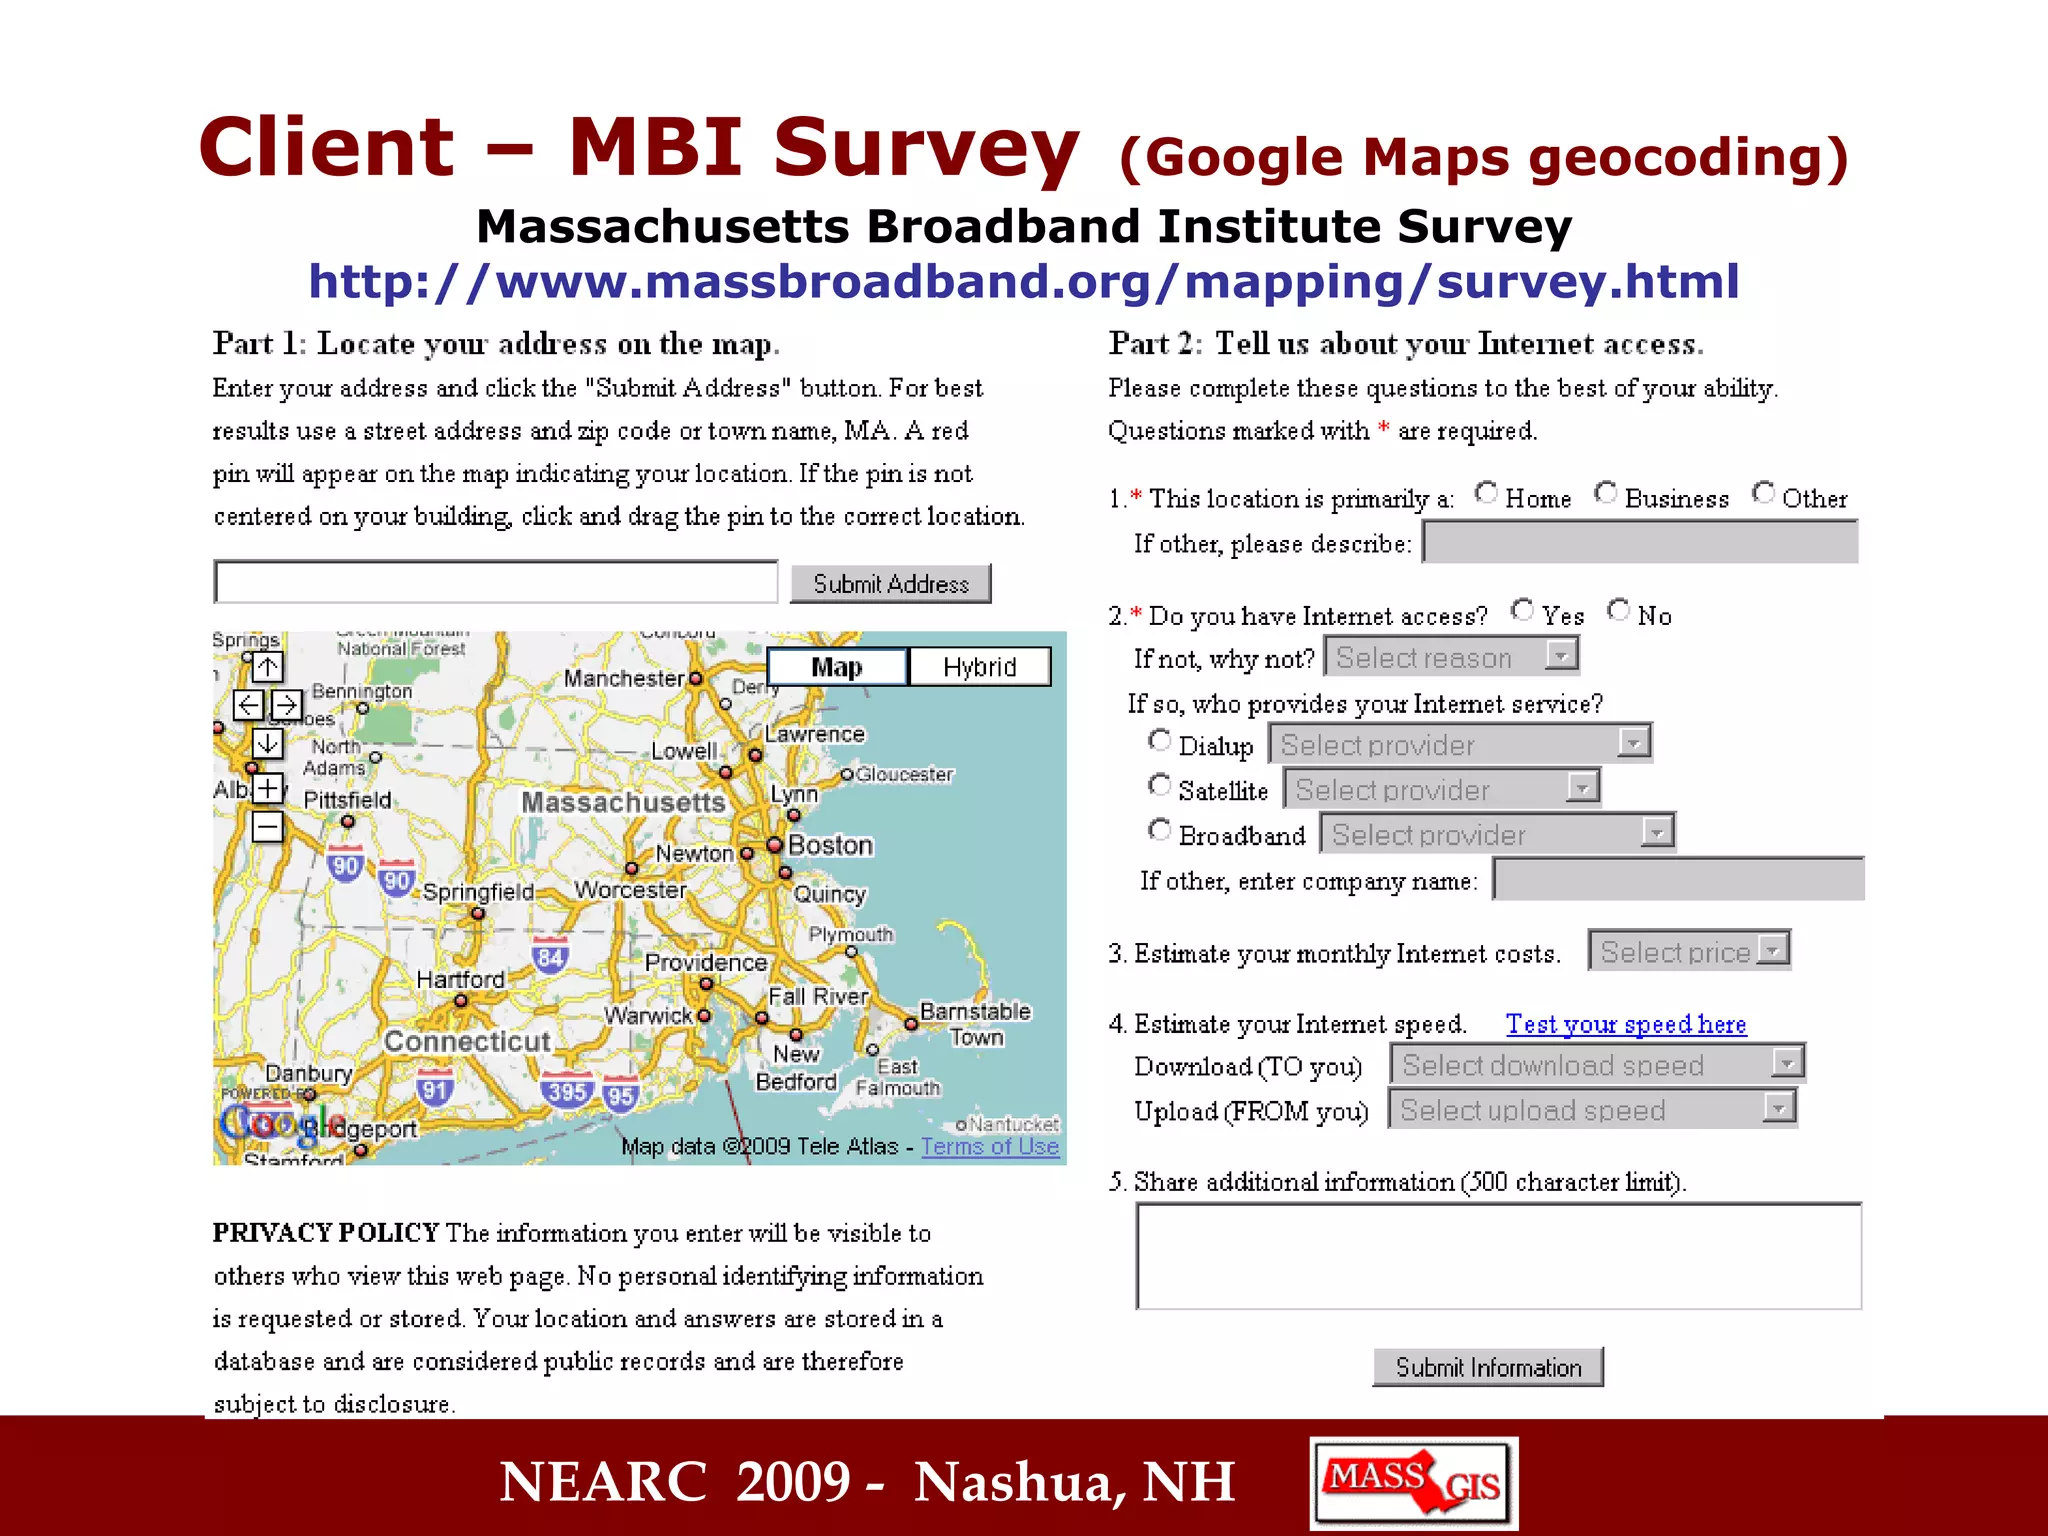
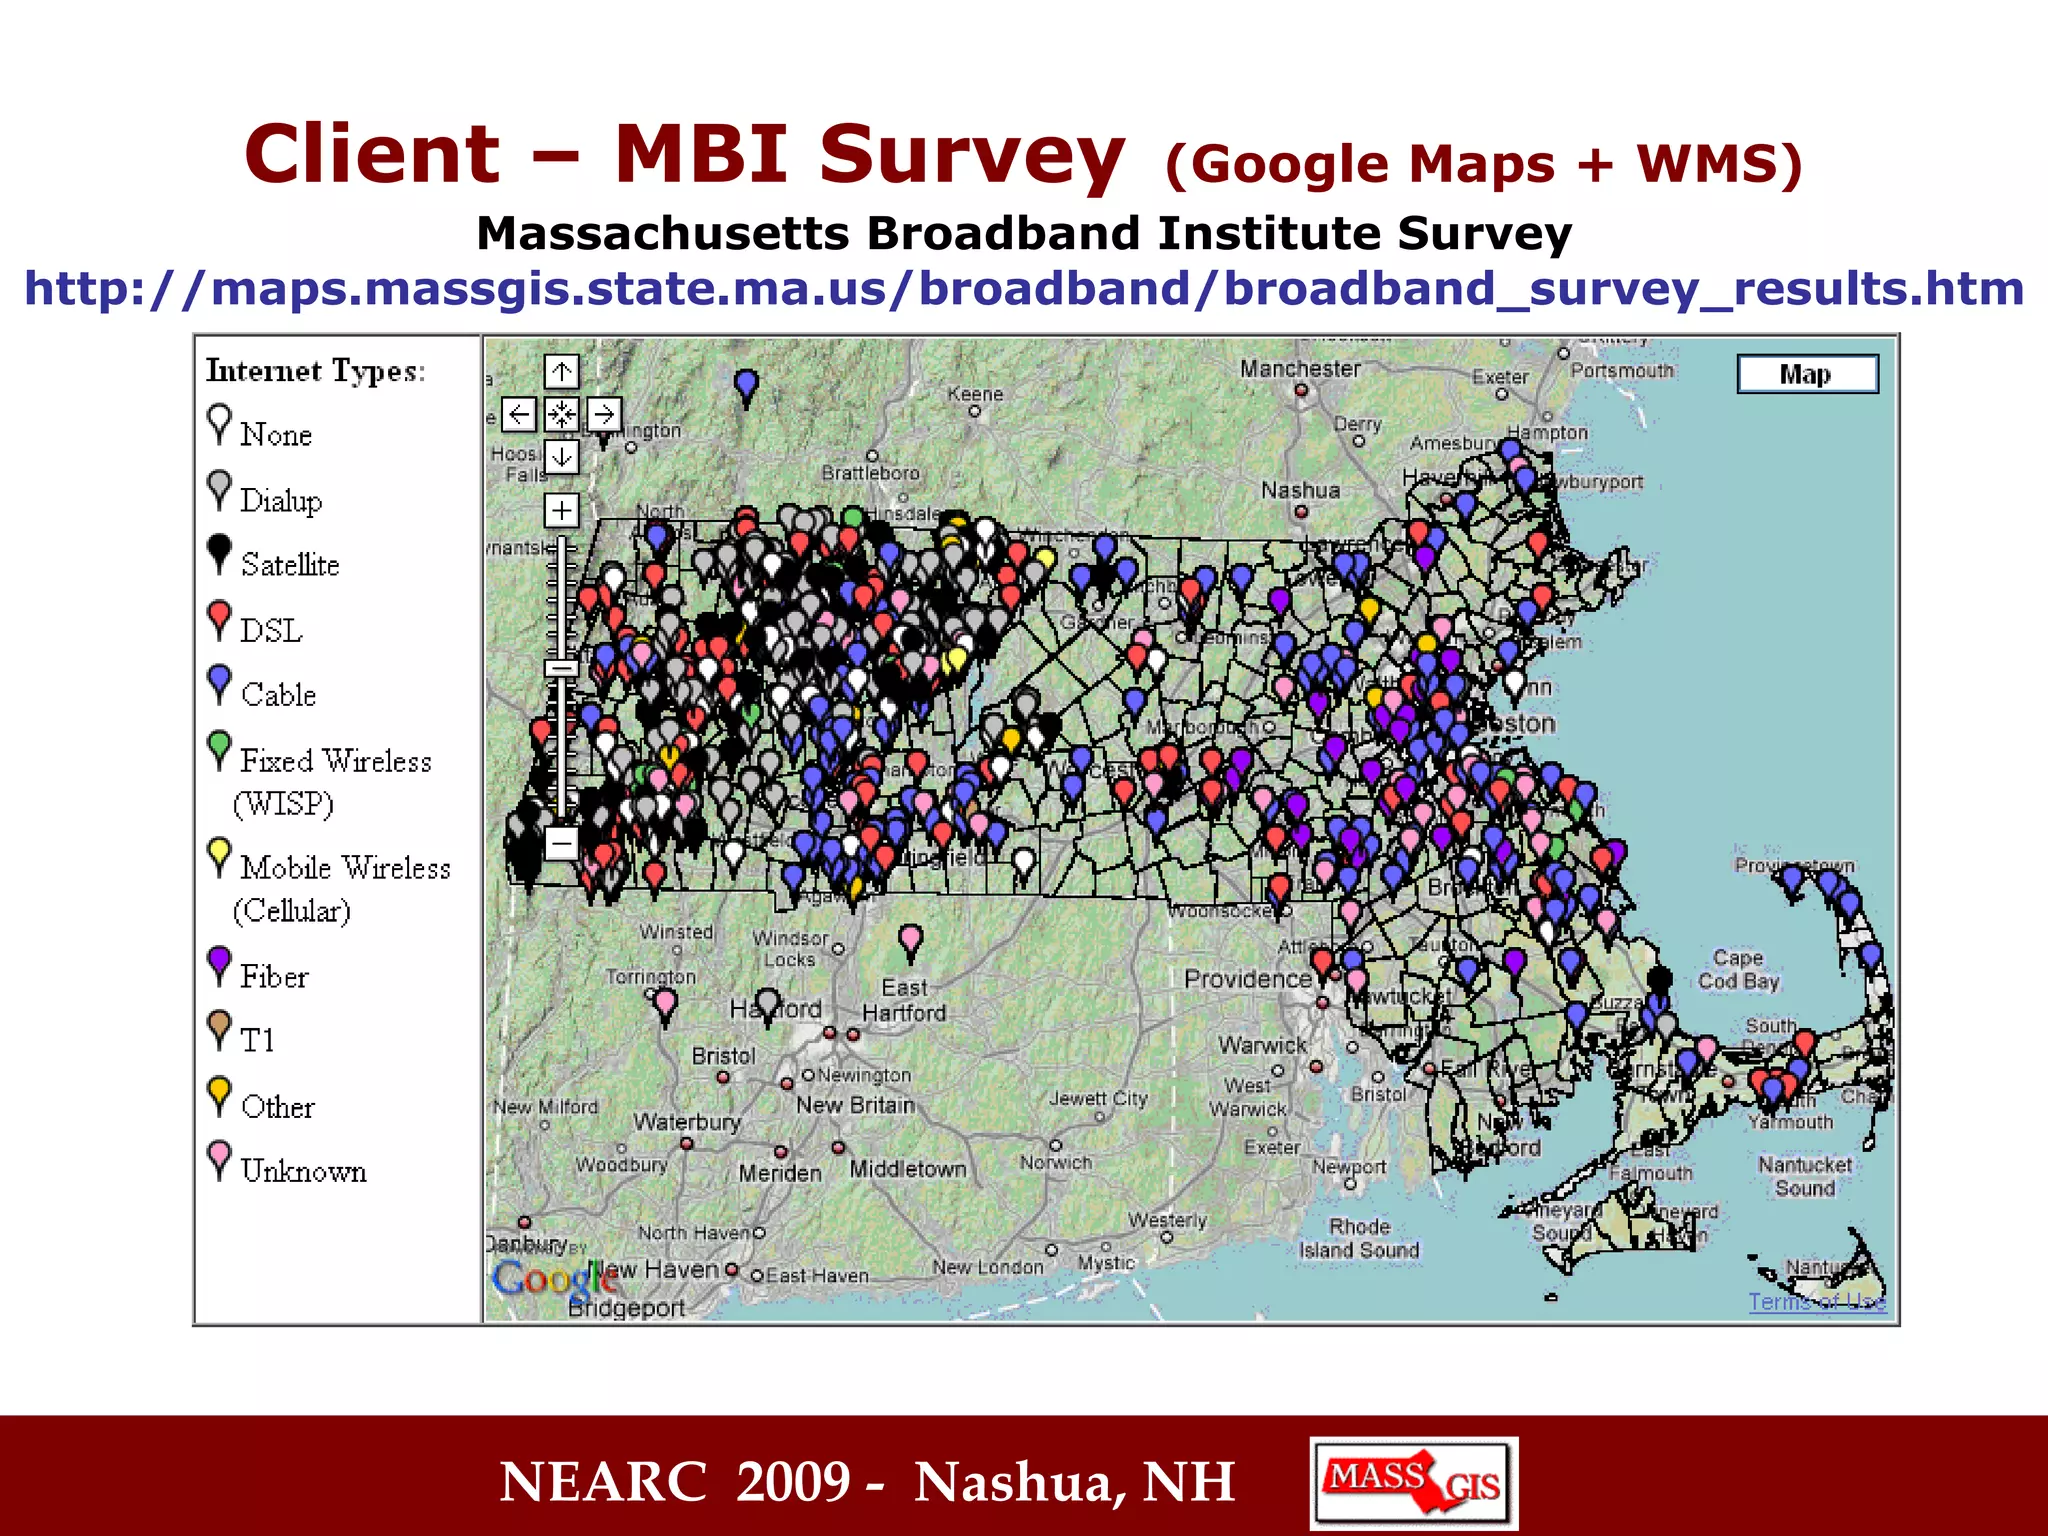
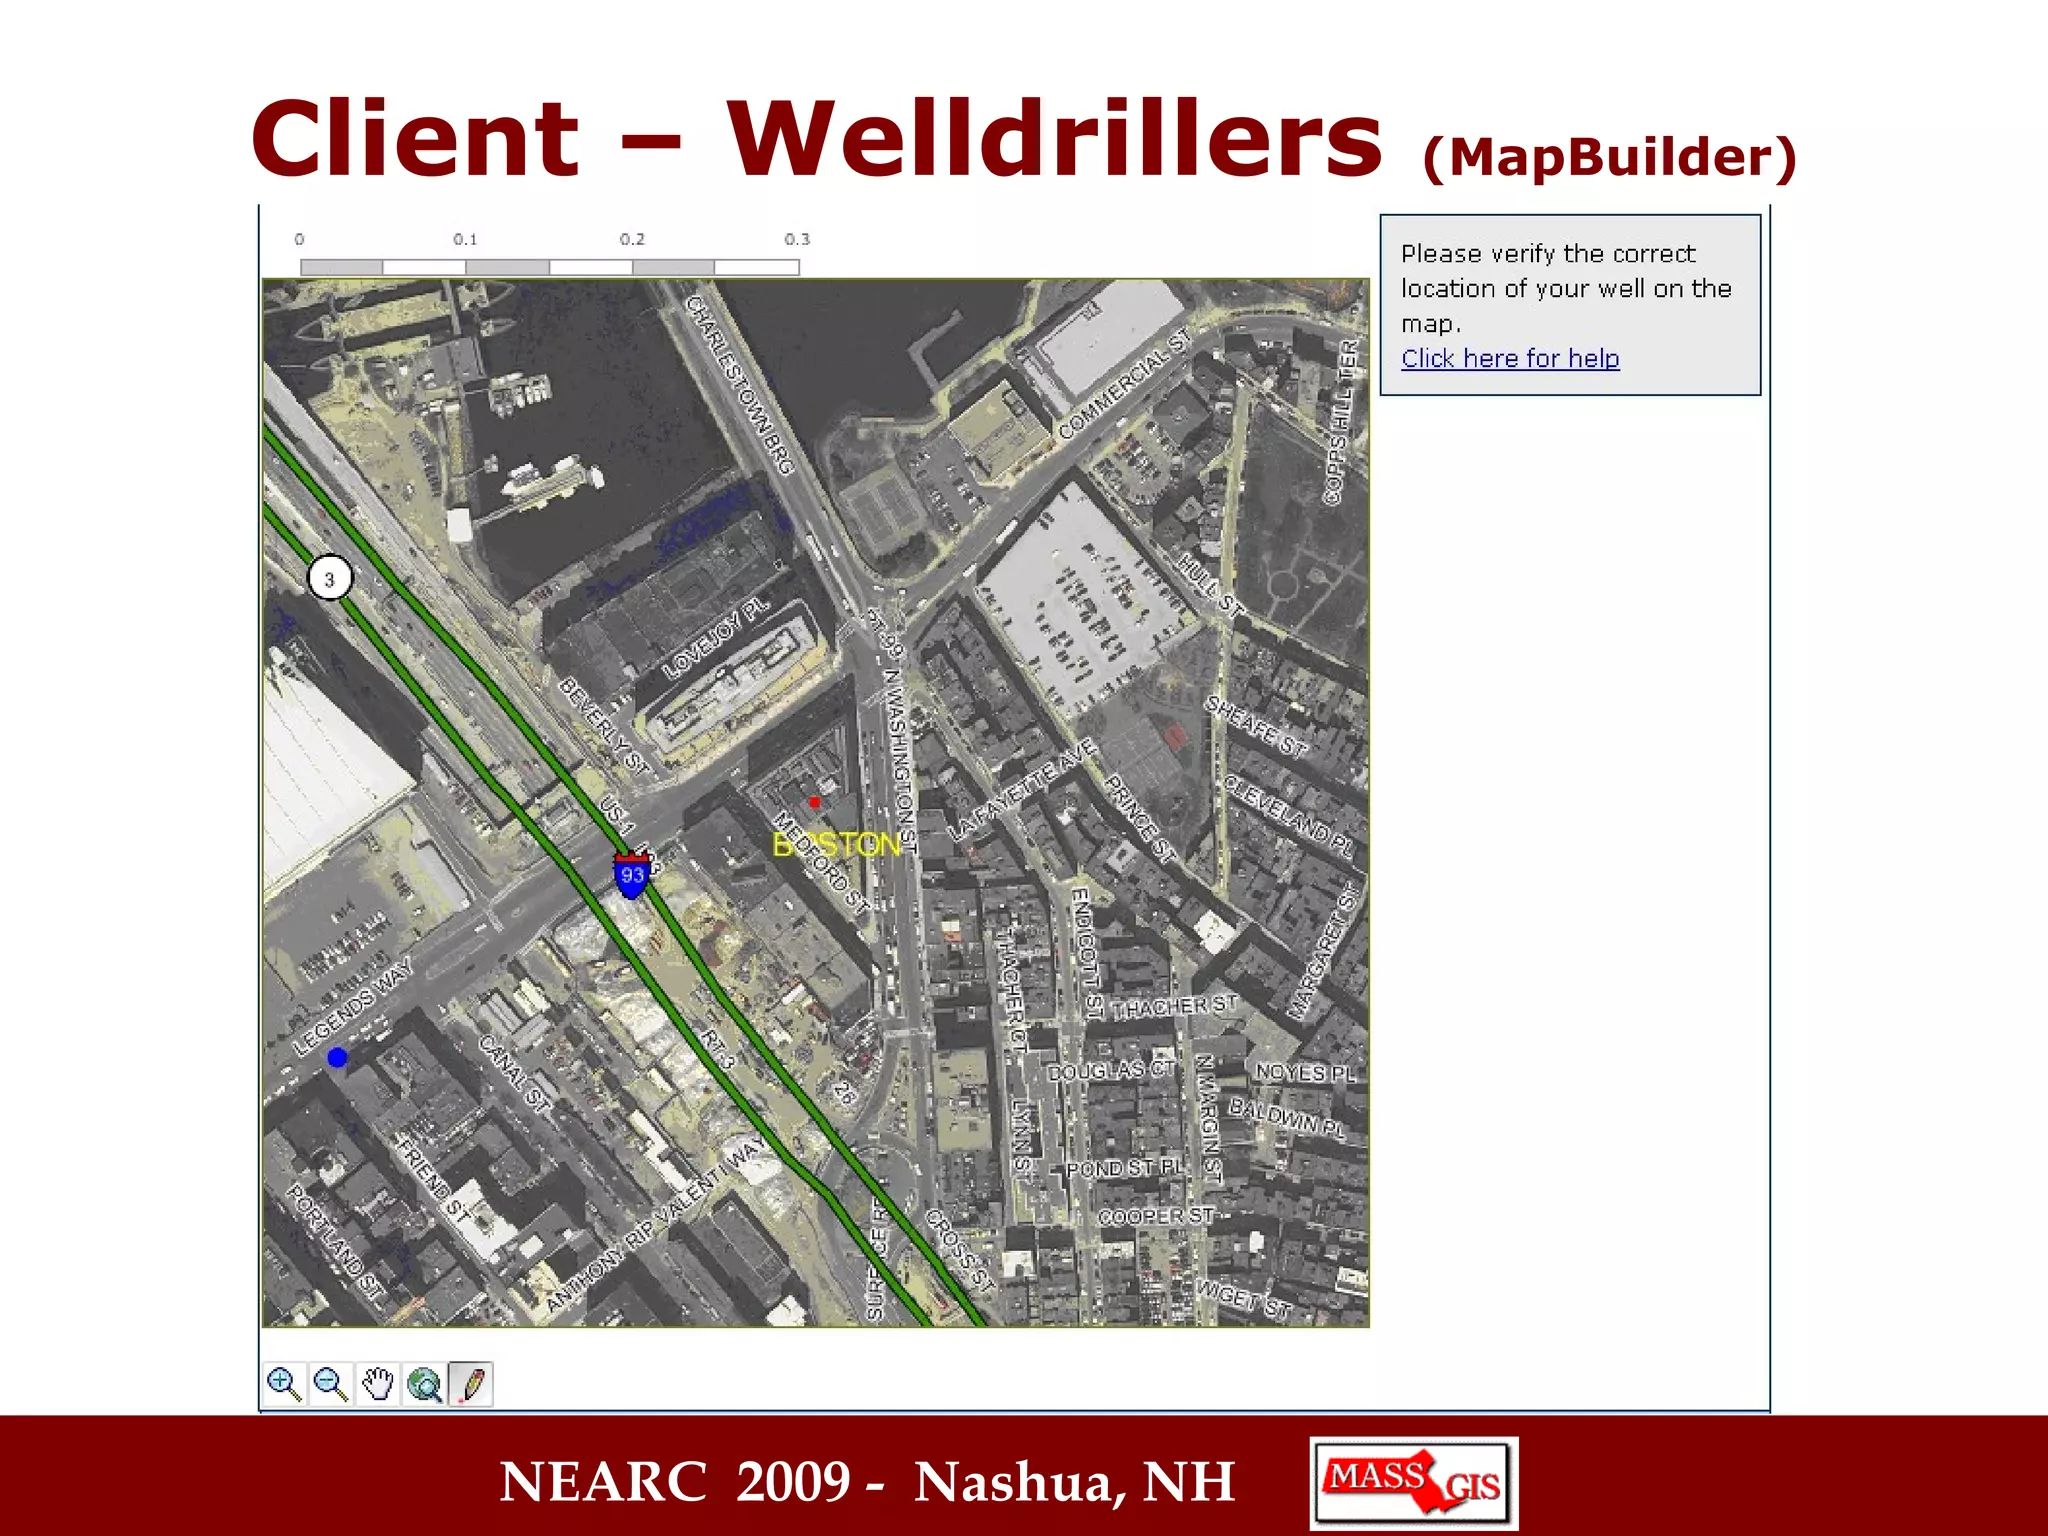
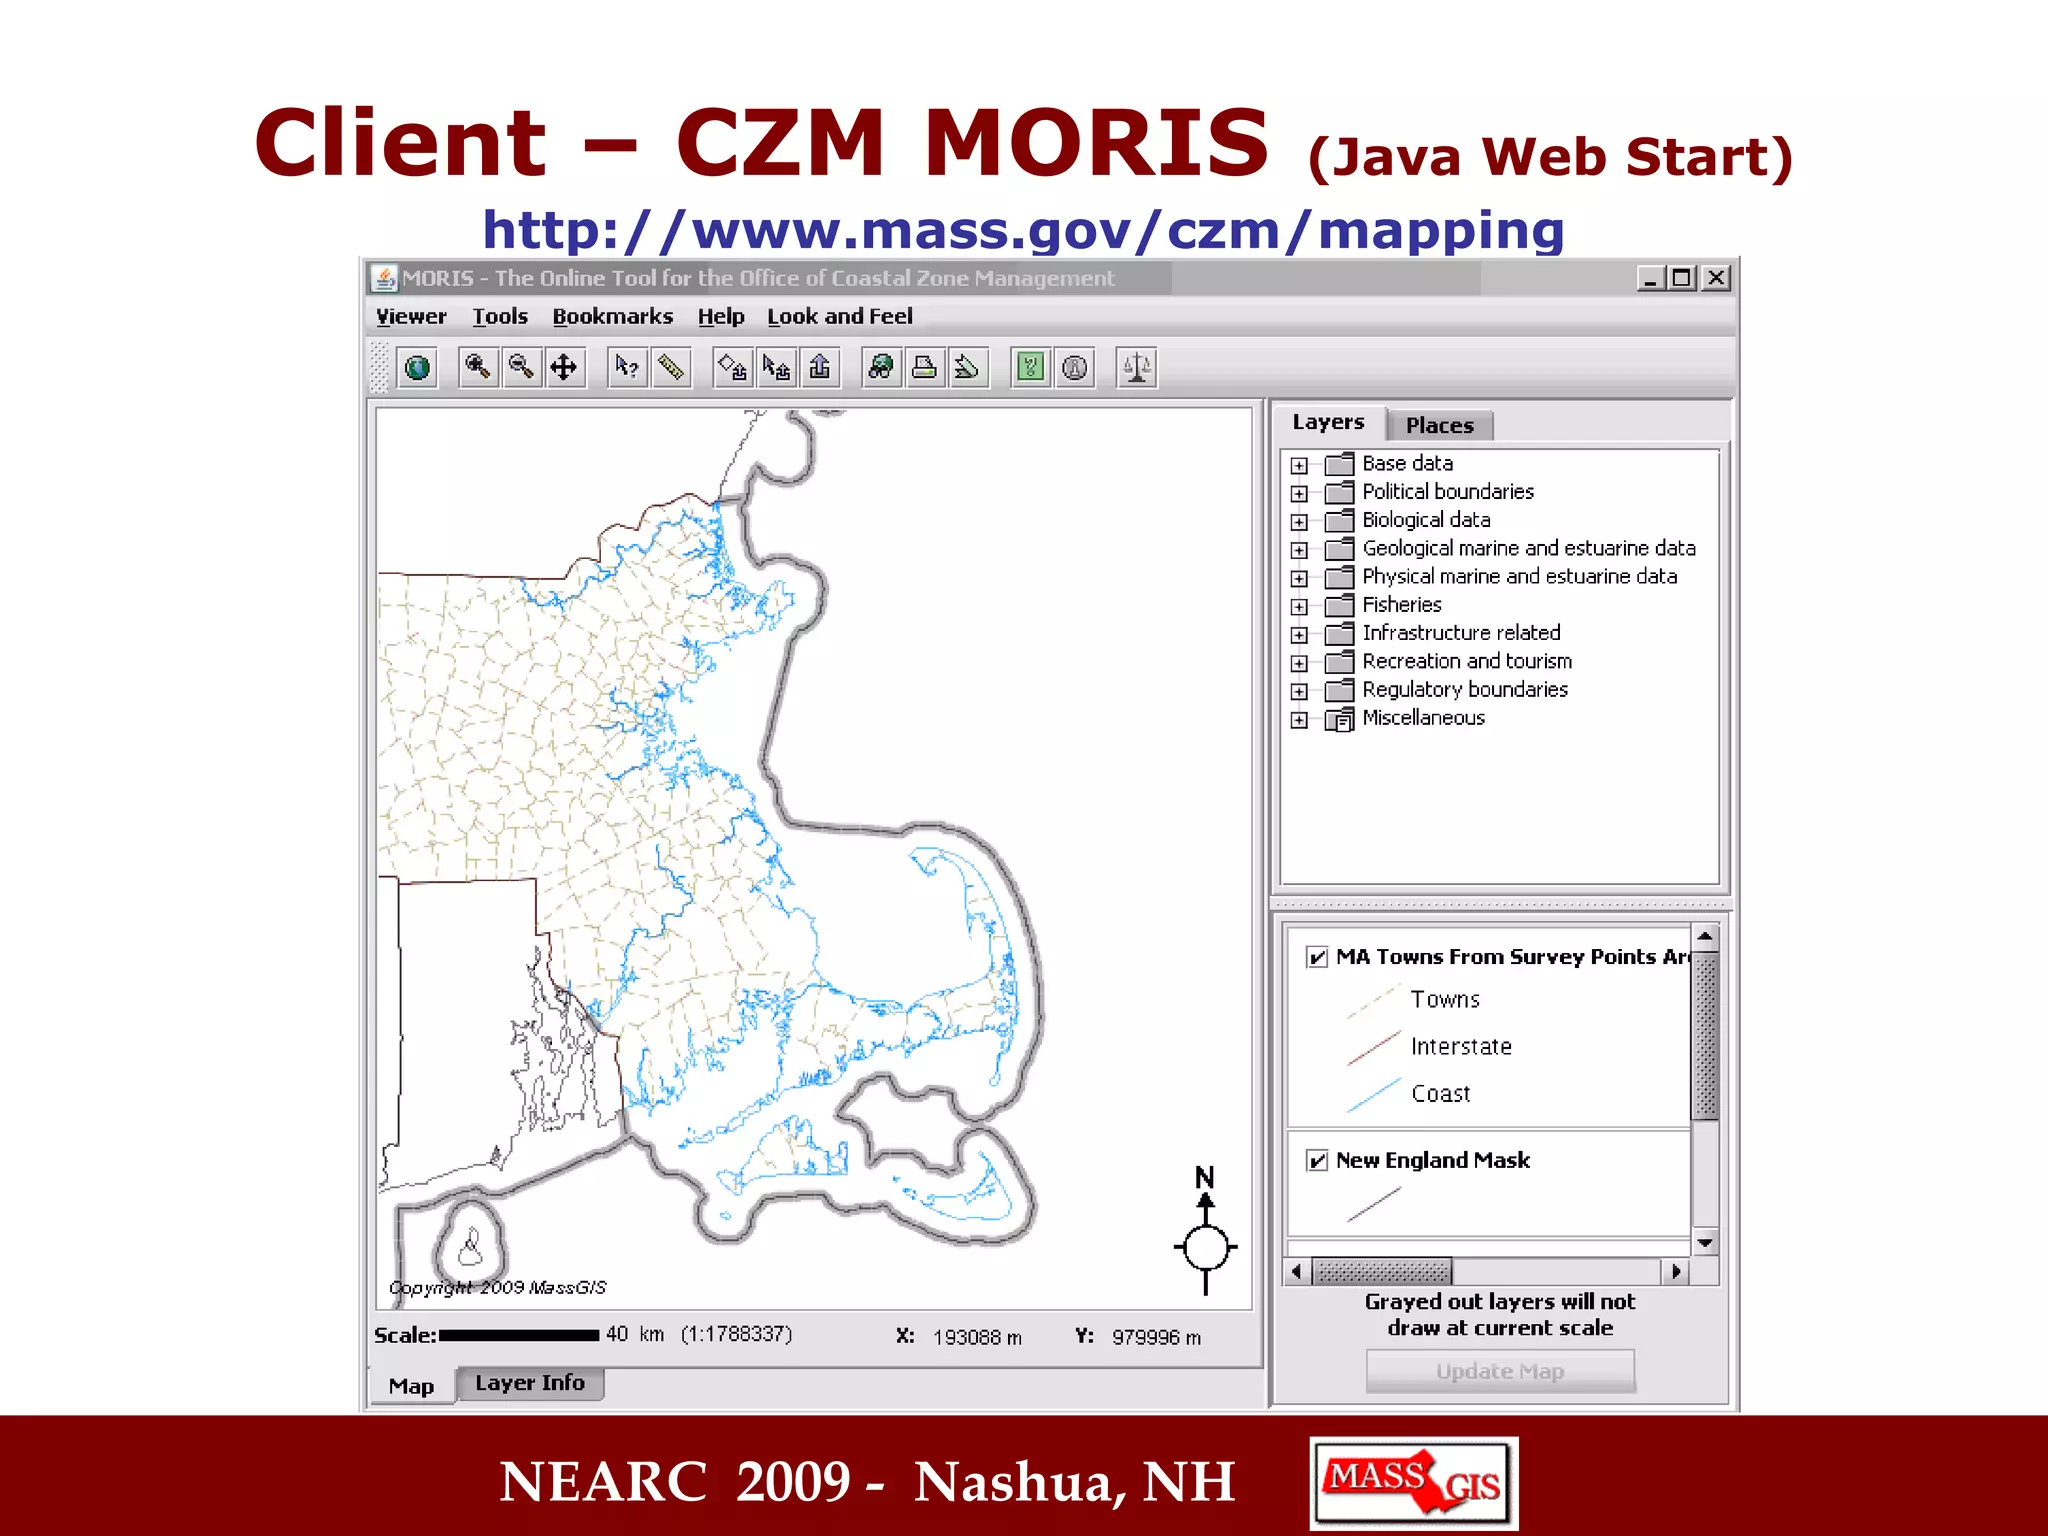
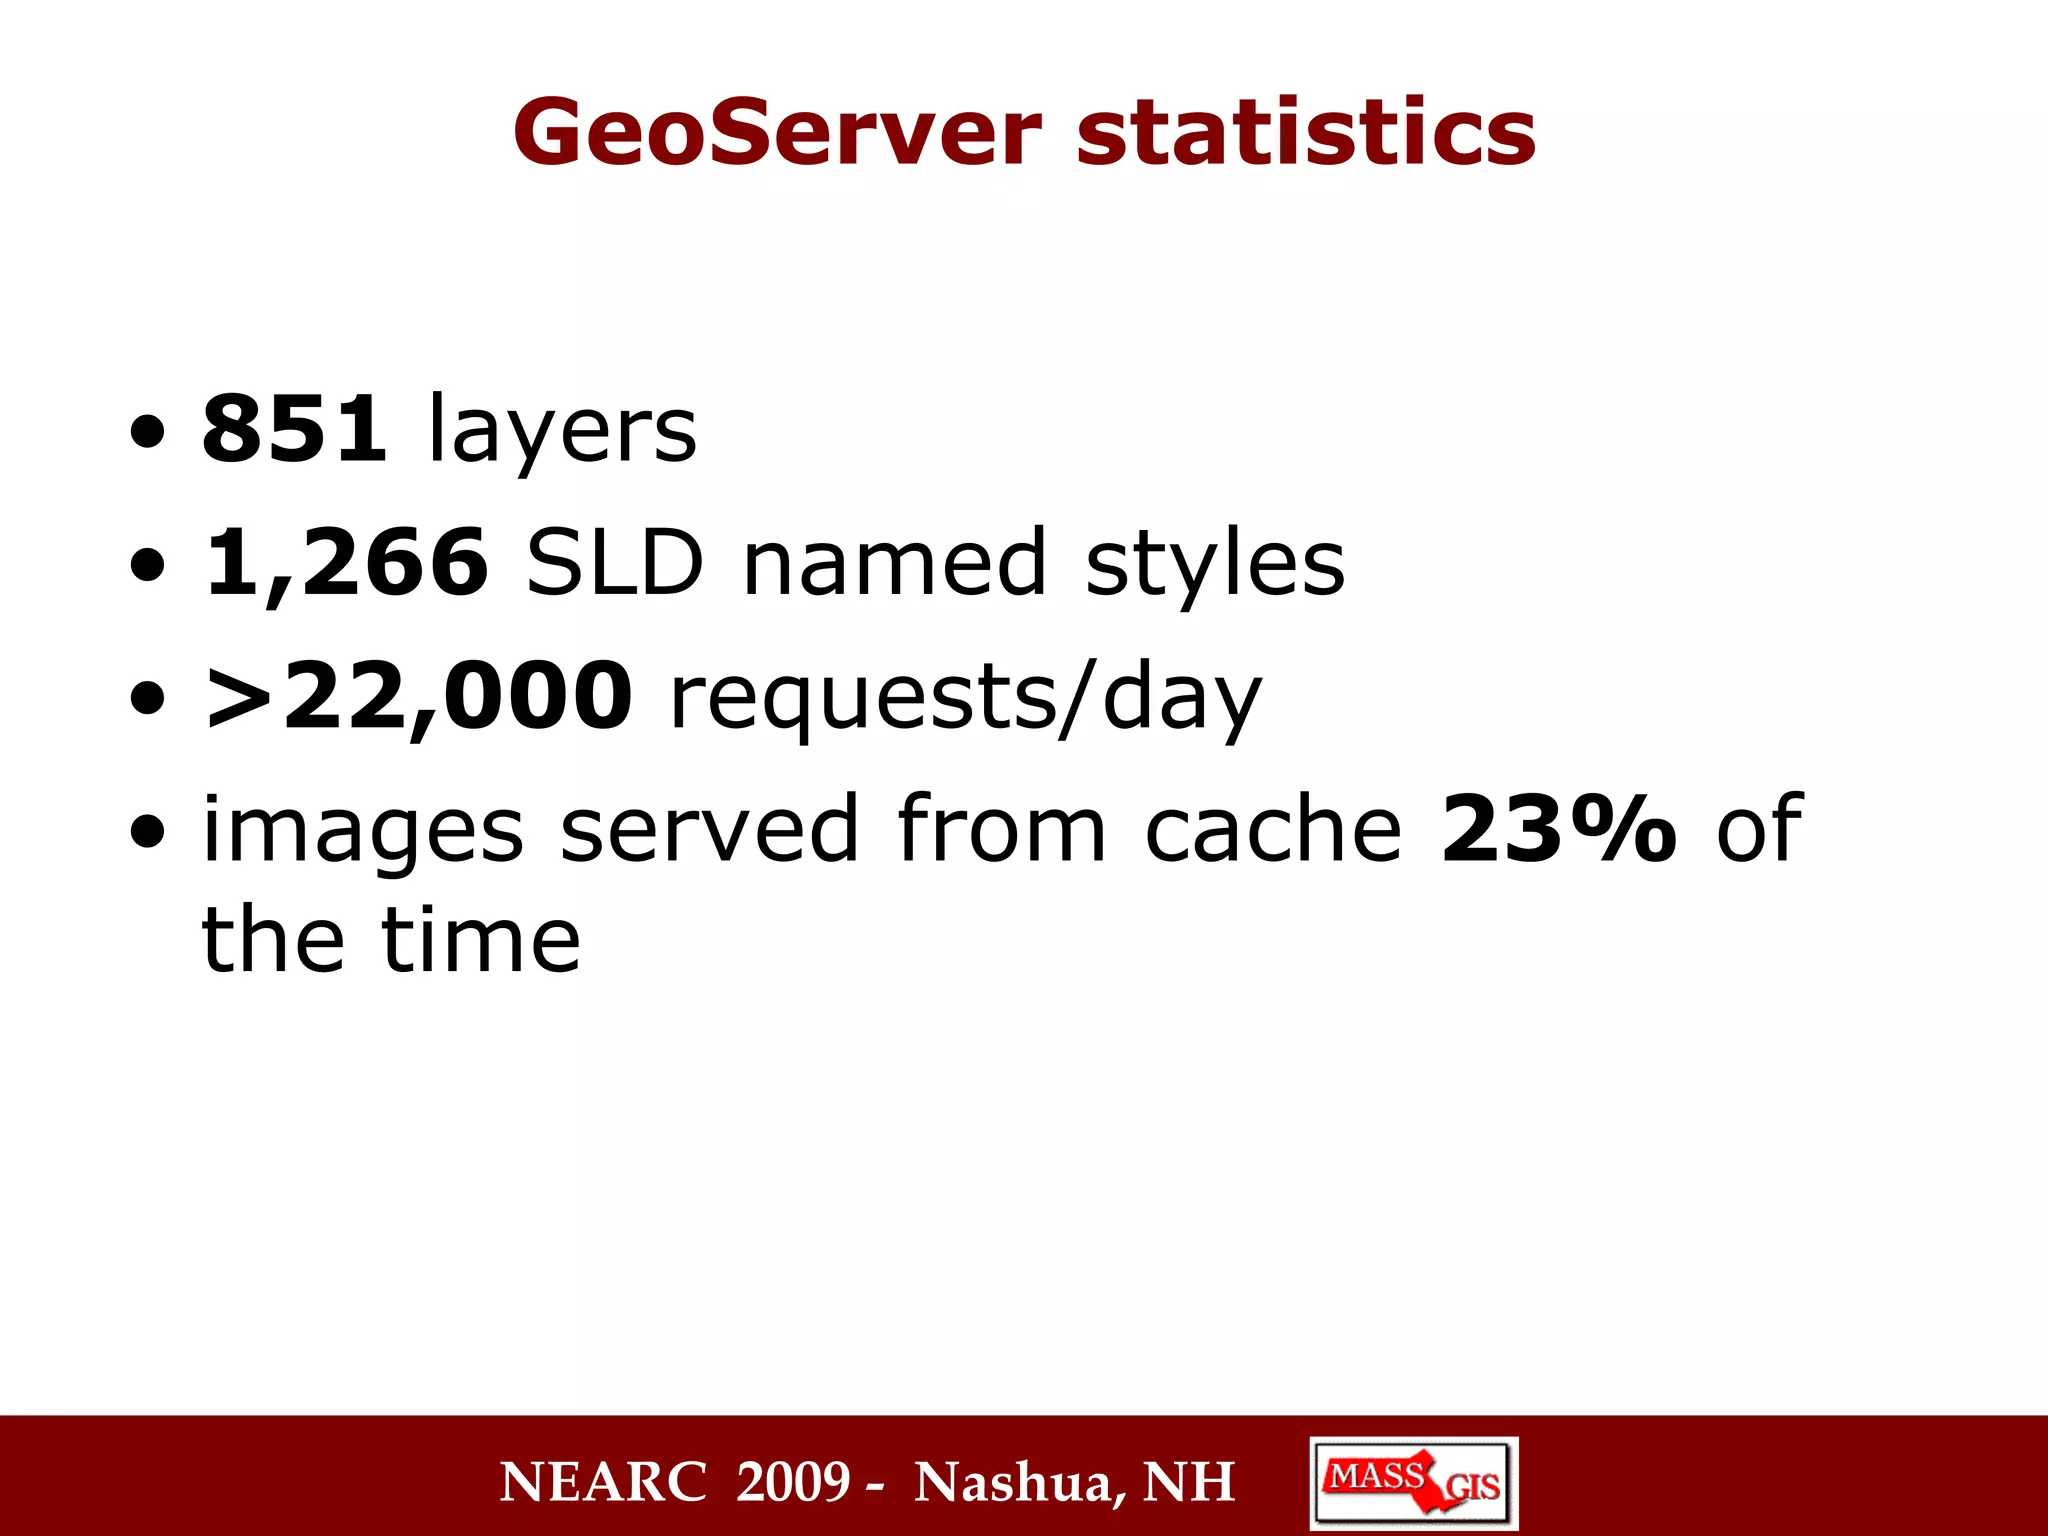
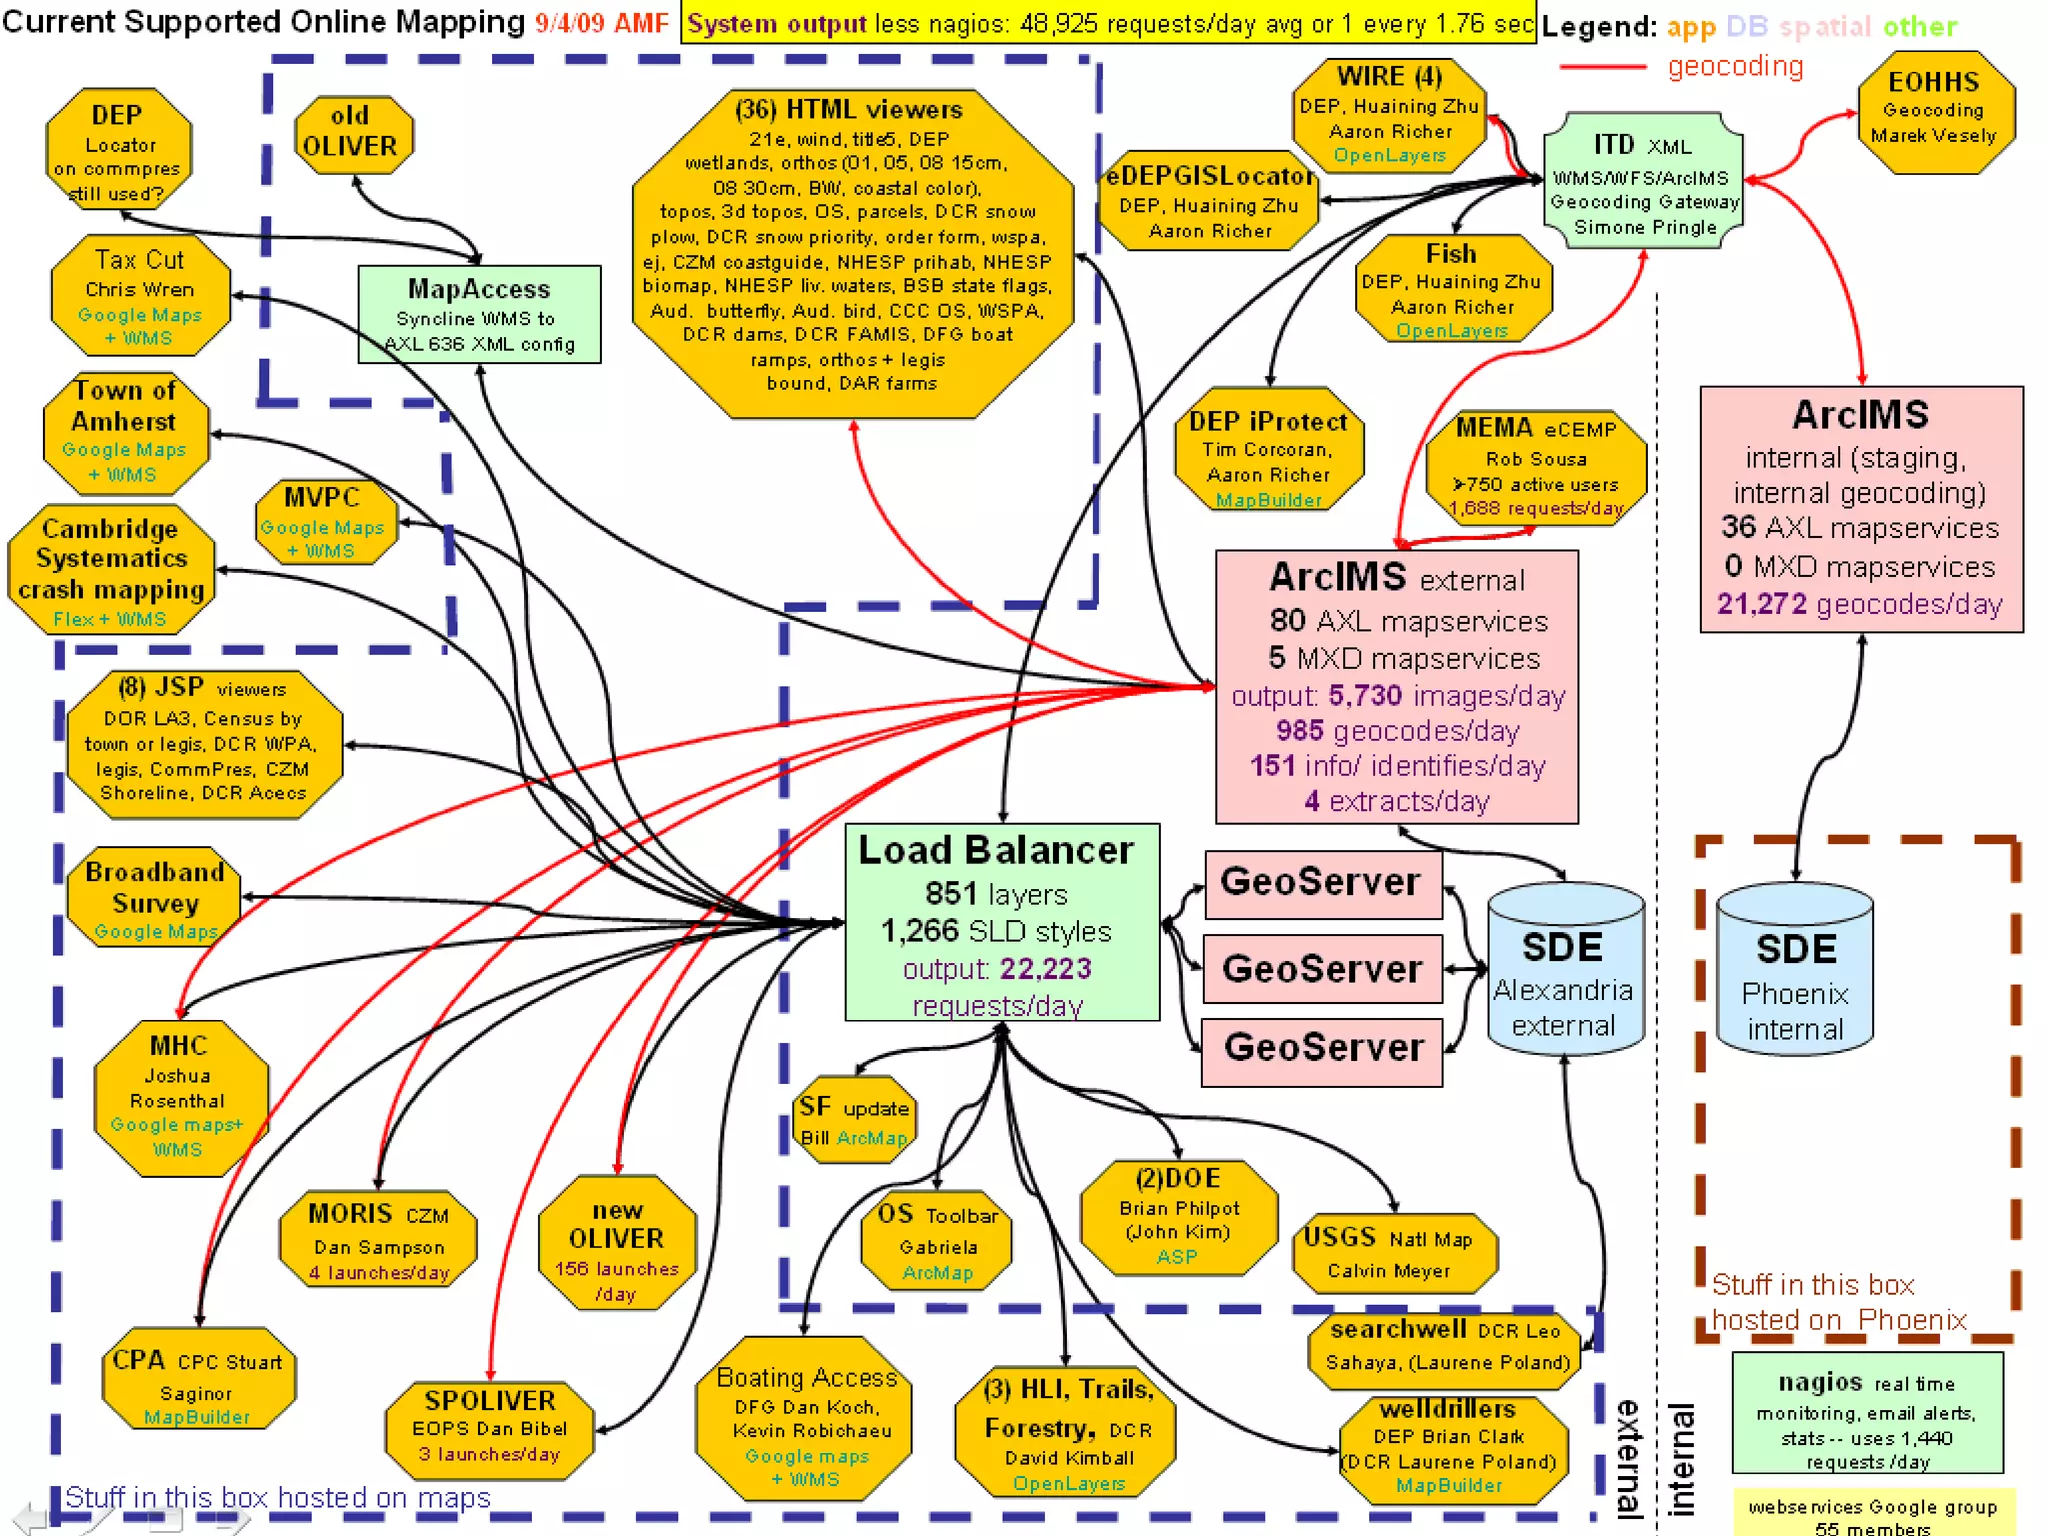
MassGIS provides geographic data and web mapping services to government agencies and the public. It has offered OGC standard web map and feature services since the early 2000s, initially through ArcIMS and now via GeoServer. A variety of desktop and web-based clients can access and display MassGIS data, including ArcGIS, Google Earth, and custom applications created by MassGIS and other organizations for uses like forestry management and broadband surveys. MassGIS services support over 20,000 requests per day and continue to expand their data and capabilities.
WMS Benchmarking presentation and results, from the FOSS4G 2011 event in Denver. 6 different development teams participated in this exercise, to display common data through the WMS standard the fastest. http://2011.foss4g.org/sessions/web-mapping-performance-shootout
WMS Benchmarking presentation and results, from the FOSS4G 2010 event in Barcelona. 8 different development teams participated in this exercise, to display common data through the WMS standard the fastest. http://2010.foss4g.org/wms_benchmarking.php
Slides from my Introduction to PostGIS workshop at the FOSS4G conference in 2009. The material is available at http://revenant.ca/www/postgis/workshop/
Using GeoServer for spatio-temporal data management with examples for MetOc a...GeoSolutions
This presentation will provide detailed information on how to ingest and configure spatio-temporal data in GeoServer, to be served using OGC services, with examples from WMS and WCS services.
Use case of Disaster Management System by using Geopaparazzi and MapGuide Ope...Hirofumi Hayashi
In recent years, large-scale disasters have occurred in the countries of
Asia including Japan, rapid collection and sharing of disaster information
is required in order to provide relief and support speedy restoration
of civic services. This presentation discusses the integration and customization
of FOSS4G field survey tools and Web GIS server to facilitate
aggregation and rapid sharing of disaster related field information.
Further, the system also provide realtime interaction between field party and
coordination team. A case study of practical use of the system at the Osaka Water
General Service (OWGS) Corporation will be demonstrated to present the salient
features of the system. The main capability of the system usability is normal
as well as disaster situation will be highlighted.
Vector Tiles with GeoServer and OpenLayersJody Garnett
The latest release of GeoServer adds support for creating Vector Tiles in GeoJSON, TopoJSON, and MapBox Vector Tiles format through its WMS service for all the vector data formats it supports. These tiles can be cached using GeoWebCache (built into GeoServer), and served with the various tiling protocols (TMS, WMTS, and WMS-C). Thanks to very recent OpenLayers 3 development, these Vector Tiles can be easily and efficiently styled on a map.
This technical talk will look at how GeoServer makes Vector Tiles accessible through standard OGC services and how they differ from normal WMS and WFS usage. It will also look at how OpenLayers 3 - as a simple-to-use vector tiles client - interacts with GeoServer to retrieve tiles and effectively manage and style them. OpenLayer 3’s extensive style infrastructure will be investigated.
State of GeoServer provides an update on our community and reviews the new and noteworthy features for the Project. The community keeps an aggressive six month release cycle with GeoServer 2.8 and 2.9 being released this year.
Each releases bring together exciting new features. This year a lot of work has been done on the user interface, clustering, security and compatibility with the latest Java platform. We will also take a look at community research into vector tiles, multi-resolution raster support and more.
Attend this talk for a cheerful update on what is happening with this popular OSGeo project. Whether you are an expert user, a developer, or simply curious what these projects can do for you, this talk is for you.
Enterprise class deployment for GeoServer and GeoWebcache Optimizing perform...GeoSolutions
Setting up a GeoServer can sometimes be deceptively simple. However, going from proof of concept to production requires a number of steps to be taken in order to optimize the server in terms of availability, performance and scalability. This presentation will show how to get from a basic set up to a battle ready, rock solid installation by showing the ropes an advanced user already mastered.
Accumulo Collections is a lightweight library that dramatically simplifies development of fast NoSQL applications by encapsulating many powerful, distributed features of Accumulo in the familiar Java Collections interface. Accumulo is a giant sorted map with rich server-side functionality, and our AccumuloSortedMap is a robust java SortedMap implementation that is backed by an Accumulo table. It handles serialization and foreign keys, and provides extensive server-side features like entry timeout, aggregates, filtering, efficient one-to-many mapping, partitioning and sampling. Users can define custom server-side transformations and aggregates with Accumulo iterators.
More information on this project can be found on github at: https://github.com/isentropy/accumulo-collections/wiki
– Speaker –
Jonathan Wolff
Founder, Director of Engineering, Isentropy LLC
Jonathan is an ex-physicist who operates a consultancy specializing in big data and data science project work. He worked for Bloomberg last year and built their Accumulo File System, which was presented as 2015 Accumulo Summit's keynote speech. He's also done distributed computing project work for Yahoo! in Pig.
Jonathan holds a BA in Physics (Harvard, magna cum laude 2001) and an MS in Mechanical Engineering (Columbia, 2003), and has been avidly programming since the 1980's.
— More Information —
For more information see http://www.accumulosummit.com/
Presented by Patrick Woerner and John Reiser at the Northeast Arc Users Group, November 10, 2015.
Wildlife habitat change trend information is a necessary and fundamental component for successful assessment and management of wildlife species. Habitat loss and fragmentation continue to be the two most serious threats to wildlife populations. To effectively protect endangered and threatened species populations and to evaluate protection and management efforts, it is important for wildlife agencies to actively identify and monitor habitat for each listed species. New Jersey’s Division of Fish and Wildlife adopted a habitat change analysis approach to track wildlife habitat transition and fragmentation trends over time. The programmatic GIS analysis approach extracts potential habitat from available Land Use/Land Cover (LULC) data based on species habitat associations and range extents. The analysis spans four time periods between 1986 and 2012. Analysis outputs provide readily available, up-to-date, multi-level, species-specific habitat change information to support agency initiatives. Resulting maps and data serve as a guide to help prioritize work for particular species and their habitats and provide baseline information for the development of species status assessments and recovery plans. Outputs also provide a basis for additional analyses such as evaluating habitat change in regulated vs. unregulated areas, evaluating habitat conservation planning efforts, and other land-use planning, land management and preservation efforts.
This is lecture of Advanced GIS (ITM 524), MSc in Information Technology for Natural Resources Management, Bogor Agricultural University.
This topics covered: Internet & World Wide Web, Web Mapping, Internet GIS, Web Mapping Services Model, Spatial Data Infrastructure.
A talk I gave at the 2014 MAC URISA Conference in Atlantic City. Often, GIS users have little exposure to SQL. This talk gives a brief overview to SQL from a GIS users' perspective, and provides some examples of how it can be used in place of common ArcGIS/desktop GIS tasks to improve efficiency.
Python and GIS: Improving Your WorkflowJohn Reiser
A 40 minute talk on using Python with GIS software. Integration with ArcGIS and open source software is demonstrated. Includes links to several Python-based projects on Github. Presented at the Delaware Valley Regional Planning Commission's Information Resource Exchange Group on December 9th, 2015.
The main focus of this study is to find appropriate and stable solutions for representing the statistical data into map with some special features. This research also includes the comparison between different solutions for specific features. In this research I have found three solutions using three different technologies namely Oracle MapViewer, QGIS and AnyMap which are different solutions with different specialties. Each solution has its own specialty so we can choose any solution for representing the statistical data into maps depending on our criteria’s.
THE OGC STANDARDS AND GEO-PLATFORM BASED WEB APPLICATION FOR SEISMIC EVENTS M...Lorenzo Amato
SUSTAINABILITY & SECURITY APPLICATIONS FOR GEO-RISK-PREVENTION & ENVIRO-DISASTER-PROTECTION
GRENZÜBERSCHREITENDES SÄCHSISCHES GI/GIS/GDI-FORUM AM 29./30. APRIL 2013 IN DRESDEN
The development of a Geographic Information System for traffic route planni...Matthew Pulis
This was my MSc. Informatics thesis. The project started with a Literature Review studying the historic advancements of Location Based Services and Geographic Information Systems, in particular Open Source GIS. Case Studies were reviewed so as to gain knowledge from past experiences. The methodology used for this project followed the DSDM methodology and requirements were drawn following the MoSCoW priorities. A full working version of the project which is presented in
a Web Interface can be accessed online.
Lecture delivered for Prof. Terry Slocum's Geography Seminar (Geog 911) on Neogeography at the University of Kansas (23Feb2010) . Reviews my research on GIS 2.0, its impact on humanitarian information management, and discusses a class project.
Local GIS/GPS specialist Lisa Arnold will introduce you to geographic information systems and demonstrate how to translate geographic information onto the web:
* Why geographic location — "where" — matters
* Options available for delivering maps on the web
* Focus on ESRI's ArcGIS mapping software utilizing the ArcGIS API for Flex.
First unit lecture for John Reiser's GIS II course offered Spring 2011 at Rowan University, Glassboro, NJ.
Materials are released under a CC BY-NC-SA 3.0 license: http://creativecommons.org/licenses/by-nc-sa/3.0/
Smart Client Smart Applications_Ciaran Kirk - Intergraph Geospatial World Tou...IMGS
Organisations need GeoMedia Smart Client because it enables them to implement geospatial business workflows that are not supported by out-of-the-box products, in an easy and sustainable way across the enterprise.
1. Using a Mix of Technologies to Collect and Present Geographic Information on the Web (or desktop) Aleda Freeman MassGIS (Office of Geographic and Environmental Information) Executive Office of Energy and Environmental Affairs (EOEEA) http://maps.massgis.state.ma.us/temp/NEARC_webservices_09.ppt
2.
3.
4.
5.
6. Current Online Mapping map servers data storage types of applications OpenLayers MapBuilder ESRI ArcMap iPhone Flash uDig Gaia Google maps Google Earth desktop browser SDE with Oracle ESRI ArcIMS GeoServer
26. Client – CZM MORIS (Java Web Start) http://www.mass.gov/czm/mapping
27.
28.
29.
30.
31.
32. MassGIS Webservices Info http://lyceum.massgis.state.ma.us Working examples of requests and responses with MassGIS data Subscribe via RSS for updates http://www.mass.gov/mgis/mapping.htm Links to many online mapping applications http://groups.google.com/group/massgis_webservices Public Google group for users (56) of the services http://spatialreference.org Look up EPSG code values for projections http://maps.massgis.state.ma.us/temp/NEARC_webservices_09.ppt This Powerpoint
33.
Editor's Notes
Examples = the mechanics of how to connect to the map services and use them Showcase – give you an idea of different ways agencies are using the services So I can figure out how much time to spend on the middle part – can I get a quick show of hands – 1) How many people are familiar with web map services? 2) How many people have connected to an used the MassGIS web map services
We collect, but also create data, and distribute through FTP download, CD/DVD, paper maps, online viewers, and web map services. The current map services systems are going to be the focus of my talk today.
Since we have a lot of different types of users it helps to provide data in a lot of different ways, including different image formats and projections.
In addition to distributing data through paper maps, CDs and FTP, MassGIS has always been interested in distrubuting data as maps over the web. For online mapping MassGIS has used a variety of map severs to serve data. ArcIMS is still used to support a variety of onling mapping applications and continues to be our geocoding server. MassGIS has always preferred to keep it’s data in one database. In the late 1990s we used ESRI’s Librarian and then we migrated to Oracle and SDE which we still use today. What we seeing more today though is the ability to mix and match technologies. Even though we committed to SDE, since GeoServer can read SDE data we can use that as another option in our map serving collection.
Here is where the mix of technologies starts to become evident. We have the complete set of data stored in Oracle with SDE on top. Another mixing of technologies is that SDE itself can work with many different brands of databases. Then we have ArcIMS and GeoServer reading the data from SDE. At first GeoServer couldn’t read all of our raster data from SDE so MassGIS with support from the Massachusetts Ocean Partnership sponsored improvements to GeoServer and now all the MassGIS data layers are available through both map servers. MassGIS tends to use ArcIMS to present composed maps and GeoServer to present individual layers for mixing and matching on your own. There are many types of applications that can connect to map data from ArcIMS or GeoSErver and can be either desktop or browser applications or even iPhone applications. All of the orange applications can connect to GeoServer and many can connect to ArcIMS. ArcIMS provides addess matching or geocoding to any application that needs it, GeoServer doesn’t do any address matching.
What are web mapping services? OGC refers to the Open GeoSpatial Consortium which sets standards for geographic data. A WFS request could be like an identify on a feature or it could be a request for a shapefile extract in a certain projection.
This is a simple example of a WMS request in URL format. I’ve highlighted the parameters in red for easier reading. The capitalization or order of the parameters doesn’t matter. The syntax of the request is a standard set by the Open Geospatial Consortium or OGC. Having this standard helps ensure that various types of application can connect to WMS services, because they know what syntax is acceptable. In order to get a map image back from the a WMS server you need these parameters: the name of the server (here we have 3, this is a load balancer) a version number a request type – here GetMap (versus GetFeature or GetLegendGraphic) a service WMS or WFS a list of layers separated by commas. These names you will get from the particular WMS service provider. MassGIS uses a naming convention. All of our layers are massgis: Oracle schema name usually GISDATA and the SDE layer name list of styles – here there are named styles. The names of the styles you will get from the particular WMS service provider. MassGIS uses a naming convention. All of our styles use the get from the particular WMS service provider. MassGIS uses a naming convention. many styles are Oracle schema name usually GISDATA and the SDE layer name + :: and a descriptive name . Sometimes a generic style is available such as “Black_Lines” here. Also, if no style is specified the layer’s default style is used a bounding box – expressed in a coordinate system specified by the SRS (spatial reference system). Here it’s 26986 or MA State Plane Mainland NAD 83 meters. Width, height of image you want back and Format of the image you want back
Here is an example of a WFS request as a URL. Again, the server name, request type (GetFeature), version and service are similar to the GetMap WMS example. But here we have an optional propertyname – this lists the attributes that we want information for. Here the typename is giving the layer name. And here we also have an option CQL_FILTER. This request says: Give me the town and pop2000 attibute values from the layer GISDATA.TOWNS_POLY but only for town with a POP2000>100000. A WMS or WFS request can ask for a subset of the features to be returned. The subset can be based on attribute information (give me only high schools) and/or geographic information (give me only high schools in this bounding box). There is an OGC Filter specification. A WFS request can also ask for coordinates of the features. WFS requests can also be transactions – to insert, update and delete features from layers in our SDE database.
Here is the beginning of the response to our WFS GetFeature request. We get back an XML text file that includes our information. At the top is an overall bounding box of the features that fit the filter of query. Then we get a list of featureMember where each featureMember is a record. For example, BOSTON fit the query, an we get the values for the two attributes that we requested. With the recent upgrade of GeoServer you also get back a bounding box for each individual featureMember.
Since the MassGIS web mapping services are yet another way that MassGIS distributes data to the public, it’s a public system and I don’t necessarily know of all the applications out there that are using it. Not everyone will send me an email. There are log files I can analyze, but I haven’t done an exhaustive search of the traffic coming in.
Programmers understand “WMS” and “WFS” and can connect and use these services with the tools that they’re familiar with, from OpenLayers to Google maps to Flash.
To start with this is a simple example of how to connect to the GeoServer Web Map Services using ArcMap. ArcMap can be used to connect to ArcIMS or GeoServer. (See the “Add ArcIMS Server” vs “Add WMS Server”. Use ArcCatalog to connect to WFS underneath Interoperability Connections. Detailed instructions for connecting using ArcMap and other applications are on our website called lyceum which I’ll show at the end of the presentation.
When a desktop GIS such as ArcMap is used to connect to the web mapping services the default style or symbolization will be used to draw the data. However, many datalayers can have more than one style in the MassGIS system. Styles is the MassGIS system are called named styles.
OpenLayers is a JavaScript library for displaying maps in web pages. Through OpenLayers requests for maps (WMS) and requests for data (WFS) can be made to a web map server. Here DCR uses OpenLayers to create a map of forestry information. Each time the user zooms or pans the map a new GetMap request is made, with new bounding box coordinates. The user can switch between different named styles to symbolize the data in various ways. If the user clicks on a town a GetFeature request is made and …
The results are returned to the client application as an XML file. This application parses the feature info out of the XML file and presents it nicely formatted to the user.
This is an example of a publically accessible Google maps application developed by two citizens names Christopher Wren and Gordon Jamieson. Google maps allows for the overlay of WMS datalayers. In this case the application does not use named styles but rather submits to the MassGIS web mapping service enough information to make the map based on the data from their database. This is called Styled Layer Descriptor or SLD. MassGIS can make a map responding to a GetMap request that says, essentially, “give me a map of the towns, but make these 3 towns green, these 2 towns red and the rest white”. This type of interactive with the MassGIS web mapping services can be very useful if it’s not convenient or appropriate for MassGIS to host the data which is going to be mapped. For example, the Department of Health and Human Services could make a map of flu cases without giving MassGIS the flu table. In this case the town were colored based on Percent Change in State Aid. This request is very similar to a simple GetMap URL except:
This GetMap request has a link for style information in an external SLD file. Notice also that this request is using EPSG code 3395 (which is WGS 84) and providing a bounding box also presumably in 3395. A handy way to look up EPSG codes is at the web site http://spatialreference.org
This is a little of what’s in the online SLD file at http://drwren.com/true/data/0209percent.xml which is driving the symbolization of the Percent Change of the towns. For the WMS layer called “massgis:GISDATA.TOWNS_POLY” for the field called “TOWN” there are rules for each record. If TOWN=AQUINNAH, then apply this polygon fill and polygon outline. The colors are in the hexidecimal system.
This application displays data. I believe that it’s an ESRI HTML Viewer. It connects to the MassGIS GeoServer system and submits GetMap URLs using named styles. It also provides identify information on features.
This is a screenshot of a Windows machine running Vista or version 7 and using a Geospatial One Stop Gadget. GeoSpatial One Stop is also known as geodata.gov. Gadgets are little applications that can be placed on the desktop. This gadget was created with an FGDC grant. This application can connect the MassGIS WMS or WFS service (and other services out there) and then launch an application such as ArcMap, ArcGlobe or Gaia (an open source desktop GIS from the Carbon Tools company). http://thecarbonportal.net/modules.php?op=modload&name=Downloads&file=index&req=viewdownload&cid=6
This application collects data. The Google map is a plain Google map with no web mapping services from MassGIS. Here the connection with MassGIS is in the background. Once the user puts in their address (geocoding done by Google and optionally moves the point, and answers the questions), the information is collected and a Python script crafts a WFS insert statement to GeoServer. (The data layer of points is specially configured to allow inserts.)
Then, another Google maps application overlays that layer as a GeoServer WMS layer on top of Google maps.
There are several applications right now that are editing data over the web. One is for welldrillers, another is for Community Preservation Projects – in both cases the users are required to use the applications) and the mapping application is a Javascript based toolkit called MapBuilder. A third application we have in development is an ArcMap toolbar for editing openspace. The user downloads a shapefile of openspace for their area, uses domains and sophisticated editing tools within ArcMap to edit the data and then posts the data back to GeoServer (and therefore SDE) using the WFS insert, update or delete requests. Another point about the web mapping services is how they can be embedded into applications that have a workflow. The map doesn’t need to be the central item. In the case of the welldrillers application, the welldriller on page 1 enters GPS coordinates and on page 2 a red dot appears on the map, which the driller can move if necessary. Then the welldriller continues onto page 3 of the application. They fill out 12 pages of information and then all the data gets submitted to the SDE database.
MORIS is an application very similar OLIVER, but with a focus on ocean data. MORIS is an application written in Java and requires Java Web Start to run. The application runs on the user’s desktop. Both MORIS and OLIVER (and another application called SPOLIVER for crime data) connect to the GeoServer web map services. Each map zoom or pan generates another GetMap request while feature identify use a WFS request. MORIS and OLIVER allow vector and raster download and address matching. MORIS has a unique tool called the georegulations tool. When the user clicks on the map with the georegulations tool a series of WFS requests are run against a list of ocean datalayers to see if the point falls within any of the features in the layers.
Details on sending requests through the gateway: http://lyceum.massgis.state.ma.us/wiki/doku.php?id=itd_gateway:home&s=gateway
In August we upgrade the version of GeoServer which gave us a lot of improvments.
Scheme to make drawing rasters 4x faster
Since GIS people are visual this is a poster that tries to convey the different types of map servers and the different types of applications that are tapping into them. This represents actual applications and the agencies that are using them. These orange applications are pretty unique in how they’re put together demonstrating how these technologies can fit together. I’m going to show a few examples of applications that are connecting to the GeoServer map server. But first I’m going to explain the basic types of requests these applications can make.