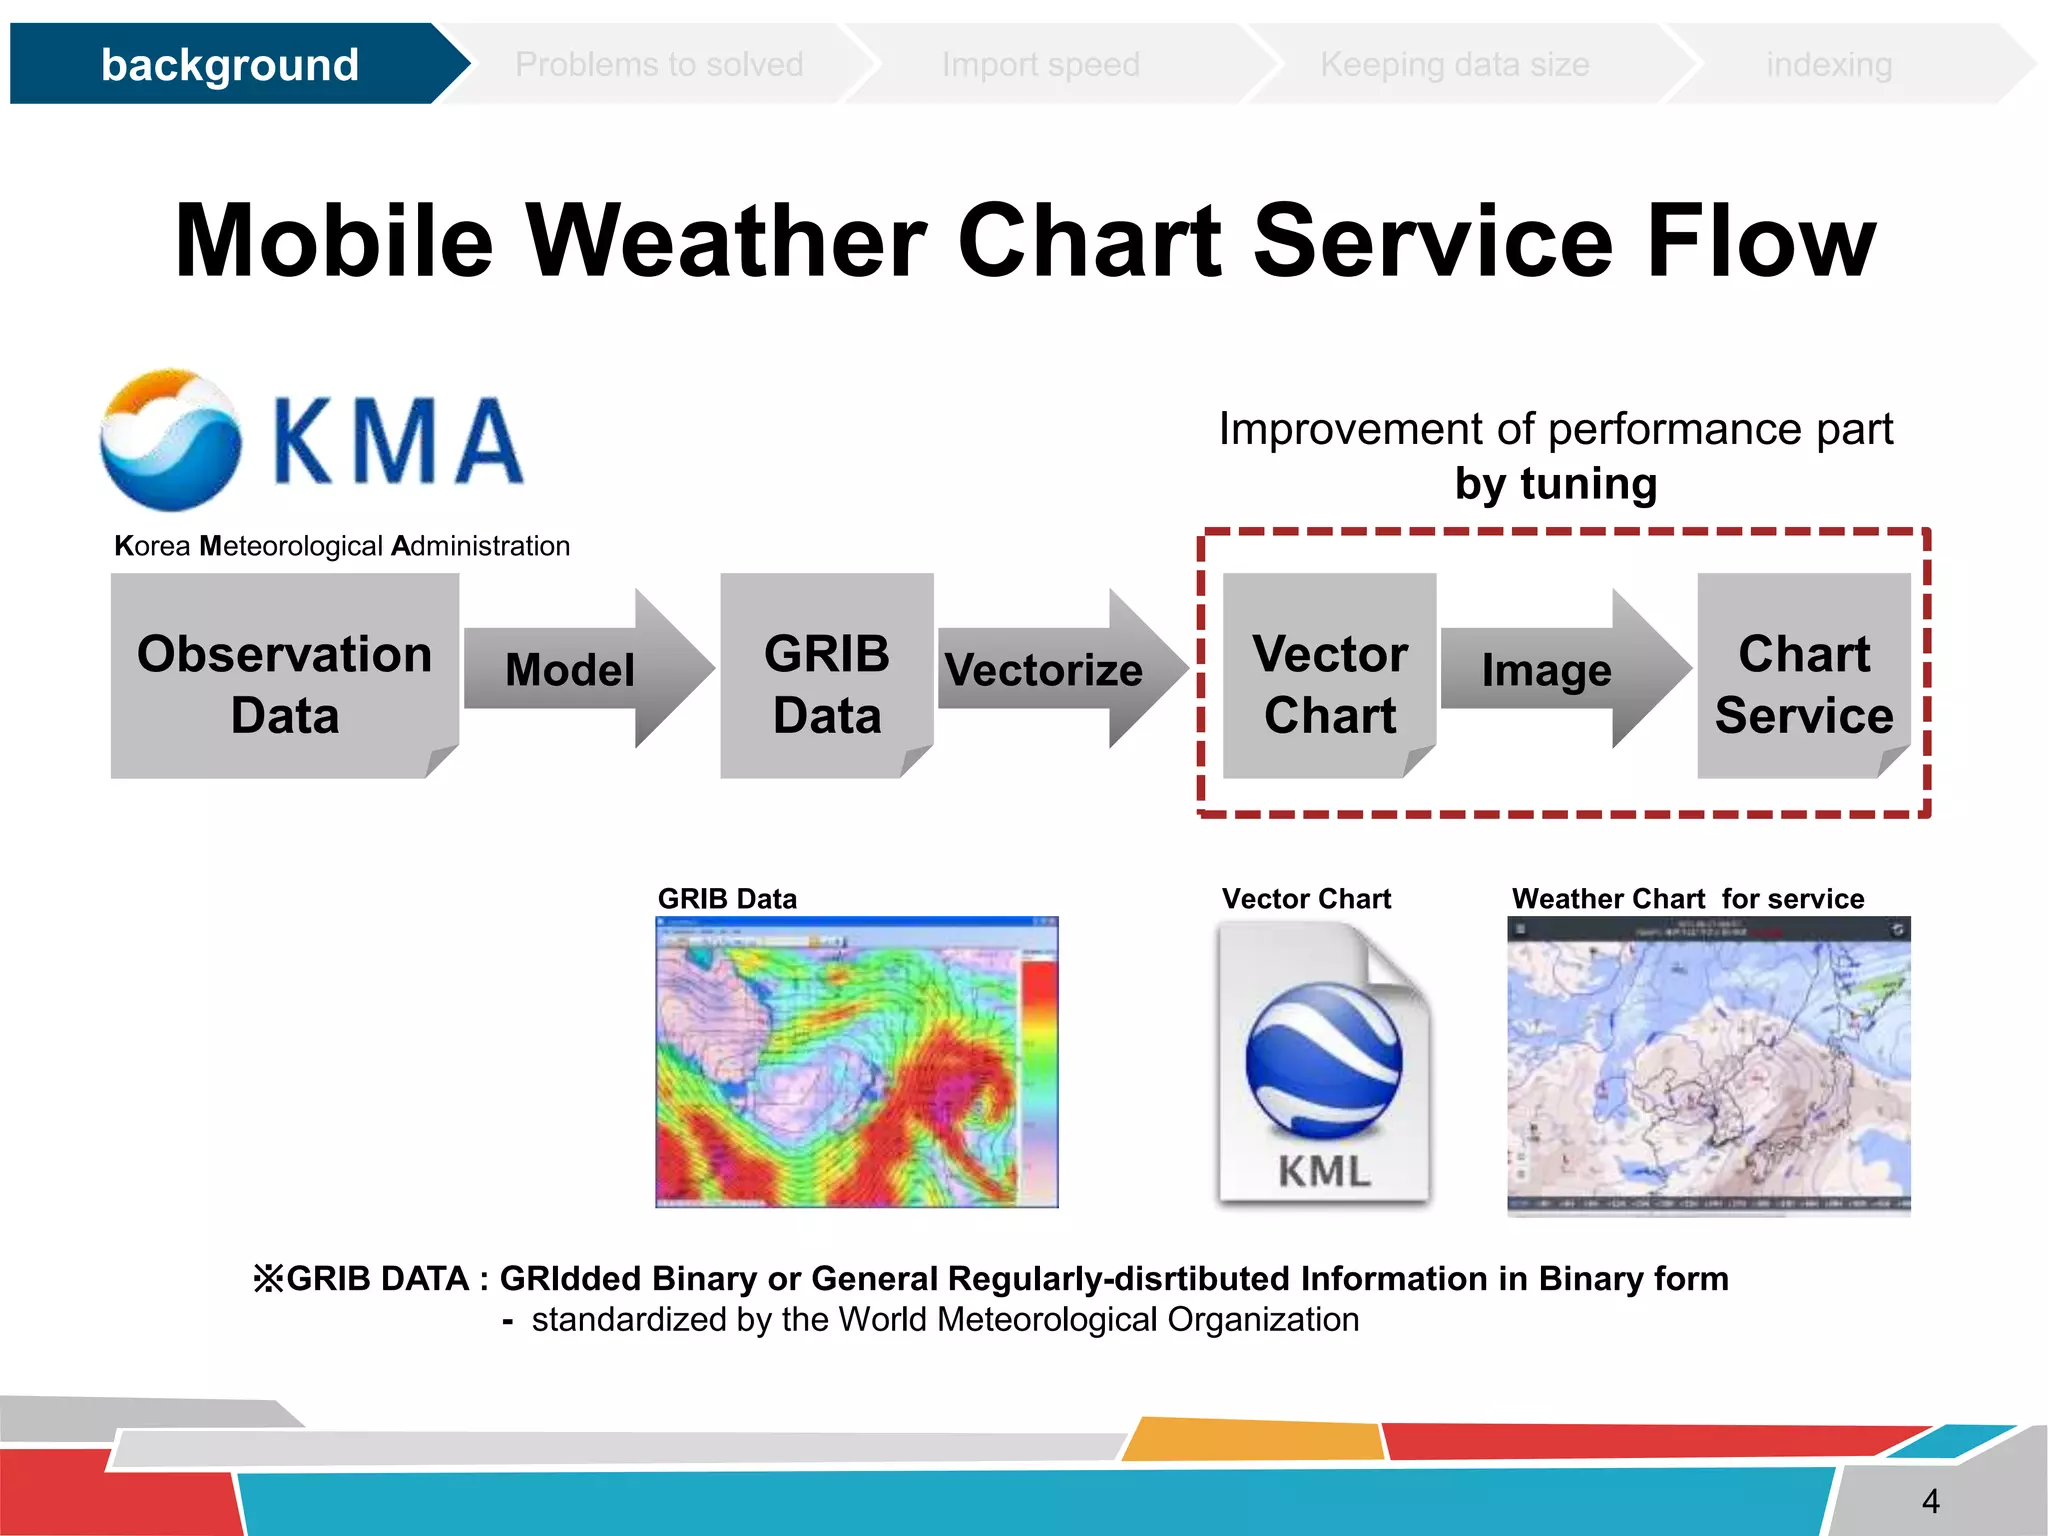
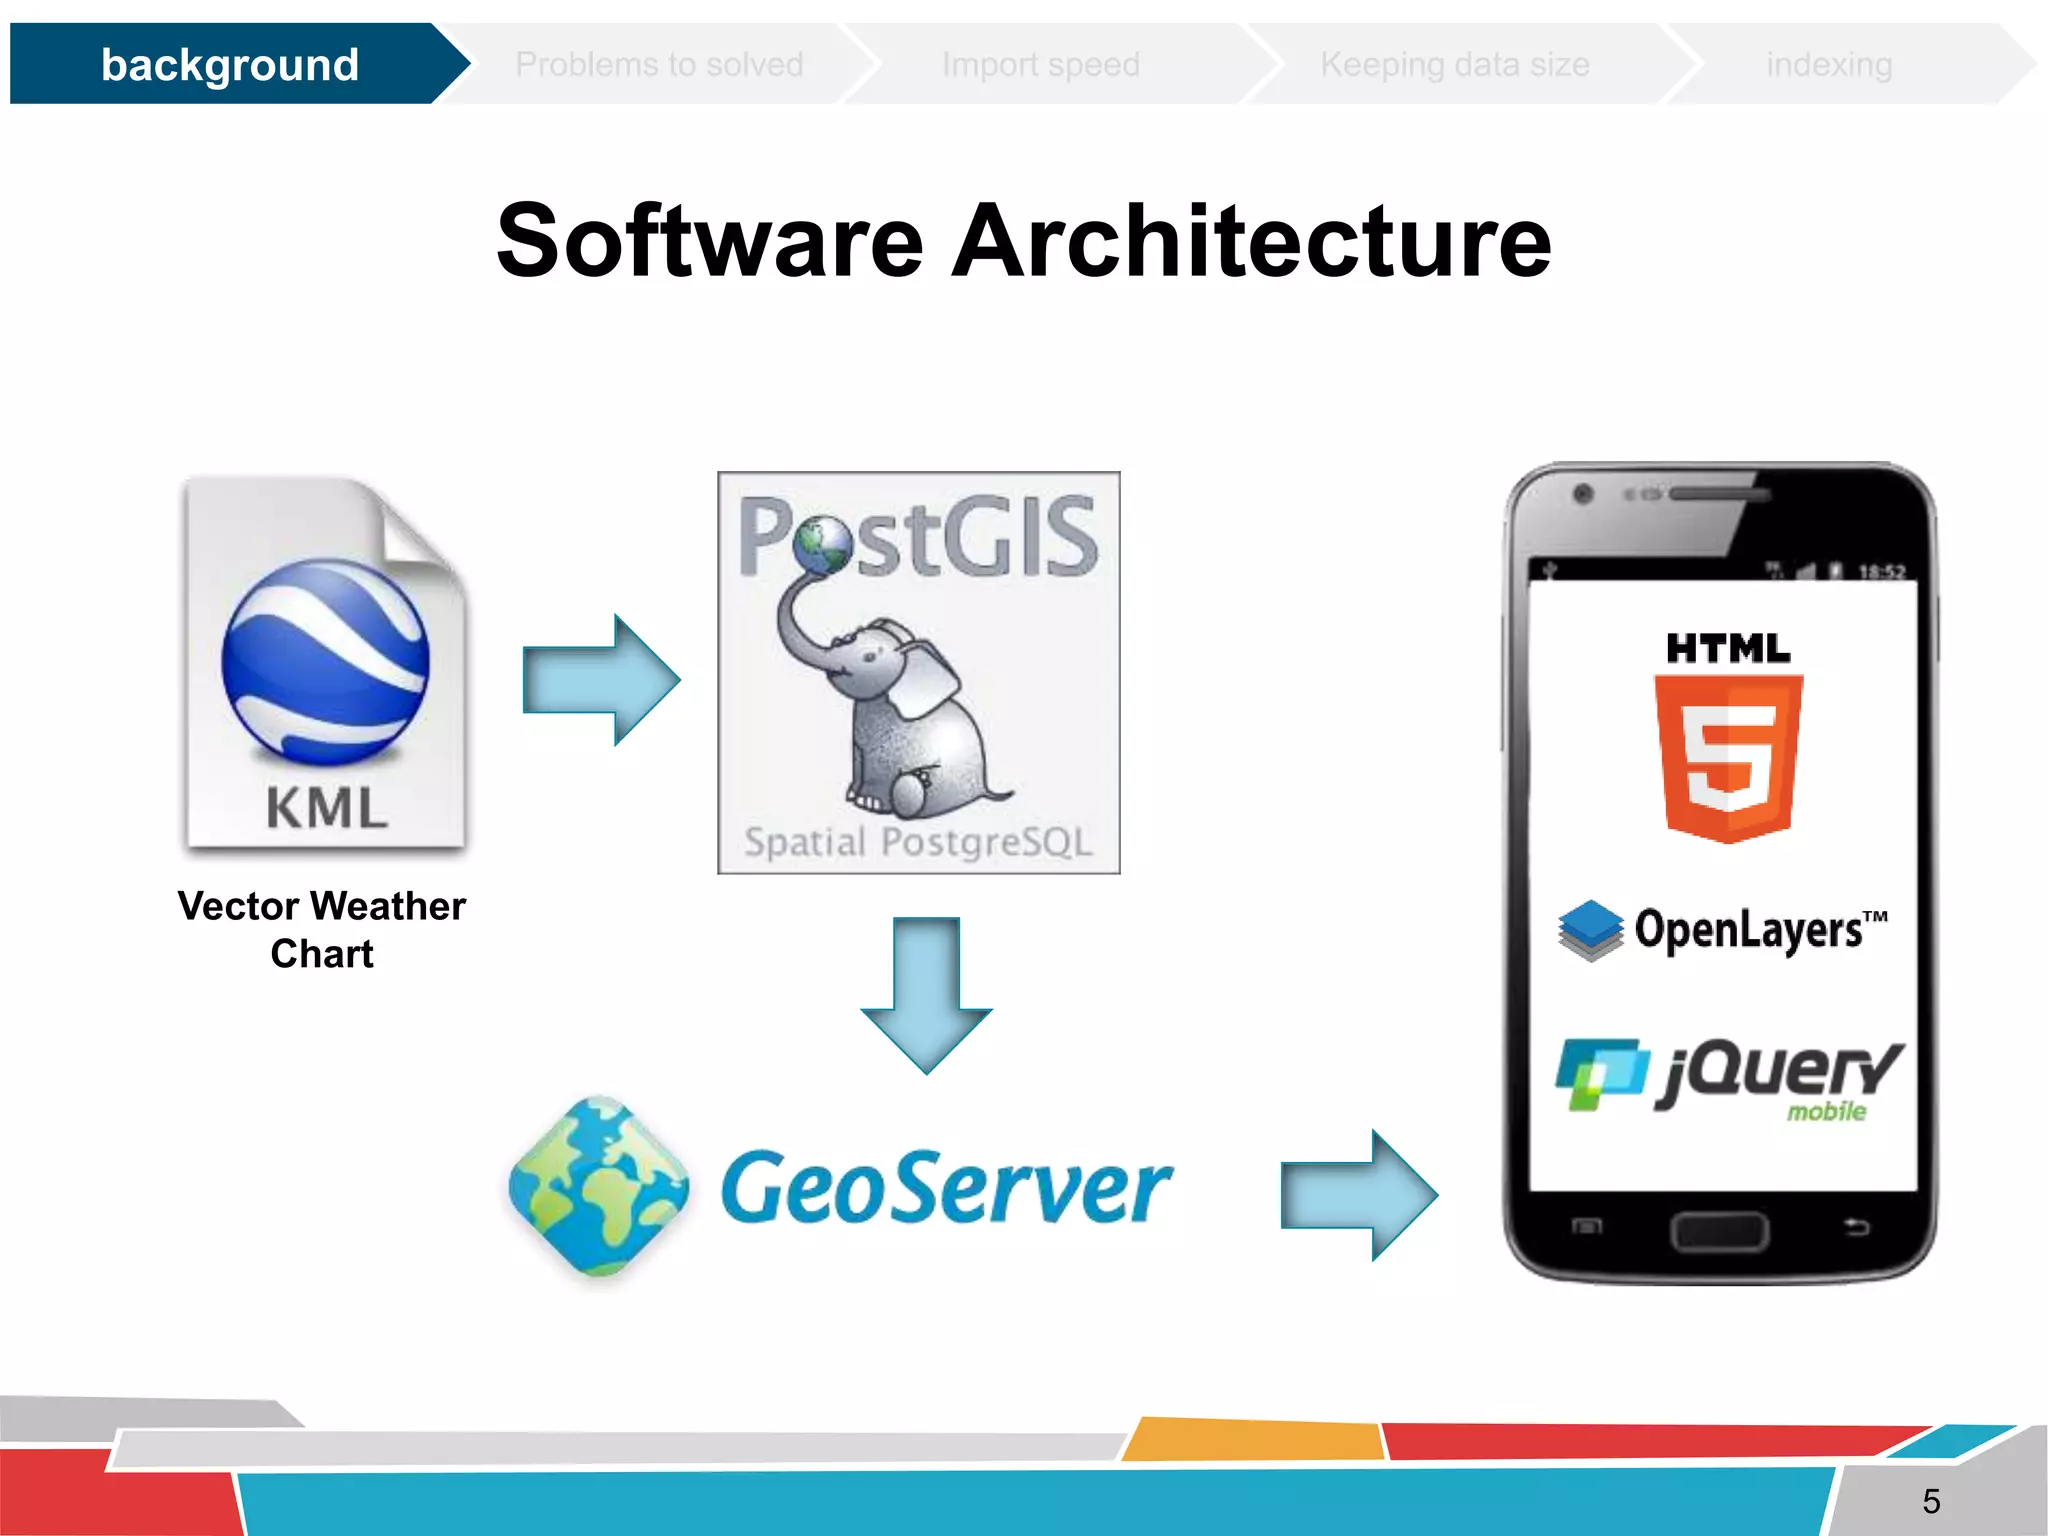
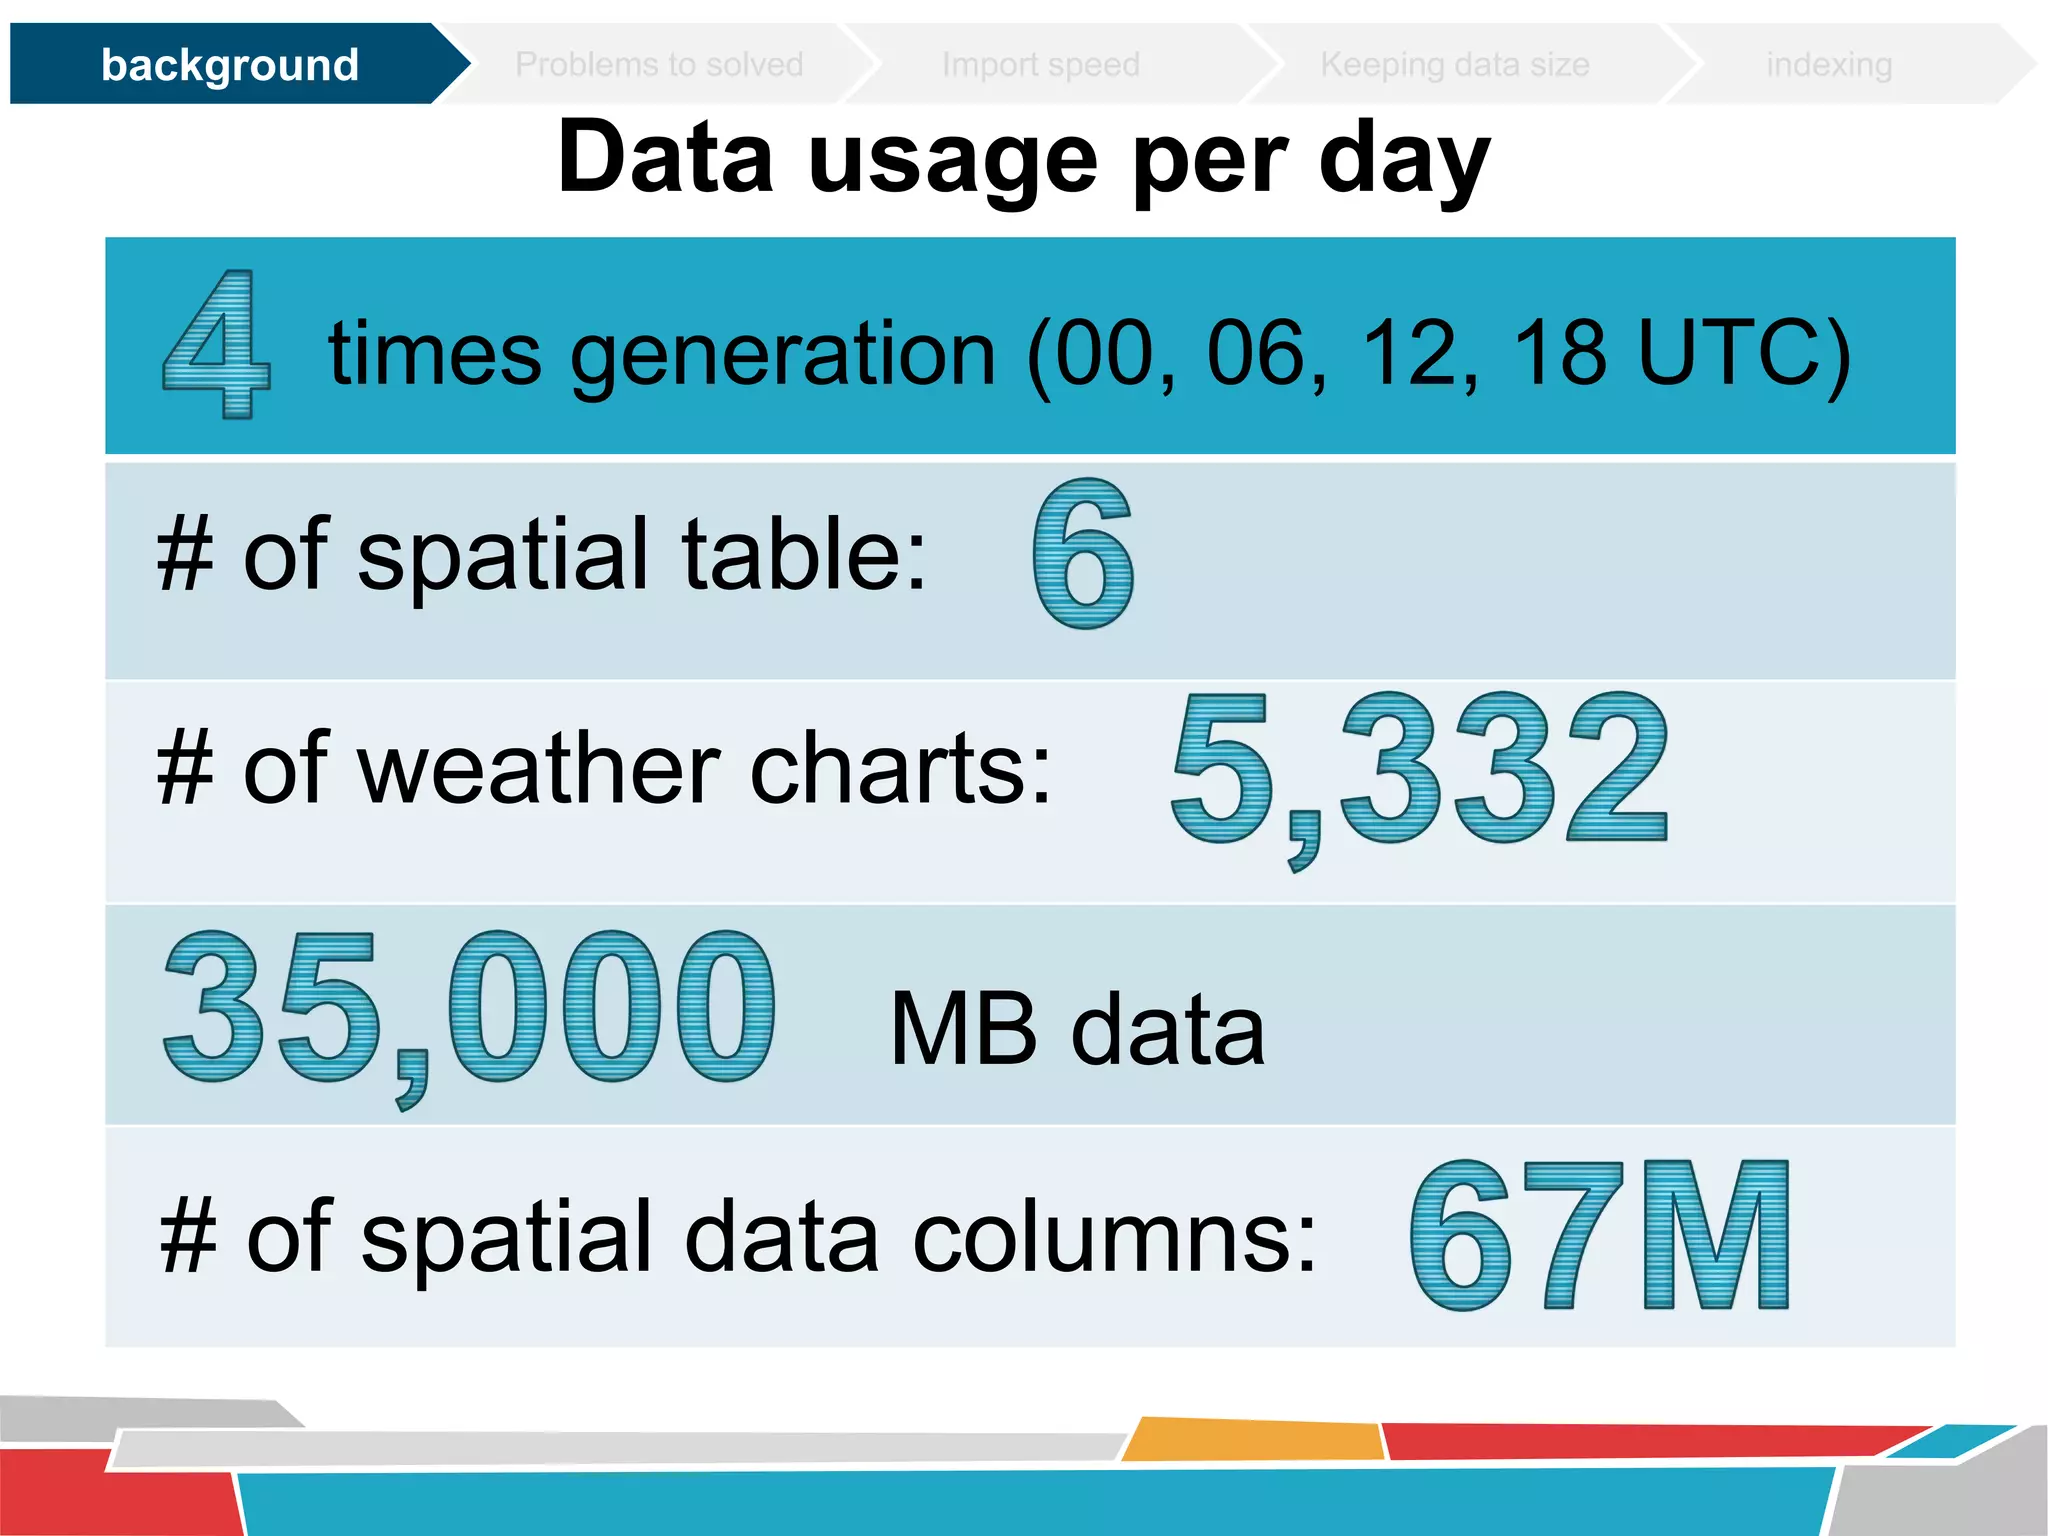
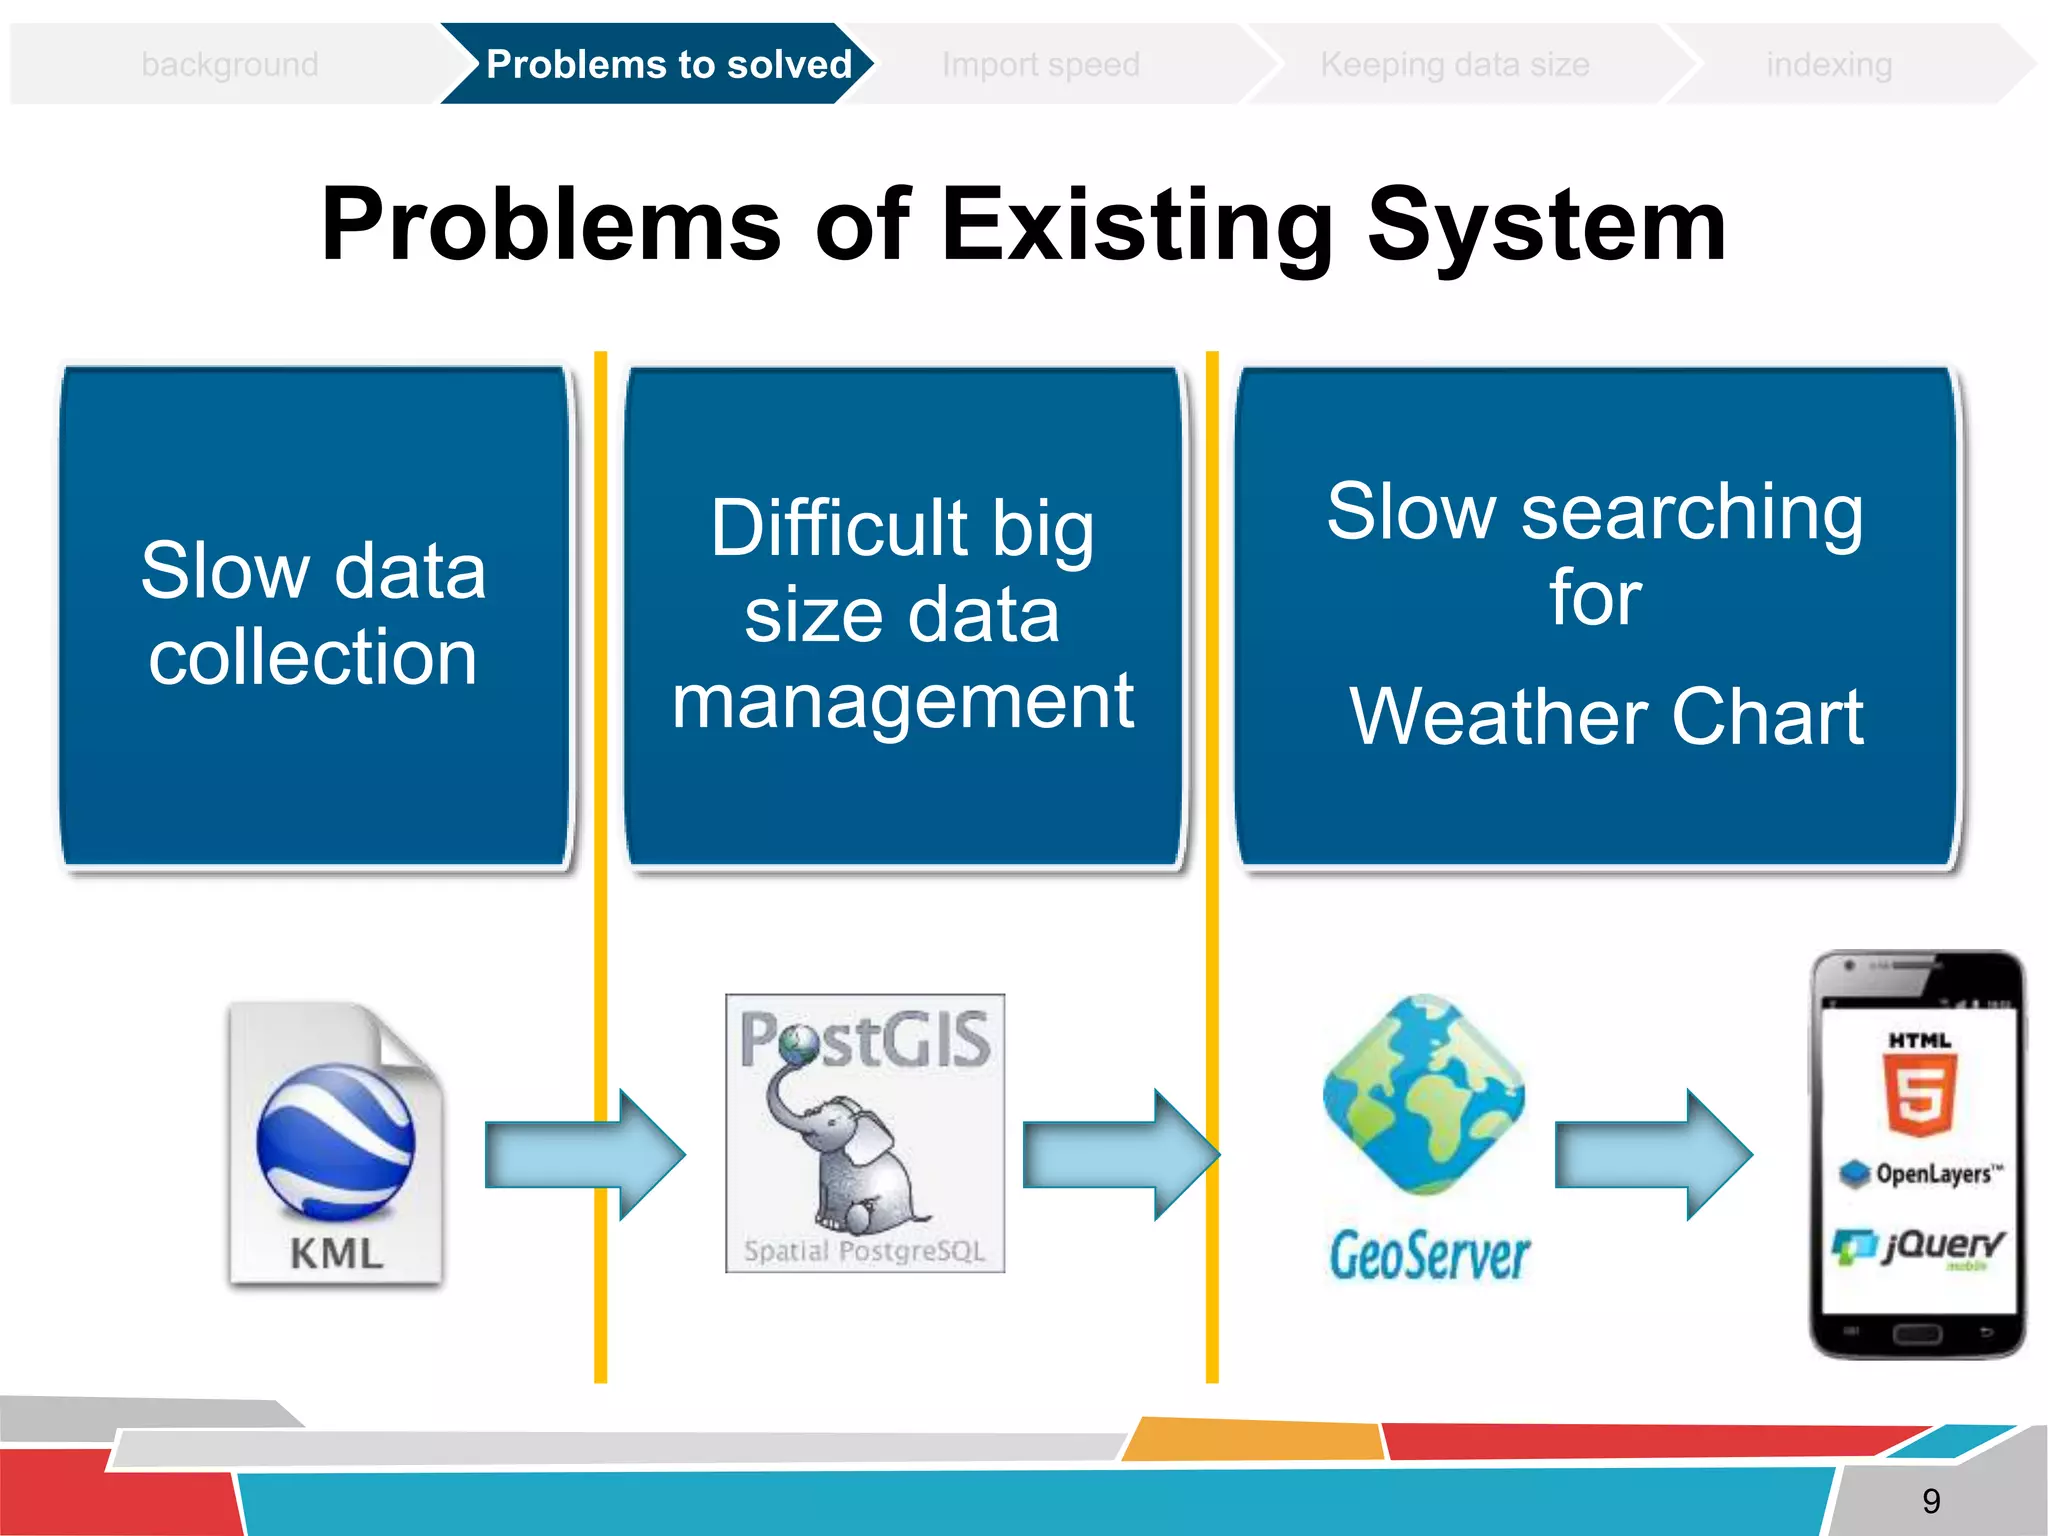
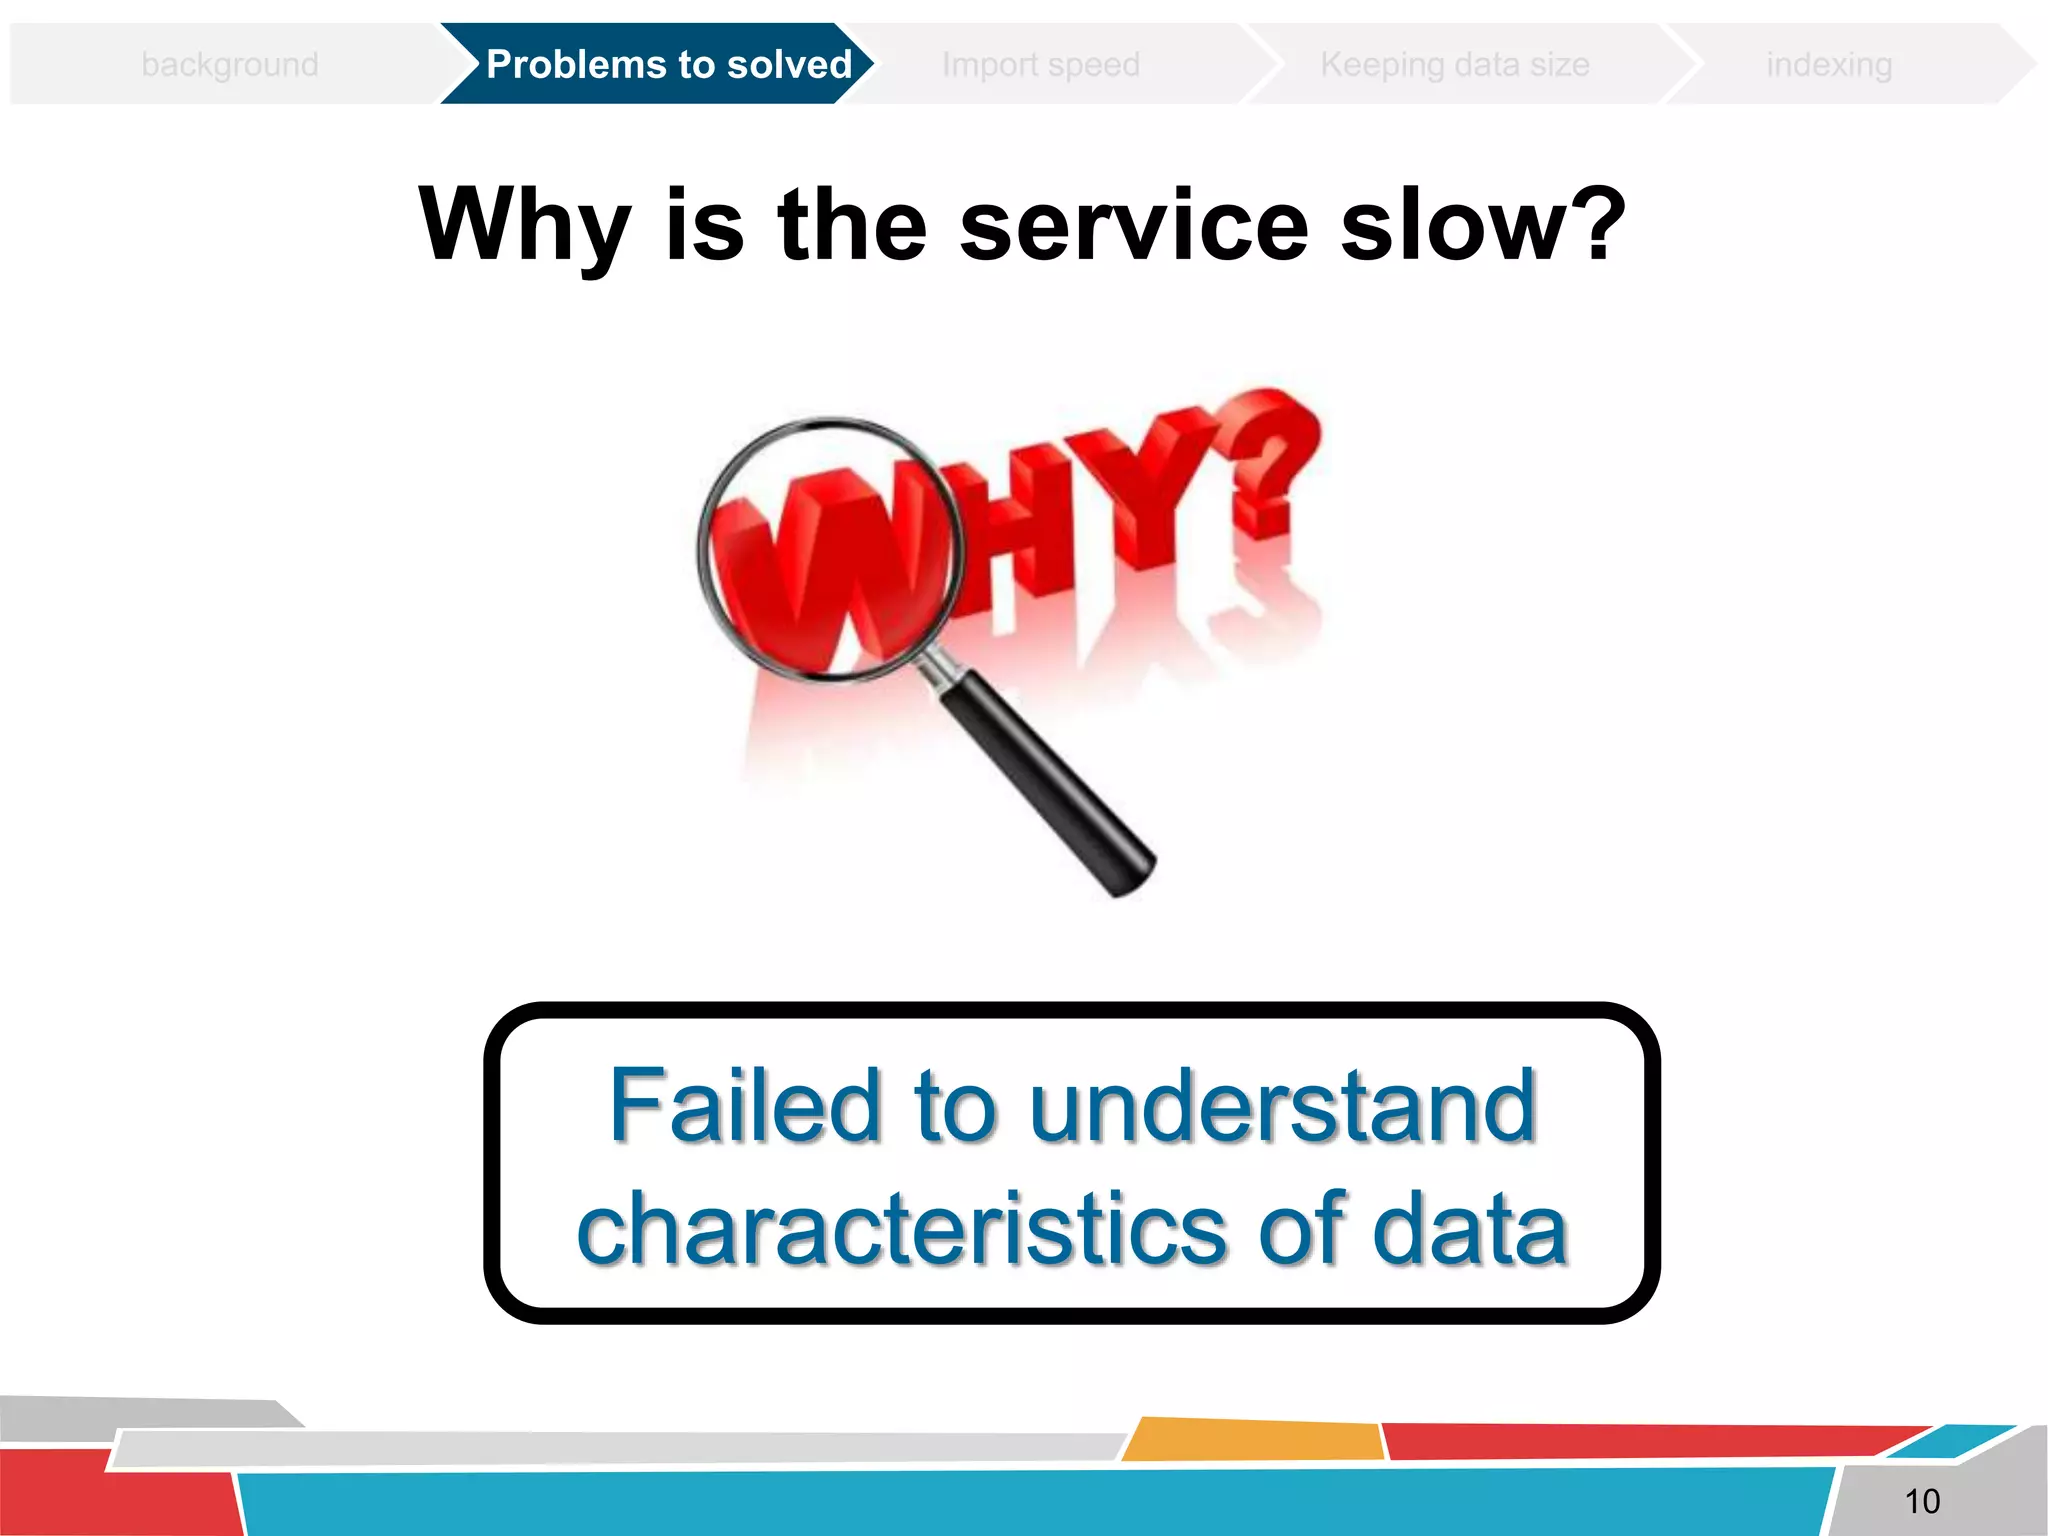
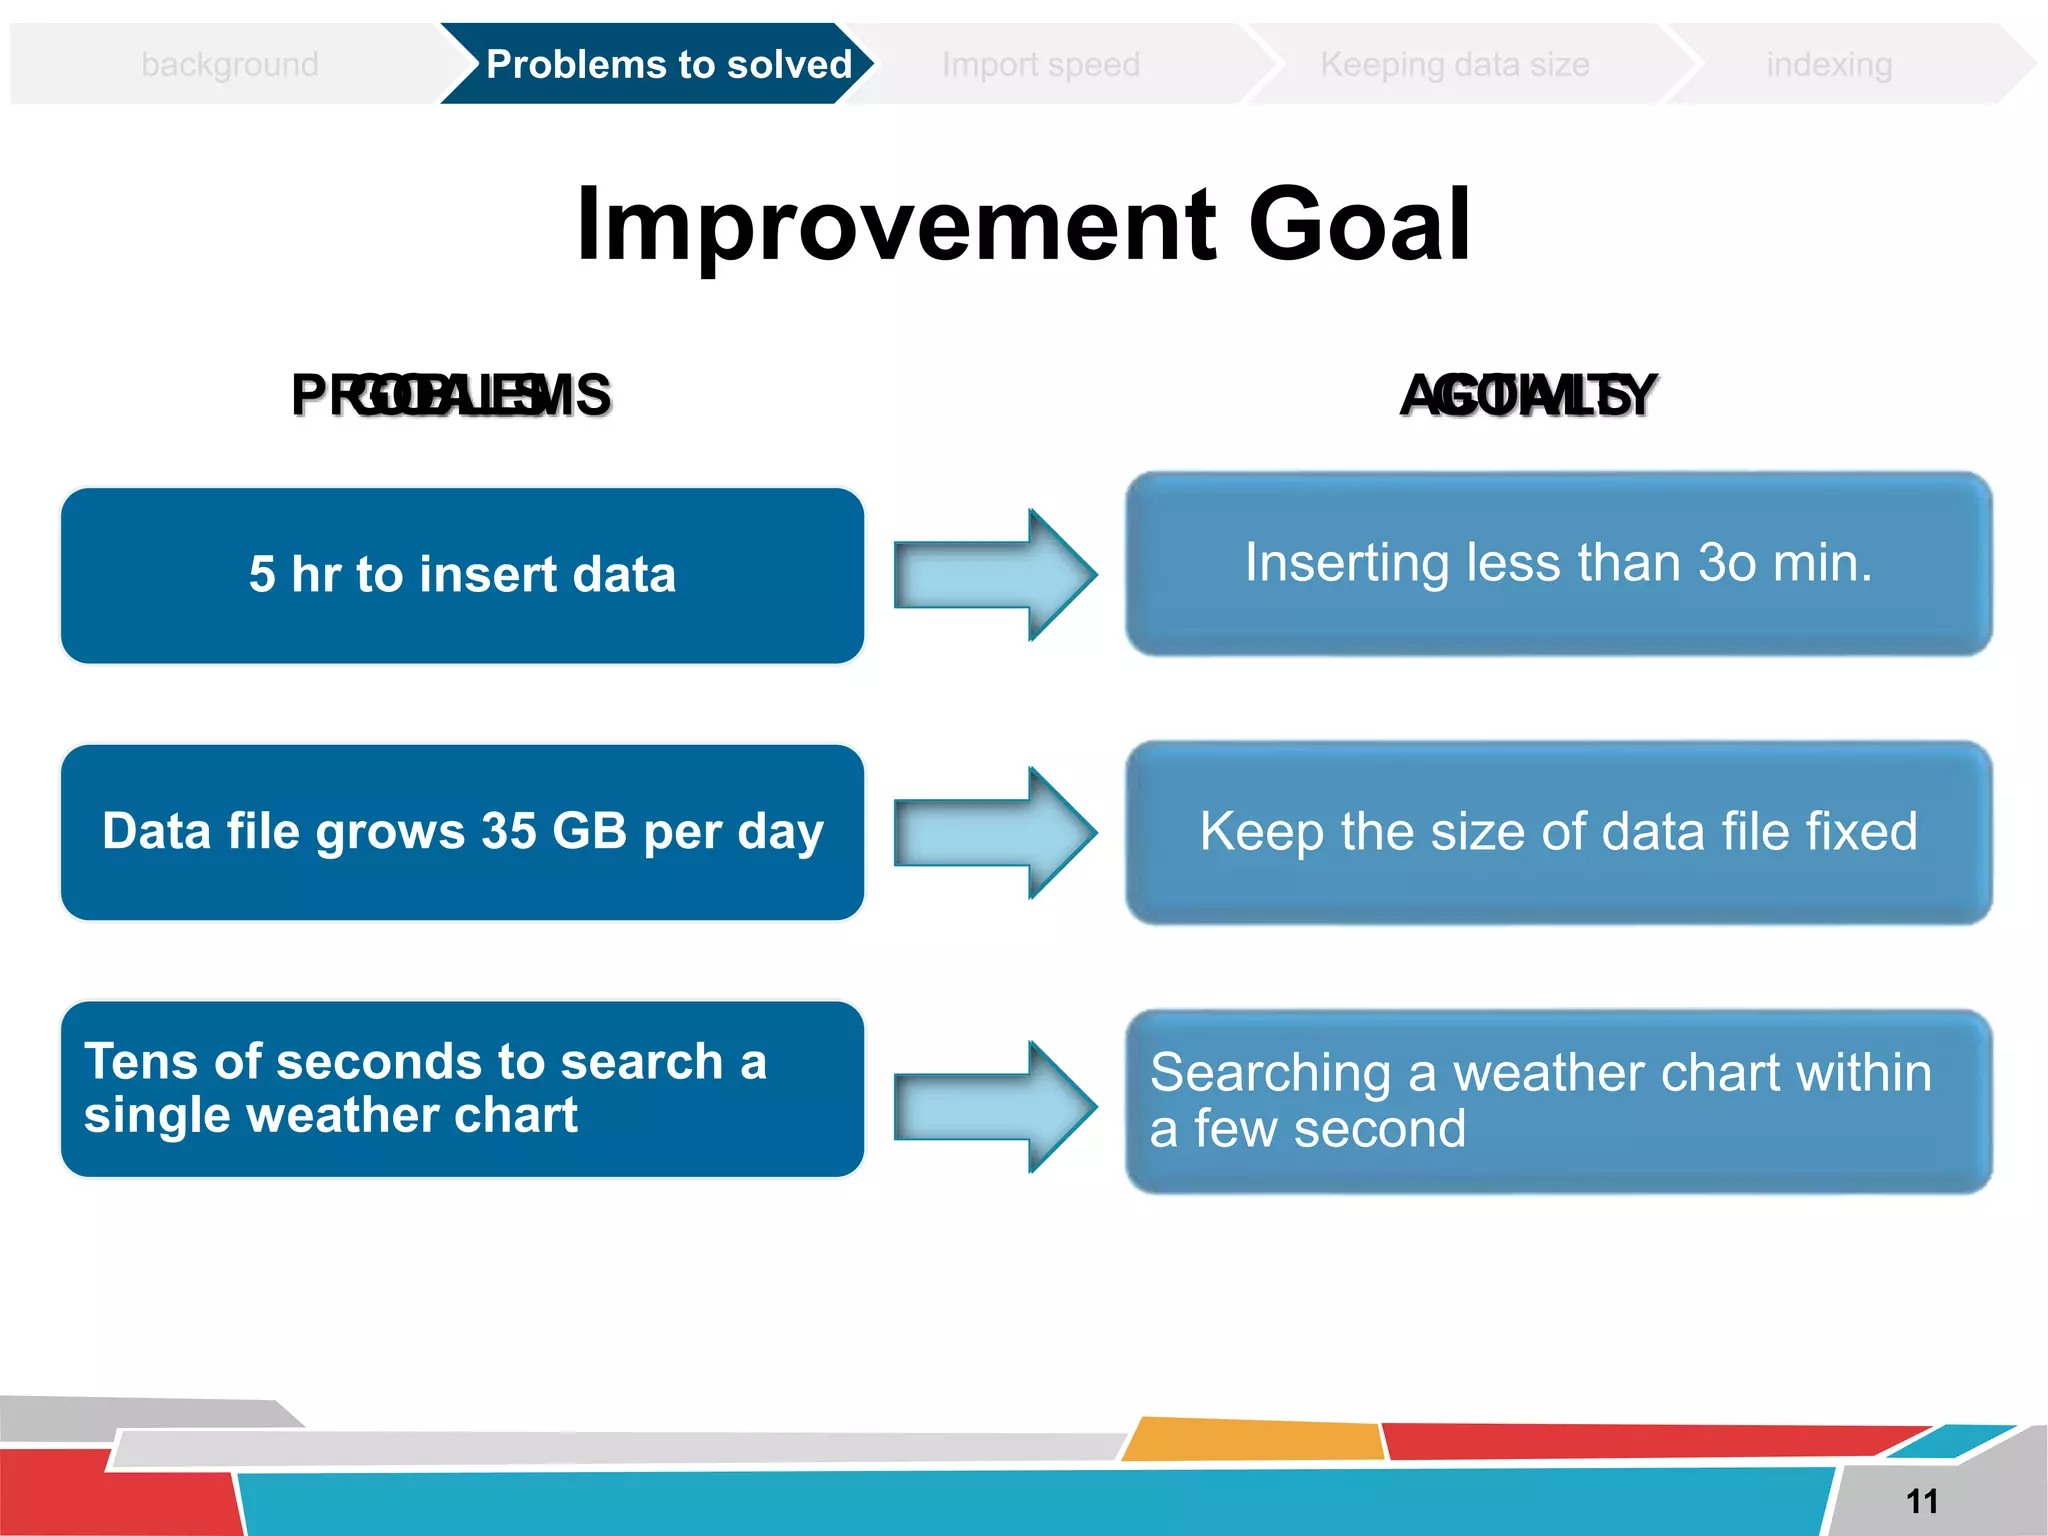
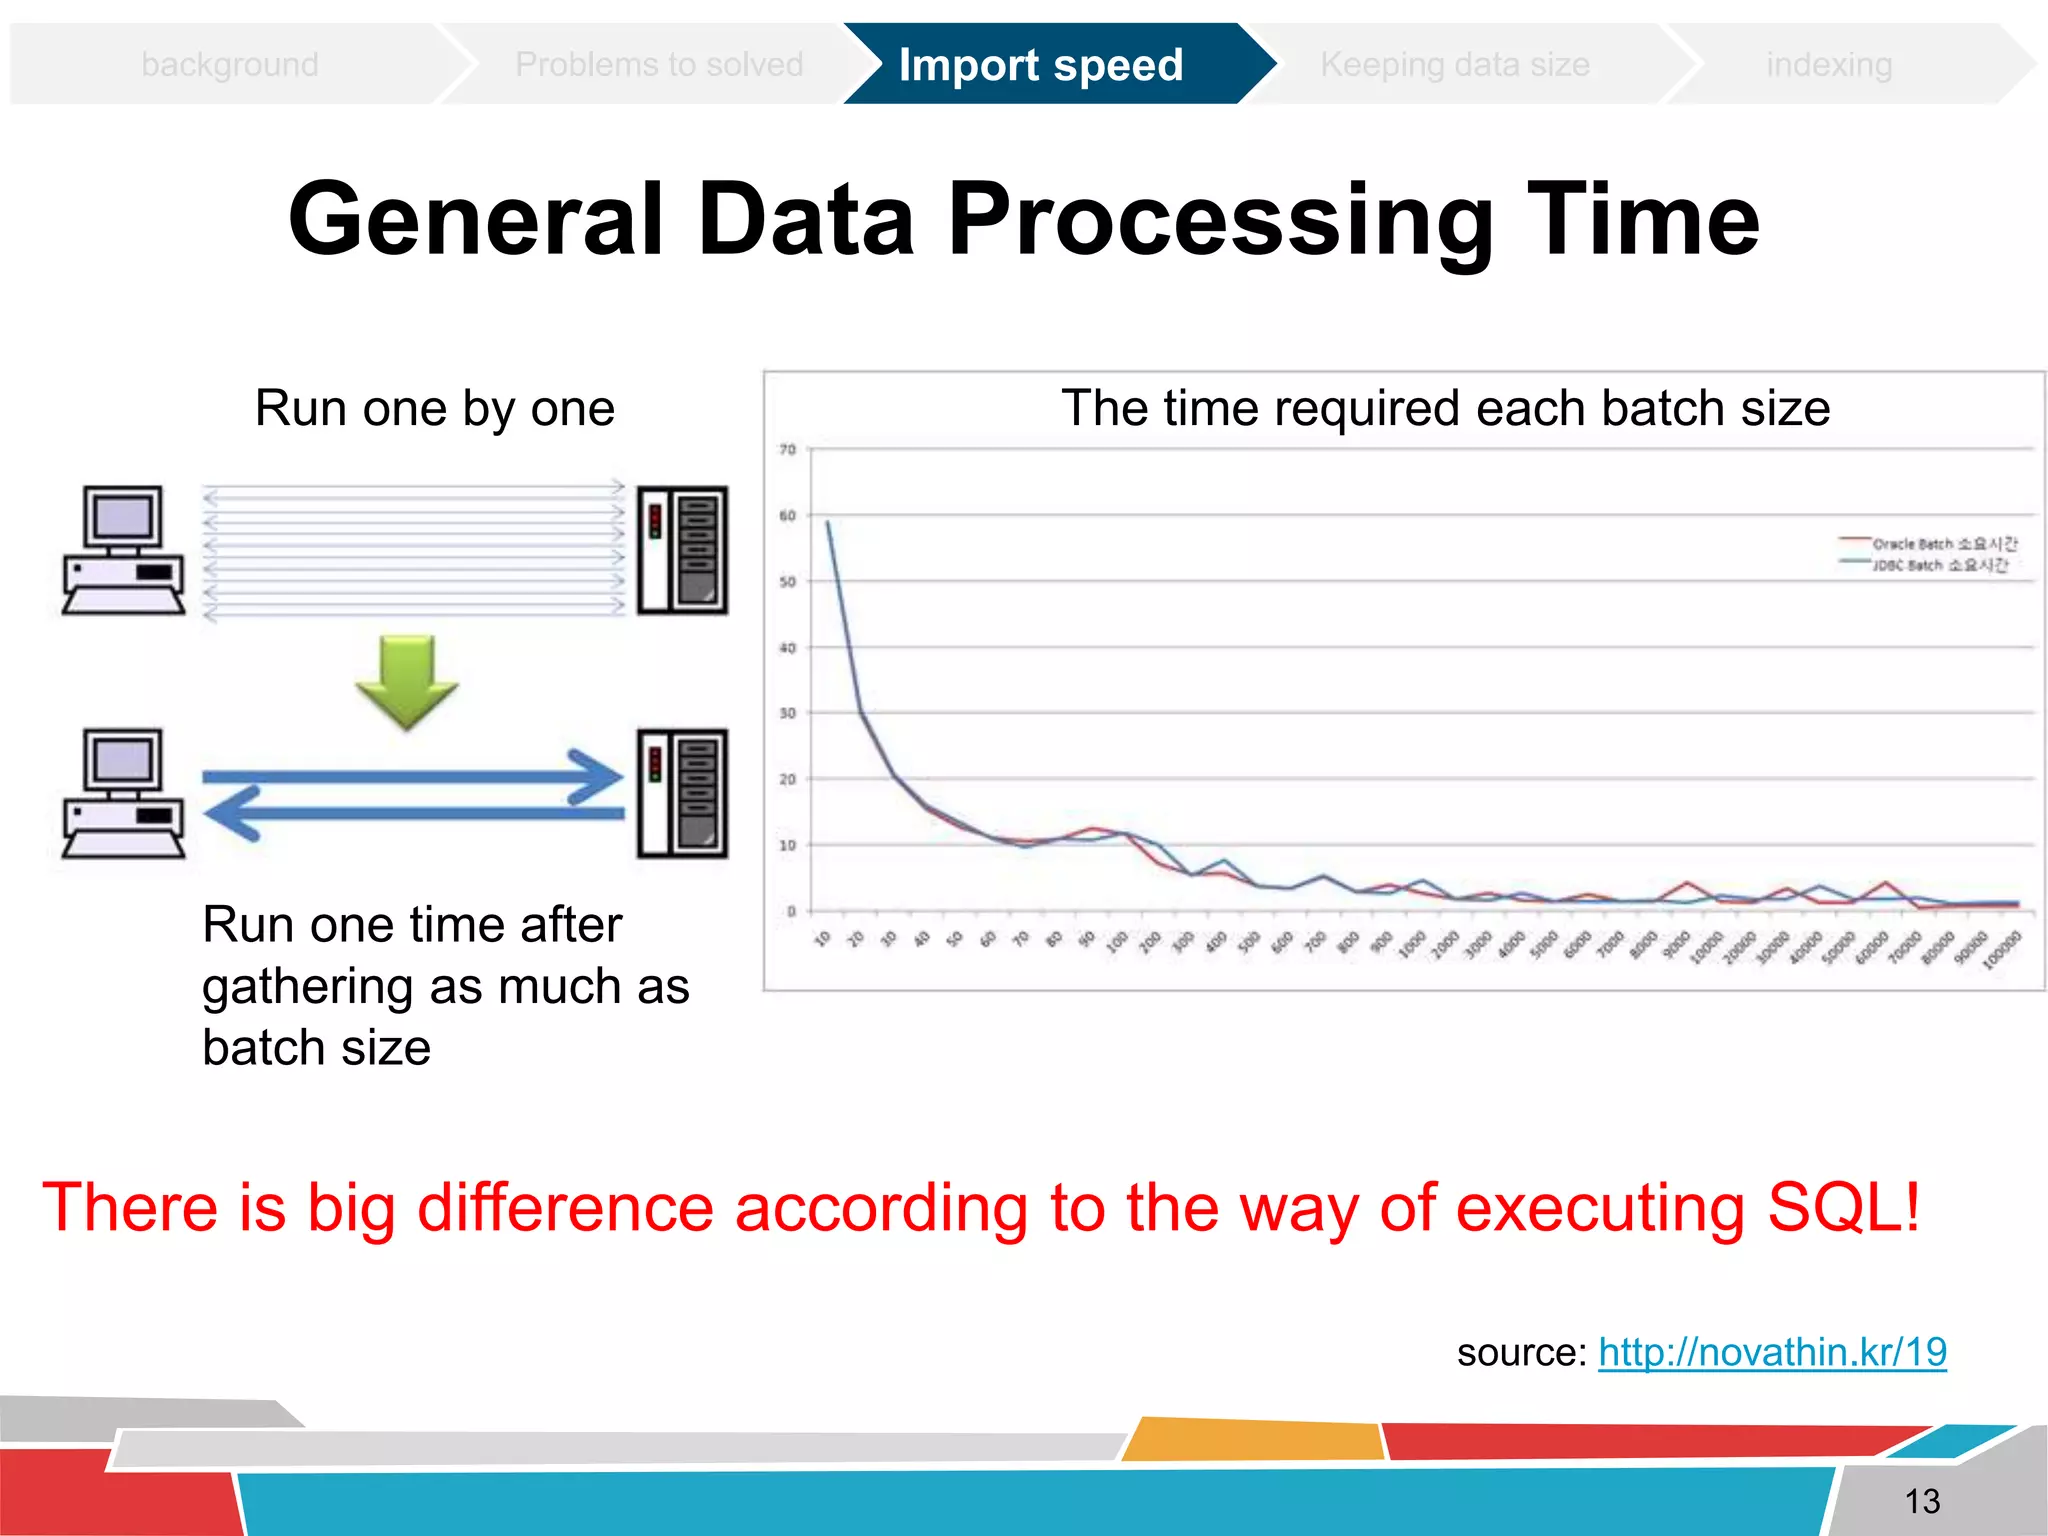
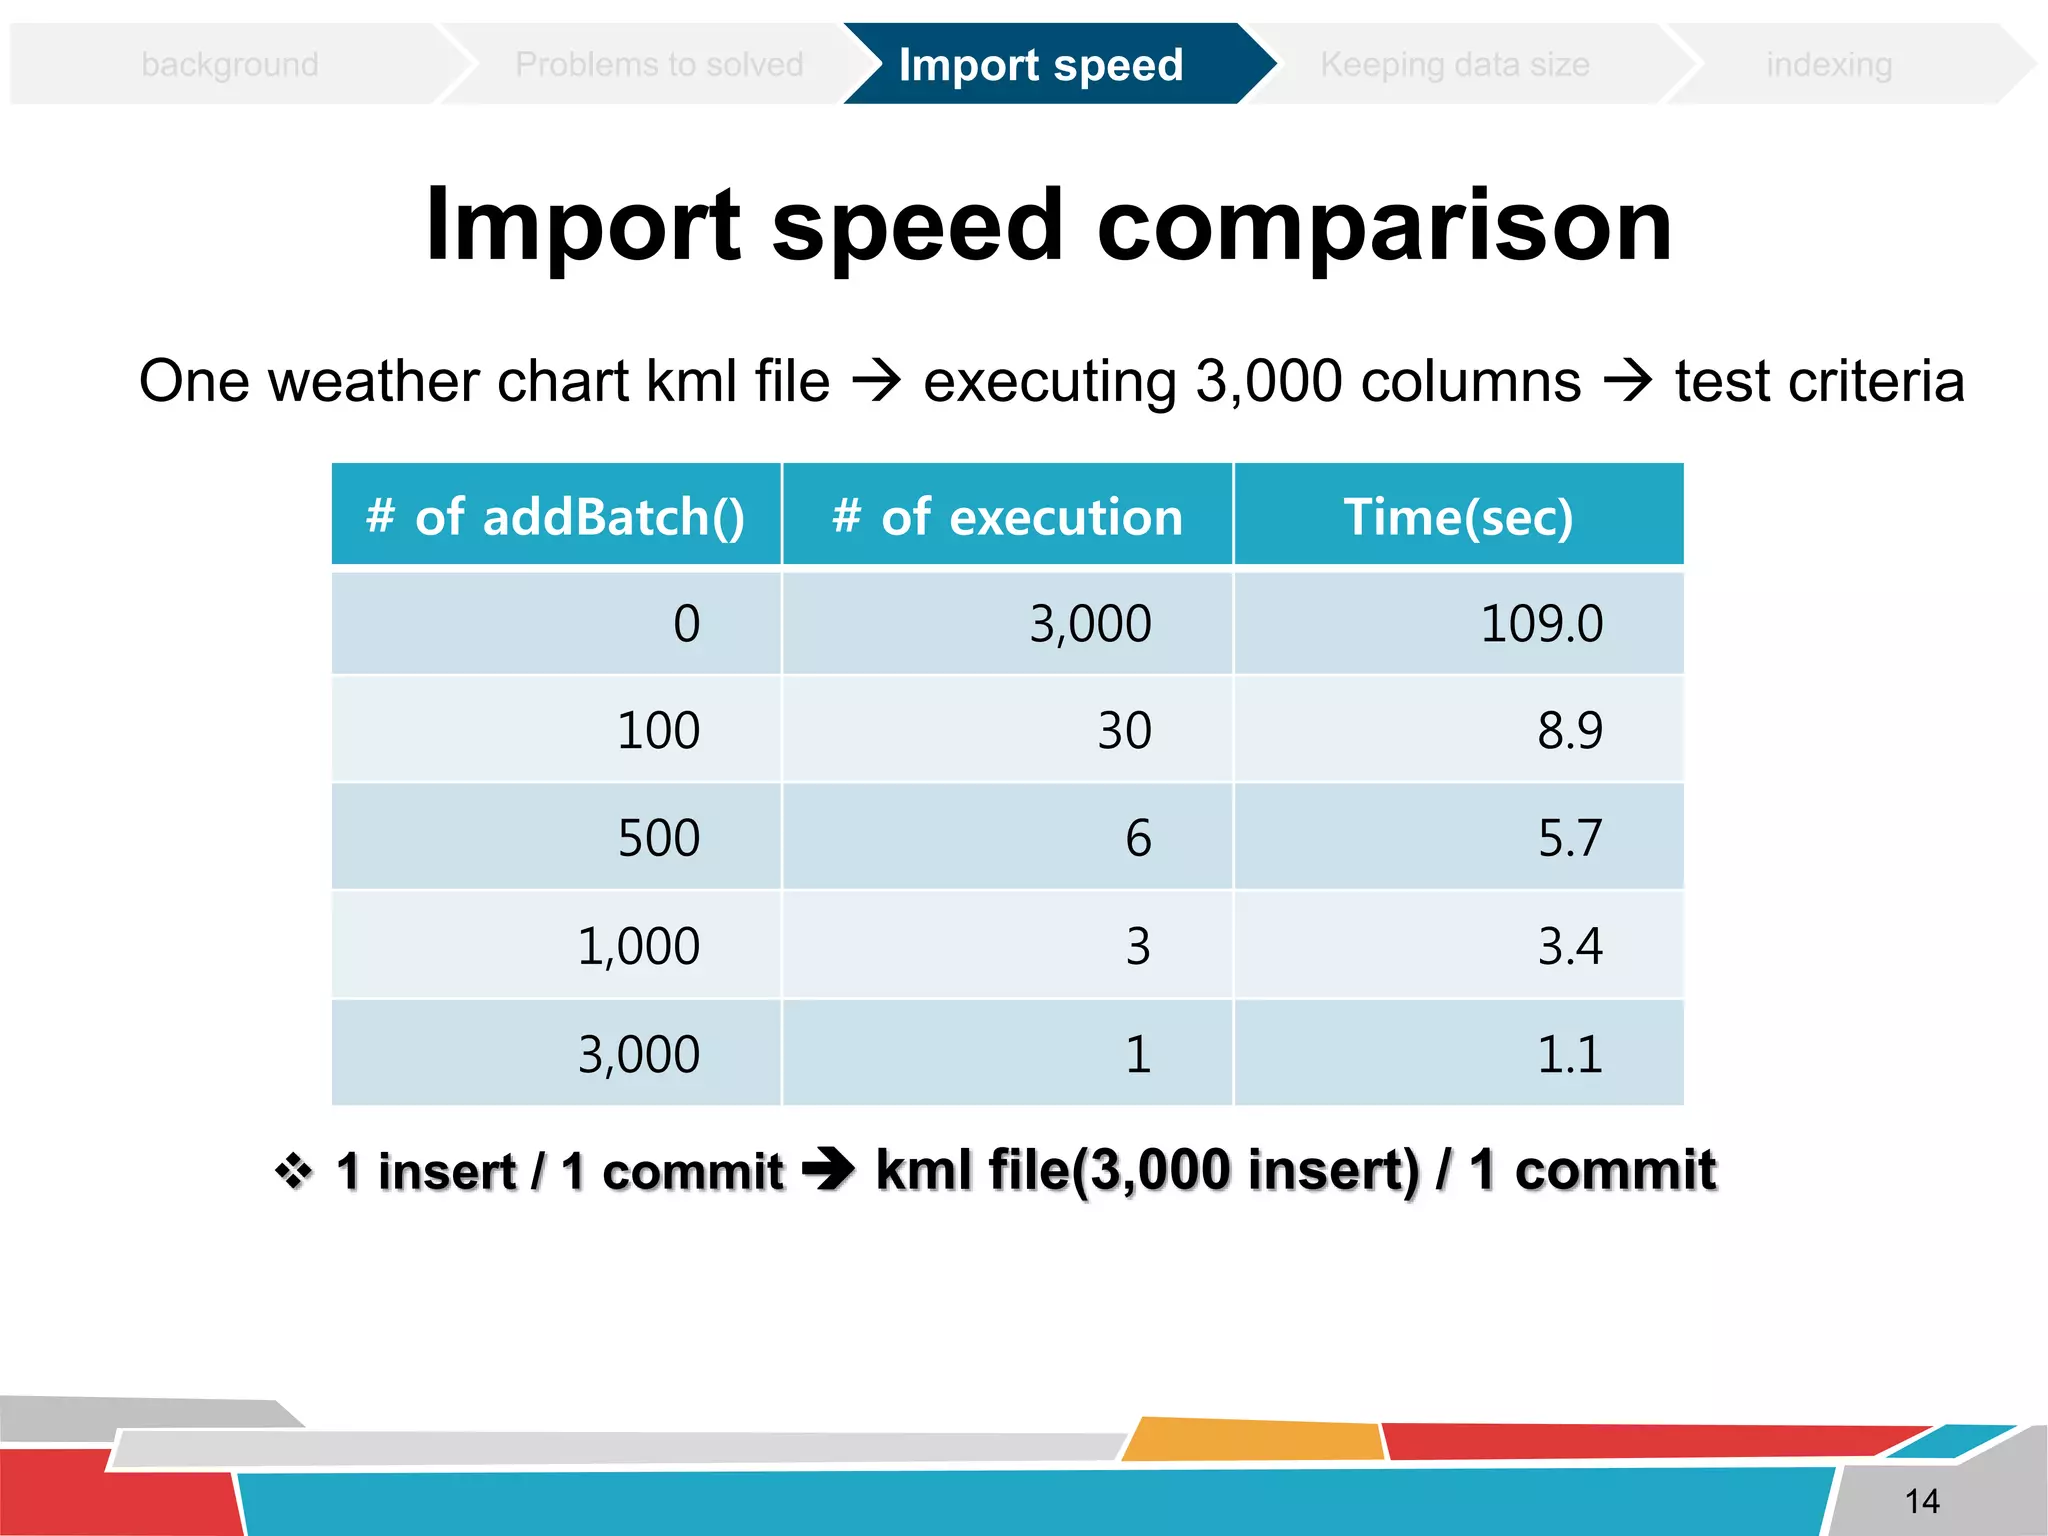
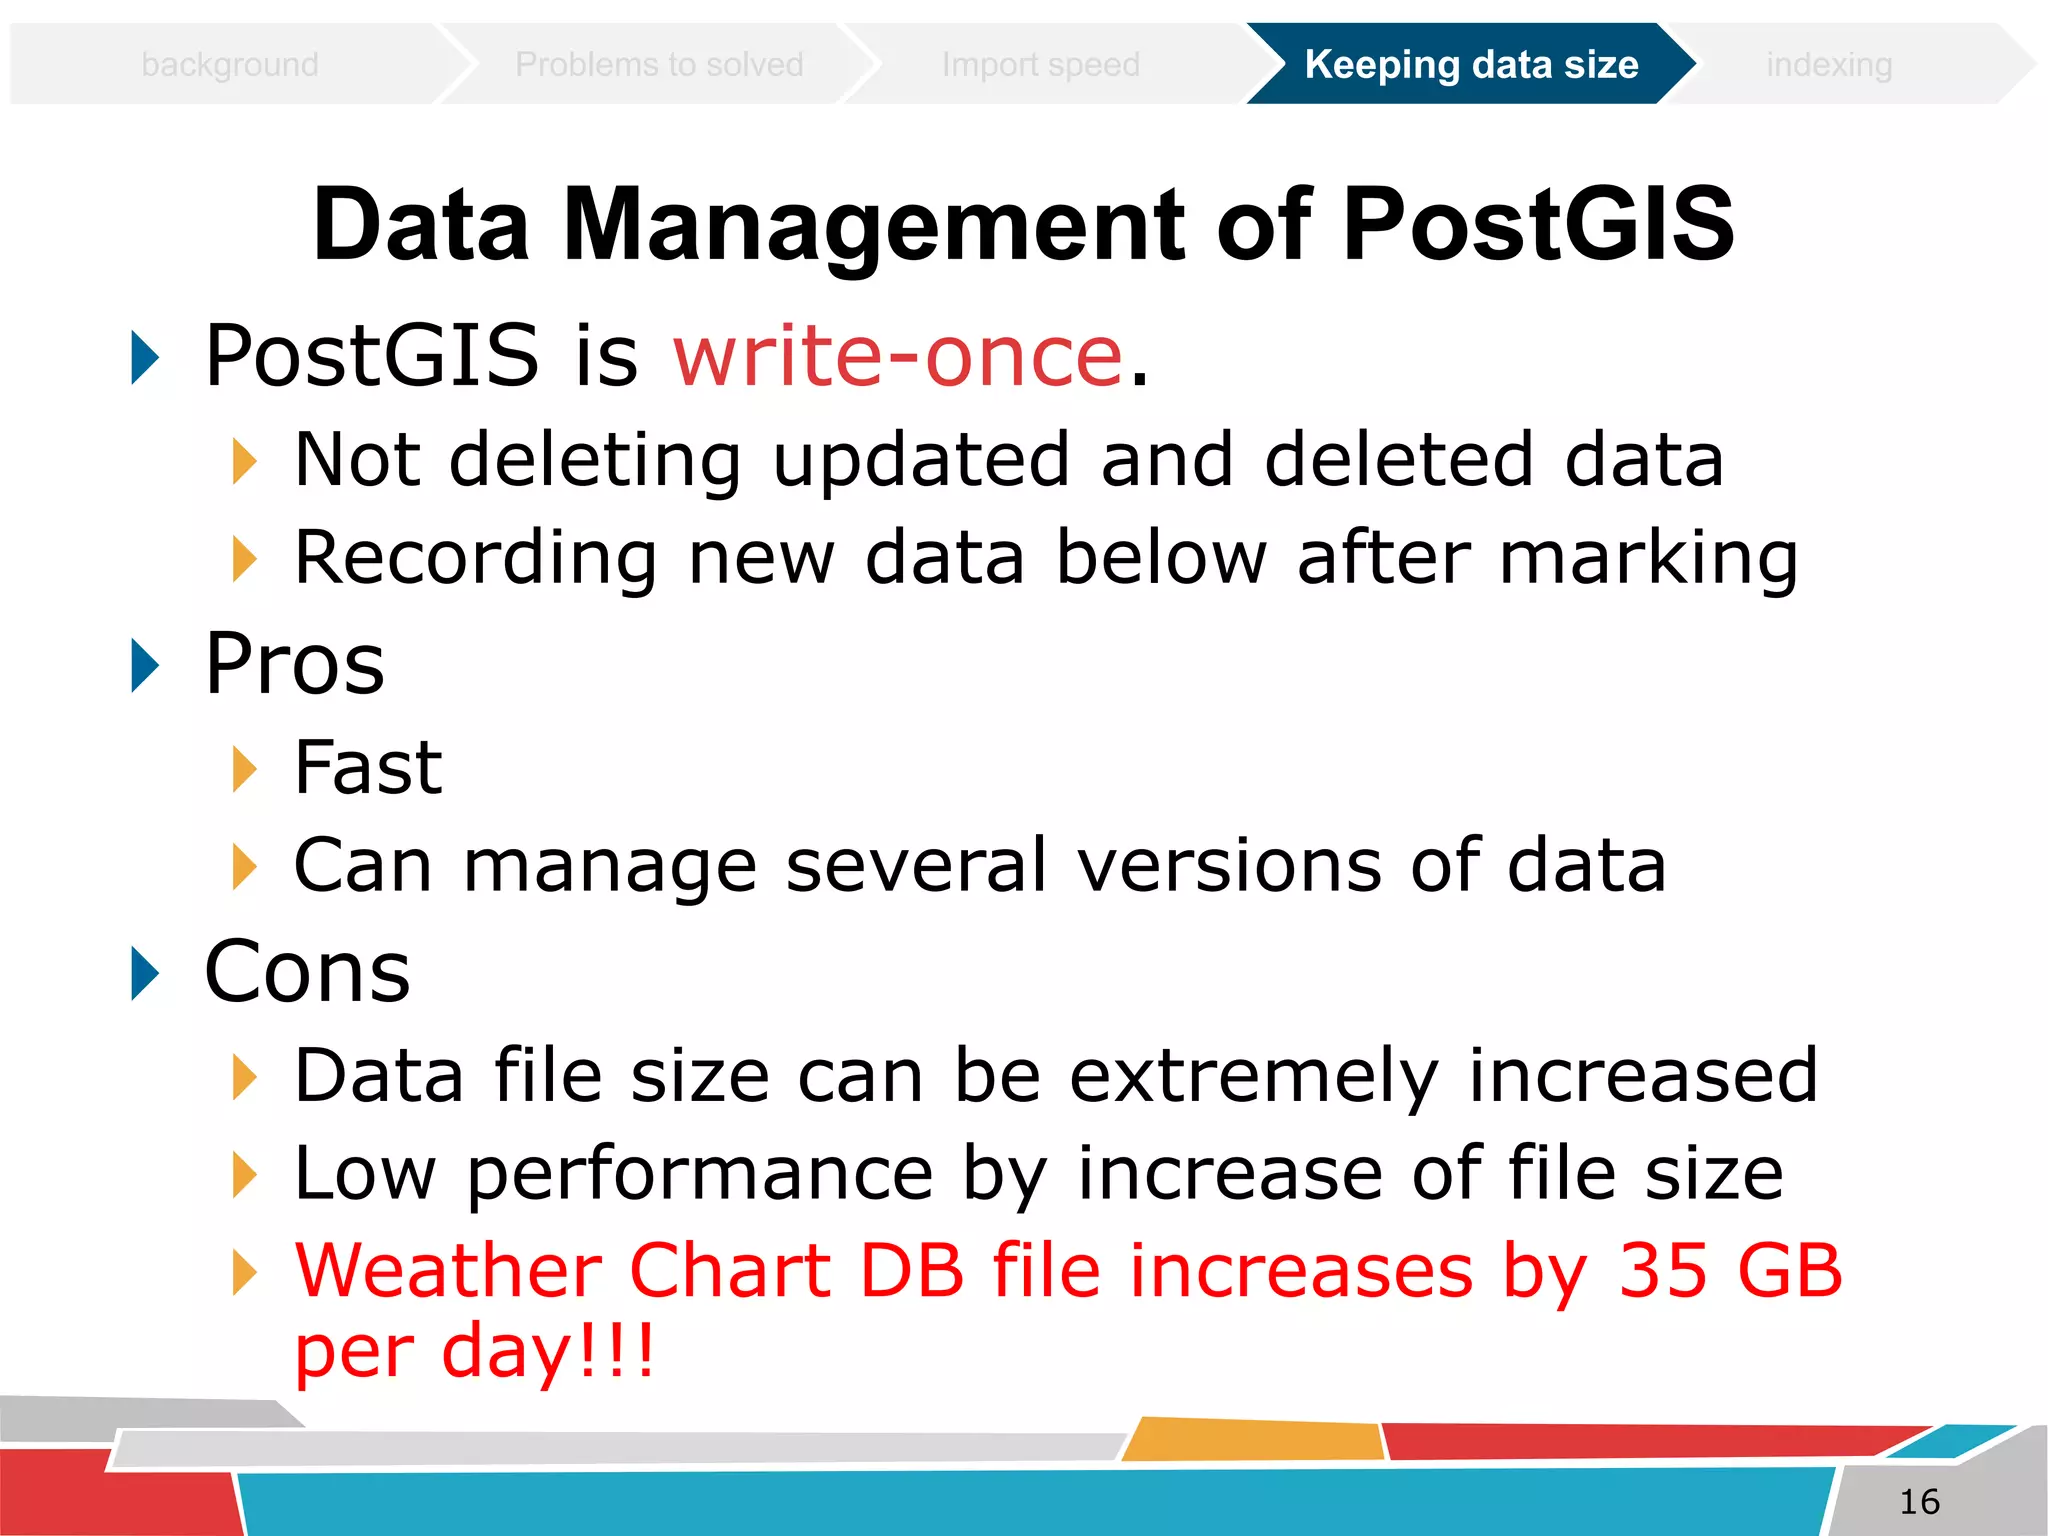
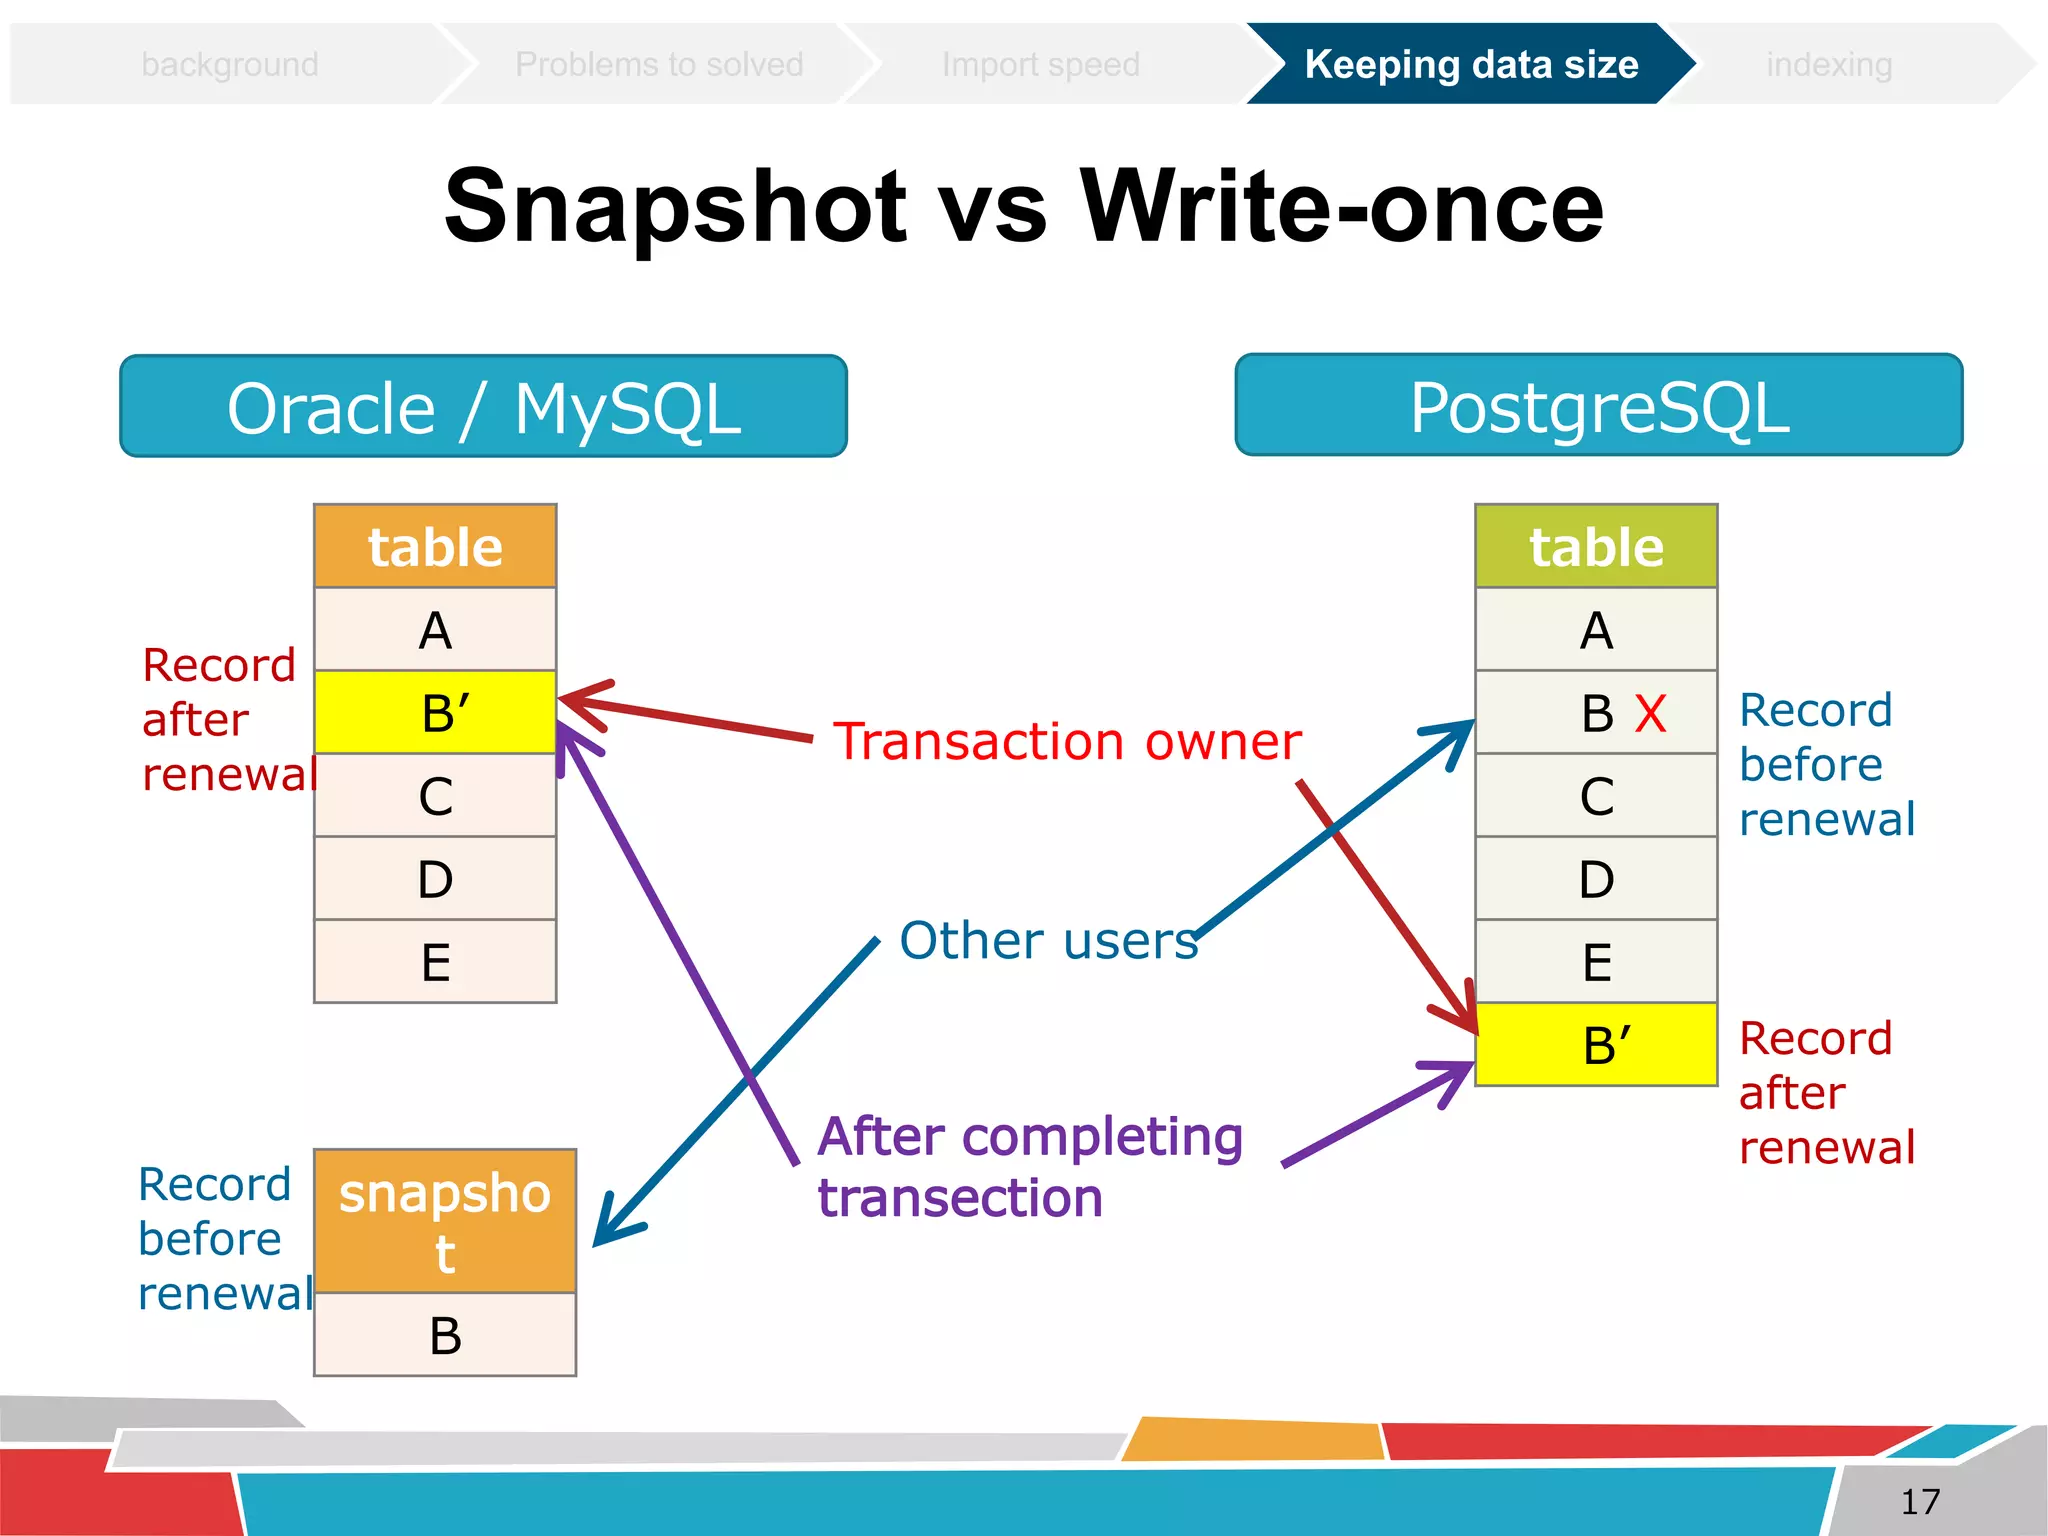
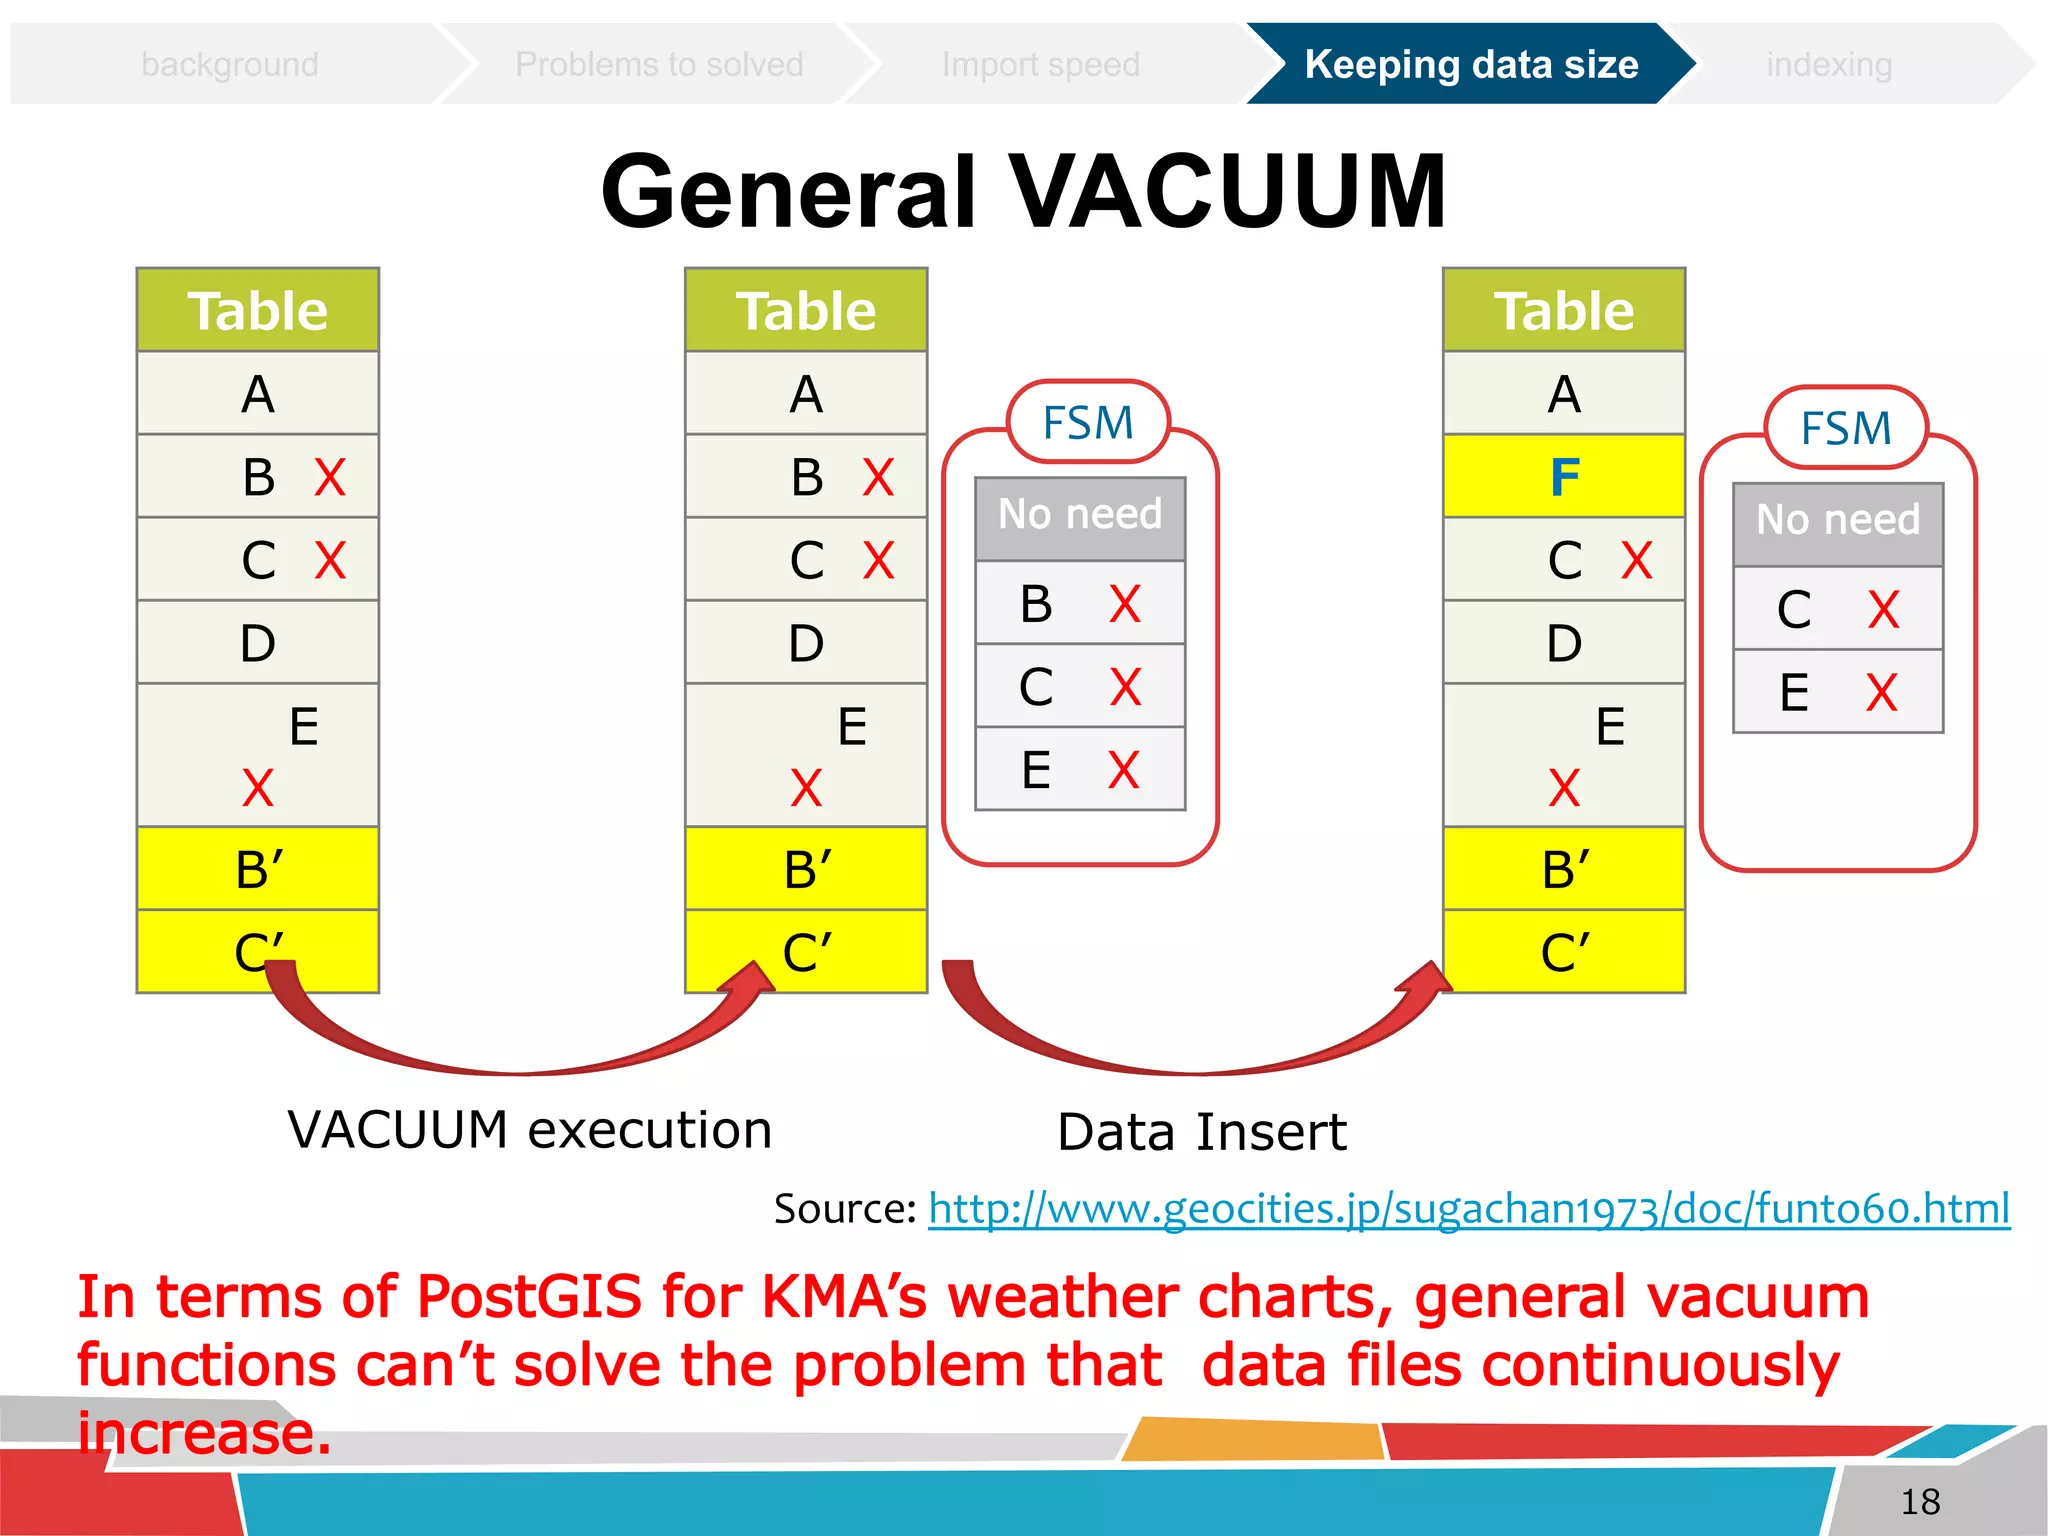
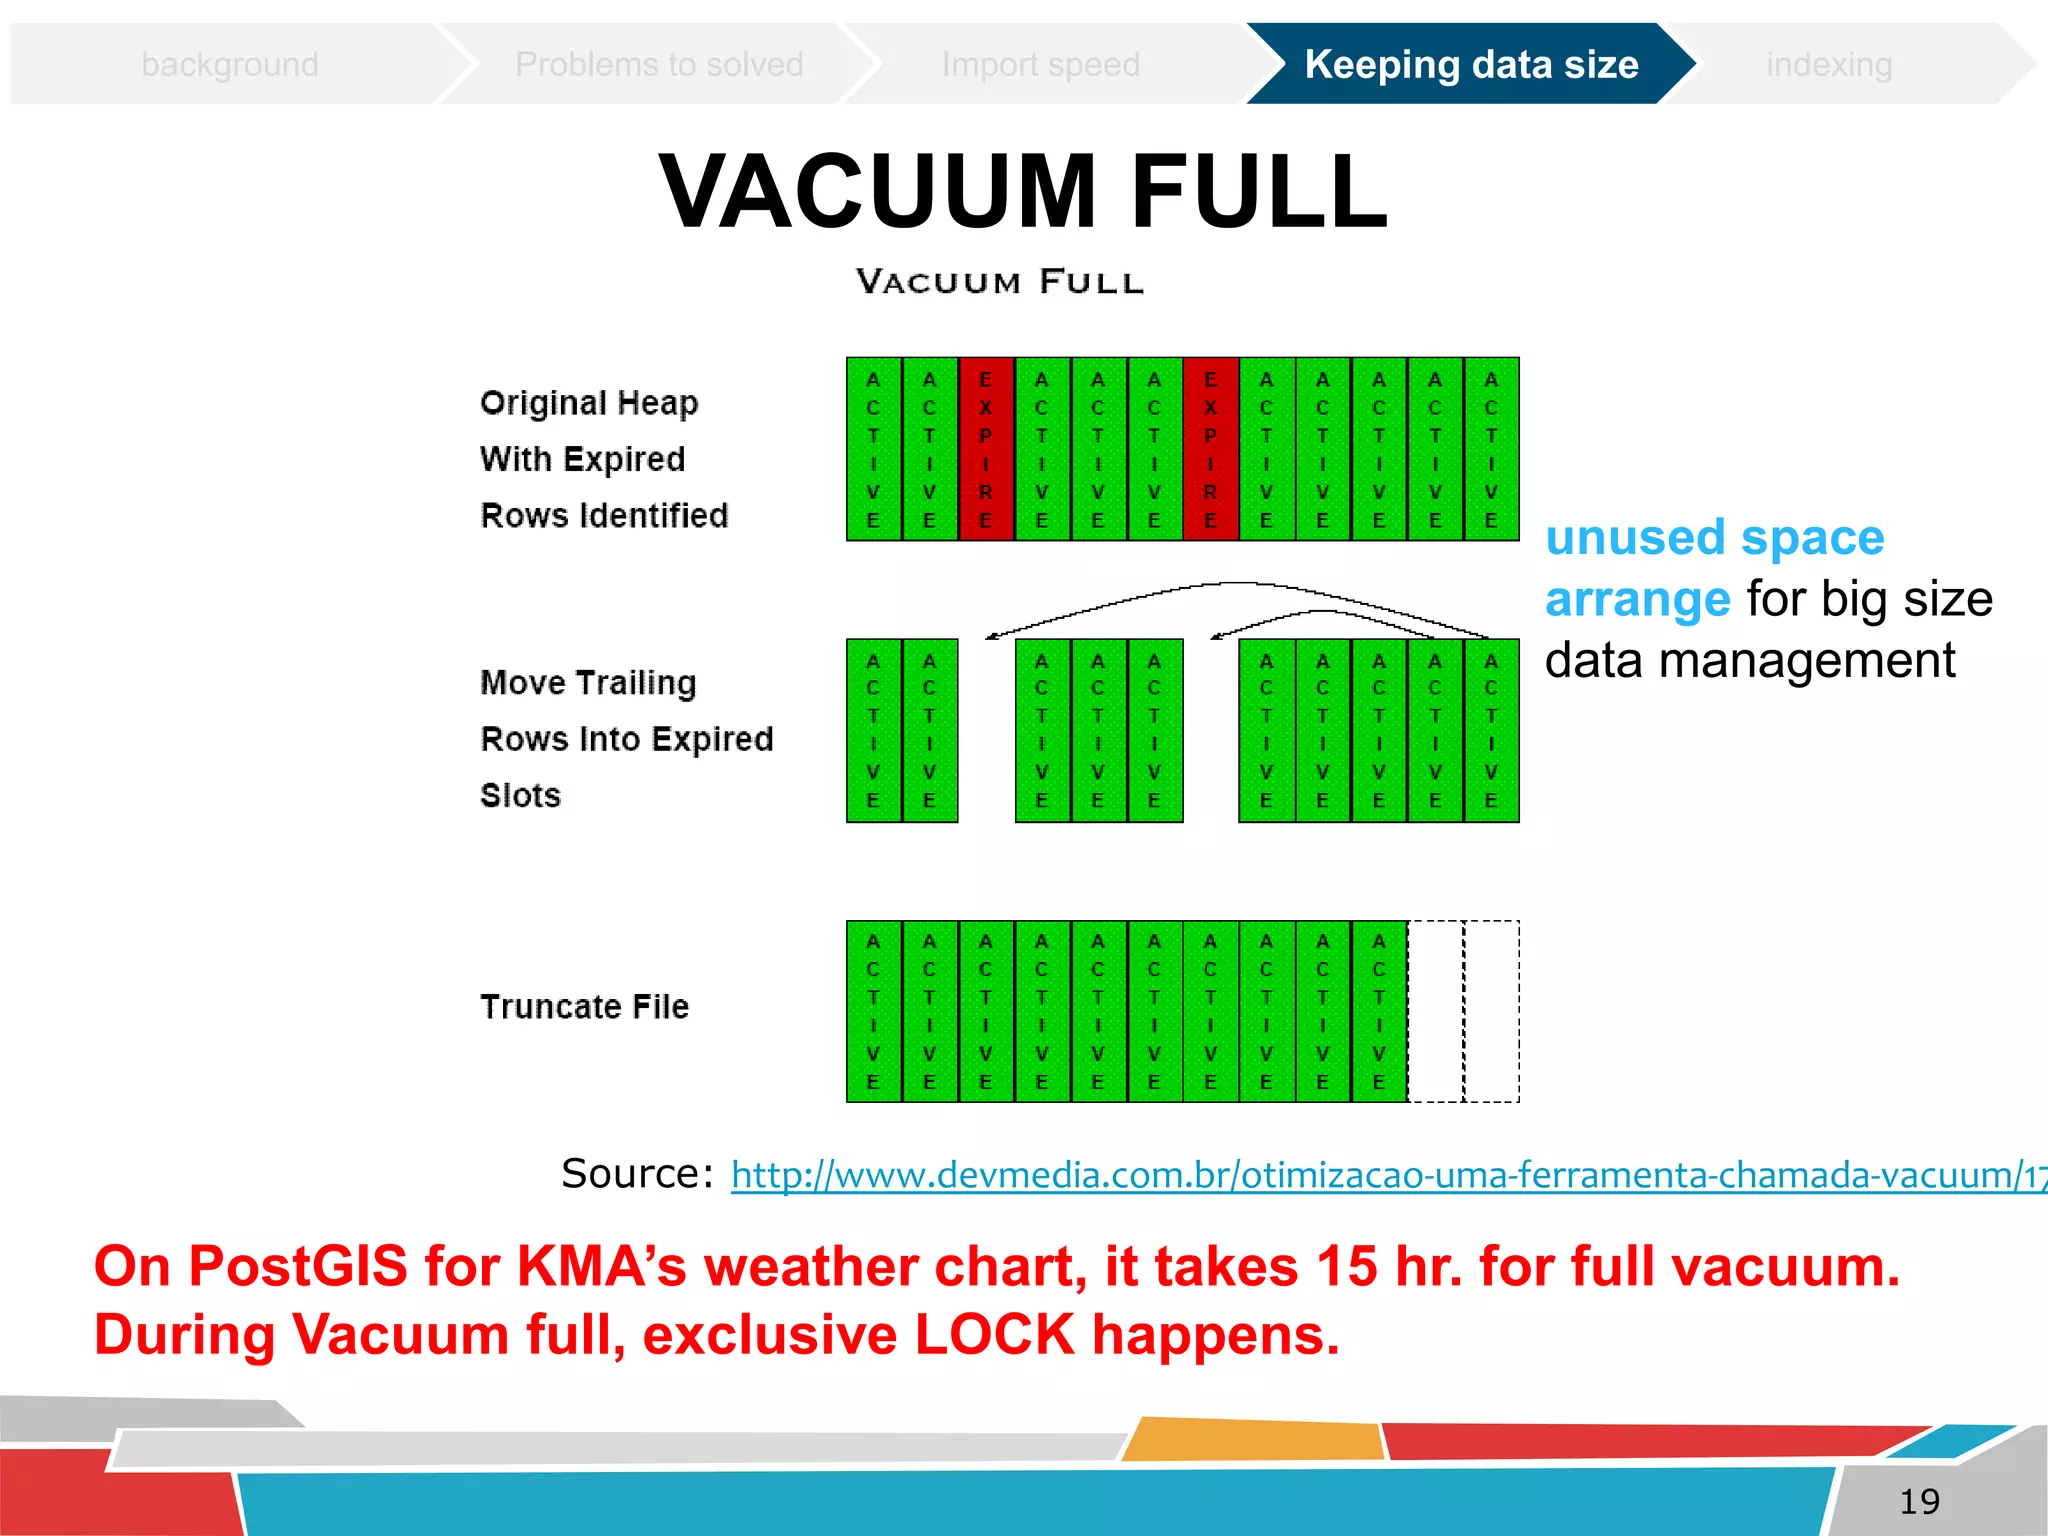
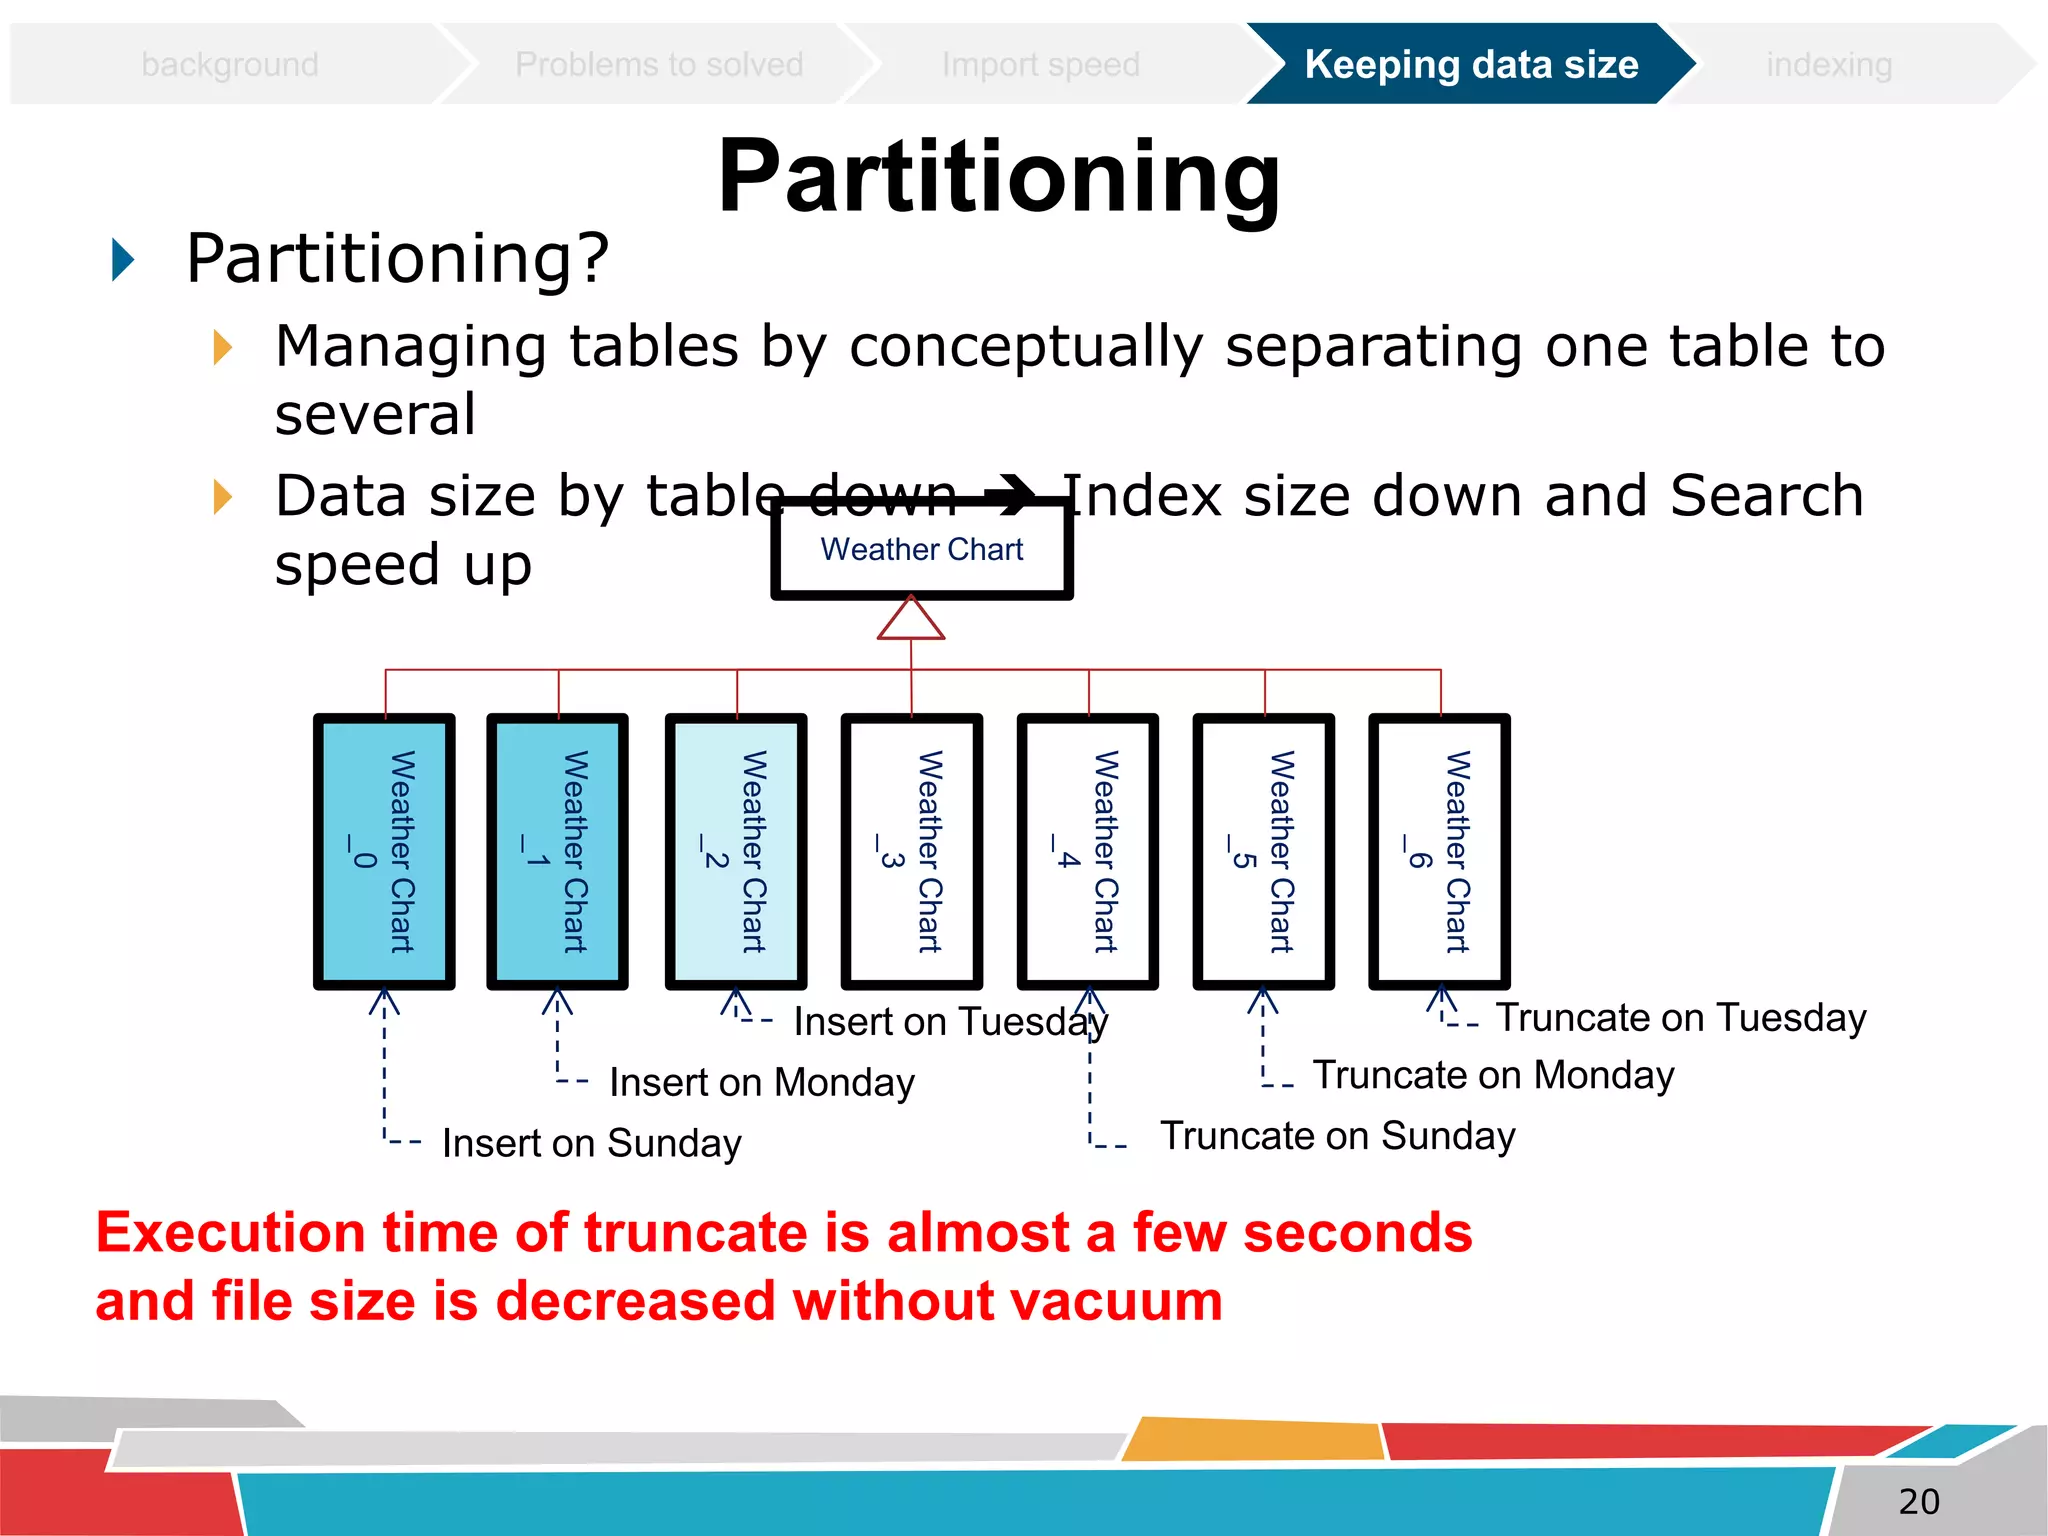
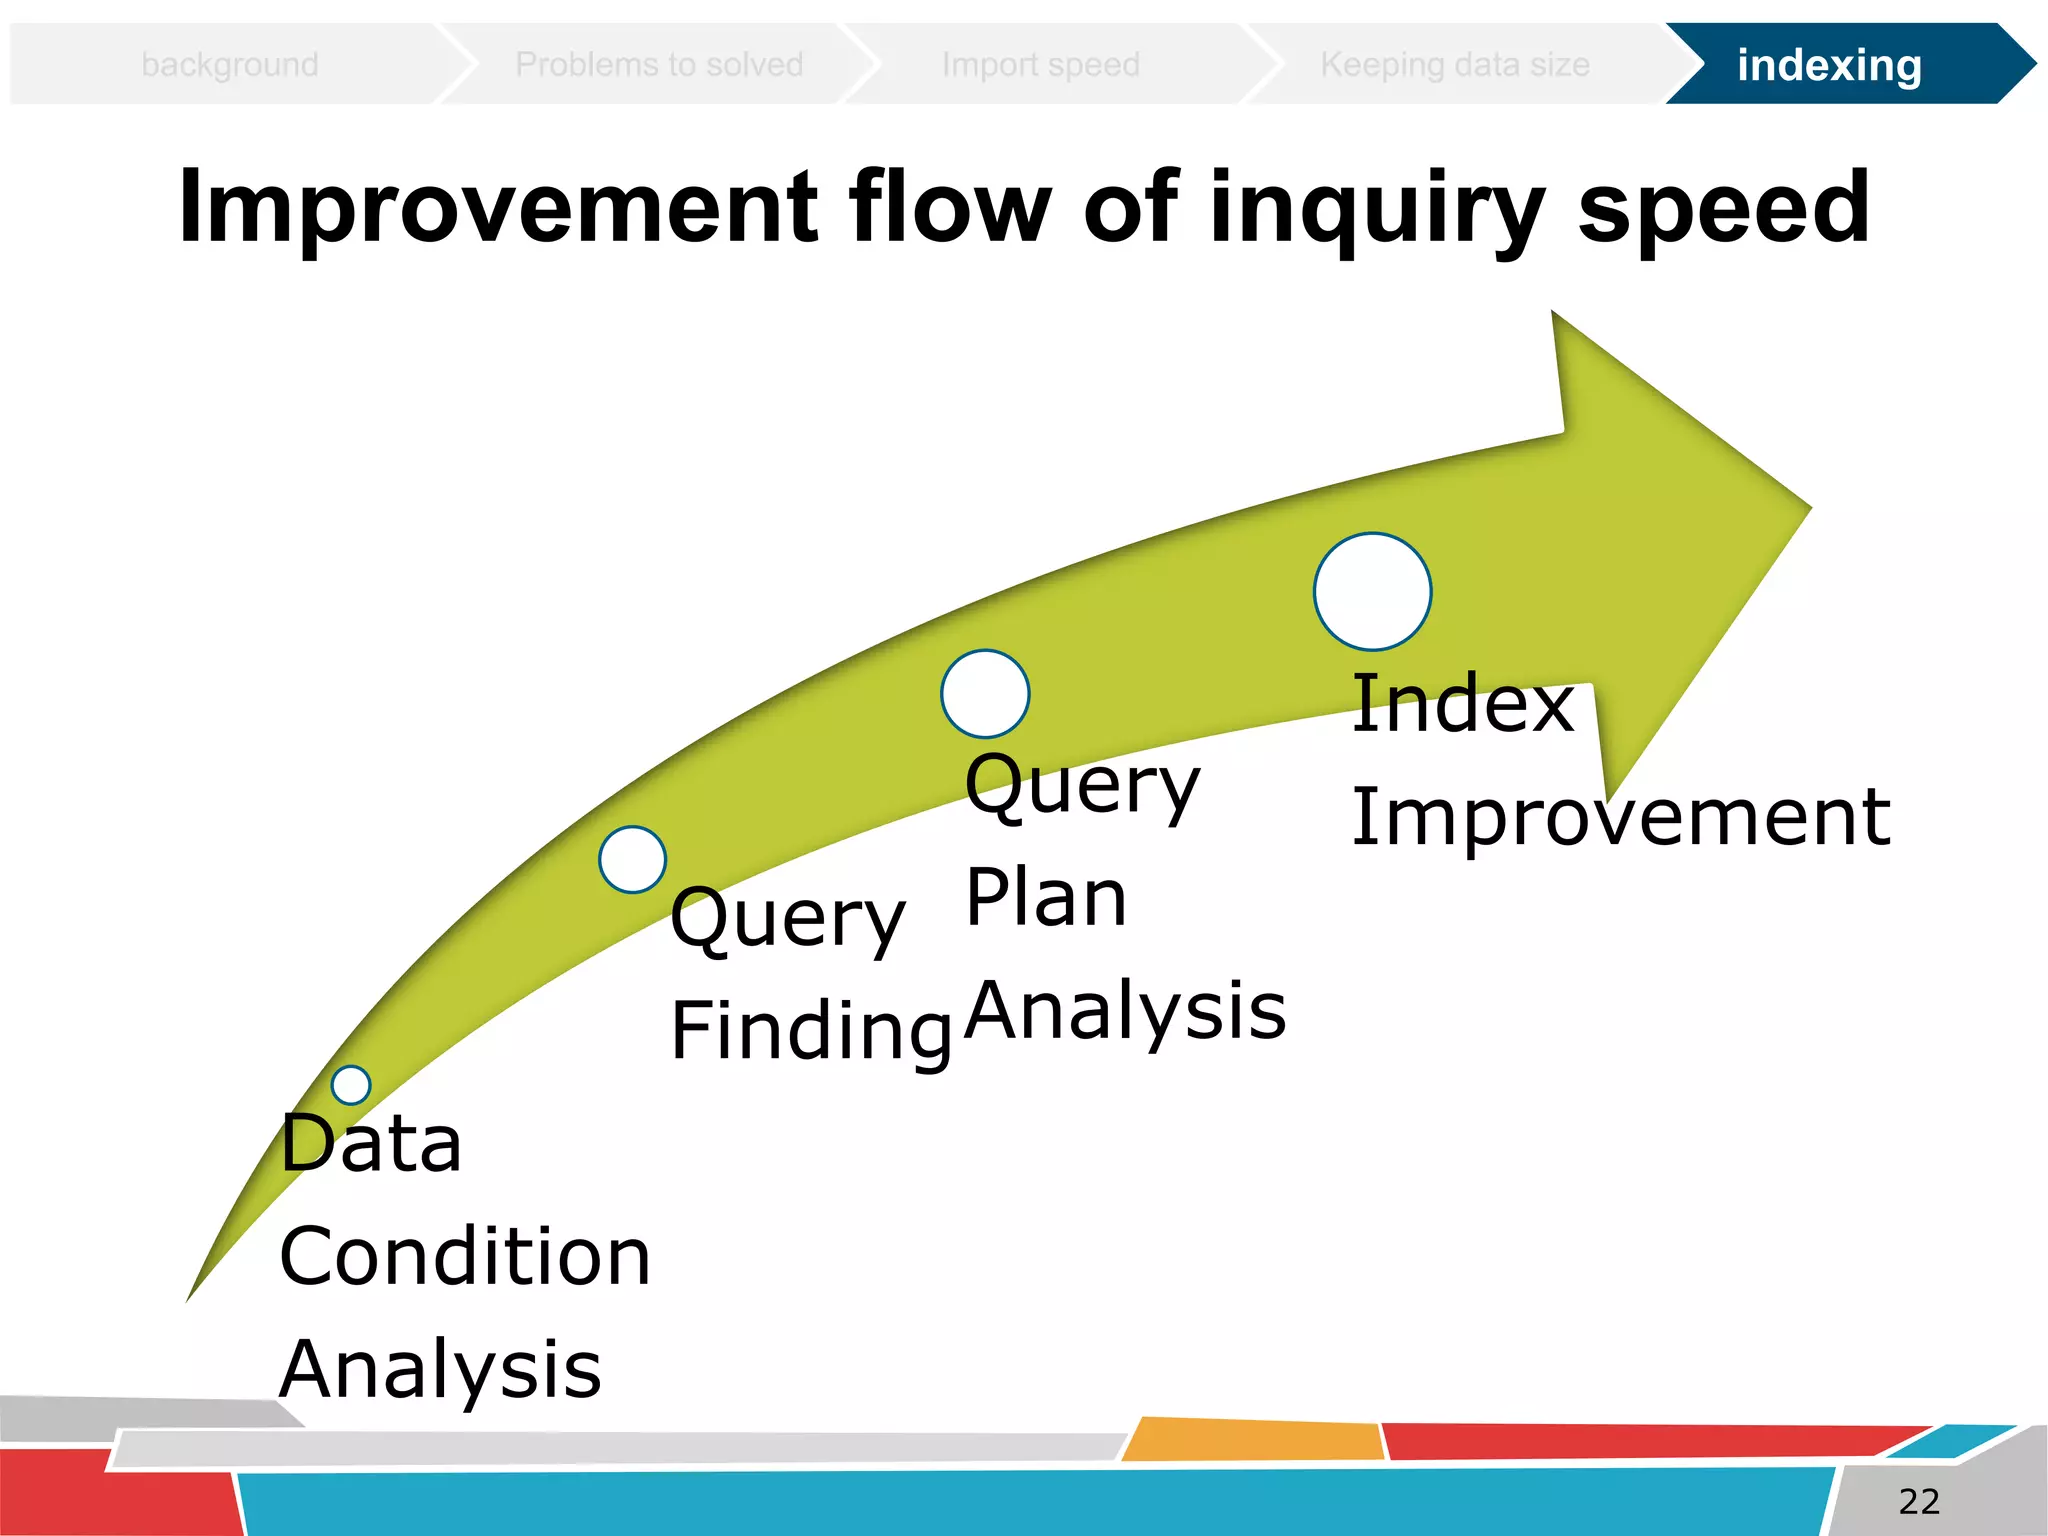
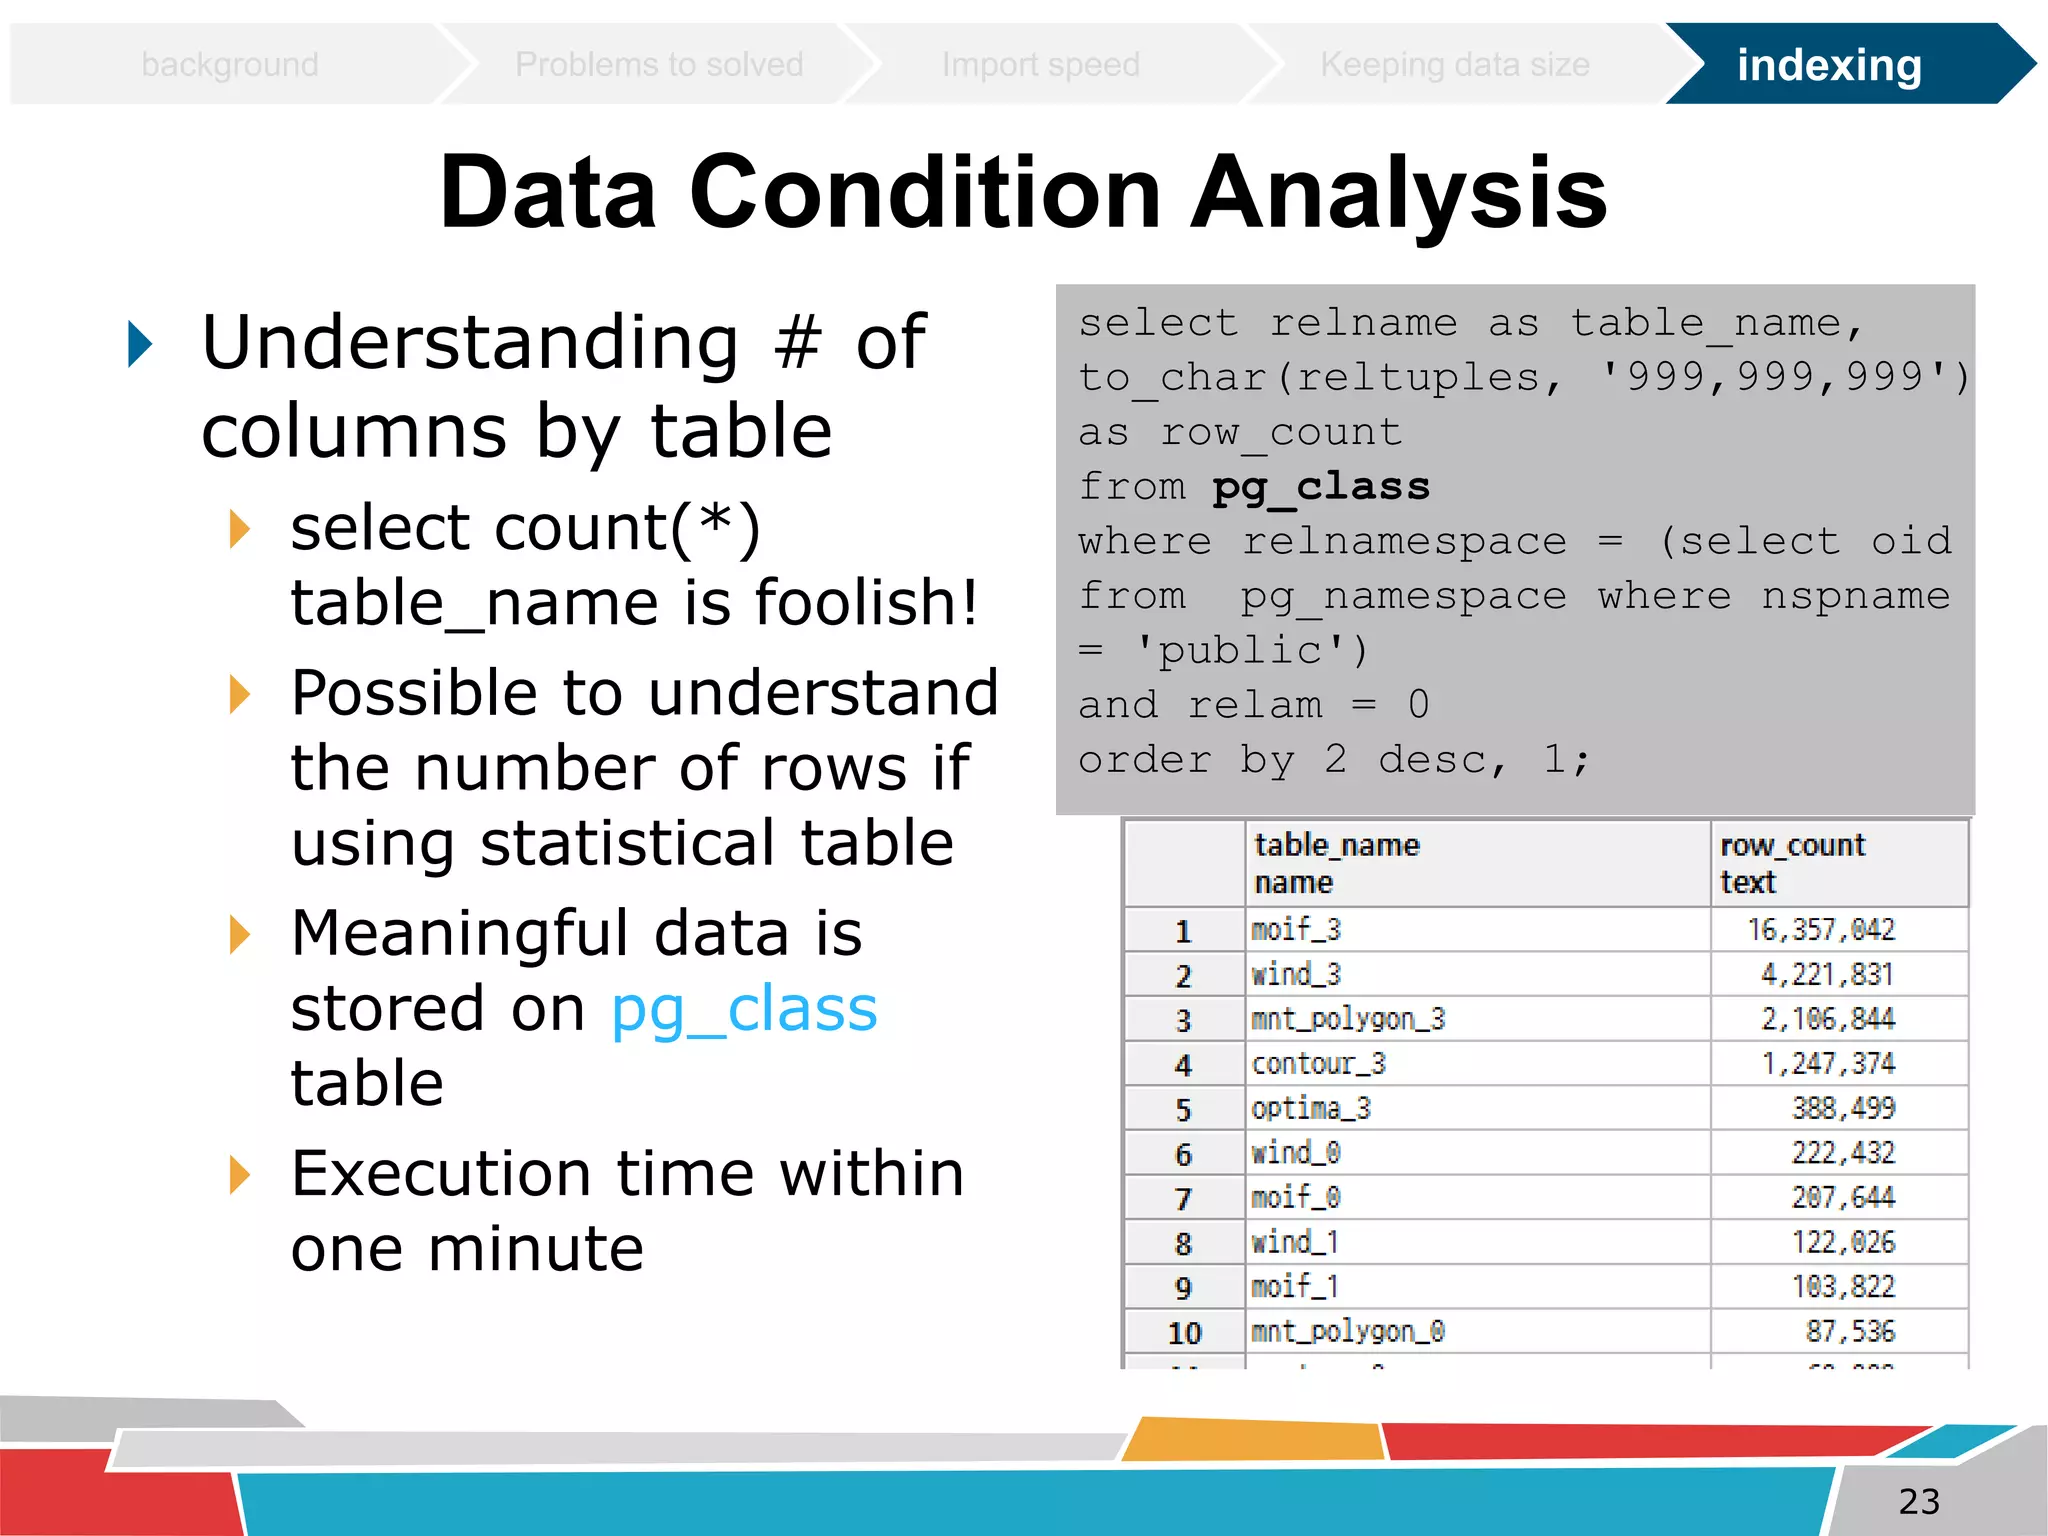
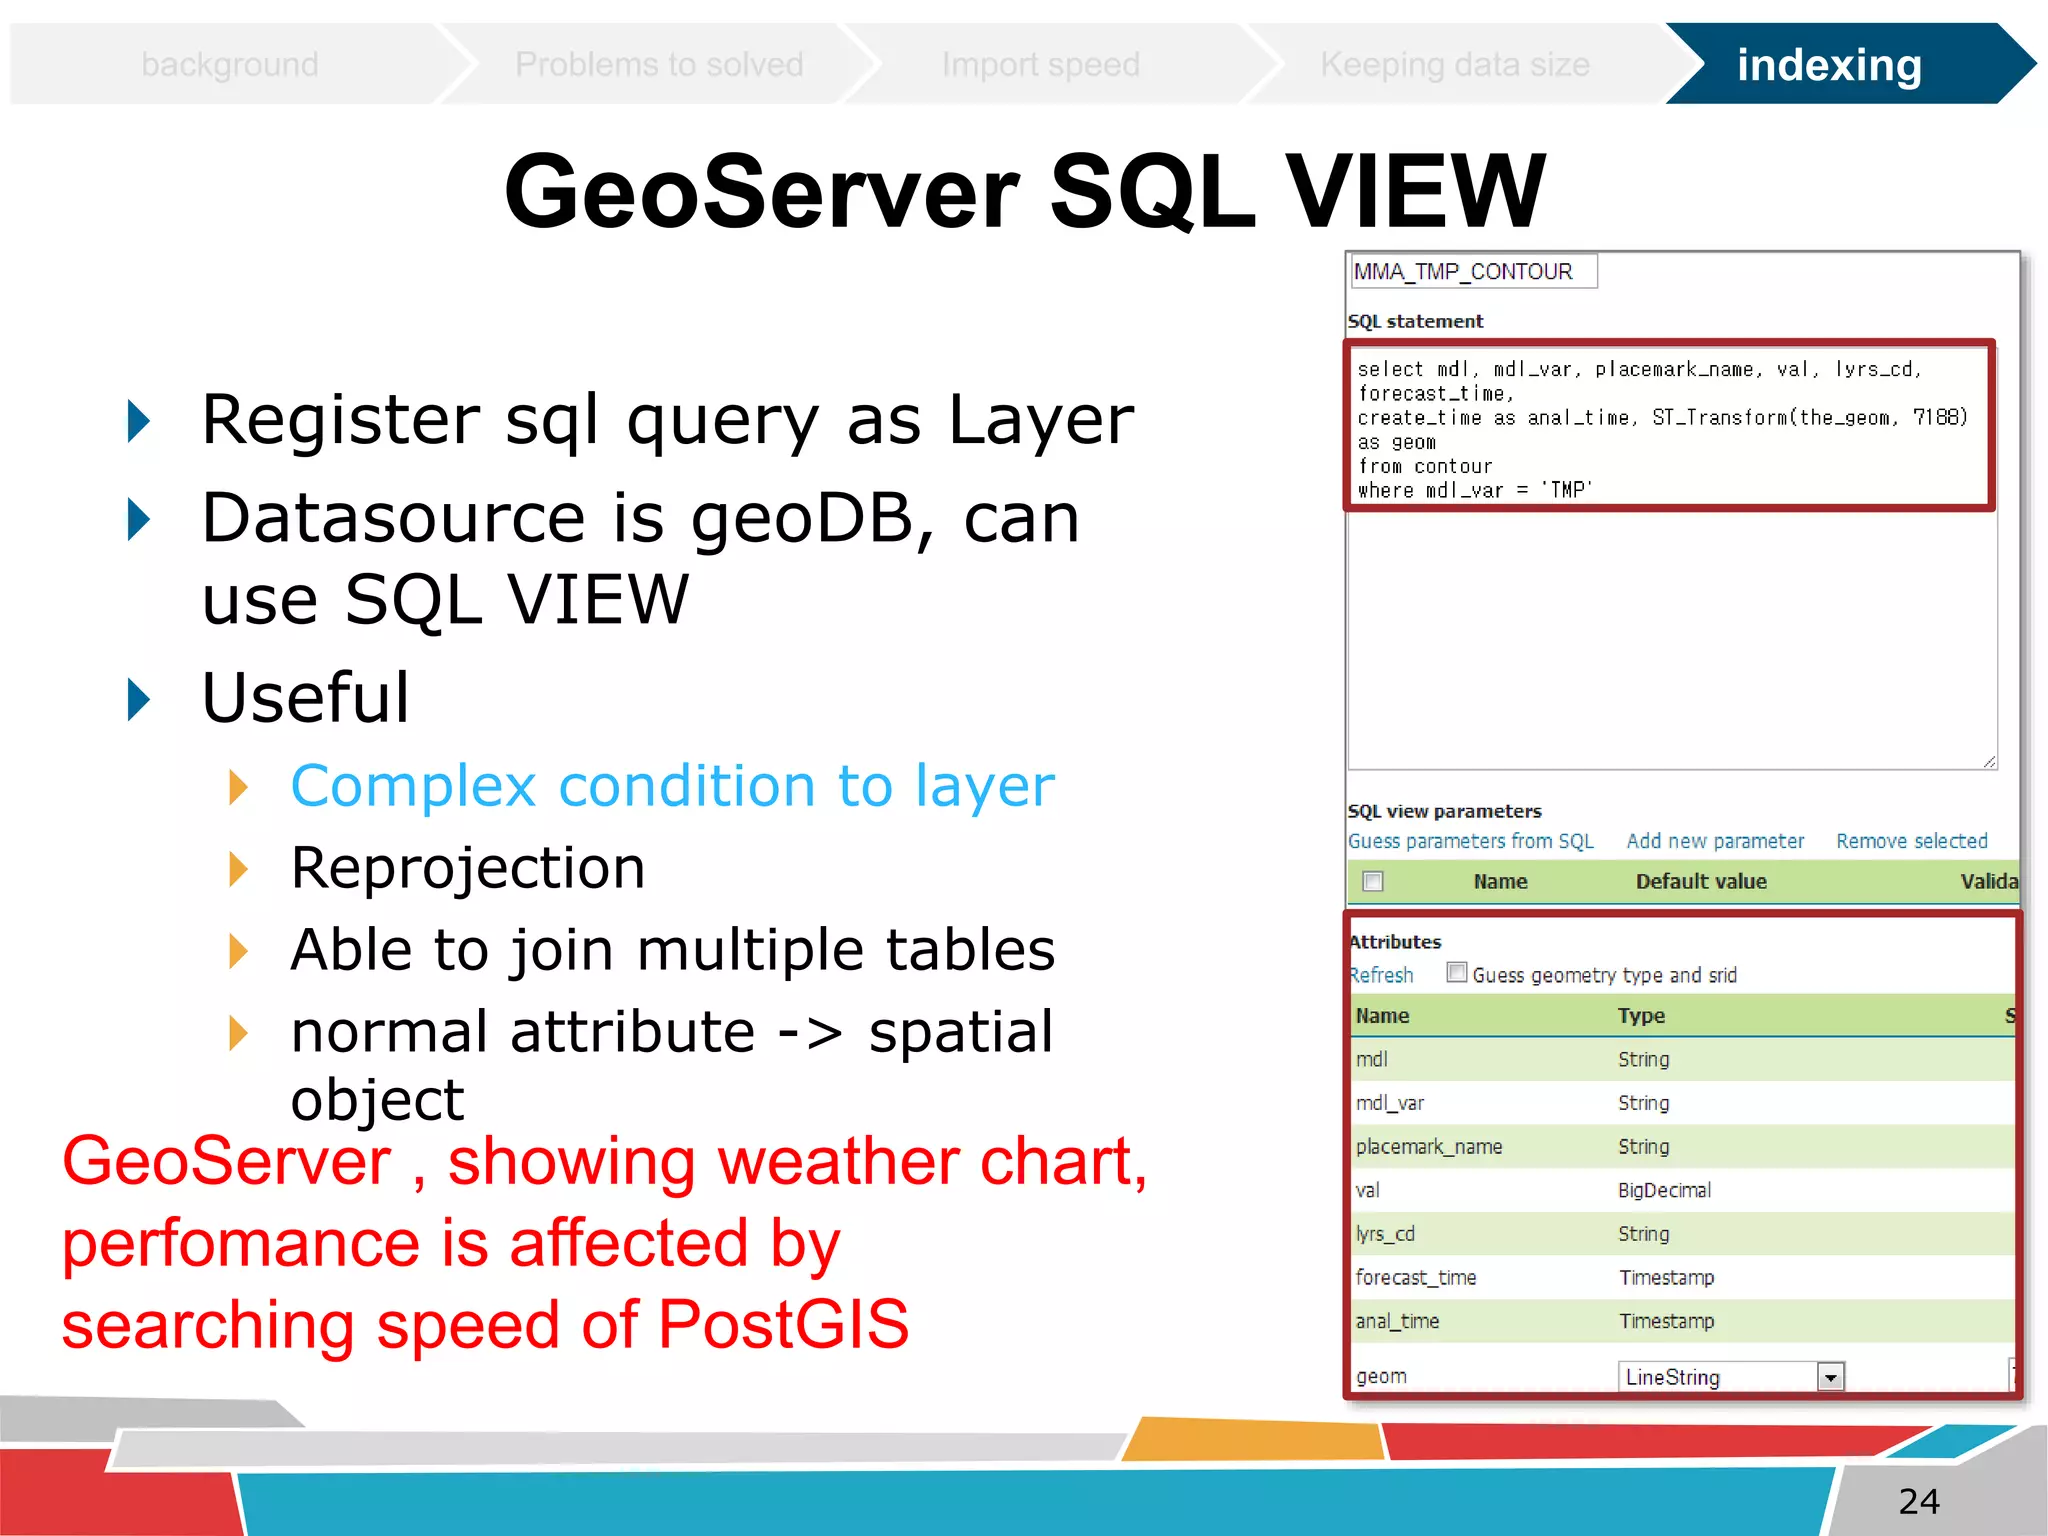
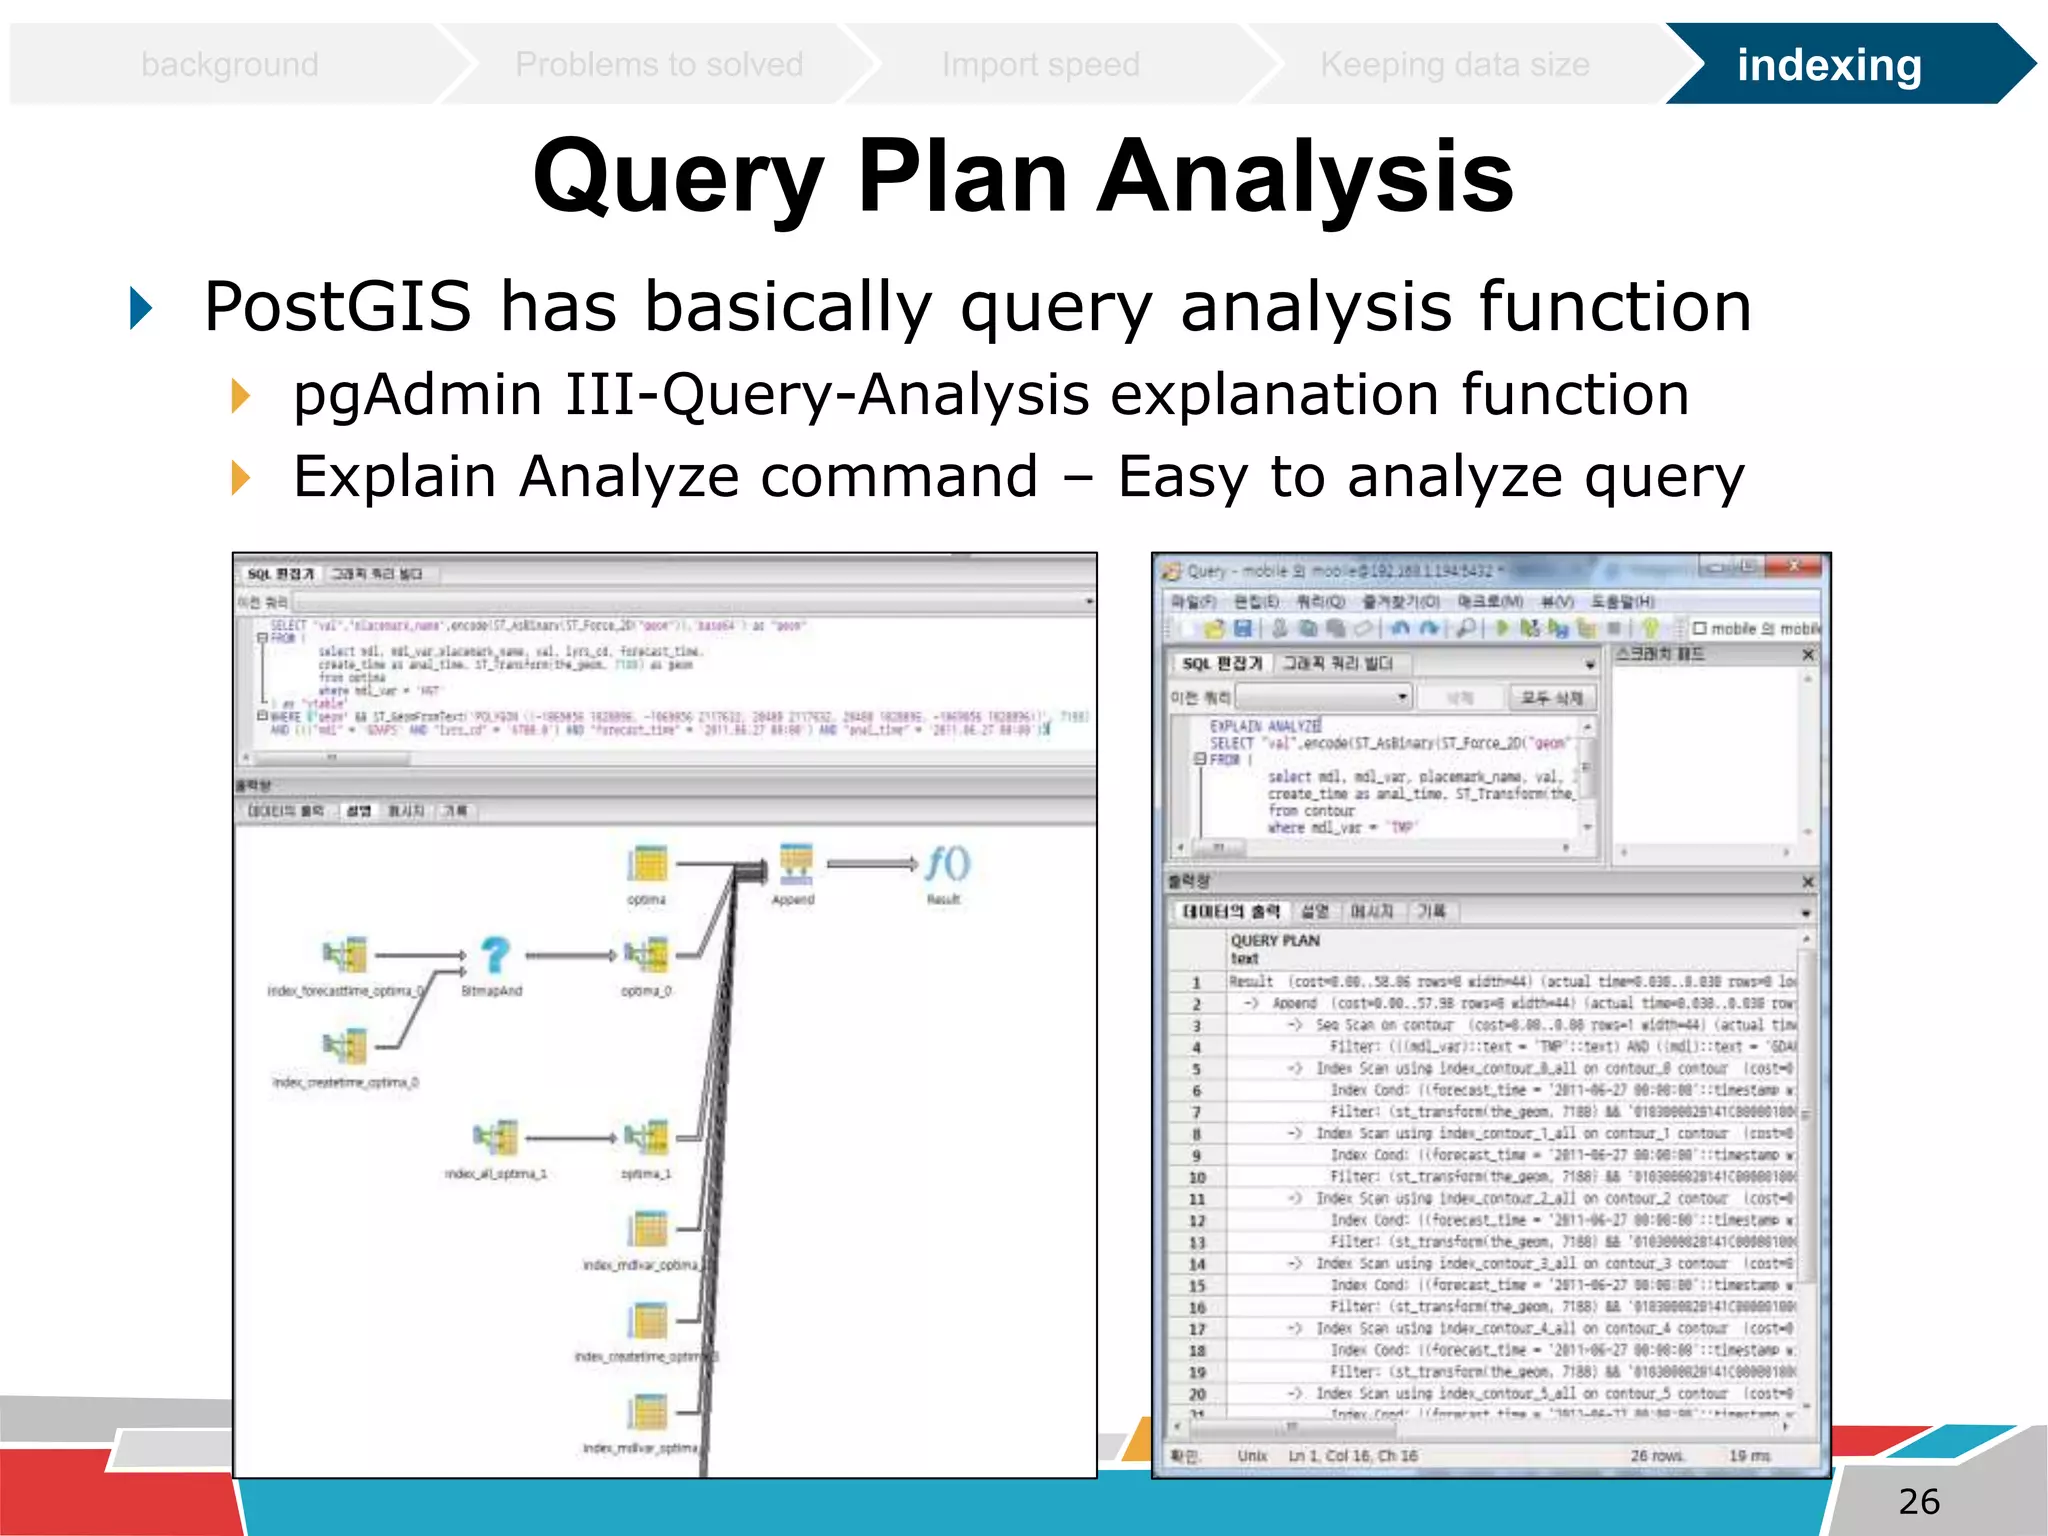
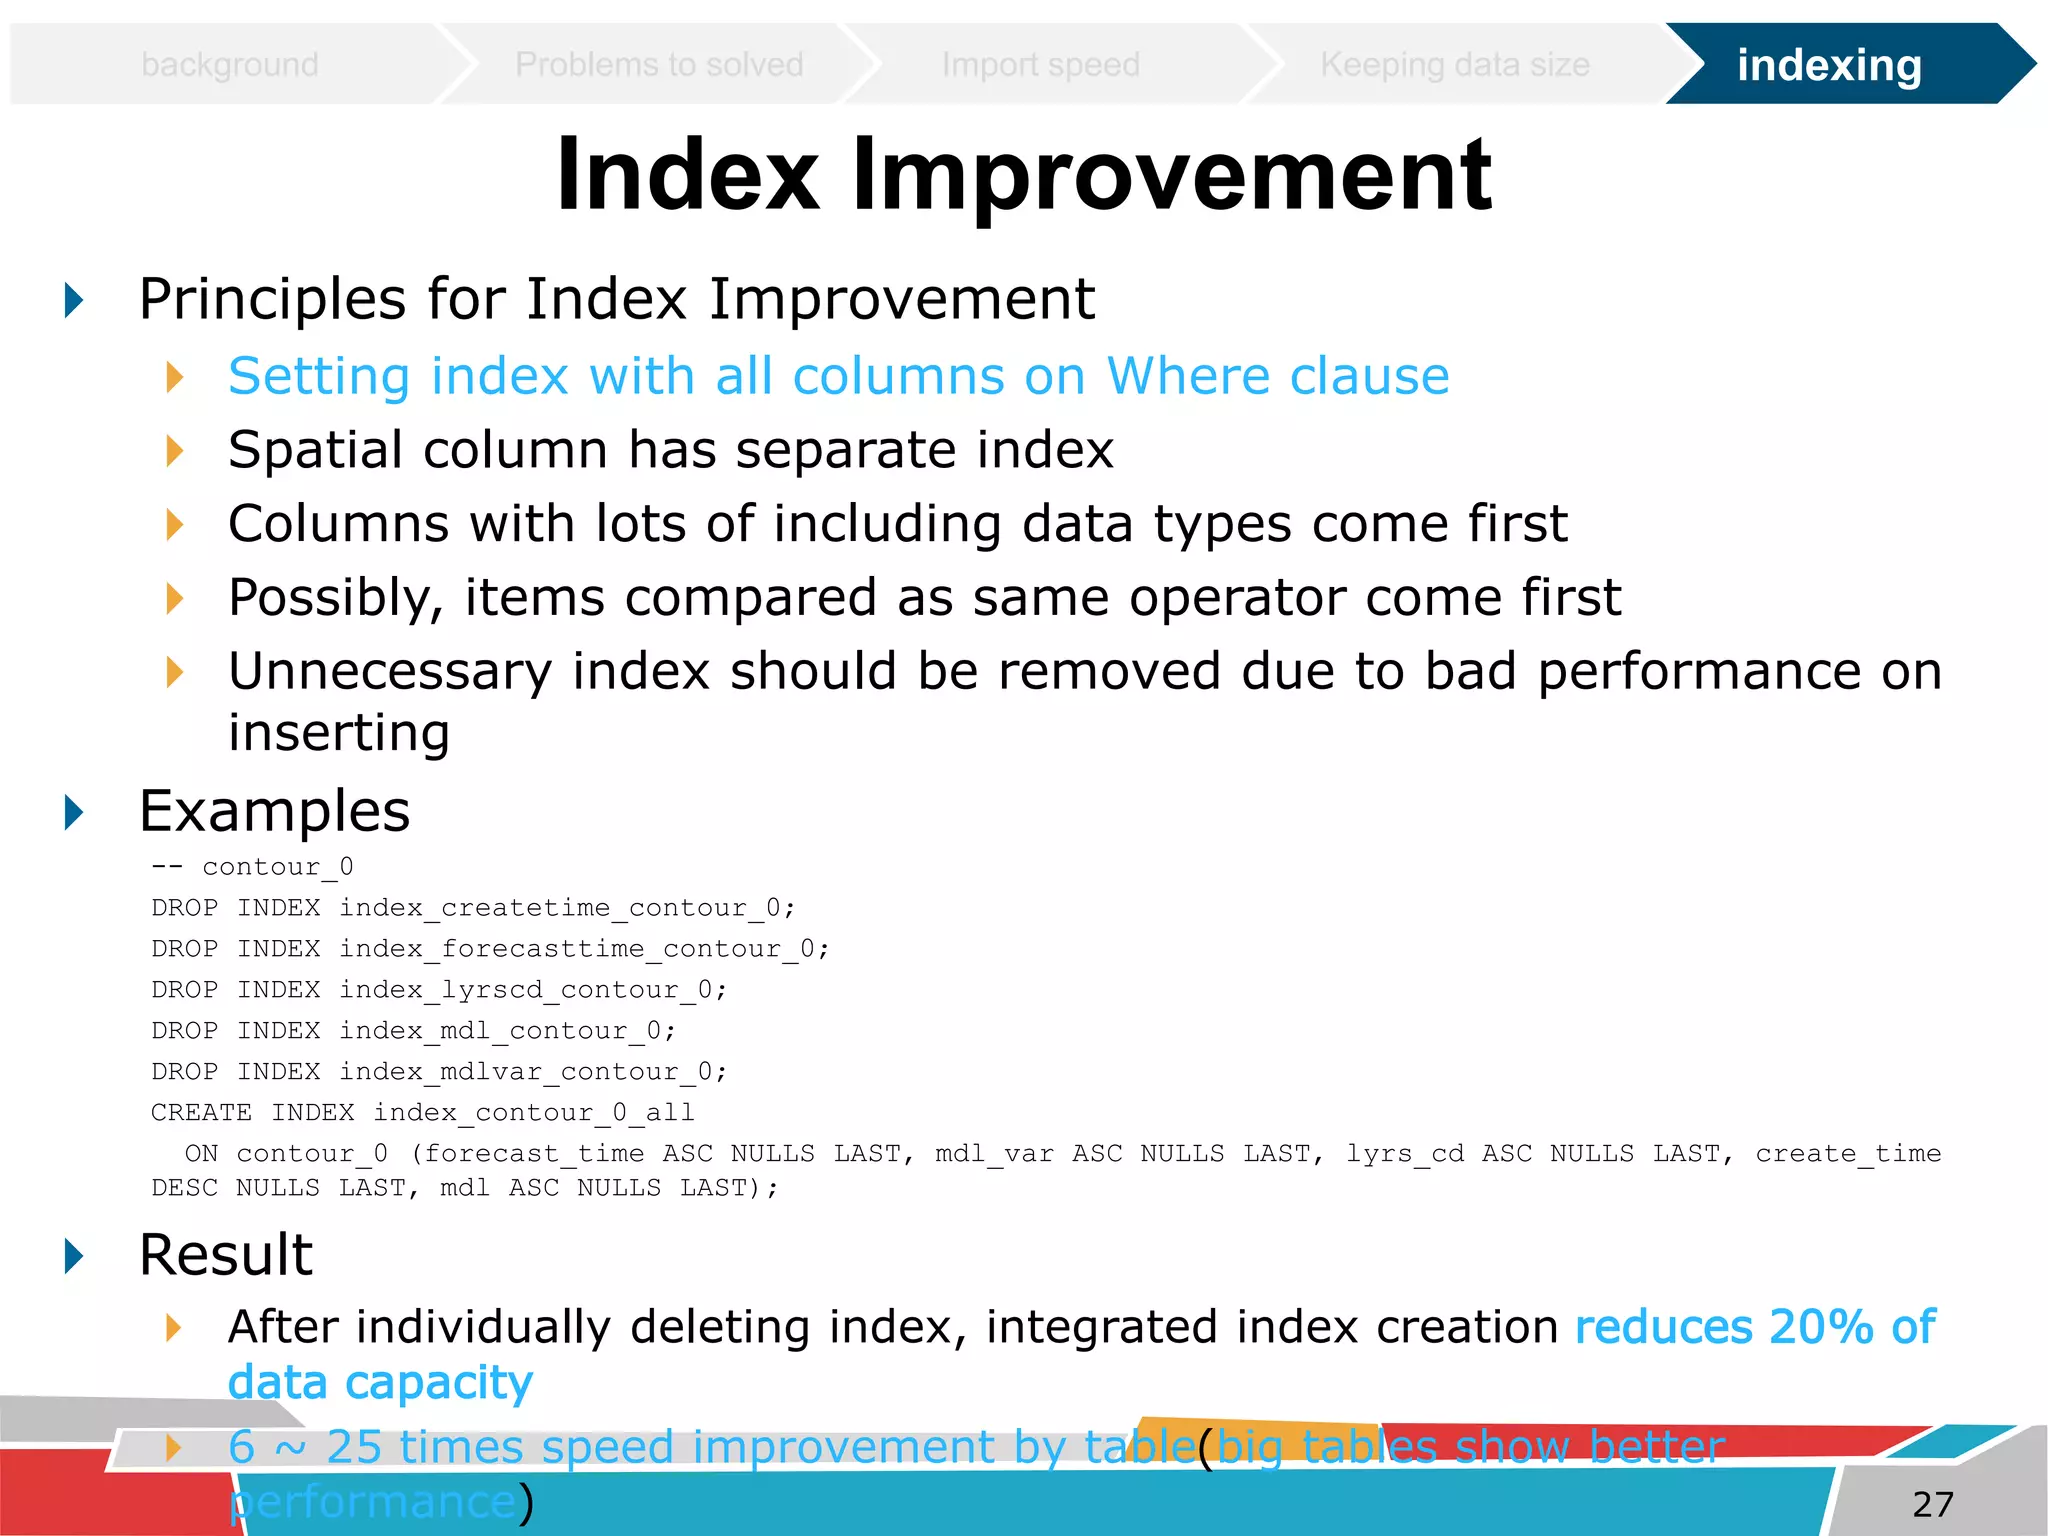
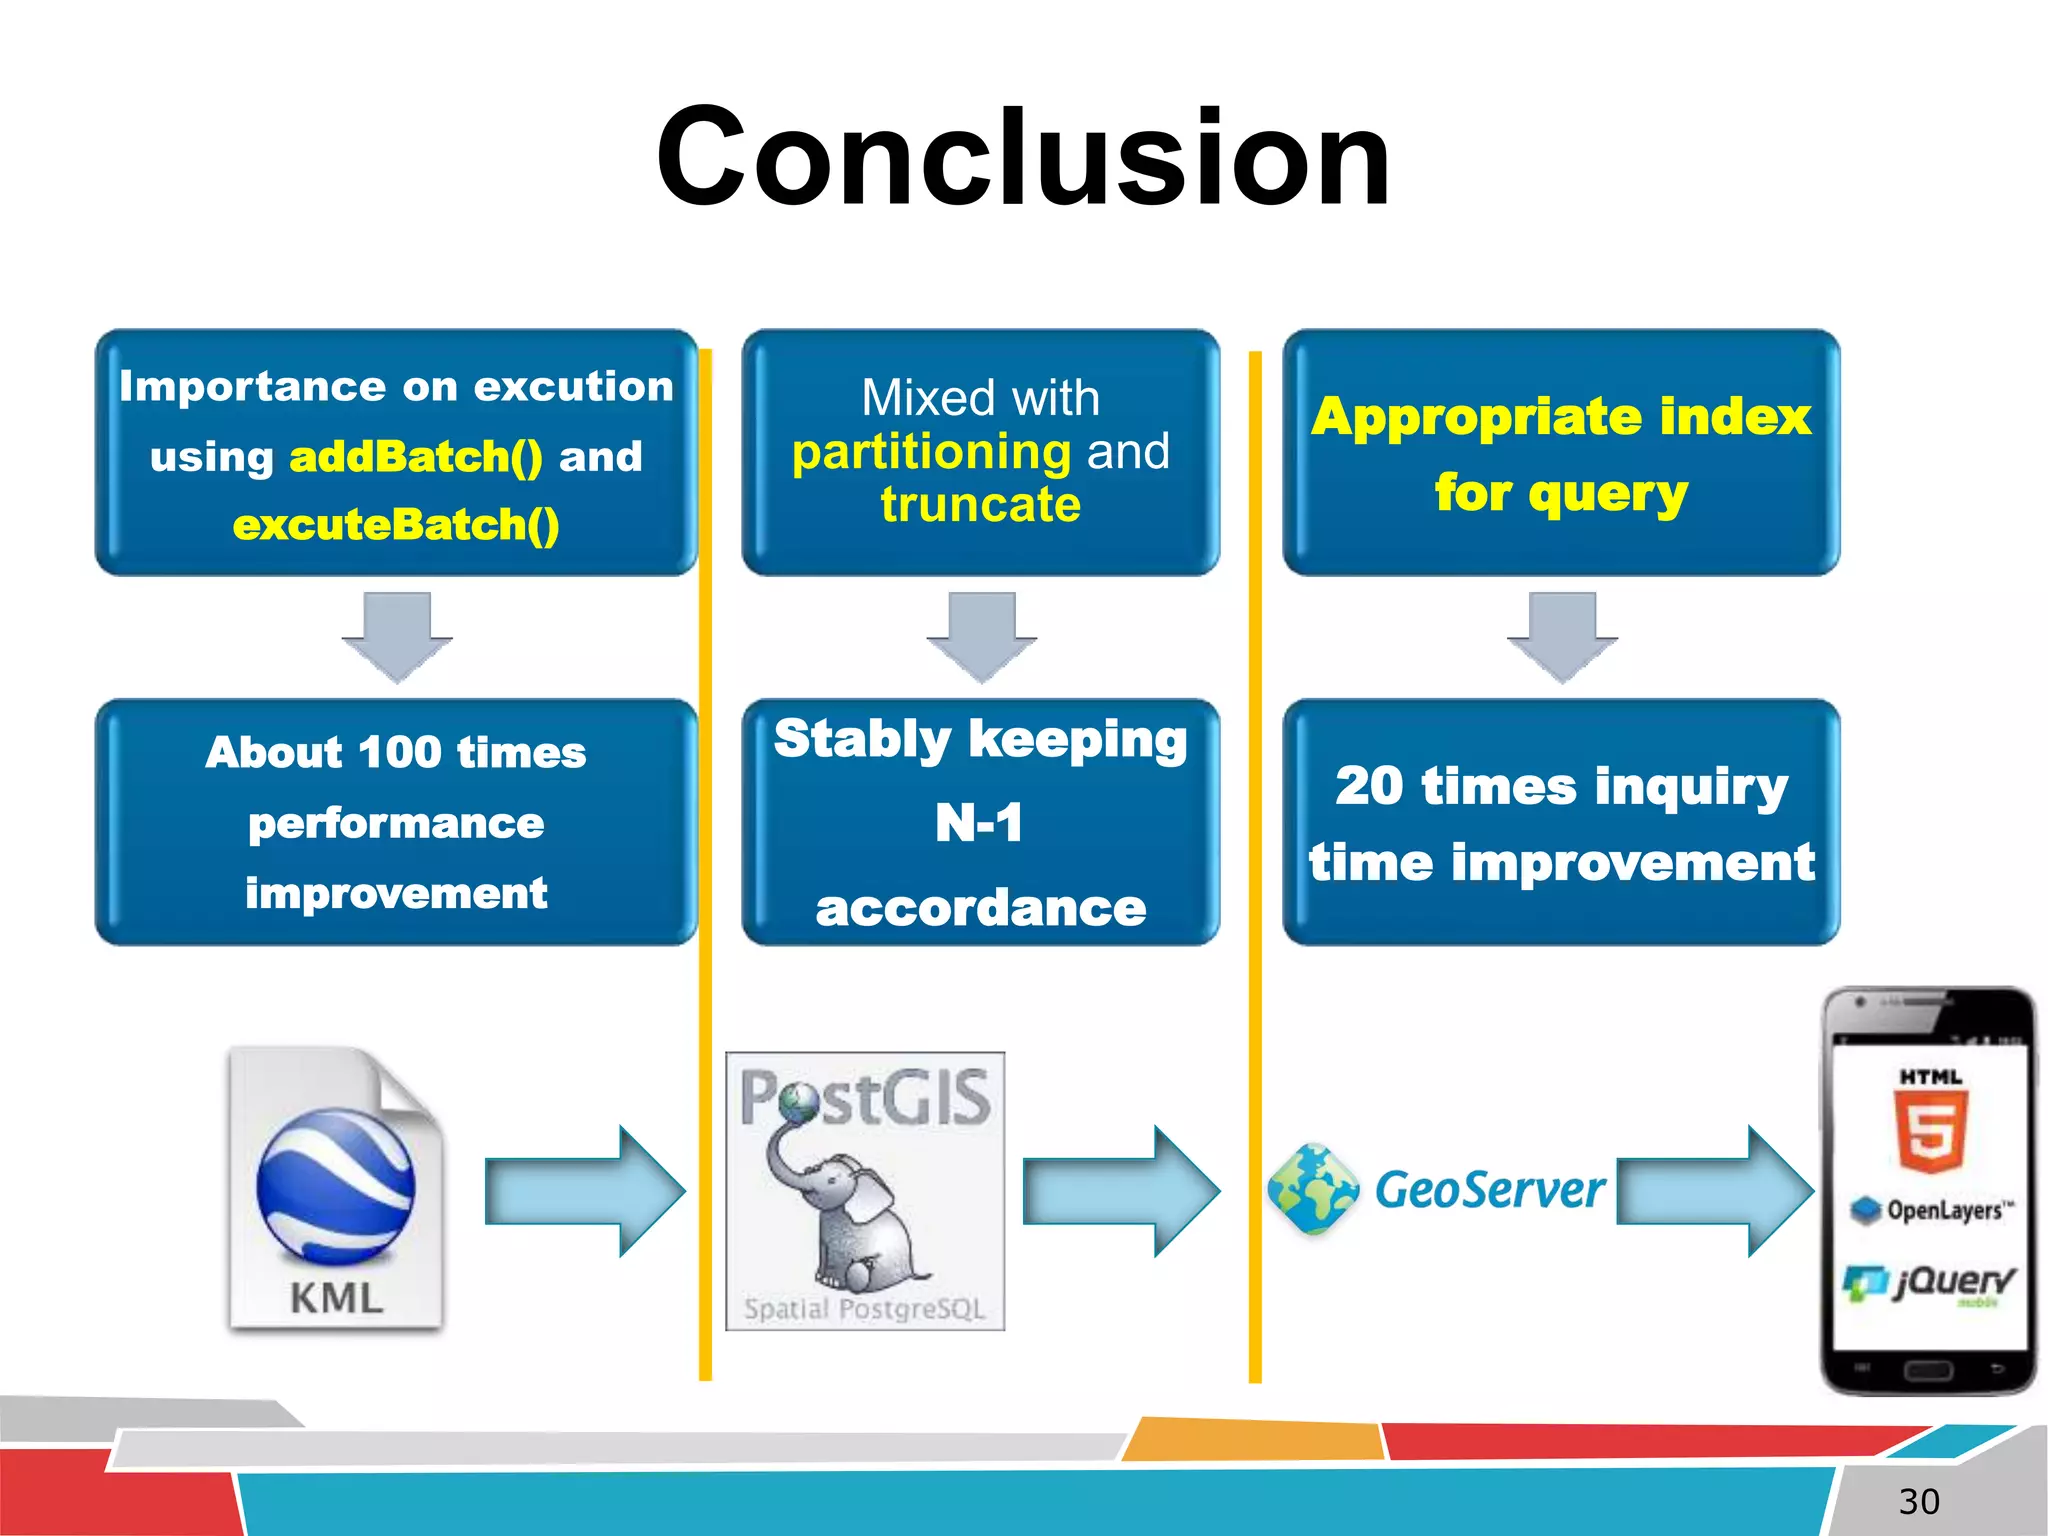
SlideShare a Scribd company logo
1 of 32
Big size meteorological data processing 
and mobile displaying system 
using PostGIS and GeoServer 
BJ Jang, JW Geum, JH Kwun, HG Park
 The system was SLOW not because of using PostGIS 
but because of NOT TUNING. 
 PostGIS definitely could make good performance if the 
system has been PROPERLY TUNED. 
 Let’s go over some tuning skills from CASE OF MOBILE 
weather chart service of KMA. 
2 
Objective
Background 
3
background Problems to solved Import speed Keeping data size indexing 
Mobile Weather Chart Service Flow 
Observation 
Data 
Model 
Improvement of performance part 
by tuning 
4 
GRIB 
Data 
Vector 
Chart 
Chart 
Service 
Vectorize Image 
GRIB Data Weather Chart for service 
Korea Meteorological Administration 
Vector Chart 
※GRIB DATA : GRIdded Binary or General Regularly-disrtibuted Information in Binary form 
- standardized by the World Meteorological Organization
background Problems to solved Import speed Keeping data size indexing 
Vector Weather 
Chart 
5 
Software Architecture
background Problems to solved Import speed Keeping data size indexing 
Characteristics of Weather Data 
6 
Low Resolution • Geographically low resolution 
• Surface + Height(Isobaric surface) 
• Analysis model 
• Data time + Forecasting time 
Multiple 
Dimension 
• A few times ~ hundreds times 
Frequent 
Production 
• Always need up-to-date data 
Realtime/ 
Near Realtime
background Problems to solved Import speed Keeping data size indexing 
Data usage per day 
times generation (00, 06, 12, 18 UTC) 
# of spatial table: 
# of weather charts: 
MB data 
# of spatial data columns:
Problems to be 
solved 
8
Problems of Existing System 
Slow data 
collection 
Difficult big 
size data 
management 
Slow searching 
for 
Weather Chart 
9 
background Problems to solved Import speed Keeping data size indexing
Why is the service slow? 
Failed to understand 
characteristics of data 
10 
background Problems to solved Import speed Keeping data size indexing
background Problems to solved Import speed Keeping data size indexing 
Improvement Goal 
11 
PRGOOBALLESMS AGCOTIAVLITSY 
5 hr to insert data 
Data file grows 35 GB per day 
Tens of seconds to search a 
single weather chart 
Inserting less than 3o min. 
Keep the size of data file fixed 
Searching a weather chart within 
a few second
Improvement on importing 
speed for big size data 
using batch 
12
General Data Processing Time 
The time required each batch size 
source: http://novathin.kr/19 
Run one by one 
Run one time after 
gathering as much as 
batch size 
There is big difference according to the way of executing SQL! 
13 
background Problems to solved Import speed Keeping data size indexing
background Problems to solved Import speed Keeping data size indexing 
Import speed comparison 
One weather chart kml file  executing 3,000 columns  test criteria 
14 
# of addBatch() # of execution Time(sec) 
0 3,000 109.0 
100 30 8.9 
500 6 5.7 
1,000 3 3.4 
3,000 1 1.1 
 1 insert / 1 commit  kml file(3,000 insert) / 1 commit
Keeping data file 
size 
by managing table 
15
Data Management of PostGIS 
 PostGIS is write-once. 
 Not deleting updated and deleted data 
 Recording new data below after marking 
 Pros 
 Fast 
 Can manage several versions of data 
 Cons 
 Data file size can be extremely increased 
 Low performance by increase of file size 
 Weather Chart DB file increases by 35 GB 
per day!!! 
16 
background Problems to solved Import speed Keeping data size indexing
Snapshot vs Write-once 
Oracle / MySQL PostgreSQL 
table 
A 
B’ 
C 
D 
E 
table 
A 
B X 
C 
D 
E 
B’ 
snapsho 
t 
B 
Transaction owner 
Other users 
Record 
before 
renewal 
Record 
after 
renewal 
Record 
after 
renewal 
Record 
before 
renewal 
After completing 
transection 
17 
background Problems to solved Import speed Keeping data size indexing
General VACUUM 
Table 
A 
B X 
C X 
D 
E 
X 
B’ 
C’ 
Table 
A 
B X 
C X 
D 
E 
X 
B’ 
C’ 
Table 
A 
F 
C X 
D 
E 
X 
B’ 
C’ 
FSM 
No need 
B X 
C X 
E X 
FSM 
No need 
C X 
E X 
VACUUM execution Data Insert 
Source: http://www.geocities.jp/sugachan1973/doc/funto60.html 
In terms of PostGIS for KMA’s weather charts, general vacuum 
functions can’t solve the problem that data files continuously 
increase. 
18 
background Problems to solved Import speed Keeping data size indexing
background Problems to solved Import speed Keeping data size indexing 
VACUUM FULL 
unused space 
arrange for big size 
data management 
Source: http://www.devmedia.com.br/otimizacao-uma-ferramenta-chamada-vacuum/1710 
On PostGIS for KMA’s weather chart, it takes 15 hr. for full vacuum. 
During Vacuum full, exclusive LOCK happens. 
19 
VACUUM FULL
Partitioning 
 Partitioning? 
 Managing tables by conceptually separating one table to 
several 
 Data size by table down  Index size down and Search 
speed up Weather Chart 
Weather Chart 
_0 
Weather Chart 
_1 
Weather Chart 
_2 
Weather Chart 
_3 
Weather Chart 
_4 
Weather Chart 
_5 
Weather Chart 
_6 
Insert on Monday 
Insert on Sunday 
Insert on Tuesday 
Truncate on Tuesday 
Truncate on Monday 
Truncate on Sunday 
Execution time of truncate is almost a few seconds 
and file size is decreased without vacuum 
20 
background Problems to solved Import speed Keeping data size indexing
Improvement on inquiry 
speed by resetting index 
21
background Problems to solved Import speed Keeping data size indexing 
Improvement flow of inquiry speed 
22 
Data 
Condition 
Analysis 
Query 
Finding 
Query 
Plan 
Analysis 
Index 
Improvement
background Problems to solved Import speed Keeping data size indexing 
Data Condition Analysis 
 Understanding # of 
columns by table 
 select count(*) 
table_name is foolish! 
 Possible to understand 
the number of rows if 
using statistical table 
 Meaningful data is 
stored on pg_class 
table 
 Execution time within 
one minute 
select relname as table_name, 
to_char(reltuples, '999,999,999') 
as row_count 
from pg_class 
where relnamespace = (select oid 
from pg_namespace where nspname 
= 'public') 
and relam = 0 
order by 2 desc, 1; 
23
background Problems to solved Import speed Keeping data size indexing 
GeoServer SQL VIEW 
 Register sql query as Layer 
 Datasource is geoDB, can 
use SQL VIEW 
 Useful 
 Complex condition to layer 
 Reprojection 
 Able to join multiple tables 
 normal attribute -> spatial 
object 
GeoServer , showing weather chart, 
perfomance is affected by 
searching speed of PostGIS 
24
background Problems to solved Import speed Keeping data size indexing 
Query Finding 
 Identifying executed 
SQL using statistical 
 Using table 
pg_stat_activity table 
 Necessary process for 
tuning 
 Possible to check 
execution time 
 Differences of queries 
by PostGIS version select query_start, current_query 
from pg_stat_activity 
where username = ‘mobile’ 
and current_query not like ‘<IDLE>%’ 
order by query_start desc; 
SELECT 
"val",encode(ST_AsBinary(ST_Force_2D("geom 
")),'base64') as "geom" 
FROM ( 
select mdl, mdl_var, 
placemark_name, val, lyrs_cd, 
forecast_time, 
create_time as anal_time, 
ST_Transform(the_geom, 7188) as geom 
from contour 
where mdl_var = 'TMP' 
) as "vtable" 
WHERE (((("mdl" = 'GDAPS' AND "lyrs_cd" = 
'A925.0') AND "forecast_time" = 
'2011.06.27 00:00') AND "anal_time" = 
'2011.06.27 00:00') AND "geom" && 
ST_GeomFromText('POLYGON ((-1056768 - 
2105344, -1056768 -1040384, 8192 -1040384, 
8192 -2105344, -1056768 -2105344))', 
7188)); 
25
background Problems to solved Import speed Keeping data size indexing 
Query Plan Analysis 
 PostGIS has basically query analysis function 
 pgAdmin III-Query-Analysis explanation function 
 Explain Analyze command – Easy to analyze query 
26
background Problems to solved Import speed Keeping data size indexing 
Index Improvement 
 Principles for Index Improvement 
 Setting index with all columns on Where clause 
 Spatial column has separate index 
 Columns with lots of including data types come first 
 Possibly, items compared as same operator come first 
 Unnecessary index should be removed due to bad performance on 
inserting 
 Examples 
-- contour_0 
DROP INDEX index_createtime_contour_0; 
DROP INDEX index_forecasttime_contour_0; 
DROP INDEX index_lyrscd_contour_0; 
DROP INDEX index_mdl_contour_0; 
DROP INDEX index_mdlvar_contour_0; 
CREATE INDEX index_contour_0_all 
ON contour_0 (forecast_time ASC NULLS LAST, mdl_var ASC NULLS LAST, lyrs_cd ASC NULLS LAST, create_time 
DESC NULLS LAST, mdl ASC NULLS LAST); 
 Result 
 After individually deleting index, integrated index creation reduces 20% of 
data capacity 
 6 ~ 25 times speed improvement by table(big tables show better 
performance) 27
Improvement 
Result 
28
29 
Under 300 
isobaric/ 
Temperature/ 
Isokinetics 
Ground/ 
Wet-number/ 
Temperature 
800 isobaric/ 
Mixture ratio/ 
Temperature
Conclusion 
Importance on excution 
using addBatch() and 
excuteBatch() 
About 100 times 
performance 
improvement 
Mixed with 
partitioning and 
truncate 
Stably keeping 
N-1 
accordance 
Appropriate index 
for query 
20 times inquiry 
time improvement 
30
Conclusion 
PostGIS is really great 
DBMS! 
Perfectly suited with 
GeoServer 
However, tuning with 
perfect understanding of 
the features. 
31
Q&A 
Please Ask BJ Jang via 
Email ! 
bjjang@gaia3d.com 
32

More Related Content

What's hot

WMS Performance Shootout 2010
WMS Performance Shootout 2010WMS Performance Shootout 2010
WMS Performance Shootout 2010Jeff McKenna
 
Twitter's Data Replicator for Google Cloud Storage
Twitter's Data Replicator for Google Cloud StorageTwitter's Data Replicator for Google Cloud Storage
Twitter's Data Replicator for Google Cloud Storagelohitvijayarenu
 
How @twitterhadoop chose google cloud
How @twitterhadoop chose google cloudHow @twitterhadoop chose google cloud
How @twitterhadoop chose google cloudlohitvijayarenu
 
Big data processing systems research
Big data processing systems researchBig data processing systems research
Big data processing systems researchVasia Kalavri
 
Managing 100s of PetaBytes of data in Cloud
Managing 100s of PetaBytes of data in CloudManaging 100s of PetaBytes of data in Cloud
Managing 100s of PetaBytes of data in Cloudlohitvijayarenu
 
Location Analytics - Real-Time Geofencing using Apache Kafka
Location Analytics - Real-Time Geofencing using Apache KafkaLocation Analytics - Real-Time Geofencing using Apache Kafka
Location Analytics - Real-Time Geofencing using Apache KafkaGuido Schmutz
 
Greenplum: A Pivotal Moment on Wall Street - Greenplum Summit 2018
Greenplum: A Pivotal Moment on Wall Street - Greenplum Summit 2018Greenplum: A Pivotal Moment on Wall Street - Greenplum Summit 2018
Greenplum: A Pivotal Moment on Wall Street - Greenplum Summit 2018VMware Tanzu
 
Statsd introduction
Statsd introductionStatsd introduction
Statsd introductionRick Chang
 
m2r2: A Framework for Results Materialization and Reuse
m2r2: A Framework for Results Materialization and Reusem2r2: A Framework for Results Materialization and Reuse
m2r2: A Framework for Results Materialization and ReuseVasia Kalavri
 
Druid meetup @walkme
Druid meetup @walkmeDruid meetup @walkme
Druid meetup @walkmeDori Waldman
 
Location Analytics Real-Time Geofencing using Kafka
Location Analytics Real-Time Geofencing using KafkaLocation Analytics Real-Time Geofencing using Kafka
Location Analytics Real-Time Geofencing using KafkaGuido Schmutz
 
Data Warehouse on Kubernetes: lessons from Clickhouse Operator
Data Warehouse on Kubernetes: lessons from Clickhouse OperatorData Warehouse on Kubernetes: lessons from Clickhouse Operator
Data Warehouse on Kubernetes: lessons from Clickhouse OperatorAltinity Ltd
 
Using GeoServer for spatio-temporal data management with examples for MetOc a...
Using GeoServer for spatio-temporal data management with examples for MetOc a...Using GeoServer for spatio-temporal data management with examples for MetOc a...
Using GeoServer for spatio-temporal data management with examples for MetOc a...GeoSolutions
 
MySQL performance monitoring using Statsd and Graphite (PLUK2013)
MySQL performance monitoring using Statsd and Graphite (PLUK2013)MySQL performance monitoring using Statsd and Graphite (PLUK2013)
MySQL performance monitoring using Statsd and Graphite (PLUK2013)spil-engineering
 
Nokia Asha webinar: Developing location-based services for Nokia Asha phones ...
Nokia Asha webinar: Developing location-based services for Nokia Asha phones ...Nokia Asha webinar: Developing location-based services for Nokia Asha phones ...
Nokia Asha webinar: Developing location-based services for Nokia Asha phones ...Microsoft Mobile Developer
 
Flink Forward Berlin 2017: Ruben Casado Tejedor - Flink-Kudu connector: an op...
Flink Forward Berlin 2017: Ruben Casado Tejedor - Flink-Kudu connector: an op...Flink Forward Berlin 2017: Ruben Casado Tejedor - Flink-Kudu connector: an op...
Flink Forward Berlin 2017: Ruben Casado Tejedor - Flink-Kudu connector: an op...Flink Forward
 
Location based services for Nokia X and Nokia Asha using Geo2tag
Location based services for Nokia X and Nokia Asha using Geo2tagLocation based services for Nokia X and Nokia Asha using Geo2tag
Location based services for Nokia X and Nokia Asha using Geo2tagMicrosoft Mobile Developer
 

What's hot (20)

WMS Performance Shootout 2010
WMS Performance Shootout 2010WMS Performance Shootout 2010
WMS Performance Shootout 2010
 
Why is postgis awesome?
Why is postgis awesome?Why is postgis awesome?
Why is postgis awesome?
 
Twitter's Data Replicator for Google Cloud Storage
Twitter's Data Replicator for Google Cloud StorageTwitter's Data Replicator for Google Cloud Storage
Twitter's Data Replicator for Google Cloud Storage
 
How @twitterhadoop chose google cloud
How @twitterhadoop chose google cloudHow @twitterhadoop chose google cloud
How @twitterhadoop chose google cloud
 
Graphite
GraphiteGraphite
Graphite
 
Big data processing systems research
Big data processing systems researchBig data processing systems research
Big data processing systems research
 
Managing 100s of PetaBytes of data in Cloud
Managing 100s of PetaBytes of data in CloudManaging 100s of PetaBytes of data in Cloud
Managing 100s of PetaBytes of data in Cloud
 
Location Analytics - Real-Time Geofencing using Apache Kafka
Location Analytics - Real-Time Geofencing using Apache KafkaLocation Analytics - Real-Time Geofencing using Apache Kafka
Location Analytics - Real-Time Geofencing using Apache Kafka
 
Greenplum: A Pivotal Moment on Wall Street - Greenplum Summit 2018
Greenplum: A Pivotal Moment on Wall Street - Greenplum Summit 2018Greenplum: A Pivotal Moment on Wall Street - Greenplum Summit 2018
Greenplum: A Pivotal Moment on Wall Street - Greenplum Summit 2018
 
Statsd introduction
Statsd introductionStatsd introduction
Statsd introduction
 
m2r2: A Framework for Results Materialization and Reuse
m2r2: A Framework for Results Materialization and Reusem2r2: A Framework for Results Materialization and Reuse
m2r2: A Framework for Results Materialization and Reuse
 
Druid meetup @walkme
Druid meetup @walkmeDruid meetup @walkme
Druid meetup @walkme
 
Location Analytics Real-Time Geofencing using Kafka
Location Analytics Real-Time Geofencing using KafkaLocation Analytics Real-Time Geofencing using Kafka
Location Analytics Real-Time Geofencing using Kafka
 
Data Warehouse on Kubernetes: lessons from Clickhouse Operator
Data Warehouse on Kubernetes: lessons from Clickhouse OperatorData Warehouse on Kubernetes: lessons from Clickhouse Operator
Data Warehouse on Kubernetes: lessons from Clickhouse Operator
 
Using GeoServer for spatio-temporal data management with examples for MetOc a...
Using GeoServer for spatio-temporal data management with examples for MetOc a...Using GeoServer for spatio-temporal data management with examples for MetOc a...
Using GeoServer for spatio-temporal data management with examples for MetOc a...
 
MySQL performance monitoring using Statsd and Graphite (PLUK2013)
MySQL performance monitoring using Statsd and Graphite (PLUK2013)MySQL performance monitoring using Statsd and Graphite (PLUK2013)
MySQL performance monitoring using Statsd and Graphite (PLUK2013)
 
Nokia Asha webinar: Developing location-based services for Nokia Asha phones ...
Nokia Asha webinar: Developing location-based services for Nokia Asha phones ...Nokia Asha webinar: Developing location-based services for Nokia Asha phones ...
Nokia Asha webinar: Developing location-based services for Nokia Asha phones ...
 
Highly Available Graphite
Highly Available GraphiteHighly Available Graphite
Highly Available Graphite
 
Flink Forward Berlin 2017: Ruben Casado Tejedor - Flink-Kudu connector: an op...
Flink Forward Berlin 2017: Ruben Casado Tejedor - Flink-Kudu connector: an op...Flink Forward Berlin 2017: Ruben Casado Tejedor - Flink-Kudu connector: an op...
Flink Forward Berlin 2017: Ruben Casado Tejedor - Flink-Kudu connector: an op...
 
Location based services for Nokia X and Nokia Asha using Geo2tag
Location based services for Nokia X and Nokia Asha using Geo2tagLocation based services for Nokia X and Nokia Asha using Geo2tag
Location based services for Nokia X and Nokia Asha using Geo2tag
 

Similar to Big size meteorological data processing and mobile displaying system using PostGIS and GeoServer

Giga Spaces Data Grid / Data Caching Overview
Giga Spaces Data Grid / Data Caching OverviewGiga Spaces Data Grid / Data Caching Overview
Giga Spaces Data Grid / Data Caching Overviewjimliddle
 
Sql server performance tuning
Sql server performance tuningSql server performance tuning
Sql server performance tuningngupt28
 
Lambda architecture @ Indix
Lambda architecture @ IndixLambda architecture @ Indix
Lambda architecture @ IndixRajesh Muppalla
 
MineDB Mineral Resource Evaluation White Paper
MineDB Mineral Resource Evaluation White PaperMineDB Mineral Resource Evaluation White Paper
MineDB Mineral Resource Evaluation White PaperDerek Diamond
 
Checklist for Upgrades and Migrations
Checklist for Upgrades and MigrationsChecklist for Upgrades and Migrations
Checklist for Upgrades and MigrationsMarkus Flechtner
 
Big data should be simple
Big data should be simpleBig data should be simple
Big data should be simpleDori Waldman
 
What's New in MariaDB Server 10.2 and MariaDB MaxScale 2.1
What's New in MariaDB Server 10.2 and MariaDB MaxScale 2.1What's New in MariaDB Server 10.2 and MariaDB MaxScale 2.1
What's New in MariaDB Server 10.2 and MariaDB MaxScale 2.1MariaDB plc
 
What's New in MariaDB Server 10.2 and MariaDB MaxScale 2.1
What's New in MariaDB Server 10.2 and MariaDB MaxScale 2.1What's New in MariaDB Server 10.2 and MariaDB MaxScale 2.1
What's New in MariaDB Server 10.2 and MariaDB MaxScale 2.1MariaDB plc
 
Hybrid solutions – combining in memory solutions with SSD - Christos Erotocritou
Hybrid solutions – combining in memory solutions with SSD - Christos ErotocritouHybrid solutions – combining in memory solutions with SSD - Christos Erotocritou
Hybrid solutions – combining in memory solutions with SSD - Christos ErotocritouJAXLondon_Conference
 
MongoDB World 2018: Breaking the Mold - Redesigning Dell's E-Commerce Platform
MongoDB World 2018: Breaking the Mold - Redesigning Dell's E-Commerce PlatformMongoDB World 2018: Breaking the Mold - Redesigning Dell's E-Commerce Platform
MongoDB World 2018: Breaking the Mold - Redesigning Dell's E-Commerce PlatformMongoDB
 
Big Data with SQL Server
Big Data with SQL ServerBig Data with SQL Server
Big Data with SQL ServerMark Kromer
 
Geo Searches for Health Care Pricing Data with MongoDB
Geo Searches for Health Care Pricing Data with MongoDBGeo Searches for Health Care Pricing Data with MongoDB
Geo Searches for Health Care Pricing Data with MongoDBRobert Stewart
 
My mapreduce1 presentation
My mapreduce1 presentationMy mapreduce1 presentation
My mapreduce1 presentationNoha Elprince
 
DBPLUS Performance Monitor for PostgeSQL
DBPLUS Performance Monitor for PostgeSQL DBPLUS Performance Monitor for PostgeSQL
DBPLUS Performance Monitor for PostgeSQL DBPLUS
 
Best Practices for Supercharging Cloud Analytics on Amazon Redshift
Best Practices for Supercharging Cloud Analytics on Amazon RedshiftBest Practices for Supercharging Cloud Analytics on Amazon Redshift
Best Practices for Supercharging Cloud Analytics on Amazon RedshiftSnapLogic
 
Getting Started with Amazon Redshift
Getting Started with Amazon RedshiftGetting Started with Amazon Redshift
Getting Started with Amazon RedshiftAmazon Web Services
 
AWS Partner Webcast - Analyze Big Data for Consumer Applications with Looker ...
AWS Partner Webcast - Analyze Big Data for Consumer Applications with Looker ...AWS Partner Webcast - Analyze Big Data for Consumer Applications with Looker ...
AWS Partner Webcast - Analyze Big Data for Consumer Applications with Looker ...Amazon Web Services
 
Performance Tuning Oracle's BI Applications
Performance Tuning Oracle's BI ApplicationsPerformance Tuning Oracle's BI Applications
Performance Tuning Oracle's BI ApplicationsKPI Partners
 

Similar to Big size meteorological data processing and mobile displaying system using PostGIS and GeoServer (20)

Giga Spaces Data Grid / Data Caching Overview
Giga Spaces Data Grid / Data Caching OverviewGiga Spaces Data Grid / Data Caching Overview
Giga Spaces Data Grid / Data Caching Overview
 
Sql server performance tuning
Sql server performance tuningSql server performance tuning
Sql server performance tuning
 
Lambda architecture @ Indix
Lambda architecture @ IndixLambda architecture @ Indix
Lambda architecture @ Indix
 
MineDB Mineral Resource Evaluation White Paper
MineDB Mineral Resource Evaluation White PaperMineDB Mineral Resource Evaluation White Paper
MineDB Mineral Resource Evaluation White Paper
 
Checklist for Upgrades and Migrations
Checklist for Upgrades and MigrationsChecklist for Upgrades and Migrations
Checklist for Upgrades and Migrations
 
Big data should be simple
Big data should be simpleBig data should be simple
Big data should be simple
 
What's New in MariaDB Server 10.2 and MariaDB MaxScale 2.1
What's New in MariaDB Server 10.2 and MariaDB MaxScale 2.1What's New in MariaDB Server 10.2 and MariaDB MaxScale 2.1
What's New in MariaDB Server 10.2 and MariaDB MaxScale 2.1
 
What's New in MariaDB Server 10.2 and MariaDB MaxScale 2.1
What's New in MariaDB Server 10.2 and MariaDB MaxScale 2.1What's New in MariaDB Server 10.2 and MariaDB MaxScale 2.1
What's New in MariaDB Server 10.2 and MariaDB MaxScale 2.1
 
Hybrid solutions – combining in memory solutions with SSD - Christos Erotocritou
Hybrid solutions – combining in memory solutions with SSD - Christos ErotocritouHybrid solutions – combining in memory solutions with SSD - Christos Erotocritou
Hybrid solutions – combining in memory solutions with SSD - Christos Erotocritou
 
MongoDB World 2018: Breaking the Mold - Redesigning Dell's E-Commerce Platform
MongoDB World 2018: Breaking the Mold - Redesigning Dell's E-Commerce PlatformMongoDB World 2018: Breaking the Mold - Redesigning Dell's E-Commerce Platform
MongoDB World 2018: Breaking the Mold - Redesigning Dell's E-Commerce Platform
 
Big Data with SQL Server
Big Data with SQL ServerBig Data with SQL Server
Big Data with SQL Server
 
Geo Searches for Health Care Pricing Data with MongoDB
Geo Searches for Health Care Pricing Data with MongoDBGeo Searches for Health Care Pricing Data with MongoDB
Geo Searches for Health Care Pricing Data with MongoDB
 
My mapreduce1 presentation
My mapreduce1 presentationMy mapreduce1 presentation
My mapreduce1 presentation
 
DBPLUS Performance Monitor for PostgeSQL
DBPLUS Performance Monitor for PostgeSQL DBPLUS Performance Monitor for PostgeSQL
DBPLUS Performance Monitor for PostgeSQL
 
Upgrading 11i E-business Suite to R12 E-business Suite
Upgrading 11i E-business Suite to R12 E-business SuiteUpgrading 11i E-business Suite to R12 E-business Suite
Upgrading 11i E-business Suite to R12 E-business Suite
 
Best Practices for Supercharging Cloud Analytics on Amazon Redshift
Best Practices for Supercharging Cloud Analytics on Amazon RedshiftBest Practices for Supercharging Cloud Analytics on Amazon Redshift
Best Practices for Supercharging Cloud Analytics on Amazon Redshift
 
Getting Started with Amazon Redshift
Getting Started with Amazon RedshiftGetting Started with Amazon Redshift
Getting Started with Amazon Redshift
 
AWS Partner Webcast - Analyze Big Data for Consumer Applications with Looker ...
AWS Partner Webcast - Analyze Big Data for Consumer Applications with Looker ...AWS Partner Webcast - Analyze Big Data for Consumer Applications with Looker ...
AWS Partner Webcast - Analyze Big Data for Consumer Applications with Looker ...
 
A
AA
A
 
Performance Tuning Oracle's BI Applications
Performance Tuning Oracle's BI ApplicationsPerformance Tuning Oracle's BI Applications
Performance Tuning Oracle's BI Applications
 

More from BJ Jang

공간SQL을 이용한 공간자료분석 기초실습
공간SQL을 이용한 공간자료분석 기초실습공간SQL을 이용한 공간자료분석 기초실습
공간SQL을 이용한 공간자료분석 기초실습BJ Jang
 
오픈소스GIS 개발 일반 강의자료
오픈소스GIS 개발 일반 강의자료오픈소스GIS 개발 일반 강의자료
오픈소스GIS 개발 일반 강의자료BJ Jang
 
2017년 나의 계획
2017년 나의 계획2017년 나의 계획
2017년 나의 계획BJ Jang
 
오픈소스 개발을 위한 Git 사용법 실습
오픈소스 개발을 위한 Git 사용법 실습오픈소스 개발을 위한 Git 사용법 실습
오픈소스 개발을 위한 Git 사용법 실습BJ Jang
 
[FOSS4G Korea 2016] GeoHash를 이용한 지형도 변화탐지와 시계열 관리
[FOSS4G Korea 2016] GeoHash를 이용한 지형도 변화탐지와 시계열 관리[FOSS4G Korea 2016] GeoHash를 이용한 지형도 변화탐지와 시계열 관리
[FOSS4G Korea 2016] GeoHash를 이용한 지형도 변화탐지와 시계열 관리BJ Jang
 
QGIS 소개 및 ArcMap과의 비교
QGIS 소개 및 ArcMap과의 비교QGIS 소개 및 ArcMap과의 비교
QGIS 소개 및 ArcMap과의 비교BJ Jang
 
PyQGIS 개발자 쿡북
PyQGIS 개발자 쿡북PyQGIS 개발자 쿡북
PyQGIS 개발자 쿡북BJ Jang
 
Open Source based GIS devlopment cases by Gaia3D_20150417
Open Source based GIS devlopment cases by Gaia3D_20150417Open Source based GIS devlopment cases by Gaia3D_20150417
Open Source based GIS devlopment cases by Gaia3D_20150417BJ Jang
 
공간정보아카데미 - Day1 오픈소스개발 일반
공간정보아카데미 - Day1 오픈소스개발 일반공간정보아카데미 - Day1 오픈소스개발 일반
공간정보아카데미 - Day1 오픈소스개발 일반BJ Jang
 
올챙이 국제스타 만들기 20141023
올챙이 국제스타 만들기 20141023올챙이 국제스타 만들기 20141023
올챙이 국제스타 만들기 20141023BJ Jang
 
Github를 이용한 협동개발 20141001
Github를 이용한 협동개발 20141001Github를 이용한 협동개발 20141001
Github를 이용한 협동개발 20141001BJ Jang
 
[Foss4 g2014 korea] qgis를 플랫폼으로 한 파이썬기반 공간통계 구현 사례
[Foss4 g2014 korea] qgis를 플랫폼으로 한 파이썬기반 공간통계 구현 사례[Foss4 g2014 korea] qgis를 플랫폼으로 한 파이썬기반 공간통계 구현 사례
[Foss4 g2014 korea] qgis를 플랫폼으로 한 파이썬기반 공간통계 구현 사례BJ Jang
 
Open Source GIS 기초교육 4일차 - GeoServer 기초 2014년 7월판
Open Source GIS 기초교육 4일차 - GeoServer 기초 2014년 7월판Open Source GIS 기초교육 4일차 - GeoServer 기초 2014년 7월판
Open Source GIS 기초교육 4일차 - GeoServer 기초 2014년 7월판BJ Jang
 
[Foss4 g2013 korea]postgis와 geoserver를 이용한 대용량 공간데이터 기반 일기도 서비스 구축 사례
[Foss4 g2013 korea]postgis와 geoserver를 이용한 대용량 공간데이터 기반 일기도 서비스 구축 사례[Foss4 g2013 korea]postgis와 geoserver를 이용한 대용량 공간데이터 기반 일기도 서비스 구축 사례
[Foss4 g2013 korea]postgis와 geoserver를 이용한 대용량 공간데이터 기반 일기도 서비스 구축 사례BJ Jang
 
Proj4를 이용한 좌표계 변환
Proj4를 이용한 좌표계 변환Proj4를 이용한 좌표계 변환
Proj4를 이용한 좌표계 변환BJ Jang
 
Geo server 성능향상을 위한 튜닝 기법 20111028
Geo server 성능향상을 위한 튜닝 기법 20111028Geo server 성능향상을 위한 튜닝 기법 20111028
Geo server 성능향상을 위한 튜닝 기법 20111028BJ Jang
 
공간정보거점대학 1.geo server_고급과정
공간정보거점대학 1.geo server_고급과정공간정보거점대학 1.geo server_고급과정
공간정보거점대학 1.geo server_고급과정BJ Jang
 

More from BJ Jang (17)

공간SQL을 이용한 공간자료분석 기초실습
공간SQL을 이용한 공간자료분석 기초실습공간SQL을 이용한 공간자료분석 기초실습
공간SQL을 이용한 공간자료분석 기초실습
 
오픈소스GIS 개발 일반 강의자료
오픈소스GIS 개발 일반 강의자료오픈소스GIS 개발 일반 강의자료
오픈소스GIS 개발 일반 강의자료
 
2017년 나의 계획
2017년 나의 계획2017년 나의 계획
2017년 나의 계획
 
오픈소스 개발을 위한 Git 사용법 실습
오픈소스 개발을 위한 Git 사용법 실습오픈소스 개발을 위한 Git 사용법 실습
오픈소스 개발을 위한 Git 사용법 실습
 
[FOSS4G Korea 2016] GeoHash를 이용한 지형도 변화탐지와 시계열 관리
[FOSS4G Korea 2016] GeoHash를 이용한 지형도 변화탐지와 시계열 관리[FOSS4G Korea 2016] GeoHash를 이용한 지형도 변화탐지와 시계열 관리
[FOSS4G Korea 2016] GeoHash를 이용한 지형도 변화탐지와 시계열 관리
 
QGIS 소개 및 ArcMap과의 비교
QGIS 소개 및 ArcMap과의 비교QGIS 소개 및 ArcMap과의 비교
QGIS 소개 및 ArcMap과의 비교
 
PyQGIS 개발자 쿡북
PyQGIS 개발자 쿡북PyQGIS 개발자 쿡북
PyQGIS 개발자 쿡북
 
Open Source based GIS devlopment cases by Gaia3D_20150417
Open Source based GIS devlopment cases by Gaia3D_20150417Open Source based GIS devlopment cases by Gaia3D_20150417
Open Source based GIS devlopment cases by Gaia3D_20150417
 
공간정보아카데미 - Day1 오픈소스개발 일반
공간정보아카데미 - Day1 오픈소스개발 일반공간정보아카데미 - Day1 오픈소스개발 일반
공간정보아카데미 - Day1 오픈소스개발 일반
 
올챙이 국제스타 만들기 20141023
올챙이 국제스타 만들기 20141023올챙이 국제스타 만들기 20141023
올챙이 국제스타 만들기 20141023
 
Github를 이용한 협동개발 20141001
Github를 이용한 협동개발 20141001Github를 이용한 협동개발 20141001
Github를 이용한 협동개발 20141001
 
[Foss4 g2014 korea] qgis를 플랫폼으로 한 파이썬기반 공간통계 구현 사례
[Foss4 g2014 korea] qgis를 플랫폼으로 한 파이썬기반 공간통계 구현 사례[Foss4 g2014 korea] qgis를 플랫폼으로 한 파이썬기반 공간통계 구현 사례
[Foss4 g2014 korea] qgis를 플랫폼으로 한 파이썬기반 공간통계 구현 사례
 
Open Source GIS 기초교육 4일차 - GeoServer 기초 2014년 7월판
Open Source GIS 기초교육 4일차 - GeoServer 기초 2014년 7월판Open Source GIS 기초교육 4일차 - GeoServer 기초 2014년 7월판
Open Source GIS 기초교육 4일차 - GeoServer 기초 2014년 7월판
 
[Foss4 g2013 korea]postgis와 geoserver를 이용한 대용량 공간데이터 기반 일기도 서비스 구축 사례
[Foss4 g2013 korea]postgis와 geoserver를 이용한 대용량 공간데이터 기반 일기도 서비스 구축 사례[Foss4 g2013 korea]postgis와 geoserver를 이용한 대용량 공간데이터 기반 일기도 서비스 구축 사례
[Foss4 g2013 korea]postgis와 geoserver를 이용한 대용량 공간데이터 기반 일기도 서비스 구축 사례
 
Proj4를 이용한 좌표계 변환
Proj4를 이용한 좌표계 변환Proj4를 이용한 좌표계 변환
Proj4를 이용한 좌표계 변환
 
Geo server 성능향상을 위한 튜닝 기법 20111028
Geo server 성능향상을 위한 튜닝 기법 20111028Geo server 성능향상을 위한 튜닝 기법 20111028
Geo server 성능향상을 위한 튜닝 기법 20111028
 
공간정보거점대학 1.geo server_고급과정
공간정보거점대학 1.geo server_고급과정공간정보거점대학 1.geo server_고급과정
공간정보거점대학 1.geo server_고급과정
 

Recently uploaded

HR Software Buyers Guide in 2024 - HRSoftware.com
HR Software Buyers Guide in 2024 - HRSoftware.comHR Software Buyers Guide in 2024 - HRSoftware.com
HR Software Buyers Guide in 2024 - HRSoftware.comFatema Valibhai
 
What is Binary Language? Computer Number Systems
What is Binary Language?  Computer Number SystemsWhat is Binary Language?  Computer Number Systems
What is Binary Language? Computer Number SystemsJheuzeDellosa
 
DNT_Corporate presentation know about us
DNT_Corporate presentation know about usDNT_Corporate presentation know about us
DNT_Corporate presentation know about usDynamic Netsoft
 
why an Opensea Clone Script might be your perfect match.pdf
why an Opensea Clone Script might be your perfect match.pdfwhy an Opensea Clone Script might be your perfect match.pdf
why an Opensea Clone Script might be your perfect match.pdfjoe51371421
 
Engage Usergroup 2024 - The Good The Bad_The Ugly
Engage Usergroup 2024 - The Good The Bad_The UglyEngage Usergroup 2024 - The Good The Bad_The Ugly
Engage Usergroup 2024 - The Good The Bad_The UglyFrank van der Linden
 
Unit 1.1 Excite Part 1, class 9, cbse...
Unit 1.1 Excite Part 1, class 9, cbse...Unit 1.1 Excite Part 1, class 9, cbse...
Unit 1.1 Excite Part 1, class 9, cbse...aditisharan08
 
BATTLEFIELD ORM: TIPS, TACTICS AND STRATEGIES FOR CONQUERING YOUR DATABASE
BATTLEFIELD ORM: TIPS, TACTICS AND STRATEGIES FOR CONQUERING YOUR DATABASEBATTLEFIELD ORM: TIPS, TACTICS AND STRATEGIES FOR CONQUERING YOUR DATABASE
BATTLEFIELD ORM: TIPS, TACTICS AND STRATEGIES FOR CONQUERING YOUR DATABASEOrtus Solutions, Corp
 
Try MyIntelliAccount Cloud Accounting Software As A Service Solution Risk Fre...
Try MyIntelliAccount Cloud Accounting Software As A Service Solution Risk Fre...Try MyIntelliAccount Cloud Accounting Software As A Service Solution Risk Fre...
Try MyIntelliAccount Cloud Accounting Software As A Service Solution Risk Fre...MyIntelliSource, Inc.
 
Optimizing AI for immediate response in Smart CCTV
Optimizing AI for immediate response in Smart CCTVOptimizing AI for immediate response in Smart CCTV
Optimizing AI for immediate response in Smart CCTVshikhaohhpro
 
Building a General PDE Solving Framework with Symbolic-Numeric Scientific Mac...
Building a General PDE Solving Framework with Symbolic-Numeric Scientific Mac...Building a General PDE Solving Framework with Symbolic-Numeric Scientific Mac...
Building a General PDE Solving Framework with Symbolic-Numeric Scientific Mac...stazi3110
 
cybersecurity notes for mca students for learning
cybersecurity notes for mca students for learningcybersecurity notes for mca students for learning
cybersecurity notes for mca students for learningVitsRangannavar
 
Project Based Learning (A.I).pptx detail explanation
Project Based Learning (A.I).pptx detail explanationProject Based Learning (A.I).pptx detail explanation
Project Based Learning (A.I).pptx detail explanationkaushalgiri8080
 
Adobe Marketo Engage Deep Dives: Using Webhooks to Transfer Data
Adobe Marketo Engage Deep Dives: Using Webhooks to Transfer DataAdobe Marketo Engage Deep Dives: Using Webhooks to Transfer Data
Adobe Marketo Engage Deep Dives: Using Webhooks to Transfer DataBradBedford3
 
KnowAPIs-UnknownPerf-jaxMainz-2024 (1).pptx
KnowAPIs-UnknownPerf-jaxMainz-2024 (1).pptxKnowAPIs-UnknownPerf-jaxMainz-2024 (1).pptx
KnowAPIs-UnknownPerf-jaxMainz-2024 (1).pptxTier1 app
 
Learn the Fundamentals of XCUITest Framework_ A Beginner's Guide.pdf
Learn the Fundamentals of XCUITest Framework_ A Beginner's Guide.pdfLearn the Fundamentals of XCUITest Framework_ A Beginner's Guide.pdf
Learn the Fundamentals of XCUITest Framework_ A Beginner's Guide.pdfkalichargn70th171
 
Professional Resume Template for Software Developers
Professional Resume Template for Software DevelopersProfessional Resume Template for Software Developers
Professional Resume Template for Software DevelopersVinodh Ram
 
Salesforce Certified Field Service Consultant
Salesforce Certified Field Service ConsultantSalesforce Certified Field Service Consultant
Salesforce Certified Field Service ConsultantAxelRicardoTrocheRiq
 
chapter--4-software-project-planning.ppt
chapter--4-software-project-planning.pptchapter--4-software-project-planning.ppt
chapter--4-software-project-planning.pptkotipi9215
 
The Essentials of Digital Experience Monitoring_ A Comprehensive Guide.pdf
The Essentials of Digital Experience Monitoring_ A Comprehensive Guide.pdfThe Essentials of Digital Experience Monitoring_ A Comprehensive Guide.pdf
The Essentials of Digital Experience Monitoring_ A Comprehensive Guide.pdfkalichargn70th171
 
Call Girls in Naraina Delhi 💯Call Us 🔝8264348440🔝
Call Girls in Naraina Delhi 💯Call Us 🔝8264348440🔝Call Girls in Naraina Delhi 💯Call Us 🔝8264348440🔝
Call Girls in Naraina Delhi 💯Call Us 🔝8264348440🔝soniya singh
 

Recently uploaded (20)

HR Software Buyers Guide in 2024 - HRSoftware.com
HR Software Buyers Guide in 2024 - HRSoftware.comHR Software Buyers Guide in 2024 - HRSoftware.com
HR Software Buyers Guide in 2024 - HRSoftware.com
 
What is Binary Language? Computer Number Systems
What is Binary Language?  Computer Number SystemsWhat is Binary Language?  Computer Number Systems
What is Binary Language? Computer Number Systems
 
DNT_Corporate presentation know about us
DNT_Corporate presentation know about usDNT_Corporate presentation know about us
DNT_Corporate presentation know about us
 
why an Opensea Clone Script might be your perfect match.pdf
why an Opensea Clone Script might be your perfect match.pdfwhy an Opensea Clone Script might be your perfect match.pdf
why an Opensea Clone Script might be your perfect match.pdf
 
Engage Usergroup 2024 - The Good The Bad_The Ugly
Engage Usergroup 2024 - The Good The Bad_The UglyEngage Usergroup 2024 - The Good The Bad_The Ugly
Engage Usergroup 2024 - The Good The Bad_The Ugly
 
Unit 1.1 Excite Part 1, class 9, cbse...
Unit 1.1 Excite Part 1, class 9, cbse...Unit 1.1 Excite Part 1, class 9, cbse...
Unit 1.1 Excite Part 1, class 9, cbse...
 
BATTLEFIELD ORM: TIPS, TACTICS AND STRATEGIES FOR CONQUERING YOUR DATABASE
BATTLEFIELD ORM: TIPS, TACTICS AND STRATEGIES FOR CONQUERING YOUR DATABASEBATTLEFIELD ORM: TIPS, TACTICS AND STRATEGIES FOR CONQUERING YOUR DATABASE
BATTLEFIELD ORM: TIPS, TACTICS AND STRATEGIES FOR CONQUERING YOUR DATABASE
 
Try MyIntelliAccount Cloud Accounting Software As A Service Solution Risk Fre...
Try MyIntelliAccount Cloud Accounting Software As A Service Solution Risk Fre...Try MyIntelliAccount Cloud Accounting Software As A Service Solution Risk Fre...
Try MyIntelliAccount Cloud Accounting Software As A Service Solution Risk Fre...
 
Optimizing AI for immediate response in Smart CCTV
Optimizing AI for immediate response in Smart CCTVOptimizing AI for immediate response in Smart CCTV
Optimizing AI for immediate response in Smart CCTV
 
Building a General PDE Solving Framework with Symbolic-Numeric Scientific Mac...
Building a General PDE Solving Framework with Symbolic-Numeric Scientific Mac...Building a General PDE Solving Framework with Symbolic-Numeric Scientific Mac...
Building a General PDE Solving Framework with Symbolic-Numeric Scientific Mac...
 
cybersecurity notes for mca students for learning
cybersecurity notes for mca students for learningcybersecurity notes for mca students for learning
cybersecurity notes for mca students for learning
 
Project Based Learning (A.I).pptx detail explanation
Project Based Learning (A.I).pptx detail explanationProject Based Learning (A.I).pptx detail explanation
Project Based Learning (A.I).pptx detail explanation
 
Adobe Marketo Engage Deep Dives: Using Webhooks to Transfer Data
Adobe Marketo Engage Deep Dives: Using Webhooks to Transfer DataAdobe Marketo Engage Deep Dives: Using Webhooks to Transfer Data
Adobe Marketo Engage Deep Dives: Using Webhooks to Transfer Data
 
KnowAPIs-UnknownPerf-jaxMainz-2024 (1).pptx
KnowAPIs-UnknownPerf-jaxMainz-2024 (1).pptxKnowAPIs-UnknownPerf-jaxMainz-2024 (1).pptx
KnowAPIs-UnknownPerf-jaxMainz-2024 (1).pptx
 
Learn the Fundamentals of XCUITest Framework_ A Beginner's Guide.pdf
Learn the Fundamentals of XCUITest Framework_ A Beginner's Guide.pdfLearn the Fundamentals of XCUITest Framework_ A Beginner's Guide.pdf
Learn the Fundamentals of XCUITest Framework_ A Beginner's Guide.pdf
 
Professional Resume Template for Software Developers
Professional Resume Template for Software DevelopersProfessional Resume Template for Software Developers
Professional Resume Template for Software Developers
 
Salesforce Certified Field Service Consultant
Salesforce Certified Field Service ConsultantSalesforce Certified Field Service Consultant
Salesforce Certified Field Service Consultant
 
chapter--4-software-project-planning.ppt
chapter--4-software-project-planning.pptchapter--4-software-project-planning.ppt
chapter--4-software-project-planning.ppt
 
The Essentials of Digital Experience Monitoring_ A Comprehensive Guide.pdf
The Essentials of Digital Experience Monitoring_ A Comprehensive Guide.pdfThe Essentials of Digital Experience Monitoring_ A Comprehensive Guide.pdf
The Essentials of Digital Experience Monitoring_ A Comprehensive Guide.pdf
 
Call Girls in Naraina Delhi 💯Call Us 🔝8264348440🔝
Call Girls in Naraina Delhi 💯Call Us 🔝8264348440🔝Call Girls in Naraina Delhi 💯Call Us 🔝8264348440🔝
Call Girls in Naraina Delhi 💯Call Us 🔝8264348440🔝
 

Big size meteorological data processing and mobile displaying system using PostGIS and GeoServer

  • 1. Big size meteorological data processing and mobile displaying system using PostGIS and GeoServer BJ Jang, JW Geum, JH Kwun, HG Park
  • 2.  The system was SLOW not because of using PostGIS but because of NOT TUNING.  PostGIS definitely could make good performance if the system has been PROPERLY TUNED.  Let’s go over some tuning skills from CASE OF MOBILE weather chart service of KMA. 2 Objective
  • 4. background Problems to solved Import speed Keeping data size indexing Mobile Weather Chart Service Flow Observation Data Model Improvement of performance part by tuning 4 GRIB Data Vector Chart Chart Service Vectorize Image GRIB Data Weather Chart for service Korea Meteorological Administration Vector Chart ※GRIB DATA : GRIdded Binary or General Regularly-disrtibuted Information in Binary form - standardized by the World Meteorological Organization
  • 5. background Problems to solved Import speed Keeping data size indexing Vector Weather Chart 5 Software Architecture
  • 6. background Problems to solved Import speed Keeping data size indexing Characteristics of Weather Data 6 Low Resolution • Geographically low resolution • Surface + Height(Isobaric surface) • Analysis model • Data time + Forecasting time Multiple Dimension • A few times ~ hundreds times Frequent Production • Always need up-to-date data Realtime/ Near Realtime
  • 7. background Problems to solved Import speed Keeping data size indexing Data usage per day times generation (00, 06, 12, 18 UTC) # of spatial table: # of weather charts: MB data # of spatial data columns:
  • 8. Problems to be solved 8
  • 9. Problems of Existing System Slow data collection Difficult big size data management Slow searching for Weather Chart 9 background Problems to solved Import speed Keeping data size indexing
  • 10. Why is the service slow? Failed to understand characteristics of data 10 background Problems to solved Import speed Keeping data size indexing
  • 11. background Problems to solved Import speed Keeping data size indexing Improvement Goal 11 PRGOOBALLESMS AGCOTIAVLITSY 5 hr to insert data Data file grows 35 GB per day Tens of seconds to search a single weather chart Inserting less than 3o min. Keep the size of data file fixed Searching a weather chart within a few second
  • 12. Improvement on importing speed for big size data using batch 12
  • 13. General Data Processing Time The time required each batch size source: http://novathin.kr/19 Run one by one Run one time after gathering as much as batch size There is big difference according to the way of executing SQL! 13 background Problems to solved Import speed Keeping data size indexing
  • 14. background Problems to solved Import speed Keeping data size indexing Import speed comparison One weather chart kml file  executing 3,000 columns  test criteria 14 # of addBatch() # of execution Time(sec) 0 3,000 109.0 100 30 8.9 500 6 5.7 1,000 3 3.4 3,000 1 1.1  1 insert / 1 commit  kml file(3,000 insert) / 1 commit
  • 15. Keeping data file size by managing table 15
  • 16. Data Management of PostGIS  PostGIS is write-once.  Not deleting updated and deleted data  Recording new data below after marking  Pros  Fast  Can manage several versions of data  Cons  Data file size can be extremely increased  Low performance by increase of file size  Weather Chart DB file increases by 35 GB per day!!! 16 background Problems to solved Import speed Keeping data size indexing
  • 17. Snapshot vs Write-once Oracle / MySQL PostgreSQL table A B’ C D E table A B X C D E B’ snapsho t B Transaction owner Other users Record before renewal Record after renewal Record after renewal Record before renewal After completing transection 17 background Problems to solved Import speed Keeping data size indexing
  • 18. General VACUUM Table A B X C X D E X B’ C’ Table A B X C X D E X B’ C’ Table A F C X D E X B’ C’ FSM No need B X C X E X FSM No need C X E X VACUUM execution Data Insert Source: http://www.geocities.jp/sugachan1973/doc/funto60.html In terms of PostGIS for KMA’s weather charts, general vacuum functions can’t solve the problem that data files continuously increase. 18 background Problems to solved Import speed Keeping data size indexing
  • 19. background Problems to solved Import speed Keeping data size indexing VACUUM FULL unused space arrange for big size data management Source: http://www.devmedia.com.br/otimizacao-uma-ferramenta-chamada-vacuum/1710 On PostGIS for KMA’s weather chart, it takes 15 hr. for full vacuum. During Vacuum full, exclusive LOCK happens. 19 VACUUM FULL
  • 20. Partitioning  Partitioning?  Managing tables by conceptually separating one table to several  Data size by table down  Index size down and Search speed up Weather Chart Weather Chart _0 Weather Chart _1 Weather Chart _2 Weather Chart _3 Weather Chart _4 Weather Chart _5 Weather Chart _6 Insert on Monday Insert on Sunday Insert on Tuesday Truncate on Tuesday Truncate on Monday Truncate on Sunday Execution time of truncate is almost a few seconds and file size is decreased without vacuum 20 background Problems to solved Import speed Keeping data size indexing
  • 21. Improvement on inquiry speed by resetting index 21
  • 22. background Problems to solved Import speed Keeping data size indexing Improvement flow of inquiry speed 22 Data Condition Analysis Query Finding Query Plan Analysis Index Improvement
  • 23. background Problems to solved Import speed Keeping data size indexing Data Condition Analysis  Understanding # of columns by table  select count(*) table_name is foolish!  Possible to understand the number of rows if using statistical table  Meaningful data is stored on pg_class table  Execution time within one minute select relname as table_name, to_char(reltuples, '999,999,999') as row_count from pg_class where relnamespace = (select oid from pg_namespace where nspname = 'public') and relam = 0 order by 2 desc, 1; 23
  • 24. background Problems to solved Import speed Keeping data size indexing GeoServer SQL VIEW  Register sql query as Layer  Datasource is geoDB, can use SQL VIEW  Useful  Complex condition to layer  Reprojection  Able to join multiple tables  normal attribute -> spatial object GeoServer , showing weather chart, perfomance is affected by searching speed of PostGIS 24
  • 25. background Problems to solved Import speed Keeping data size indexing Query Finding  Identifying executed SQL using statistical  Using table pg_stat_activity table  Necessary process for tuning  Possible to check execution time  Differences of queries by PostGIS version select query_start, current_query from pg_stat_activity where username = ‘mobile’ and current_query not like ‘<IDLE>%’ order by query_start desc; SELECT "val",encode(ST_AsBinary(ST_Force_2D("geom ")),'base64') as "geom" FROM ( select mdl, mdl_var, placemark_name, val, lyrs_cd, forecast_time, create_time as anal_time, ST_Transform(the_geom, 7188) as geom from contour where mdl_var = 'TMP' ) as "vtable" WHERE (((("mdl" = 'GDAPS' AND "lyrs_cd" = 'A925.0') AND "forecast_time" = '2011.06.27 00:00') AND "anal_time" = '2011.06.27 00:00') AND "geom" && ST_GeomFromText('POLYGON ((-1056768 - 2105344, -1056768 -1040384, 8192 -1040384, 8192 -2105344, -1056768 -2105344))', 7188)); 25
  • 26. background Problems to solved Import speed Keeping data size indexing Query Plan Analysis  PostGIS has basically query analysis function  pgAdmin III-Query-Analysis explanation function  Explain Analyze command – Easy to analyze query 26
  • 27. background Problems to solved Import speed Keeping data size indexing Index Improvement  Principles for Index Improvement  Setting index with all columns on Where clause  Spatial column has separate index  Columns with lots of including data types come first  Possibly, items compared as same operator come first  Unnecessary index should be removed due to bad performance on inserting  Examples -- contour_0 DROP INDEX index_createtime_contour_0; DROP INDEX index_forecasttime_contour_0; DROP INDEX index_lyrscd_contour_0; DROP INDEX index_mdl_contour_0; DROP INDEX index_mdlvar_contour_0; CREATE INDEX index_contour_0_all ON contour_0 (forecast_time ASC NULLS LAST, mdl_var ASC NULLS LAST, lyrs_cd ASC NULLS LAST, create_time DESC NULLS LAST, mdl ASC NULLS LAST);  Result  After individually deleting index, integrated index creation reduces 20% of data capacity  6 ~ 25 times speed improvement by table(big tables show better performance) 27
  • 29. 29 Under 300 isobaric/ Temperature/ Isokinetics Ground/ Wet-number/ Temperature 800 isobaric/ Mixture ratio/ Temperature
  • 30. Conclusion Importance on excution using addBatch() and excuteBatch() About 100 times performance improvement Mixed with partitioning and truncate Stably keeping N-1 accordance Appropriate index for query 20 times inquiry time improvement 30
  • 31. Conclusion PostGIS is really great DBMS! Perfectly suited with GeoServer However, tuning with perfect understanding of the features. 31
  • 32. Q&A Please Ask BJ Jang via Email ! bjjang@gaia3d.com 32

Editor's Notes

  1. 안녕하세요. 저는 한국의 가이아쓰리디에서 근무하고 있는 권재현입니다. 이 발표내용은 저희 회사 동료인 장병진부장님이 직접 수행하신 것이나 제가 대신 발표하게 되었습니다. 그럼 이제 한국 기상청에서 PostGis와 GeoServer를 이용하여 대용량 공간데이터 기반의 일기도를 서비스했던 내용을 발표하겠습니다. Hello, my name is Jawhyun Kwun and I work at Gaia3D based in South Korea. I’d really appreciate that I have a chance to deliver a presentation at FOSS4G 2014. This project was mainly managed by BJ Jang, one of OSGeo charter member in South Korea, currently used at Korean Meteorology Agency. The title is “Big size meteorological data processing and mobile displaying system using PostGIS and GeoServer” Postgis로 스크립트 변경 페이지 잘보이게 수정 파트 넘길 때 이전 설명 추가
  2. 일반적으로 적절한 튜닝을 하지 않고 postgresql를 사용할 경우 성능과 서비스 품질이 떨어지는 문제가 발생되는데, 이런 문제는 상황에 맞는 튜닝을 통해 효과적으로 해결할 수 있습니다. 본 발표에서는 한국 기상청의 일기도 서비스를 사례로 어떤 튜닝방법을 통해 문제를 해결했는지 말씀드리도록 하겠습니다. Generally speaking, using PostGIS without tuning could lower the performance and quality of service. Tuning according to the situation or environment makes the service better. I will speak about the experience that our team successfully launched the weather chart service at KMA by using several tuning skills based on situations.
  3. Background
  4. 한국 기상청의 모바일 일기도 서비스는 다음과 같은 과정을 거쳐 진행됩니다. 먼저 관측자료를 수집하여 기상모델로 모델링하면 레스터데이터인 GRIB DATA로 변환합니다. 그 후 벡터라이징을 통해 벡터 일기도를 생성한 후 GeoServer를 통해 이미지화하여 서비스용 일기도를 서비스합니다. KMA’s mobile weather chart service is processed like this. On top of that, collected observation data is modeled and converted into GRIB data which is raster data. After that, vector weather charts are generated throughout vertorized and weather chart for service is serviced throughout imagification.
  5. 이 서비스의 아키텍처를 알아보면 먼저 kml 데이터를 postgresql에 넣은 다음 이 데이터를 GeoServer와 연동하여 모바일에서 html5, OpenLayers, JQueryMobile 등을 사용하여 서비스하는 구조로 되어있습니다. If you look at the service architecture here, kml data firstly are inserted into PostGIS and data in PostGIS is linked to GeoServer for the service using HTML5, OpenLayers, and JQueryMobile.
  6. 기상자료의 특징에 대해 말씀드리면, 기상자료는 5KM * 5KM 의 저해상도 영상이 대다수입니다. 또한 평면과 단순 Z축만이 아닌 등압면이라는 약간 다른 개념의 높이와 다양한 분석모델, 언제 관측되었냐의 자료시간과 이 자료를 가지고 언제를 예측할 것이냐는 등 다차원의 자료입니다. 또한 다른 일반적인 gis데이터와 다르게 하루에 수차례에서 수백차례에 생산될 정도로 자료생산주기가 빠릅니다. 또한 기상데이터의 특성상 항상 최신데이터를 필요로 합니다. Weather data are mostly low resolution images such as 5km by 5km. Also, there are somewhat different concepts such as isobaric surface, various kinds of analysis models, and observation date and time. Futhremore, different from general GIS data, frequency of data generation is quite often like from a few times to several hundreds times per day. Lastly, weather data should always be up to date.
  7. 저희가 실제로 다루는 데이터의 현황을 보면 하루에 4회 생산되는 데이터를 6개의 공간테이블에 밀어 넣습니다. 이 데이터를 이용하여 5332장의 일기도를 생성하고 이 데이터는 35gb정도의 용량이며 67,000,000행의 공간데이터가 쌓입니다. 하루에 엄청나게 많은 데이터가 처리되어 쌓이고 있습니다. 이렇게 생산되는 데이터는 남한 인구보다도 많습니다. The system used 6 spatial table to handle weather data generated 4 times per day. From these data, more than five thousand weather charts are generated, which is about 35 GB and 67M columns. Gigantic amount of data is collected, generated, processed, and stacked every day. Number of spatial data columns is more than the number of South Korea population.
  8. 다음은 저희가 이 서비스에서 극복해야 했던 문제들에 대해서 알아보겠습니다. I will go over some problems that we had to overcome.
  9. 이러한 데이터의 양으로 인해 3가지 문제가 발생했습니다. 먼저 데이터의 수집이 느리며 매일 매일 쌓이는 많은 데이터량으로 인해 데이터 유지관리가 제대로 되지 않았고, 데이터 조회가 느렸습니다. 즉 db에 관련된 전범위적인 부분에 문제가 있었습니다. Due to the size of weather data, there could be three problems. Firstly, it takes too much time to collect data. Secondly, data is not properly managed because lots of data is accumulated every day. Lastly, it takes too much time to search data. In all, there are all-round problems regarding database.
  10. 이러한 문제의 발생원인은 기상자료의 특징과 상황에 대한 파악이 부족하였기 때문입니다. 시스템 개발초기단계에서 단순히 데이터를 postgresql에 넣고 이를 GeoServer로 서비스하면 될 것이다 라고 생각했지만, 데이터의 특성을 제대로 파악하지 못한 채로 일반적인 서비스 구조를 적용하여 이런 문제가 일어났습니다. /*그리하여 앞서 말씀 드린 데이터 인서트 속도 개선, 데이터 자료 유지, 데이터 조회 속도 개선 이라는 3가지 파트로 나누어 튜닝을 하였습니다.*/ The reason to happen these problems is lack of characteristics and situation of weather data. At the beginning level of system development, people simply thought putting data into PostGIs and servicing using GeoServer without understanding characteristics of data. However, weather data is quite unique, so customization should be required before development of the system. /*From this perspective, we tuned the system based on three goals that I said before: inserting all data less than 30 minutes, keeping the size of data file fixed, and searching a weather chart withing a few second. */
  11. 구체적인 문제점을 살펴보면 먼저 자료를 인서트하는데 5시간이 소요됬으며 매일매일 35기가씩 데이터자료가 늘어났습니다. 또한 일기도 한 장을 모바일로 조회하는데 수 십 초가 걸렸습니다. 이런 상황분석 후 저희는 다음과 같은 목표를 잡았습니다. 30분이내에 데이터를 인서트하고, 불필요한 데이터파일이 늘어나지 않게 유지하며 수초이내에 일기도를 조회할 수 있도록 하는 것 입니다. 애드배치와 익스큐트배치를 이용하여 30분이내에 데이터를 인서트하고, 파티셔닝과 트룬케이트를 이용하여 불필요한 데이터파일이 늘어나지 않게 유지하며 인덱스개선을 통해 수초이내에 일기도를 조회할 수 있도록 하는 것 입니다. More specifically, it usually took five hours to insert all data to generate weather charts and the size of data grows 35 GB every day. Also, it took more than tens of seconds to search a single weather chart on mobile devices. Based on this situation, we built our own goal. We want to improve the system like this: inserting all data less than 30 minutes Using addBatch() & excuteBatch(), keeping the size of data file fixed Using partitioning & truncate, and searching a weather chart withing a few second by Improvement on index. From this perspective, we tuned the system based on three goals /*that I said before: inserting all data less than 30 minutes, keeping the size of data file fixed, and searching a weather chart withing a few second. */
  12. Improvement on importing speed for big size data
  13. 데이터를 어떻게 임포트하느냐에 따라 속도가 달라졌습니다. 데이터를 6700만건을 일일이 하나씩 임포트할 때에는 24시간이 넘게 소요되었습니다. 하지만 이를 모아서 덩어리로 한번에 임포트하면 시간이 훨씬 단축되었습니다. 우측의 그래프는 실제로 테스트한 결과를 나타낸 것이며 3000건 정도 모아서 인서트시 수십 수백배의 시간을 단축할 수 있었습니다. There was big difference of speed according to how to import data. It took more than 24 hours to import one by one of 67 millions data. However, it is shortened if data is imported at a time. Graph on the right side shows the result of the test and it says that it shortens more than several hundreds times of time when inserting after gathering three thousands of data.
  14. 하나의 일기도 kml파일안에는 약 3000행의 데이터가 들어있는데 이 데이터를 가지고 실제 삽입속도를 테스트해보았습니다. 한건씩 임포트시 109초가 소요되었지만 addBatch()를 이용하여 데이터를 모은 후 한번에 임포트 시에 시간이 엄청 단축되었습니다. 추가: 여기서 쓰이는 addBatch()와 excuteBatch()는 jdbc2.0을 지원하는 모든 db에서 사용할 수 있는 기능입니다.. 100번 addBatch() 후 executeBatch()배치를 하였을 시 8.9초가 걸렸으며 3000번 실행 시 1.1초로 줄어들었습니다. 무려 백배 이상의 속도개선이 있었습니다. 어떻게 임포트를 하느냐에 따라서 이렇게 달라졌습니다. One weather chart KML file has about three thousands columns of data and we took a importing speed test using these data. When importing one by one, it took 109 seconds, but as you can see here, using addBatch() after gathering data saves huge amount of time. It took 8.9 seconds to do executeBatch() after 100 times of addBatch() and it took only 1.1 seconds after 3,000 times of addBatch(). This definitely shows that how to import makes huge difference.
  15. 두번째 테마는 데이터를 어떻게 유지하느냐 하루에 35기가씩 늘어나는 데이터를 어떻게 유지시킬 것이냐 입니다. Second task is about how to keep the data file size stable, which originally grows 35 GB per day. 제목고려
  16. 먼저 postgresql에서 데이터를 어떻게 관리를 하는 점을 알아보겠습니다. postgresql이 다른 dbms로부터 공격받는 문제 중 하나는 postgresql은 추기형이라는 것입니다. update나 delete시 자료를 실제로 데이터베이스에서 지우지 않습니다. 지웠다는 표시만 하고 실제로 지우지 않기 때문에 실행 속도가 빠르고 버져닝이 가능하다는 장점이 있습니다. 하지만 데이터파일의 크기가 엄청나게 늘어나기 때문에 성능저하로 서버가 죽는 상황이 발생할 수 있습니다. 더구나 기상데이터는 하루에 35기가씩 증가하기 이런 문제를 반드시 해결해야 했습니다. I will go over who to manage data on PostGIS. The problem of PostGIS or difference from other DBMS is PostGIS is write-once type. When updating or deleting, real data isn’t removed from database. There are some marks on deleting without removing, so execution is fast and versioning is possible. However, this makes the size of database extremely large, sometimes making the system down due to slow-down of performance. Also, weather data increase by 35 GB per day and we should solve this problem.
  17. 좀 더 살펴보겠습니다. 오라클에서는 b라는 데이터를 갱신 하면 b가 b’로 보이게 됩니다. B는 스냅샷에 들어가게 되고 트랜잭션이 완료되면 사라지게 됩니다. 하지만 postgresql는 갱신 전 레코드는 그대로 두고 갱신 후 레코드를 추가를 시킵니다. 이는 트랜잭션이 일어날 때마다 데이터가 늘어난다는 특징이 있습니다. I will go over more in detail. On Oracle, if renewing data called b, b looks as b’. B goes into snaphot and disappears after completing transaction. However, on PostGIS, it keeps record before renewing and adding a record after renewing. This makes the data increase whenever transaction.
  18. postgresql의 이러한 특징으로 인해 postgresql에서는 VACUUM이라는 기능을 제공합니다. 청소기라는 이름과 같이 필요 없는 데이터를 빨아들이는 기능을 하며 자동으로 실행됩니다. 그림을 보시면 b와 c는 b’와 c’로 갱신되었으며 e는 삭제한 데이터입니다. postgresql에서는 Bce가 각각의 자리에 그대로 있는데 여기서 VACUUM을 실행되면 bce데이터는 Fsm이라는 공유메모리에 들어가게 됩니다. 그 후 데이터를 넣으면 b가 있던 자리에 f가 들어가는 것을 알 수 있습니다. 하지만 이 방식은 디비가 너무 바쁘게 많은 일을 하고 있을 경우 VACUUM이 실행되어도 파일이 줄기는 커녕 늘어나는 현상이 일어났습니다. Owing to PostGIS’s feature, PostGIS provides a function called vacuum. Like real vacuum, this function plays a role to absorb data and automatically executes. As you can see here in this slide, b and c are renewed b’ and c’ and e is deleted. On PostGIS, b, c, and e data are remained where they originally are, but if vacuum is executed, b, c, and e data is moved to share memory called FSM. After that, any data is inserted, f is inserted into the location of b. However, in case that database is too busy, this way could even increase the data file even though vacuum is executed.
  19. 이전의 일반적인 VACUUM과 달리 FULL VACUUM이라는 기능을 사용하면 실제로 파일사이즈를 줄일 수 있습니다. 그림과 같이 필요 없는 공간을 지우고 뒤의 자료를 삭제한 뒤 빈 공간에 밀어 넣는 방식인데 기상청의 3일치 데이터를 가지고 FULL VACUUM을 해본 결과 대략 15시간이 걸렸습니다. 게다가 FULL VACUUM을 하는 동안은 디비에 락이 걸려 아무것도 할 수가 없었습니다. 즉 FULL VACUUM도 쓸 수가 없는 상황이었습니다. Different from general vacuum, using the function called full vacuum can decrease the file size. Like this image, it deletes useless spaces and data and push all data back to empty spaces. As a result of applying this function into three days’ of KMA data, it took 15 hours. Furthermore, during full vacuum, database is locked and can’t do anything. Thus, full vacuum is not a good option.
  20. 그래서 찾아본 방법이 PARTIONING입니다. PARTIONING은 대부분 디비에서 지원하는 기능이며 데이터의 양이 많을 때 사용하는 방법입니다. 그리하여 일기도를 요일별로 7개로 나누었습니다. 각 요일마다 인서트하는 테이블을 다르게 하고 각 요일마다 지워야 할 테이블을 정하였습니다. 일요일은 0번 테이블에 데이터가 들어가고 4번 테이블의 데이터가 삭제됩니다. 그럼 전체의 7개 테이블에서 3개의 테이블에만 데이터가 들어가게 되고, 매일 똑같은 작업이 반복됩니다. 이때 데이터를 지우기 위해 VACUUM대신 TRUNCATE를 이용하면 삭제 시 시간이 1초 이하의 시간밖에 걸리지 않습니다. 순식간에 다 날려버립니다. 그 결과 쉽고 빠르게 데이터를 최대 n-1일치로 유지할 수 있었습니다. So, we try to do partitioning. Partitioning is a function provided by database and used when data size is huge. To use partitioning, we divided weather chart into 7 by days from Monday to Sunday. We defined tables by days to insert and also defined tables by days to delete. For example, on Sunday, data is inserted into table 0 and data on table 4 is deleted. On all 7 tables, data is inserted into three tables and repeated same works every day. At this time, in order to delete data, it takes less than one second to use truncate instead of vacuum. It blows away in the blink. As a result, we could easily and quickly keep all data less than n-1 days.
  21. 마지막으로 조회속도 개선에 대해 알아보겠습니다. Lastly, I will go over improvement on inquiry speed.
  22. 조회속도 개선과정을 보면 먼저 데이터의 분포를 파악합니다. 어떤 데이터가 많고 속도가 느린지 알아보는 것입니다. 그 다음 실제로 어떤 쿼리가 사용되는지를 파악해야 하며 어떤 쿼리 플랜이 생성되어 실행되는 지 파악하여 인덱스를 개선하는 과정으로 진행됩니다. If you look at the improvement flow of inquiry speed, present condition of data is firstly analyzed, understanding which data is big or slow. Next, after understanding what kinds of data is really used, what kinds of query plan is executed, index is steadily improved.
  23. 데이터 현황분석은 테이블의 로우 수가 얼마나 되는지 파악하는 게 중요합니다. 일반적으로 셀렉트 카운트를 이용하는데 이러면 시간이 오래 걸립니다. 하지만 통계테이블을 이용하면 빠르게 찾아낼 수 있습니다. 위와 같은 쿼리를 날리면 아래와 같은 결과가 수초 내 에 나타납니다. It’s important to grasp out the number of rows of tables for Data Condition Analysis. It took too much time to generally use select count(Asterisk). However, using statistical table as pg_class, it can be quickly recognized. If executing the query like above on the right side, the result shows like the below on the right side within a few seconds.
  24. 다음은 DB적인 문제에서 살짝 벗어난 얘기를 해보겠습니다. GeoServer 와 PostGIS를 연동하여 단순히 레이어를 사용하는 것이 아닌 레이어를 쉽게 관리하게 위하여 SQL VIEW라는 기능을 사용하였습니다. 이는 Oracle Spatial, PostGIS, Arc SDE와 같은 GeoDB가 데이터 소스인 경우 쓸 수 있는 기능인데 어느 특정한 SQL문을 하나의 레이어처럼 관리할 수있습니다. 이 시스템에서는 데이터가 6개의 테이블로 구성되있어서 조건절 쿼리가 복잡한데 SQL VIEW를 만듬으로써 편리하게 관리할 수 있었다. 또한 좌표계변환과 같은 작업도 SQL VIEW를 만드는 과정에서 할 수 있다. 이는 DB머신에서 작업을 시킴으로써 클라이언트측이나 GeoServer에서 작업을 하는 것보다 훨씬 빠르게 결과를 나타낼 수 있다. 우측 위와 같은 쿼리를 이용하면 아래 결과와 같은 속성을 가진 레이어로 관리할 수 있다. 다음 쿼리를 찾는 과정에서 우측에 쓰인 쿼리가 어떻게 쓰이는 지 알아봅시다. Next, I will move to other subject which is a little bit away from db. I use sql view in conjunction with postgis and geoserver, for easily manage layer not just to use a layer. It can manage a specific SQL query when datasource is geoDB like oracle spatial, postgis, sde etc. this system consists of six tables, so query are forced to complex but can manage easily By creating a SQL VIEW. In addition, In the process of making SQL VIEW, it can operate another work like a reprojection. By the operation in the DB machine, it is possible to obtain results more quickly than in the geoserver or client. Such Up in the right side query can be managed as a layer having the same properties as the result of down in the right side. in next page, how to used this query in the right side.
  25. /*기상청 서비스는 조회 쿼리를 할 때 GeoServer와 postgresql를 연동하여 sql뷰를 이용합니다. 즉 특정한 sql문을 하나의 레이어로 관리할 수 있습니다. 이 방법을 이용함으로써 복잡한 조건을 편하게 관리할 수 있지만, 이 방식의 단점은 실제 postgresql에 들어오는 쿼리가 GeoServer에 등록한 sql문과 달리 더 복잡해지다는 것입니다. 따라서 */ 조회속도 개선을 위해 실제 수행되는 Sql문을 찾아내는 것이 중요합니다. 이를 위해 통계테이블을 이용하여 내부에서 실행중인 sql문을 찾아내고 그 sql문에 어떤 조건 절이 어떤 형태로 들어가는 지에 대해 파악했습니다. 위는 아래 쿼리의 결과입니다. 현재 실행중인 쿼리가 나오고 언제 시작되었는지 현재 돌고 있는지 얼마나 시간이 소요되는지에 대하여 파악되며 여기서 느린 쿼리를 찾아냅니다. 아래는 복잡하지만 sql 뷰에 등록한 쿼리가 내부에서 어떤 쿼리로 실행되는지를 확인한 샘플입니다. 추가:이전페이지에서 등록한 sql view가 실제로 쿼리에서 테이블의 역할을 하고 있는 것을 볼 수 있습니다. /*When requesting a query on KMA service, SQL view is used as linking GeoServer with PostGIS. In other words, Specific SQL statement can be managed as one layer. As using this way, complex query conditions can be easily manages, but the query on PostGIS could be more complicated than sql statement on GeoServer. Thus,*/ actually executed SQL statement should be found to improve inquiry speed. For doing this, we found actually executing SQL statement internally using statistical table as pg_stat_activity and grasped out how much time it took. Up in the right side is the result of query execution of down in the left side. Currently executing query is shown and it shows when it started, how much time it rook, and slow query. The query down in the right side is a little bit complicated and the sample of internally executing one registered on SQL view. You can see sql view registered previous page have a role in query as table.
  26. 오라클의 분석기능은 전문가 기능으로 구성되어 있으며 일반적인 클라이언트로 오라클 설치 시 전문가기능은 설치가 안됩니다. 하지만 postgresql는 기본적으로 깔리는 커맨드라인에서도 분석가능하며 ui툴인 pgadmin-3에서도 분석이 가능합니다. Sql 클릭 후 쿼리탭에서 explain-analyze 버튼을 클릭하면 아래와 같이 그래피컬하게 쿼리가 진행되는 과정을 확인 할 수 있으며 EXPLAIN ANALYZE 명령어를 실행 하면 아래와 같은 결과가 나옵니다. 이 결과를 가지고 쿼리 내용을 분석합니다. Oracle’s analysis function is consisted of professional functions and basic clients doesn’t have professional functions. However, PostGIS provides command line analysis function on its basic installation and pgadmin-3 which is ui tool of PostGIS also has that function. After clicking SQL, if clicking exlain-analyzing button on query tap, you can graphically see what’s going on query and also can see the result when executing explain analyze command. Using this result, query can be analyzed.
  27. 인덱스 개선을 할 때에는 위 분석 결과를 바탕으로 어떻게 인덱스를 구성할 지를 고려해야 합니다. 먼저 WHERE 절에 있는 가능한 모든 컬럼들을 한꺼번에 묶어서 인덱스를 구성합니다. 여기서 공간데이터 컬럼은 인덱스 방식이 조금 달라 별도로 구성합니다. 다음으로 고려할 것은 데이터의 종류가 많은 컬럼부터 먼저 써야 합니다. 이렇게 필터링을 통해 많은 데이터를 먼저 걸러내야 더욱 효과적입니다. 또한 EQUAL과 같은 등위연산자가 포함된 항목부터 구성합니다. 작다 크다, like 등과 같은 항목을 먼저 필터링하는 것보다 효율이 큽니다. 마지막으로 불필요한 인덱스는 제거합니다. 이 결과 인덱스 생성으로 인해 데이터용량이 20%나 감소하였으며 조회속도는 테이블별로 6배에서 25배까지 빨라졌습니다. 테이블이 클 수록 효과가 큰 것으로 나타났습니다. We should consider how to set the index based on previous analysis result when improving index. First of all, index with all columns is set on Where clause. Here, spatial column has somewhat index type, so it should be set separately. Next, Columns with lots of data types should come first. Like this, it is more effective to filter out some using filering. Also, items including same operator like EQUAL should come first, which is more efficient than filtering out items such as smaller, larger, and like. Lastly, unnecessary index should be removed due to bad performance on inserting. As a result, data capacity is decreased by 20 % due to index creation and inquiry speed has increased by 6 times to 25 times. It seems that the bigger table size, the better performance.
  28. Lastly, Improvement result!
  29. This is demo. And I will show you about our system. This mobile site. First, when click a button ,GDAPS, isobaric lists are showing. Isobaric means that has same atmospheric pressure section in the air. And under the isobaric list. meteorological data type list appears. And i can view weather chart when I select an option. So we can
  30. 위에서 말씀드린 세 가지 테마를 가지고 튜닝을 한 결과 앞에 보이시는 바와 같은 결과가 나왔습니다. 데이터를 인서트하는데 있어서는 시스템에 따른 최적의 조건에 찾아 실행하는 것이 중요하다는 것을 알았으며 이 결과 100배 정도의 성능 개선을 얻었습니다. 두 번째로 데이터파일 크기 유지는 partioning과 truncate의 조합으로 인하여 N-1일치의 데이터를 안정적으로 유지할 수 있었으며 마지막으로 조회시간은 쿼리에 알맞은 적절한 인덱스를 찾아서 재구성하여 20배 정도의 속도개선 효과를 보게 되었습니다. As I previously said, we have some results by tuning according to three scenarios. We just found out that appropriate conditions for system is very important to insert data and we improved 100 times performance. Secondly, we stably keep the data file size as N-1 accordance data by mixing up partitioning and truncate. Lastly, we have about 20 times inquiry time improvement throughout recomposing appropriate index for queries.
  31. 결론은 postgresql는 정말 훌륭한 DBMS이며 다른 DBMS와 비교하여도 성능이 떨어지지 않습니다. 게다가 GeoServer와의 궁합도 정말 좋아 활용도도 높습니다. 하지만 특성을 파악하고 상황에 맞춰 적절한 튜닝 과정을 거쳐야만 좋은 성능을 낼 수 있다는 것입니다. In conclusion, PostGIS is really great DBMS and the performance is never lower than other DBMS. Plus, it is perfectly suited with GeoServer, so availability is high. However, better performance will be guaranteed after tuning with perfect understanding of the features.
  32. If you have any questions, please ask BJ Jang via Email - bjjang@gaia3d.com Thank you for listening