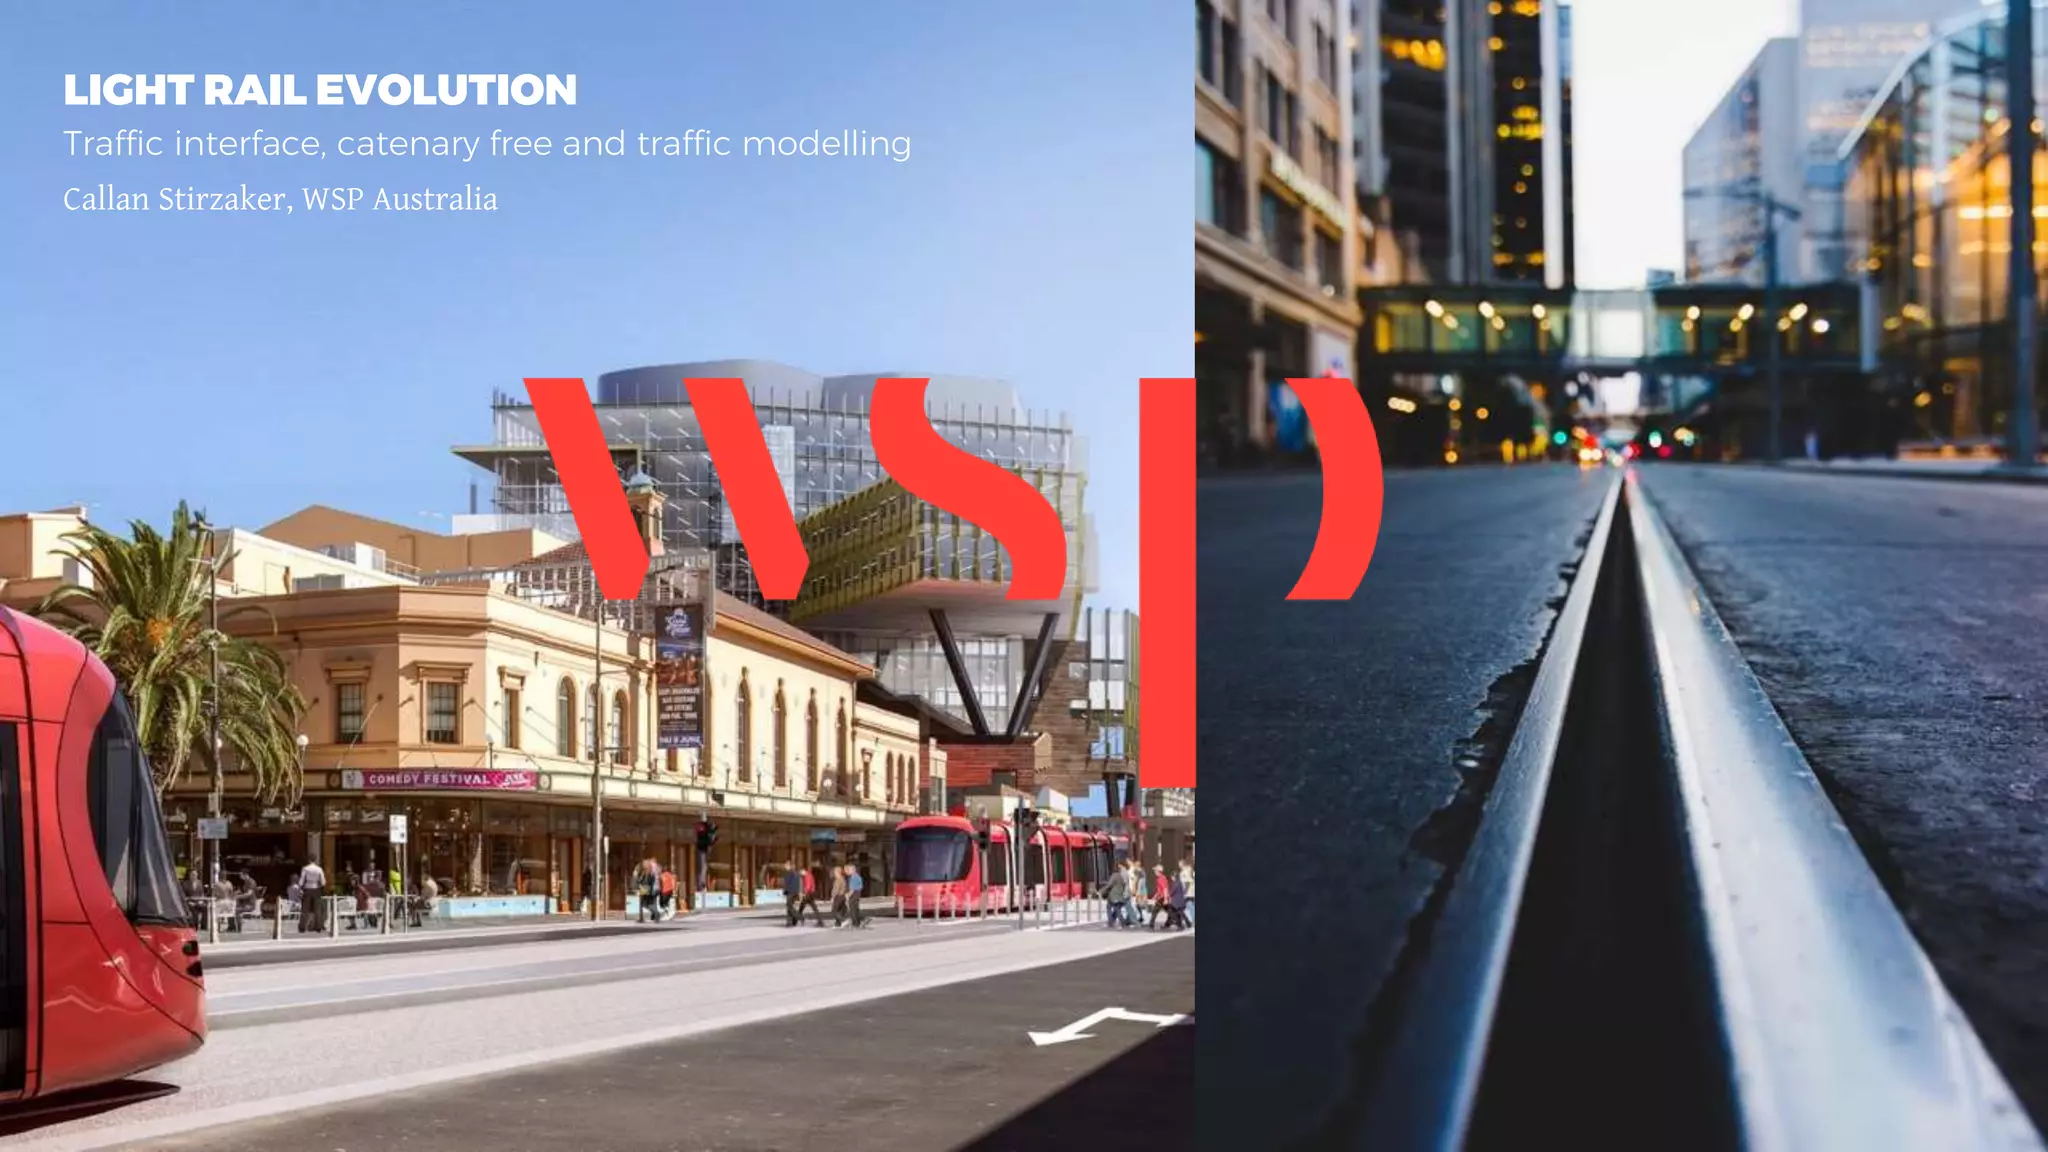
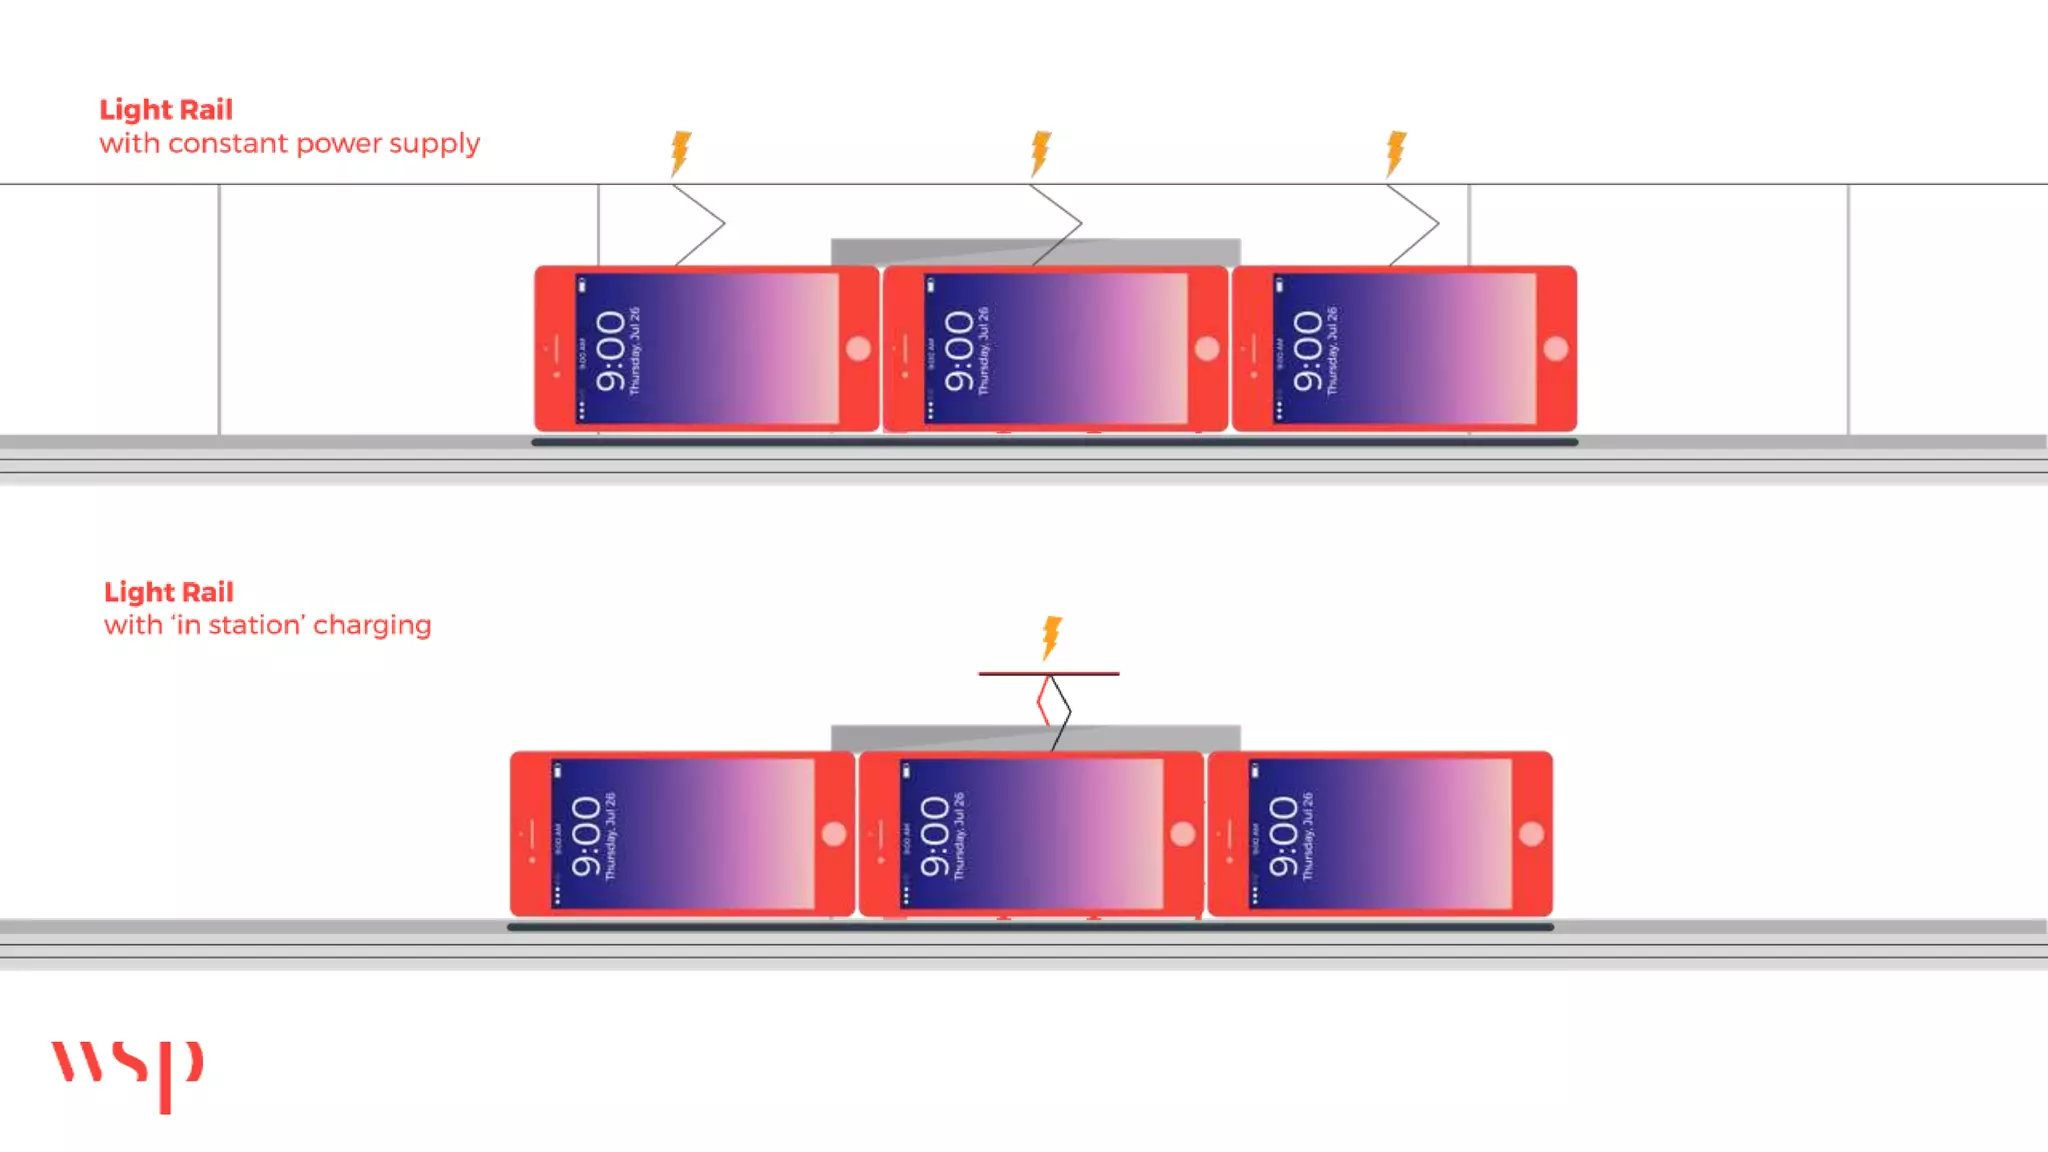
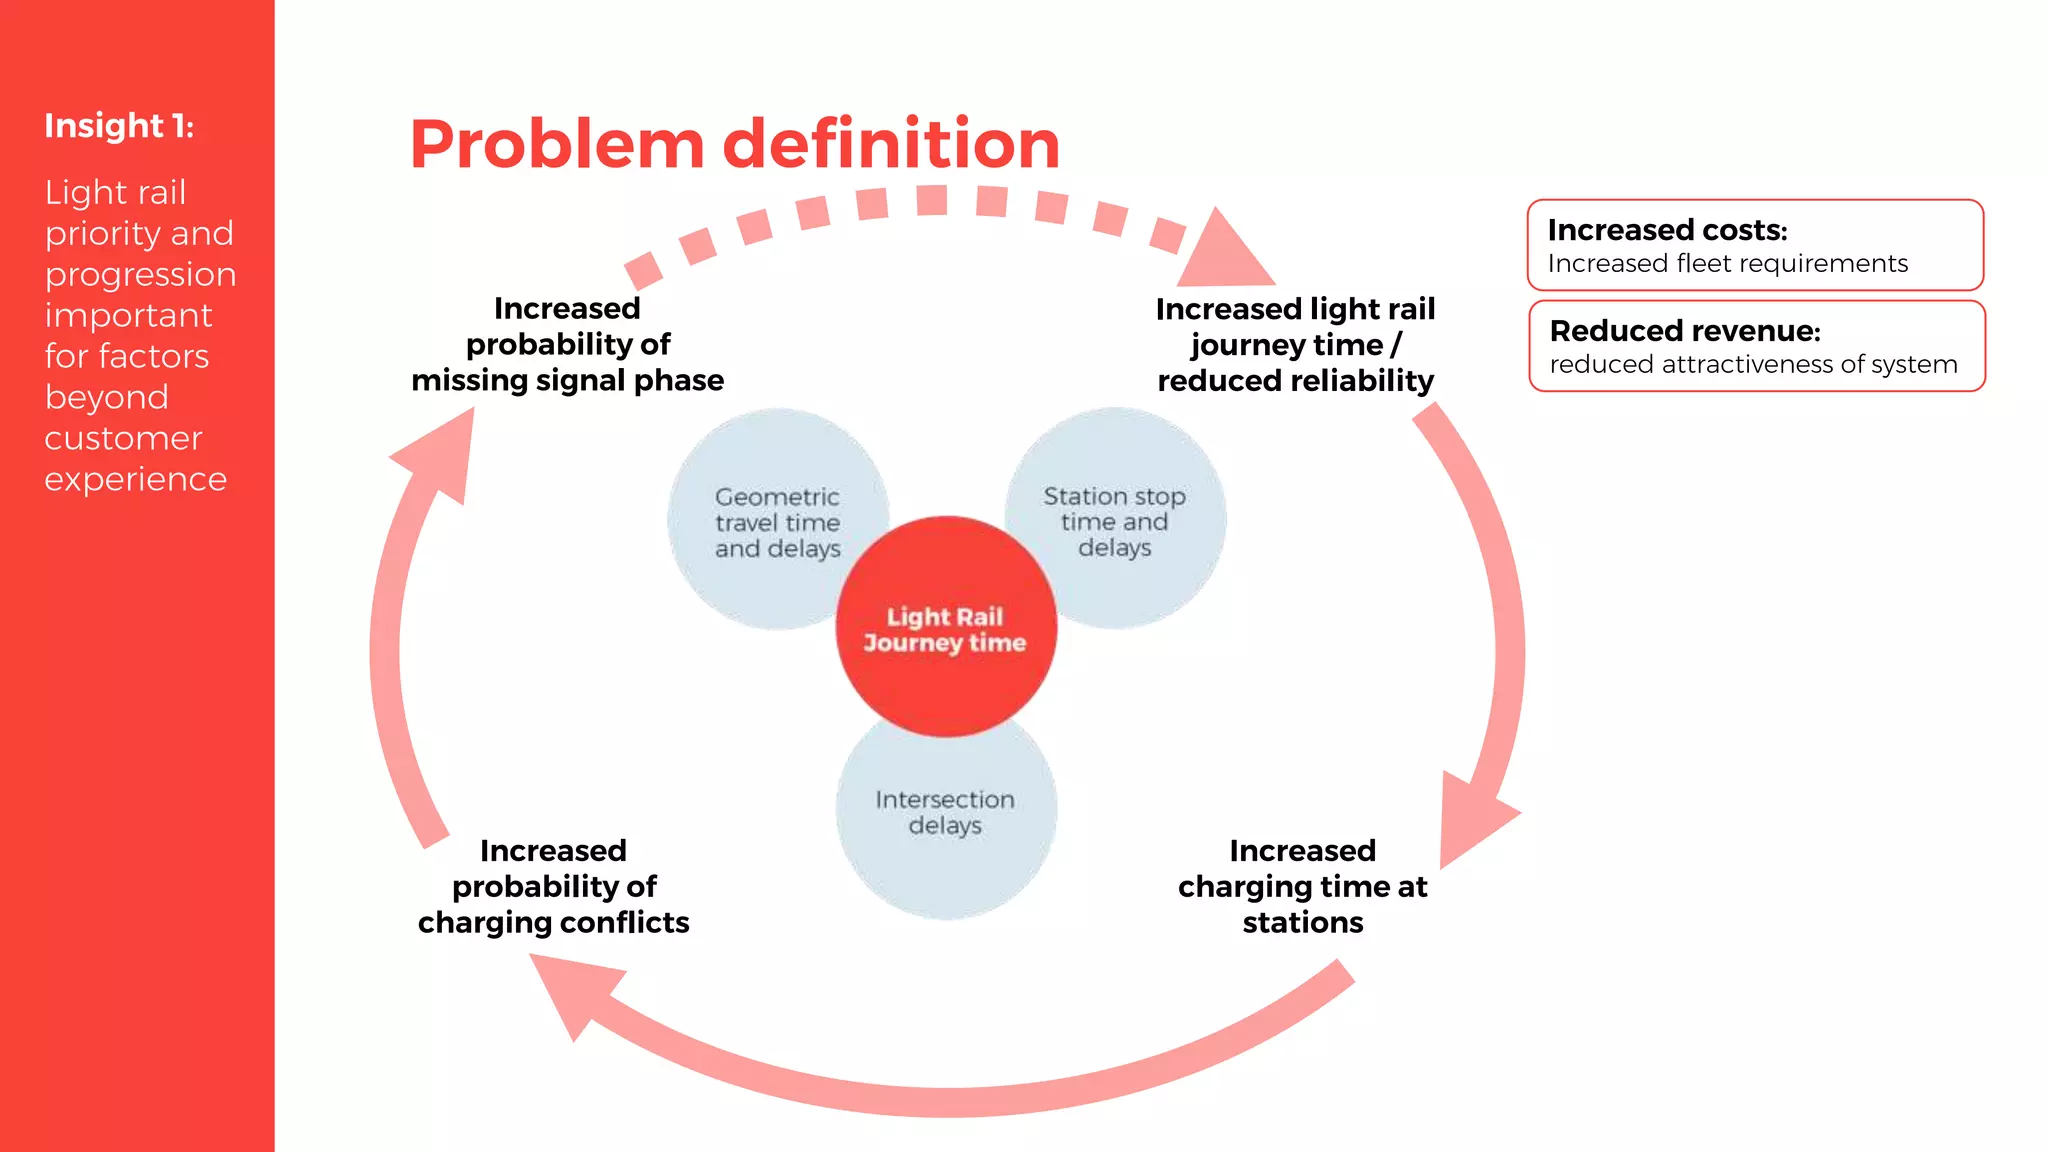
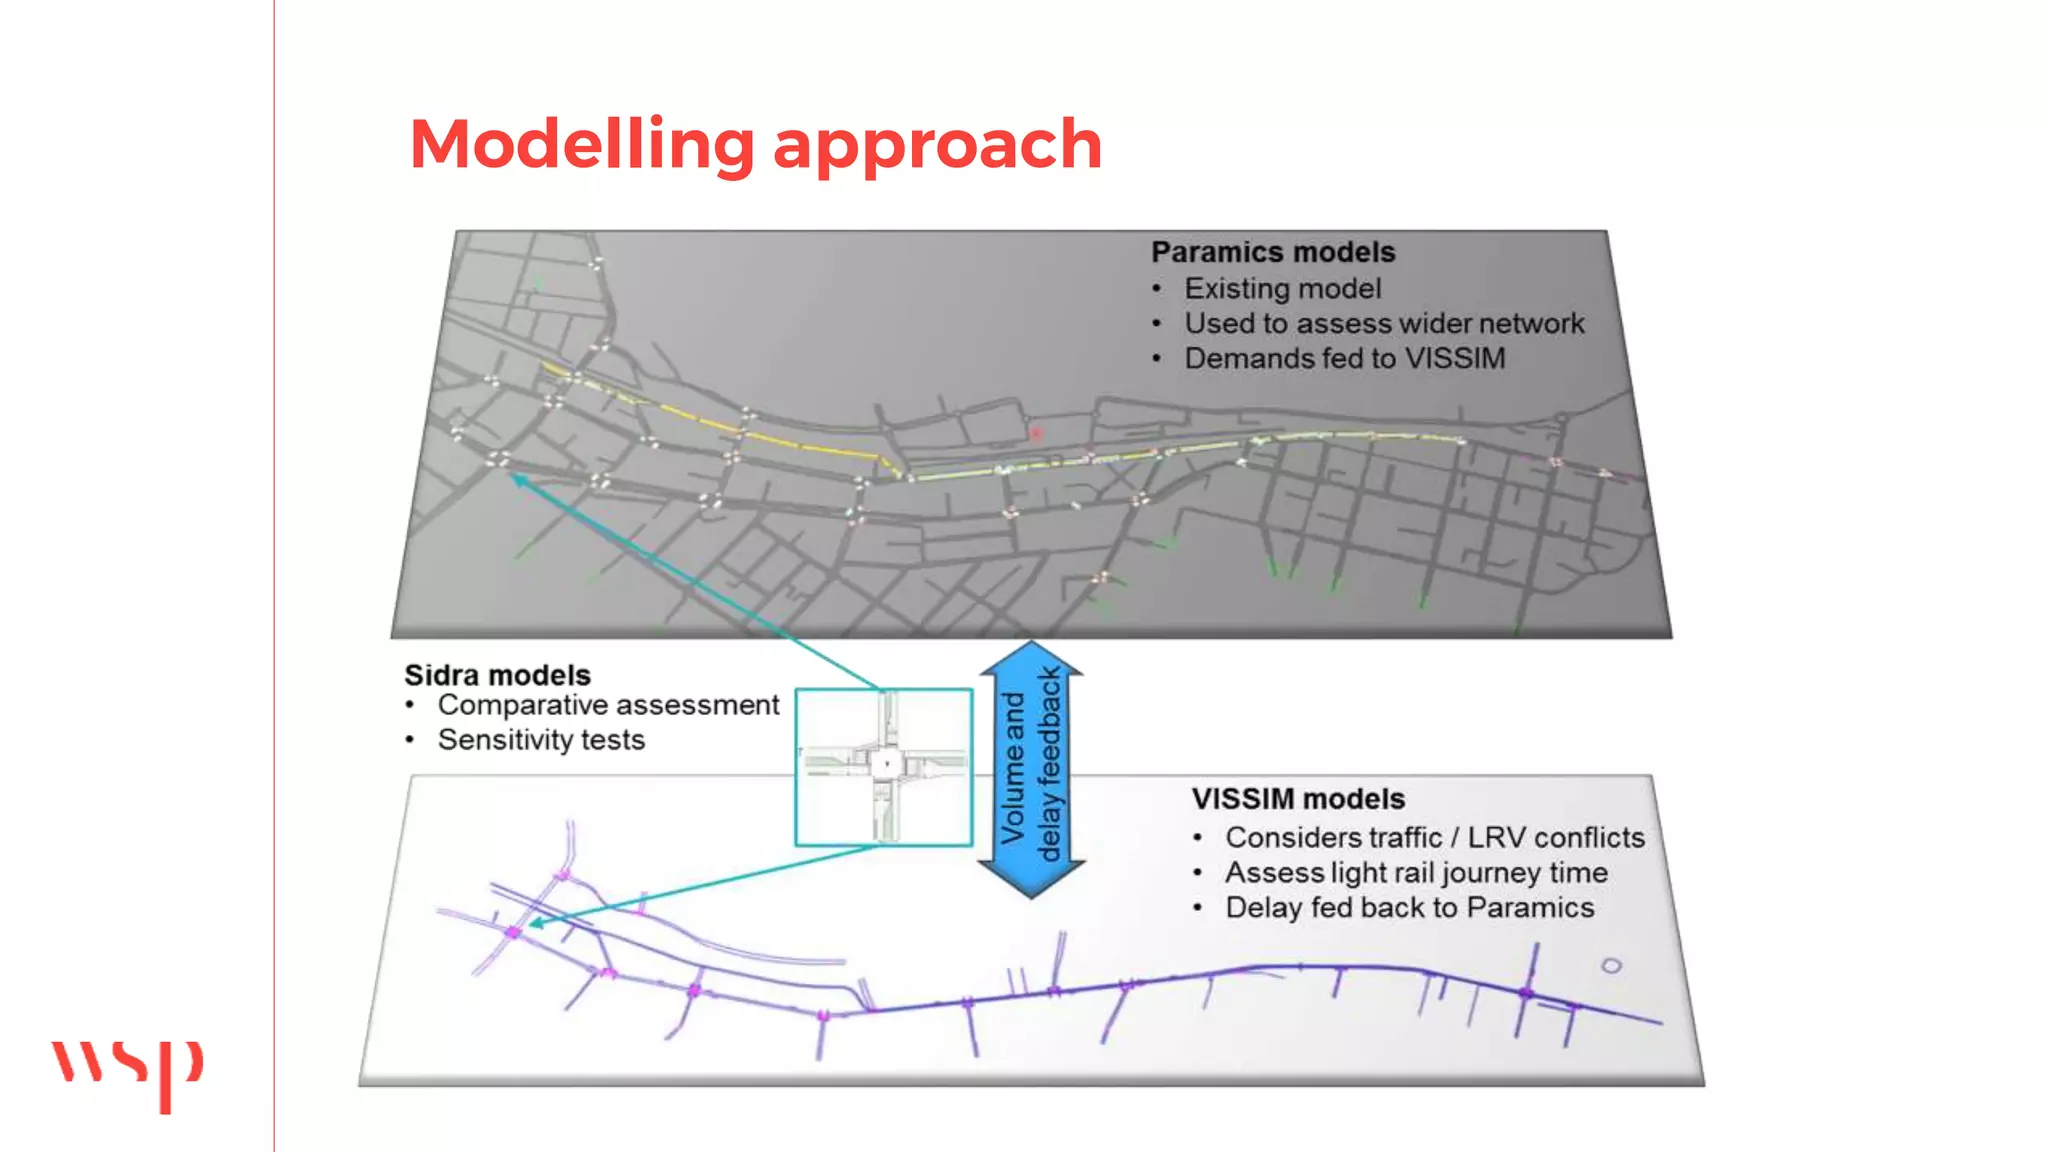
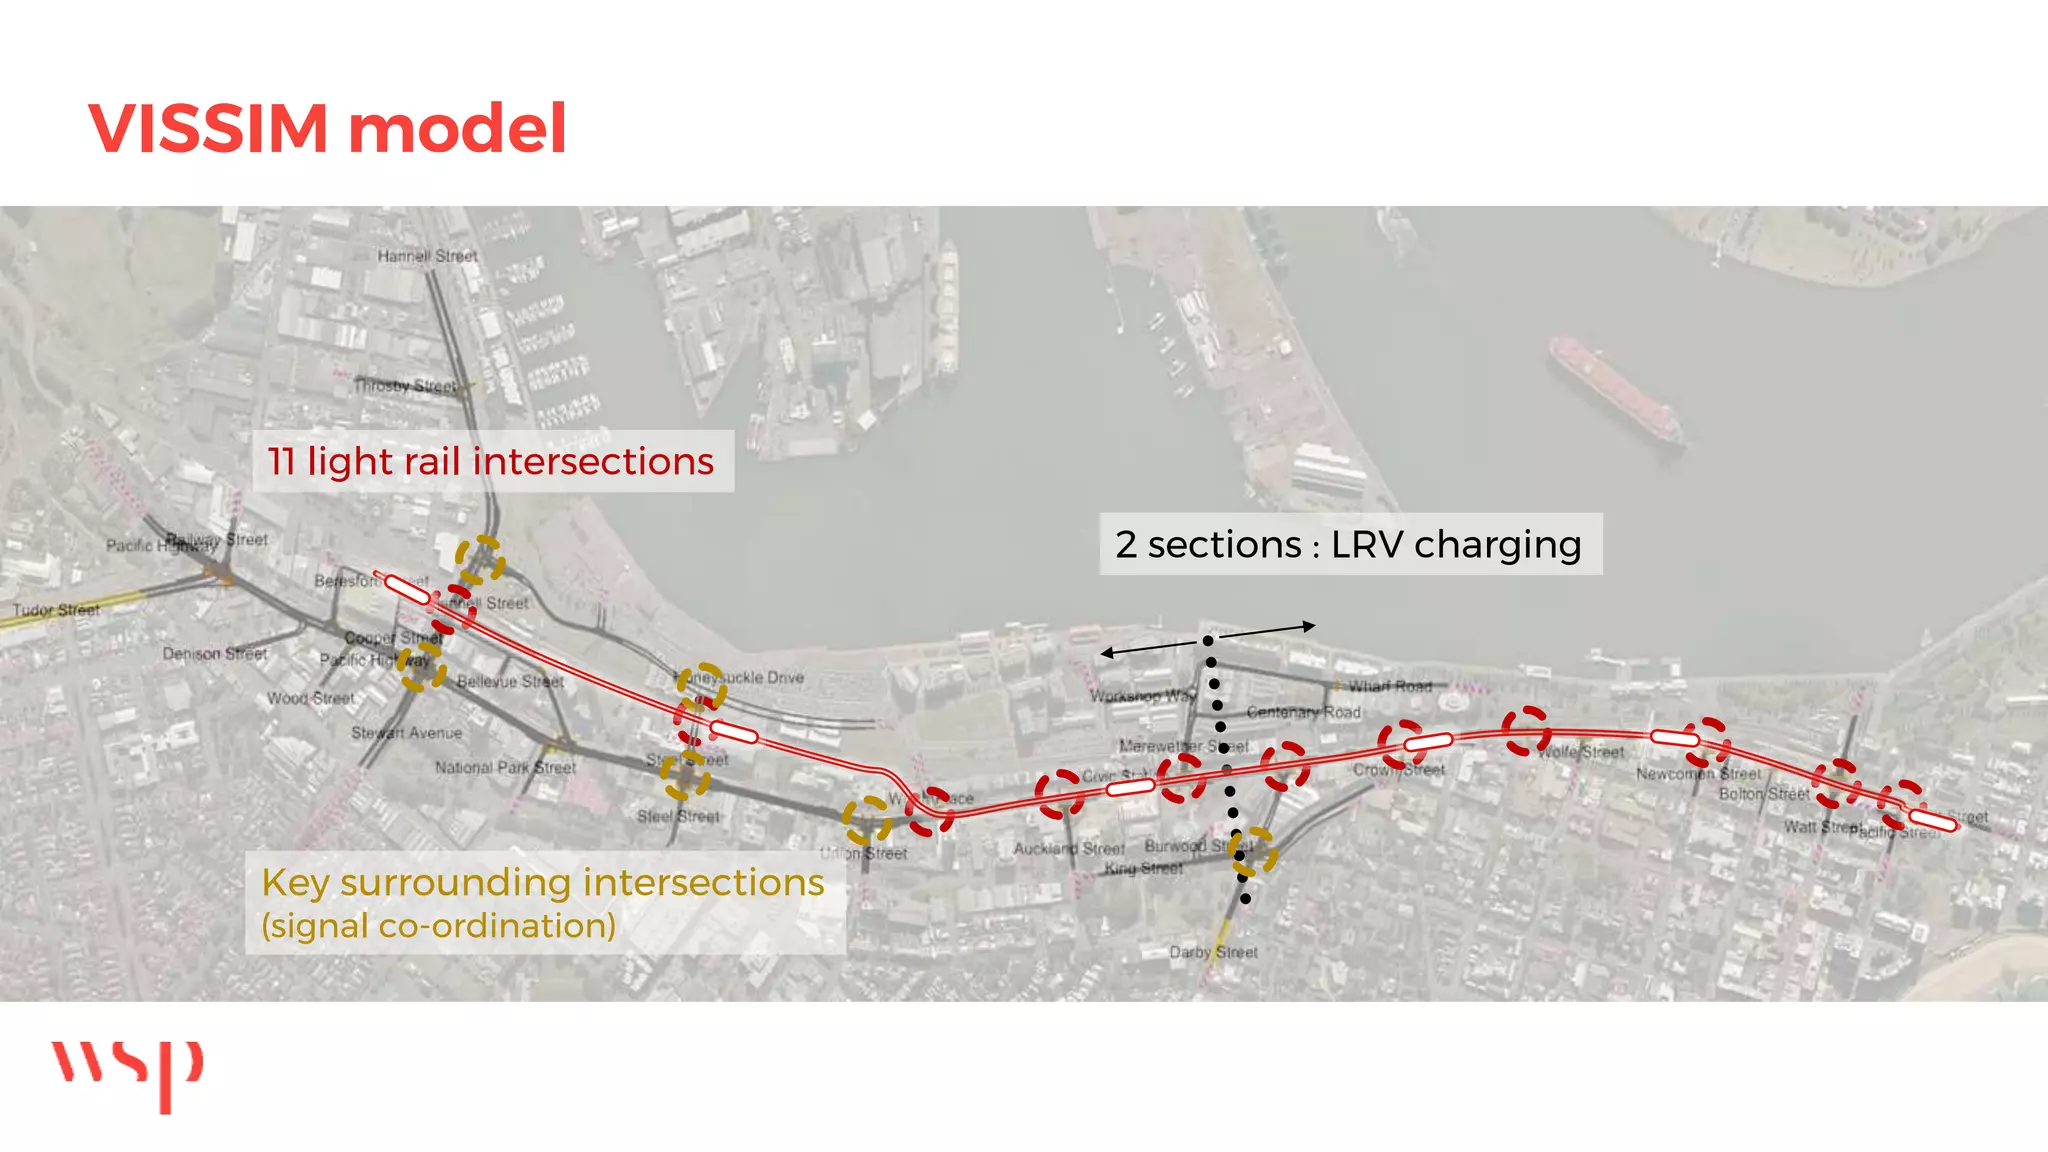
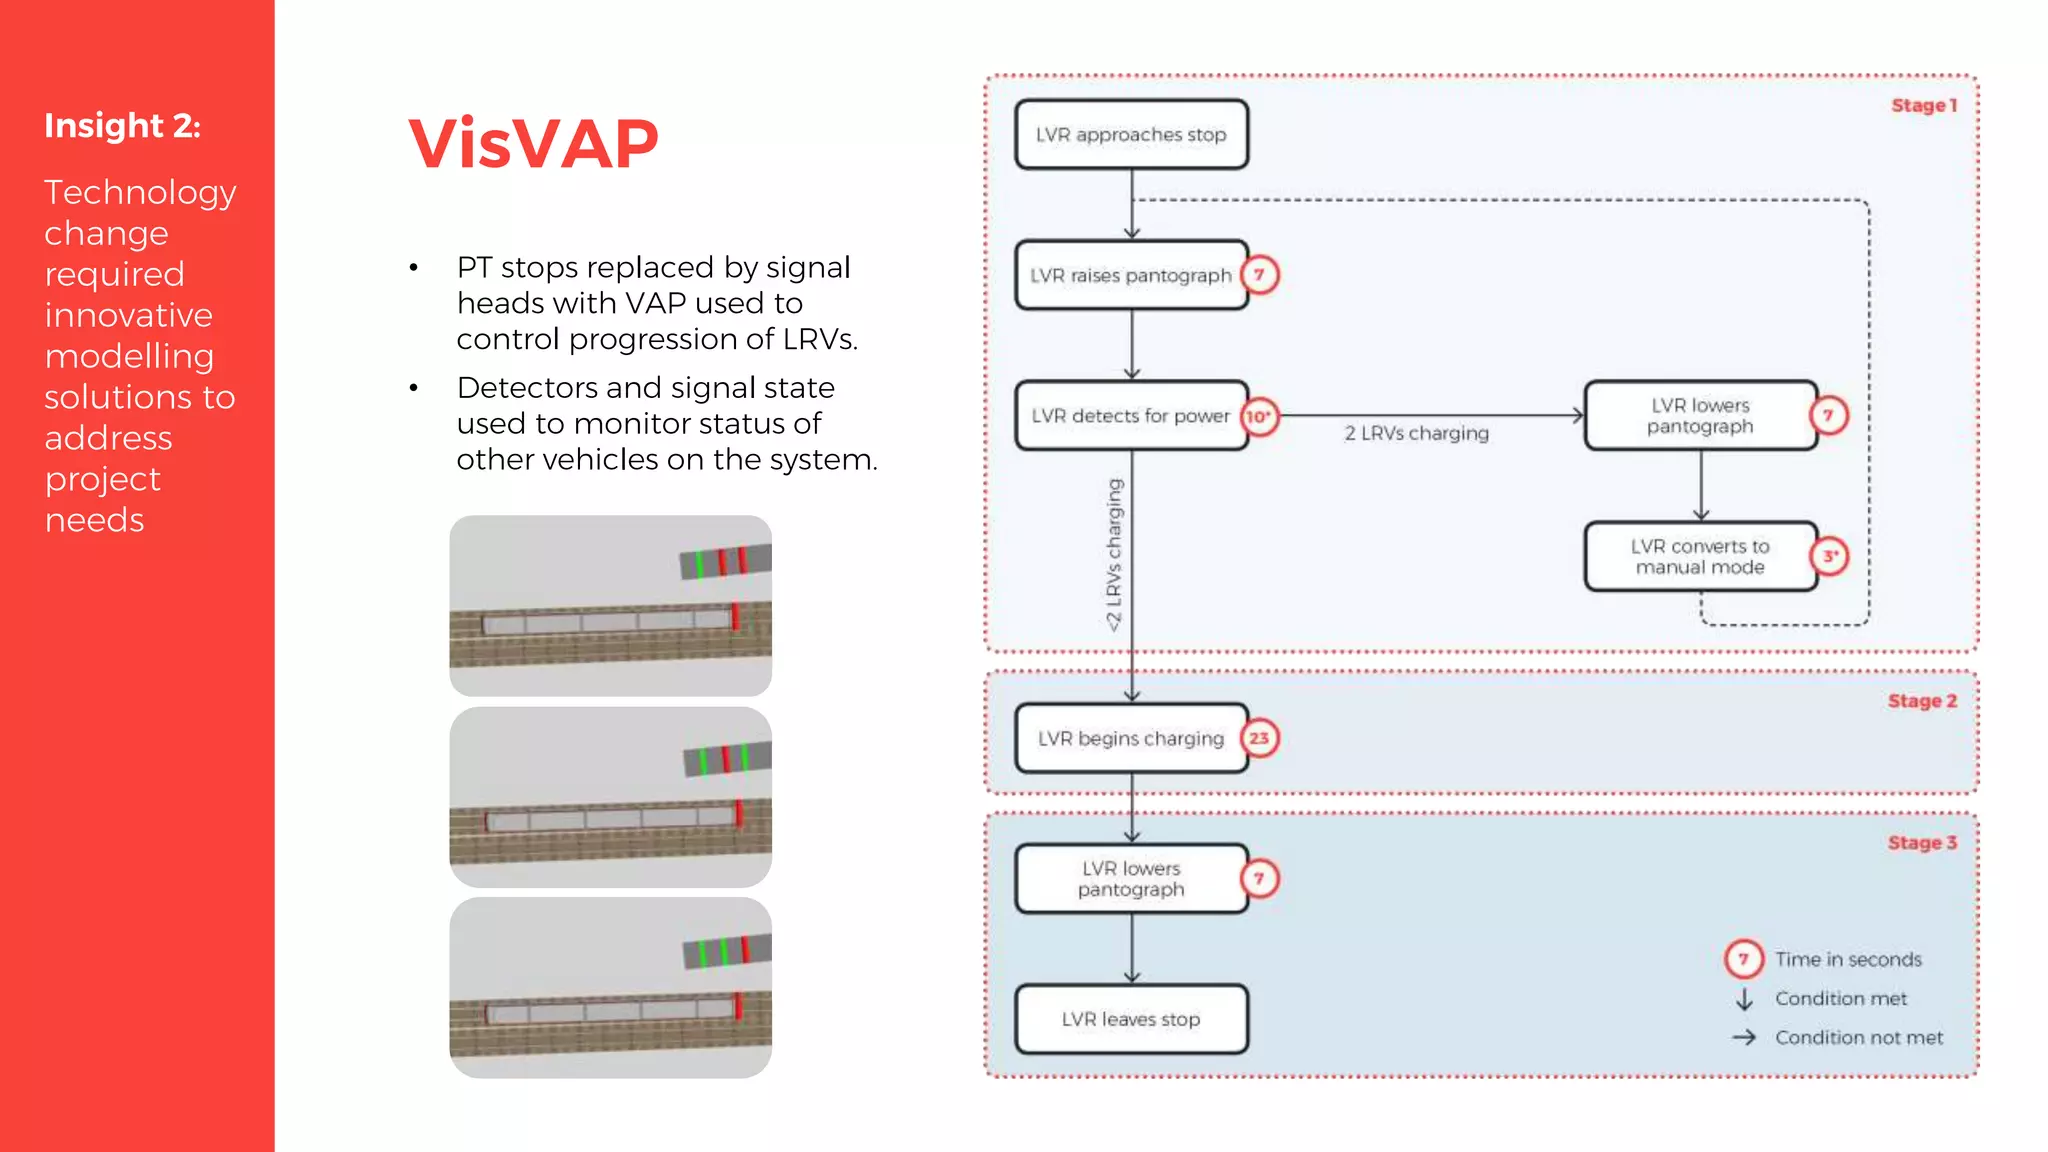
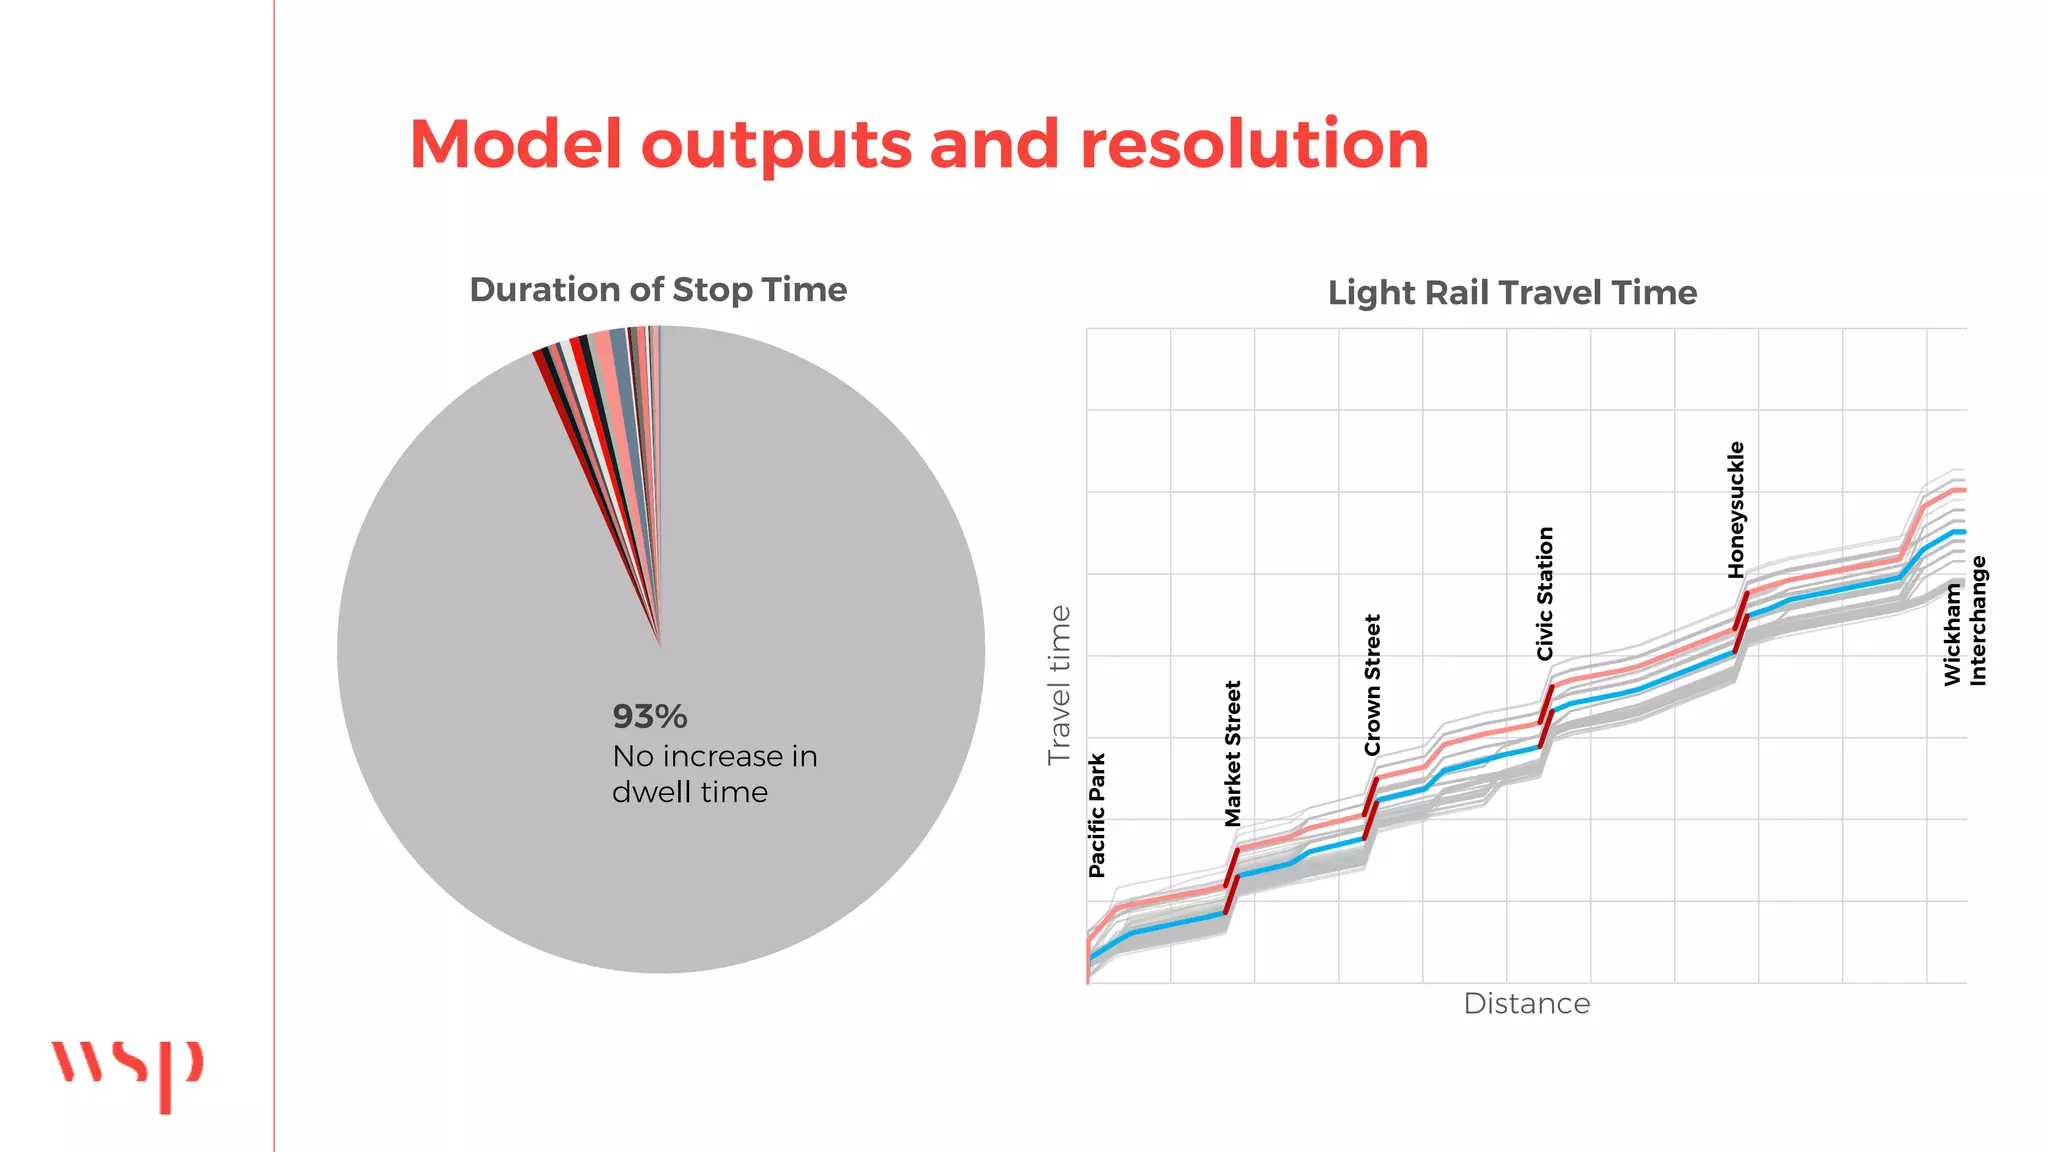
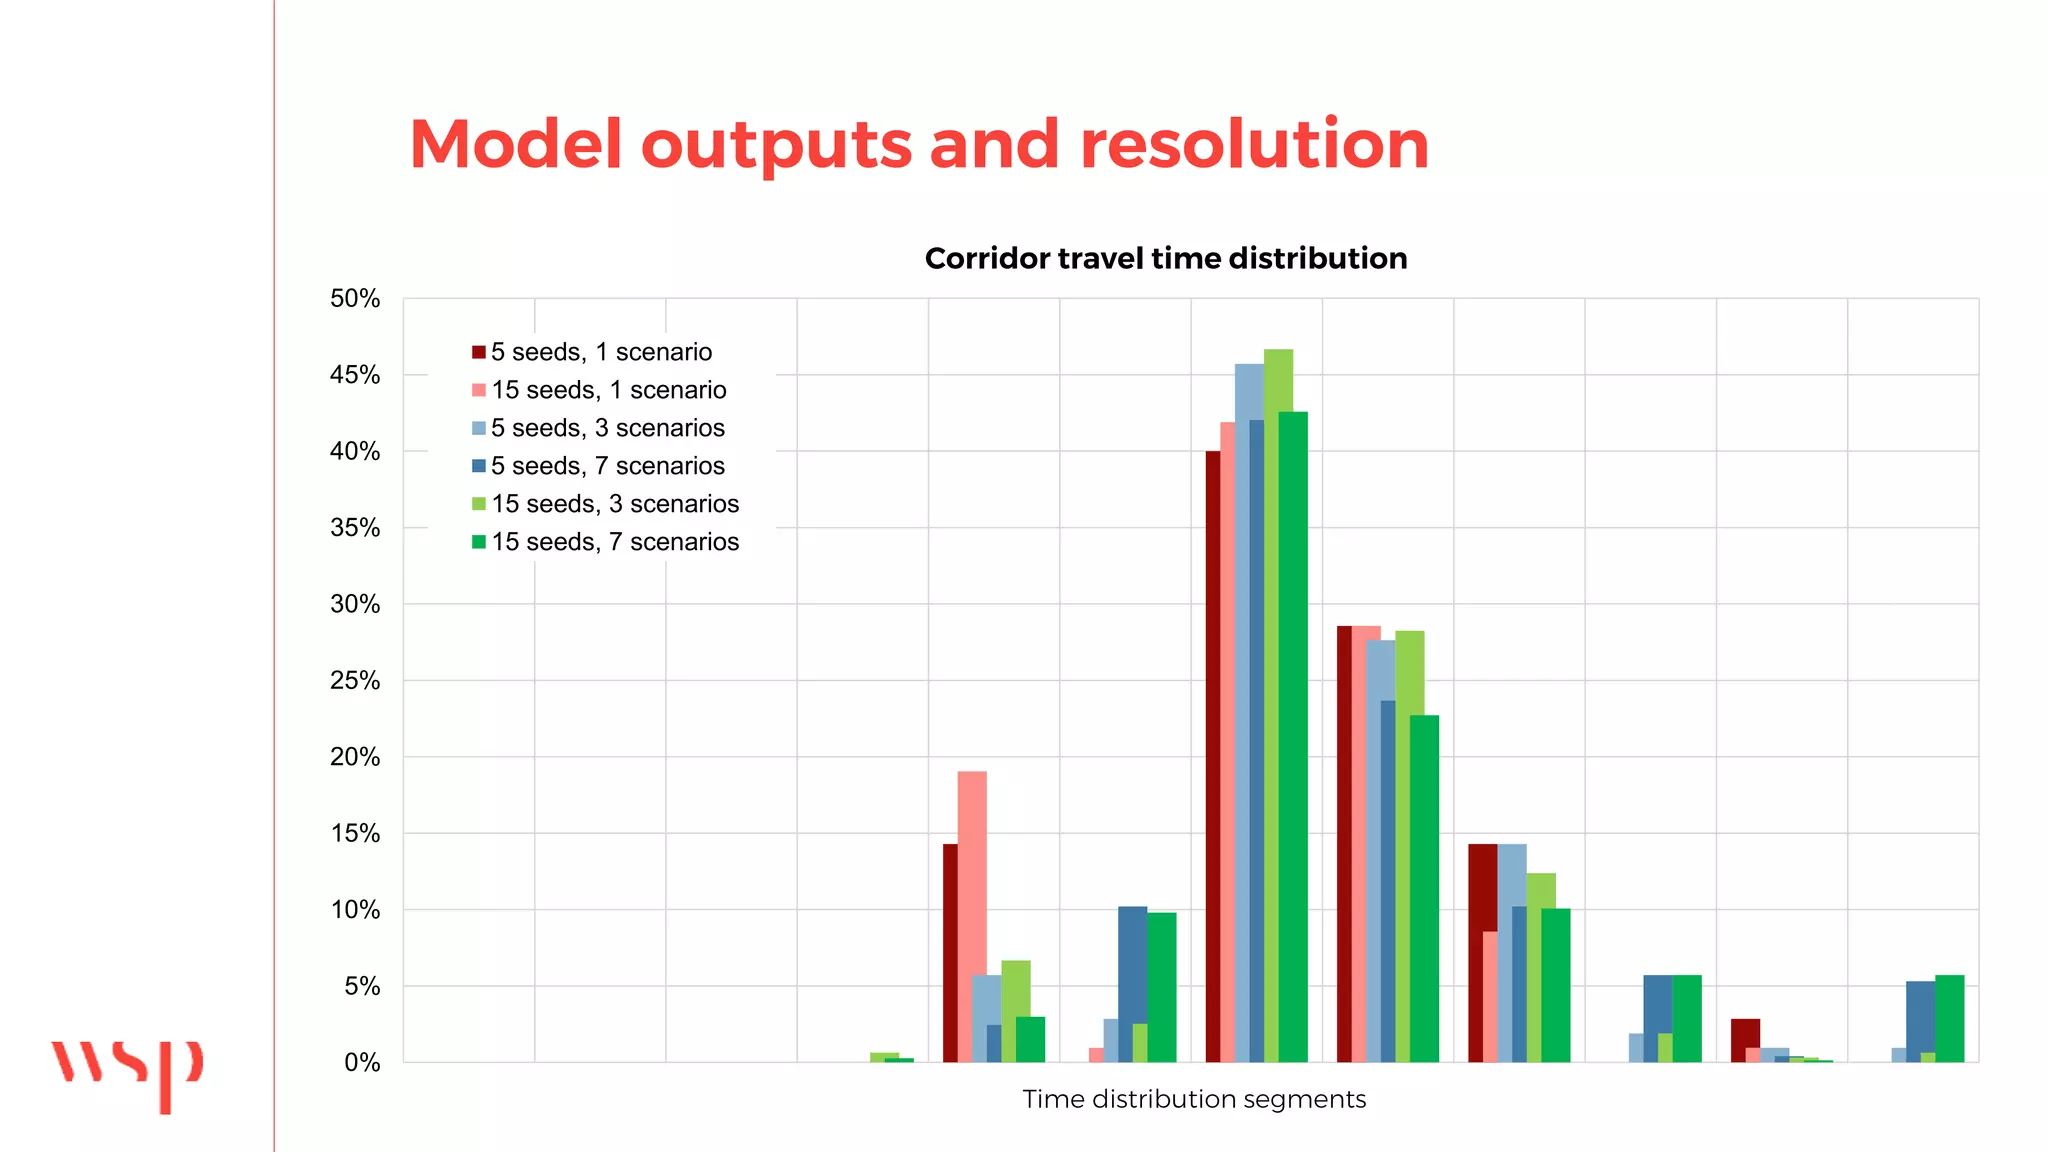
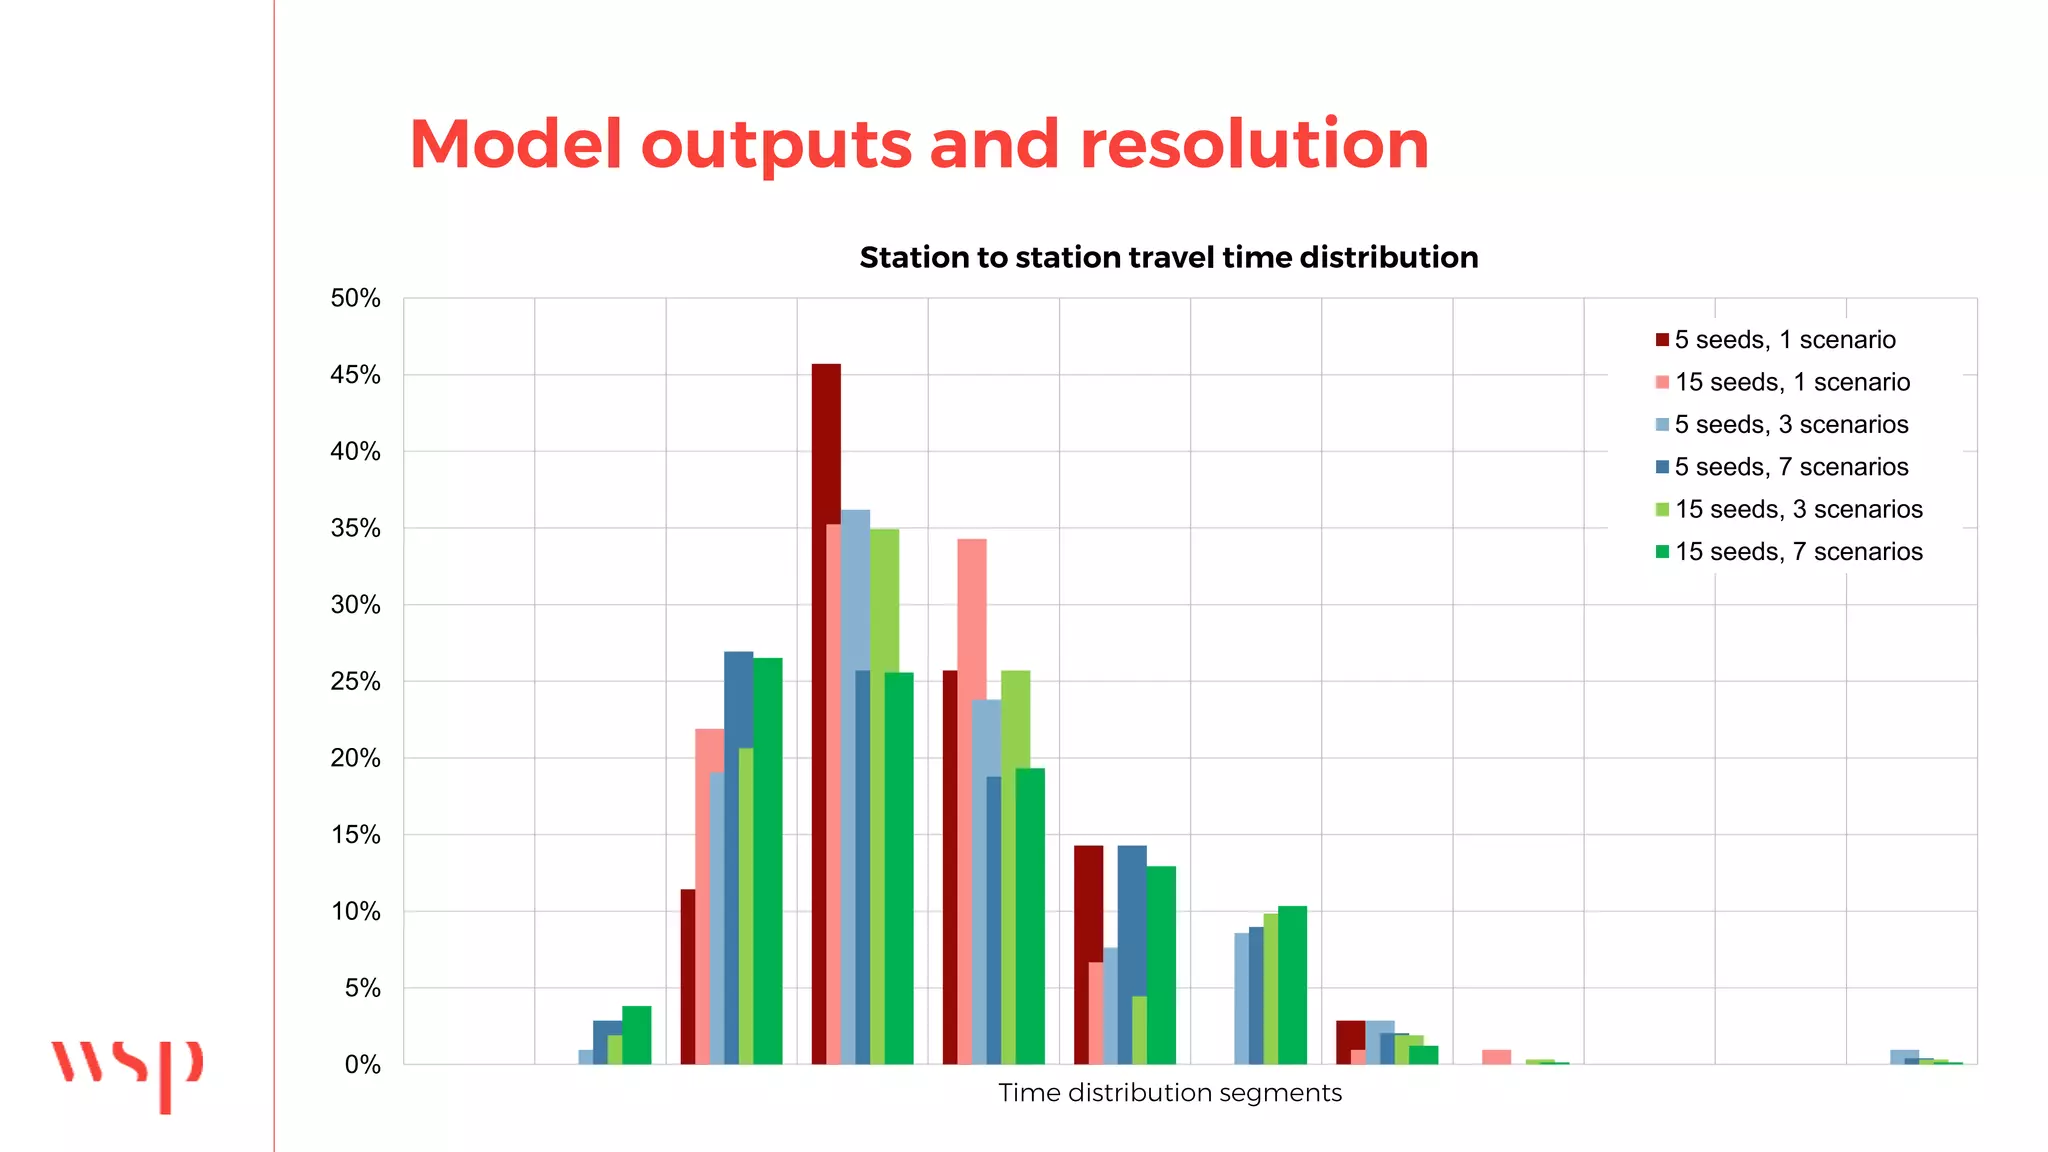
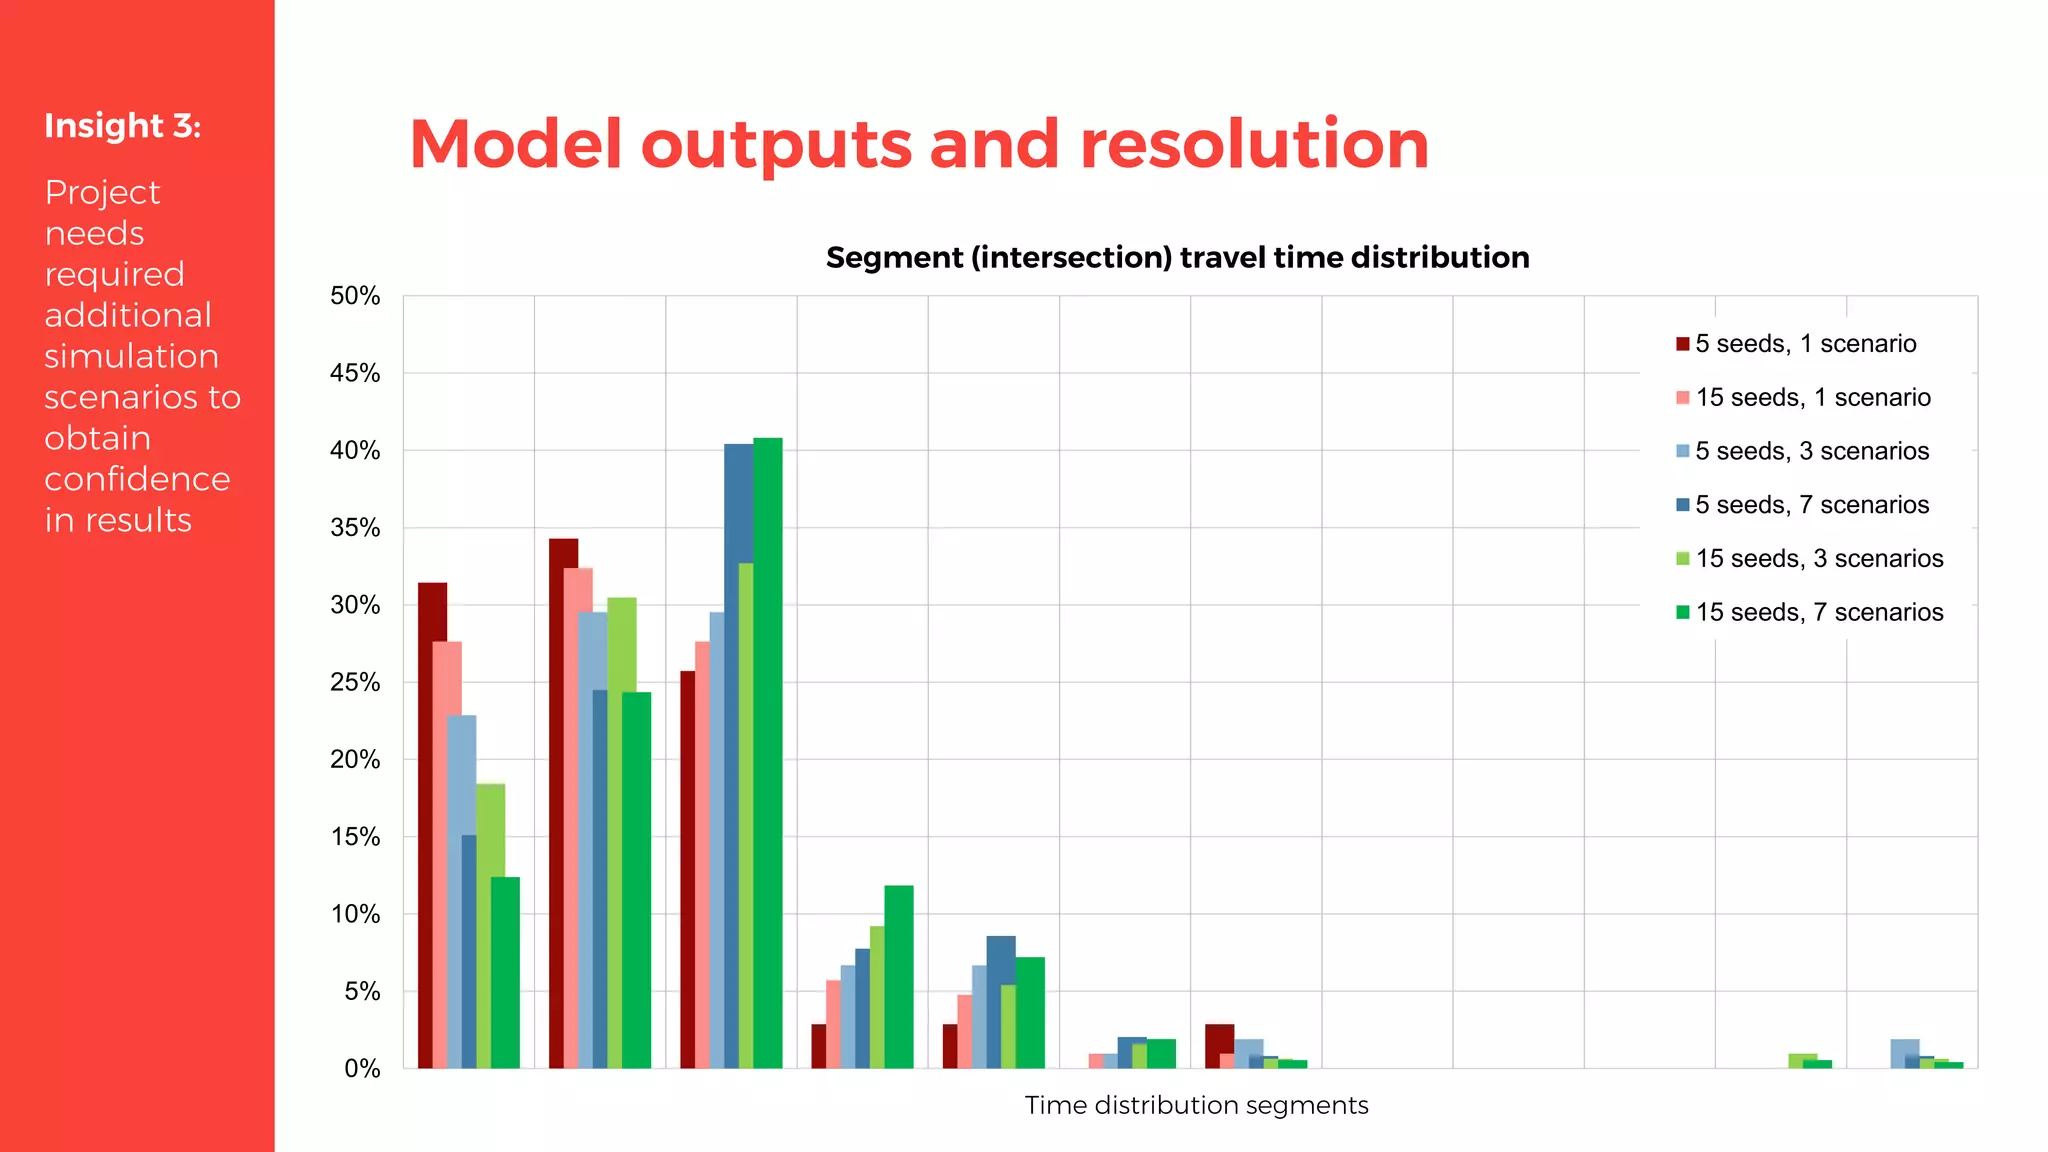
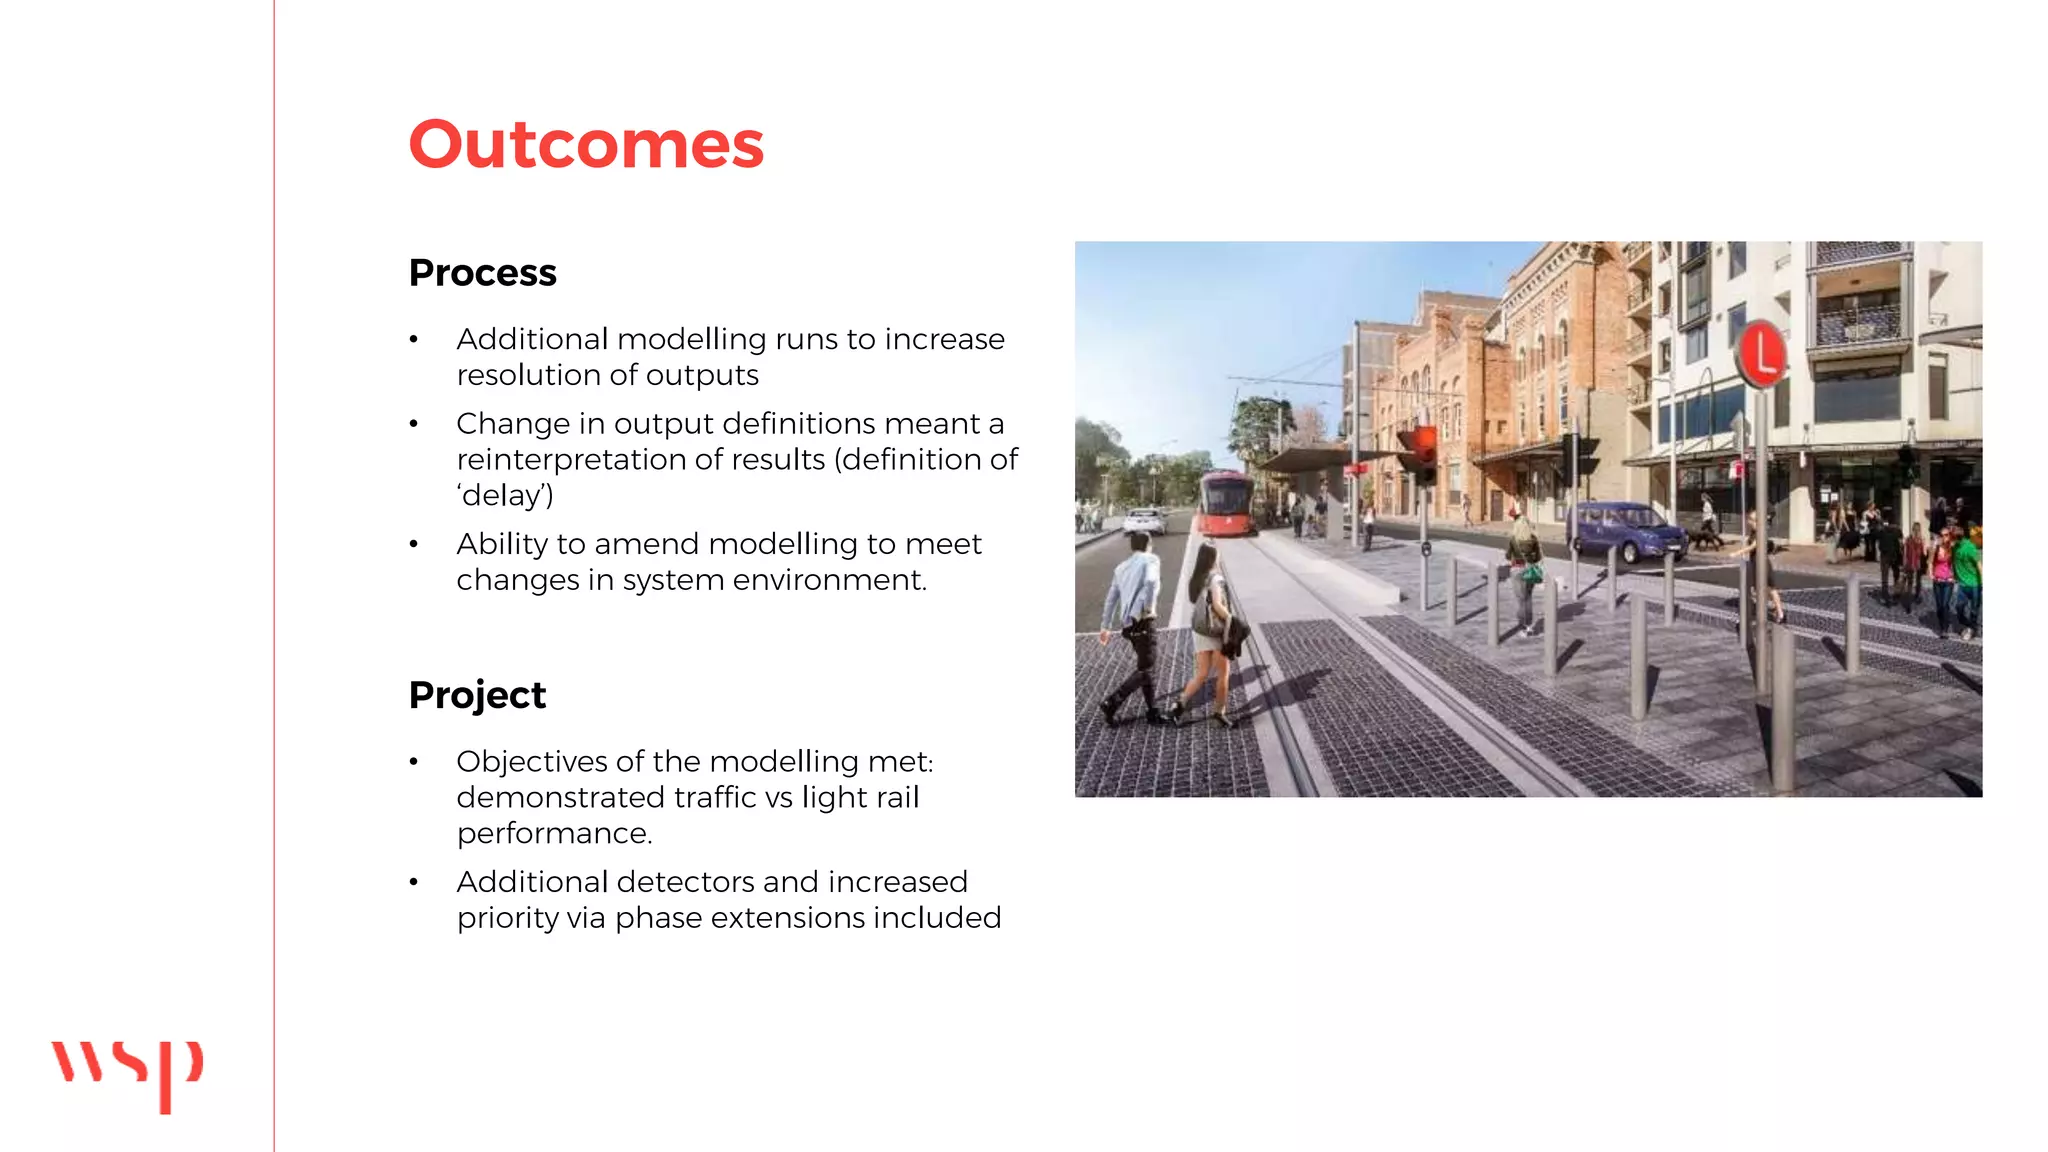
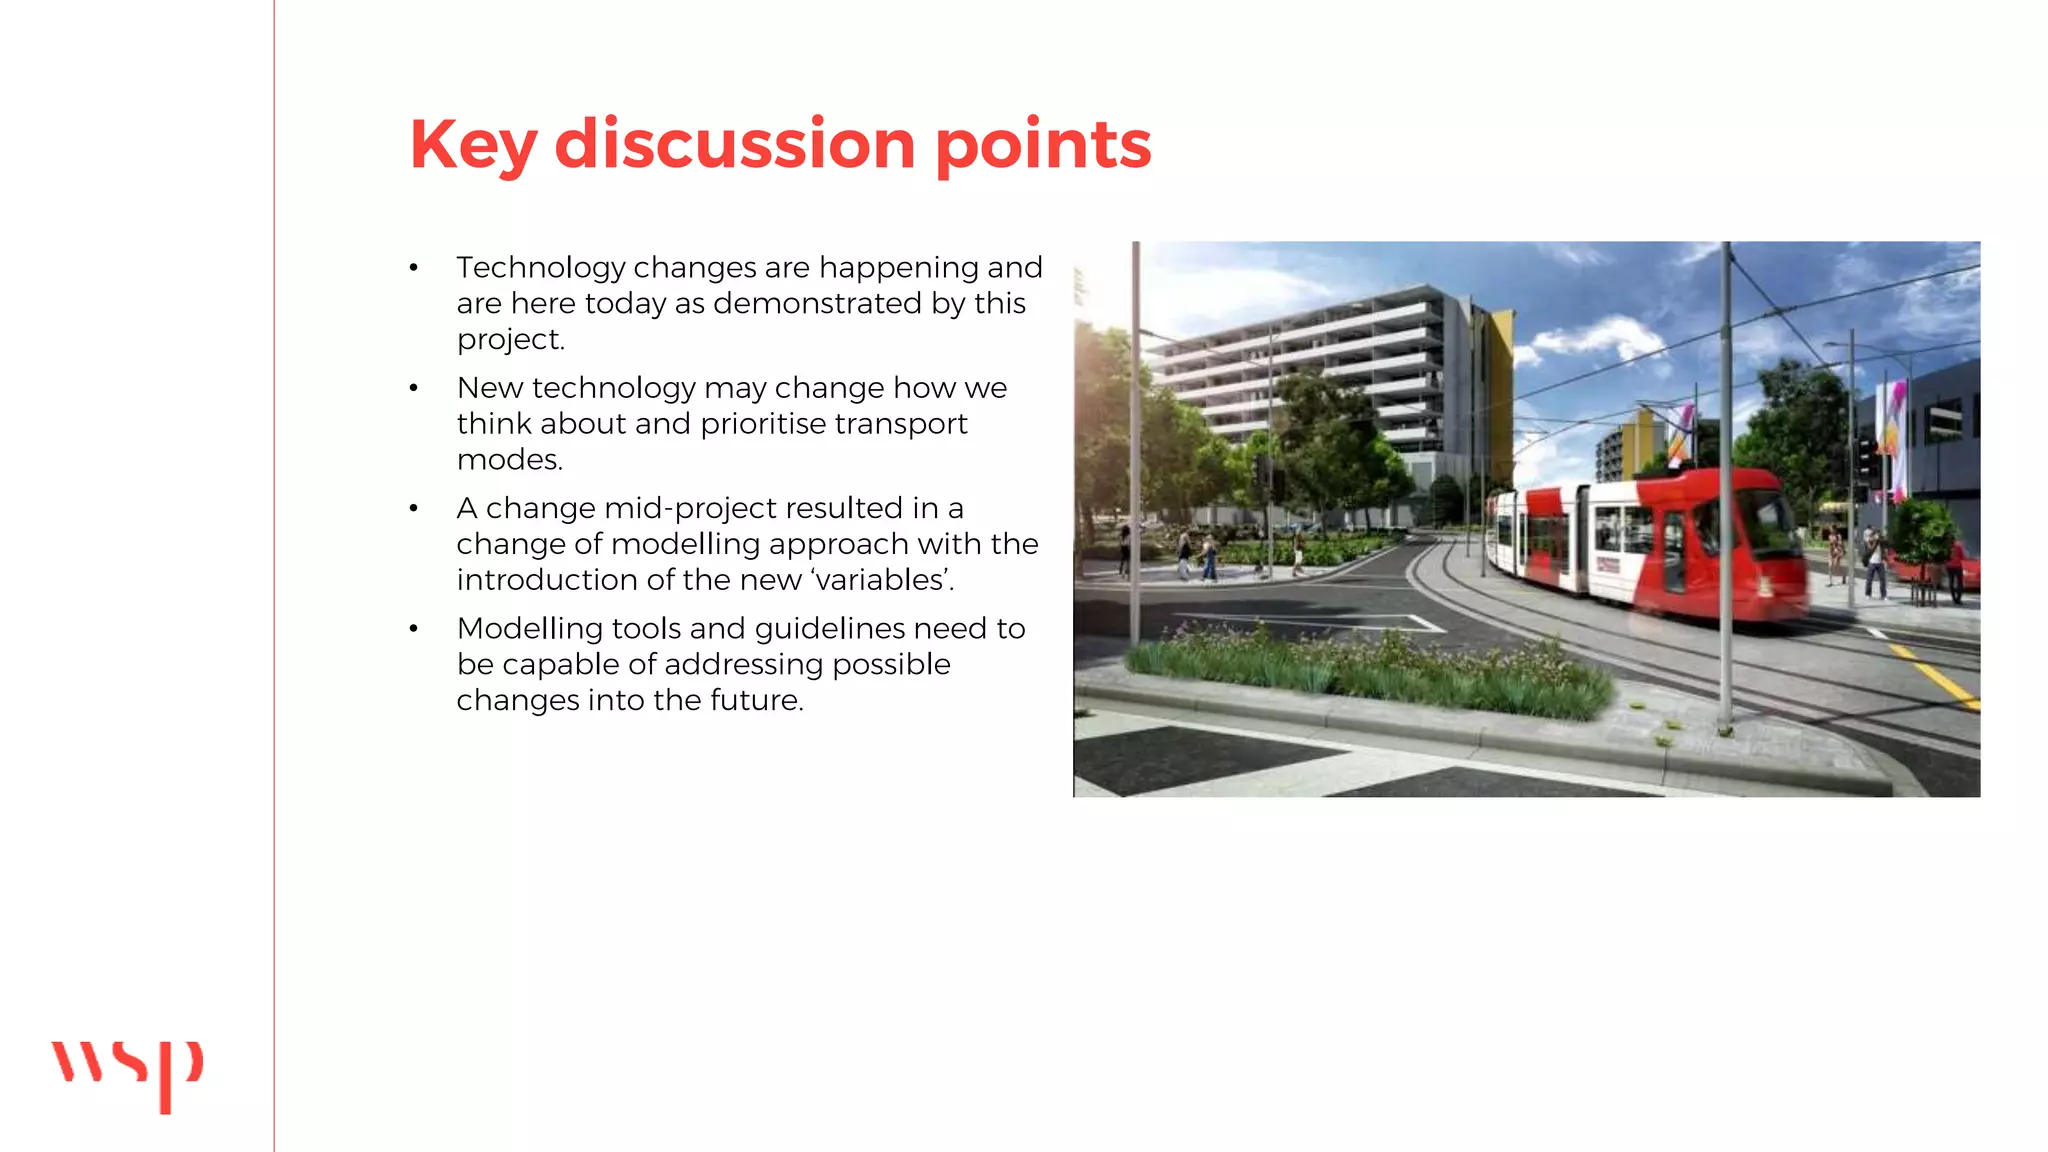
2. Presentation overview
Newcastle Light Rail
How an evolution in technology resulted in
an evolution in the use of our traffic models.
Today Tomorrow The future
4. To Central Coast and Sydney
To Maitland
Newcastle Light Rail
5. Modelling Purpose
Assist geometric design to minimise
impacts to general traffic:
• Performance with project versus without
Demonstrate that light rail project achieved
requirements:
• End to end journey time
• Station to station journey time reliability
10. Problem definition
Increased costs:
Increased fleet requirements
Reduced revenue:
reduced attractiveness of system
Increased
probability of
missing signal phase
Increased light rail
journey time /
reduced reliability
Increased
probability of
charging conflicts
Increased
charging time at
stations
Insight 1:
Light rail
priority and
progression
important
for factors
beyond
customer
experience
13. VisVAP
• PT stops replaced by signal
heads with VAP used to
control progression of LRVs.
• Detectors and signal state
used to monitor status of
other vehicles on the system.
Insight 2:
Technology
change
required
innovative
modelling
solutions to
address
project
needs
14. Model outputs and resolution
93%
Duration of Stop Time
Traveltime
Distance
Light Rail Travel Time
CrownStreet
CivicStation
Honeysuckle
Wickham
Interchange
MarketStreet
PacificPark
No increase in
dwell time
15. Model outputs and resolution
0%
5%
10%
15%
20%
25%
30%
35%
40%
45%
50%
Time distribution segments
Corridor travel time distribution
5 seeds, 1 scenario
15 seeds, 1 scenario
5 seeds, 3 scenarios
5 seeds, 7 scenarios
15 seeds, 3 scenarios
15 seeds, 7 scenarios
16. Model outputs and resolution
0%
5%
10%
15%
20%
25%
30%
35%
40%
45%
50%
Time distribution segments
Station to station travel time distribution
5 seeds, 1 scenario
15 seeds, 1 scenario
5 seeds, 3 scenarios
5 seeds, 7 scenarios
15 seeds, 3 scenarios
15 seeds, 7 scenarios
17. Model outputs and resolutionInsight 3:
Project
needs
required
additional
simulation
scenarios to
obtain
confidence
in results
0%
5%
10%
15%
20%
25%
30%
35%
40%
45%
50%
Time distribution segments
Segment (intersection) travel time distribution
5 seeds, 1 scenario
15 seeds, 1 scenario
5 seeds, 3 scenarios
5 seeds, 7 scenarios
15 seeds, 3 scenarios
15 seeds, 7 scenarios
18. Outcomes
Process
• Additional modelling runs to increase
resolution of outputs
• Change in output definitions meant a
reinterpretation of results (definition of
‘delay’)
• Ability to amend modelling to meet
changes in system environment.
Project
• Objectives of the modelling met:
demonstrated traffic vs light rail
performance.
• Additional detectors and increased
priority via phase extensions included
19. Key discussion points
• Technology changes are happening and
are here today as demonstrated by this
project.
• New technology may change how we
think about and prioritise transport
modes.
• A change mid-project resulted in a
change of modelling approach with the
introduction of the new ‘variables’.
• Modelling tools and guidelines need to
be capable of addressing possible
changes into the future.
21. Find us at the
WSP coffee cart
Perth
Level 5
503 Murray Street
Perth, WA
6000
Sydney
Level 27
680 George Street
Sydney, NSW
2000
Melbourne
Level 15
28 Freshwater Place
Southbank, VIC
3006
Callan Stirzaker
Brisbane | Sunshine Coast
Adelaide
Level 1
1 King William Street
Adelaide, SA
5000
Brisbane
Level 3
69 Ann Street
Brisbane
4000
Canberra
Level 1
121 Marcus Clarke Street
Canberra, ACT
2600
callan [dot] stirzaker [at] wsp [dot] com
callanstirzaker
Editor's Notes
The purpose of the presentation today is to talk about a recent experience in modelling Newcastle Light Rail. In particular, the project has adopted a new technology (on board batteries), which has had a impact on the way in which we undertook the traffic modelling of the system. I would like to talk about our experiences and use it as a basis for consideration of how future changes will affect how we undertake modelling in the future.
Acknowledgement of John and Troy during this slide.
Before I do this, however I wanted to share a few photos of Newcastle, and perhaps dispel a few myths about this city. Newcastle isn’t a location which is regularly featured in AITPM presentations and for those of you in the room today from Perth, it may not be the number 1 place to visit on the East Coast.
My wife and I lived in Newcastle for a year and the city is a vibrant coastal city with beautiful beaches, wonderful restaurants and many attractions nearby: including the Hunter Valley and Port Stephens.
A brief overview of Newcastle Light Rail:
The project is a 2.7km system in the heart of the city.
It some respects it has replaced the existing heavy rail line, but it has also resulted in a change to the city bus network with a new Newcastle Transport Interchange at the western end of the line.
There are plans for future expansions of the system.
The modelling purpose put simply was to undertake two activities:
To assist in the geometric design of the road and rail systems such that impacts to traffic were minimised. This was achieved by evaluation the ‘with’ versus ‘without’ case.
To demonstrate that the proposed light rail system would meet customer centred performance requirements around travel time.
A little bit more detail about the project:
2.7km system
6 stations
Bus and heavy rail interchange at the western end of the system.
Built within ‘city centre’ – with heavy pedestrian activity near many stops and around vibrant local areas such as Darby Street, Newcastle University, Honeysuckle Wharf and Hunter Street Mall.
!!I am having difficulties getting this slide to work/animate.!!
Range:
Mean range = 15 second (2%)
Median range = 1 second (<1%)
Std. Dev = 13 seconds (2%)
98th percentile = 1min 40seconds (16%)
Max = 60 seconds (9%)
Range:
Mean range = 12 second (11%)
Median range = 2 second (2%)
Std. Dev = 9 seconds (9%)
98th percentile = 28 seconds (25%)
Max = 27 seconds (24%)
Range:
Mean range = 3 second (33%)
Median range = 5 second (52%)
Std. Dev = 2 seconds (20%)
98th percentile = 8 seconds (80%)
Max = 25 seconds (270%)
More simulations doesn’t necessarily mean more seed values, but scenarios which represent potential variation in the system.
Technology changes are happening and are here today. This is a good example of how a change in technology may change transport models into the future.
A change mid-project resulted in a change of modelling approach with the introduction of new ‘variables’:
number of simulations required.
outputs from models changed (definition of ‘delay’).
Modelling tools and guidelines need to be capable of considering these changes:
Existing modelling tools were capable of simulating change, utilising existing features, however, these were considered ‘work-around’.
New functions to modelling tools may be necessary in the future.