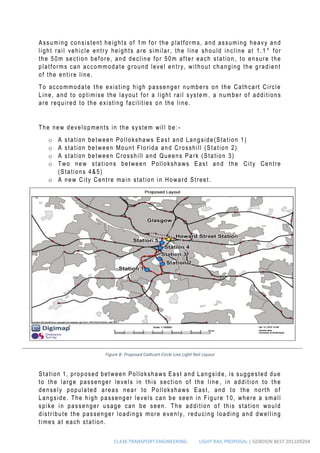
This document proposes a light rail system to replace the existing heavy rail Cathcart Circle network in Glasgow. Key points of the proposal include:
- Adding 5 new stations to improve accessibility and distribute passenger load more evenly across stations experiencing high usage.
- Converting to light rail will increase line capacity through more frequent trips facilitated by the faster acceleration/braking of light rail vehicles compared to heavy rail.
- Accessibility for all passengers, including disabled users, will be improved through ground-level boarding enabled by light rail vehicle design.
- Stations are well-located along the route but some sections would benefit from an additional station to service densely populated nearby areas.

![CL436 TRANSPORT ENGINEERING LIGHT RAIL PROPOSAL | GORDON BEST 201109204
The project is cost effective, and extremely successful in improving the
network to deliver the following benefits:
Increased line capacity
Reduced strain on Glasgow Central Station capacity
Improved accessibility to residents of the South Side of Glasgow
Social and environmental benefits from reducing diesel based emissions
4.1- References
1. Does Light Rail Really Encourage People to Stop Driving? - CityLab.
2015. Does Light Rail Really Encourage People to Stop Driving? - City
Lab. [ONLINE] Available at:
http://www.citylab.com/commute/2013/02/does -light-rail-encourage-
people-stop-driving/4800/. [Accessed 13 April 2015].
2. Technical Specifications [ONLINE] Available at:
https://www.eversholtrail.co.uk/upload/class -380.pdf. [Accessed 08
April 2015].
3. CAF URBOS 3 TECHNICAL SPECIFICATIONS . 2015 [ONLINE] Available
at:
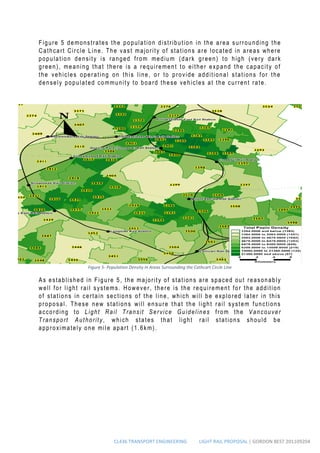
http://www.modernstreetcar.org/pdf/APTA%20Streetcar%20Carbuilder%
20Survey%20Rev%20130117%20Draft%20CAF%20Urbos%20100%25%2
0LF.pdf. [Accessed 08 April 2015].
4. International Service Guidelines. [ONLINE] Available at:
http://nacto.org/docs/usdg/lrtserviceguidelines_vta. pdf.
[Accessed 10 April 2015].
5. Improving public transport in England through light rail - National Audit
Office (NAO). 2015. Improving public transport in England through light
rail - National Audit Office (NAO). [ONLINE] Available at:
http://www.nao.org.uk/report/improving -public-transport-in-england-
through-light-rail/#. [Accessed 27 February 2015].
6. All Aboard for Light Rail - Railway Technology. 2015. All Aboard for
Light Rail - Railway Technology. [ONLINE] Available
at: http://www.railway-technology.com/features/feature125693/ .
[Accessed 27 February 2015].
7. Karlsruhe Light/Heavy Rail - Railway Technology. 2015. Karlsruhe
Light/Heavy Rail – Railway Technology. [ONLINE] Available at:
http://www.railway-technology.com/projects/karlsruhe/ . [Accessed 24
April 2015].](https://image.slidesharecdn.com/53d11054-fe68-4a68-a206-b6c9226c8d36-150428070734-conversion-gate02/85/CL436-Transport-Planning-Final-Submission-19-320.jpg)
![CL436 TRANSPORT ENGINEERING LIGHT RAIL PROPOSAL | GORDON BEST 201109204
8. Guidance Notes. 2015. Guidance Notes. [ONLINE] Available
at:http://www.uktram.co.uk/Pages/GuidanceNotes.aspx . [Accessed 27
February 2015].
9. Accessibility: Bus and Light Rail - Policies. 2015. Accessibility: Bus and
Light Rail - Policies. [ONLINE] Available at: http://www.vta.org/getting -
around/paratransit/accessibility -bus-and-light-rail-policies. [Accessed
27 February 2015].
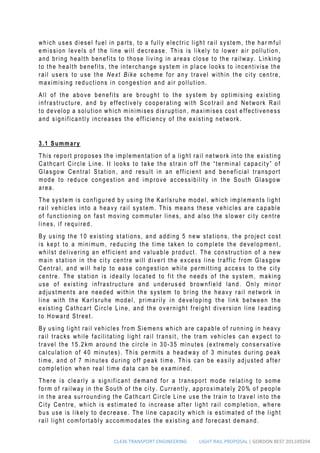
5.1 Appendices
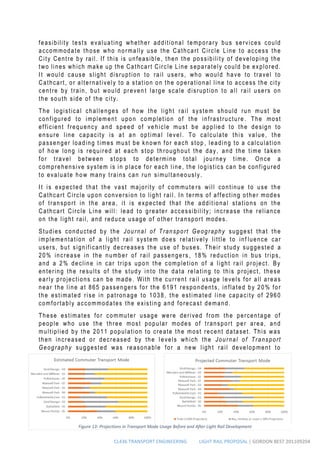
Appendix 1- Commuting Figures- Transport Mode Breakdown
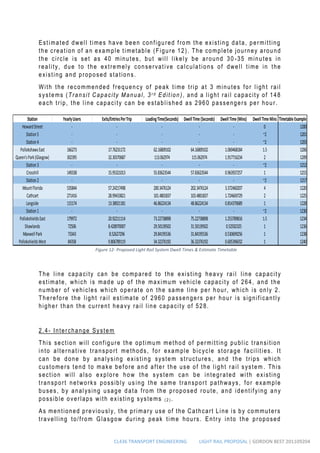
Appendix 2- Light Rail Trip Detail
Appendix 3- Station Annual Footfall
Name Work or study mainly at or from homeUnderground, metro, light rail or tramTrain Bus, minibus or coachTaxi or minicabDriving a car or vanPassenger in a car or vanMotorcycle, scooter or mopedBicycle On foot Other
Cathcart 11.67701863 1.242236 9.192546584 22.98137 0.372671 33.41615 4.347826 0 1.987578 13.78882 0.993789
Langside 16.89655172 1.551724 11.89655172 12.75862 0.344828 27.24138 9.482759 0.344828 2.758621 16.37931 0.344828
Pollokshaws East 14.31578947 0.631579 11.78947368 26.52632 0.631579 22.10526 2.736842 0 3.157895 17.05263 1.052632
Shawlands 15.91962906 1.236476 11.12828439 5.564142 0.15456 43.27666 13.7558 0 1.081917 6.800618 1.081917
Maxwell Park 14.09395973 1.342282 16.77852349 4.362416 0.503356 40.77181 8.389262 0 1.677852 11.24161 0.838926
Pollokshaws West 12.34567901 1.028807 17.0781893 8.230453 0.411523 34.97942 6.17284 0.205761 3.08642 16.46091 0
Pollokshaws East 10.43613707 0 13.08411215 17.44548 0.46729 35.98131 6.386293 0.155763 2.024922 13.08411 0.934579
Queens Park 9.756097561 0.187617 13.32082552 7.879925 0.375235 41.65103 11.25704 0 2.251407 13.13321 0.187617
Crosshill 7.294117647 0.705882 19.76470588 12.70588 0.235294 41.41176 4.470588 0 0.941176 12 0.470588
Mount Florida 7.956318253 0.780031 24.49297972 15.44462 0.312012 27.4571 4.524181 0 2.4961 15.60062 0.936037
Regime Time in Regime (s) Distance in Regime (m)
Acceleration 12.72727273 445.4545455
Constant Speed 22.85714286 709.0909091
Deceleration 12.72727273 445.4545455
48.31168831 1600
Dwell Time 0
Station Name Passenger Numbers Per Year
Glasgow Central 27152622
Pollokshaws East 166273
Pollokshaws West 134624
Maxwell Park 146686
Shawlands 145012
Pollokshaws East 332546
Langside 230348
Cathcart 542832
Mount Florida 1071688
Crosshill 298676
Queens Park 604790
Glasgow Central 27152622](https://image.slidesharecdn.com/53d11054-fe68-4a68-a206-b6c9226c8d36-150428070734-conversion-gate02/85/CL436-Transport-Planning-Final-Submission-20-320.jpg)


