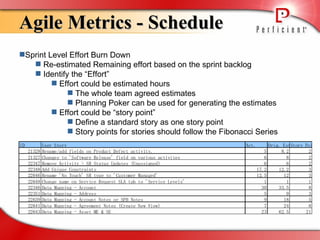
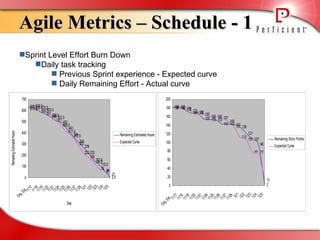
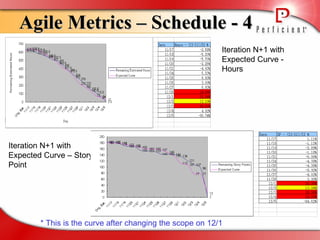
To Know More About Project  Agile Metrics Agile Metrics May 16 th , 2009 Sam Tong
Agenda Traditional Metrics Agile Metrics measuring the Schedule Agile Metrics measuring the Productivity Agile Metrics measuring the Quality Q&A
Traditional Metrics Schedule Plan Variation based on Milestones Quality Defect Density based on Integration/System testing/UAT Document Defect Density based on Reviews Productivity KLOC / staff-day
Agile Metrics - Schedule Sprint Level Effort Burn Down Re-estimated Remaining effort based on the sprint backlog Identify the “Effort” Effort could be estimated hours The whole team agreed estimates Planning Poker can be used for generating the estimates Effort could be “story point” Define a standard story as one story point Story points for stories should follow the Fibonacci Series
Agile Metrics – Schedule  - 1 Sprint Level Effort Burn Down Daily task tracking Previous Sprint experience - Expected curve Daily Remaining Effort - Actual curve
Agile Metrics – Schedule  - 2  Sprint Level Effort Burn Down How’s the data collected, analyzed, and used Collecting data: XPlanner, JIRA, RedMine, Green Hoper We had much experience using the  XPlanner  (Iteration, Story, Task Tracking, Burn Down Chart functionality provided) RedMine  is still developing (Gantt View, Calendar View, Task tracking) JIRA  (Issue tracking system, can also be used as Task Tracking system) Green Hoper  (JIRA plug-in - Online Task planning tool, Task tracking) Use  database (SQL) tool  to extract data from the tracking system
Agile Metrics – Schedule  - 3  Sprint Level Effort Burn Down How’s the data collected, analyzed, and used Analyze the data: Burn Down Chart Use the data Expected curve Are we on track? Know when to take actions (20% Variation is the trigger)
Agile Metrics – Schedule  - 4  Iteration N Burn Down – Story Point Iteration N Burn Down - Hours
Agile Metrics – Schedule  - 4  Iteration N+1 with Expected Curve - Hours Iteration N+1 with Expected Curve – Story Point * This is the curve without any change on the scope during the iteration
Agile Metrics – Schedule  - 4  Iteration N+1 with Expected Curve - Hours Iteration N+1 with Expected Curve – Story Point * This is the curve after changing the scope on 12/1
Agile Metrics –  Project  Schedule Project Burn Down Remaining effort based on the project backlog Identify the “Effort” Effort could be estimated hours Effort could be “story points” Sprint basis tracking Planned burn down Actual burn down How’s the data collected, analyzed, and used Are we on track Need to identify the indicator (20% Variation)
Agile Metrics –  Project  Schedule  2 Iteration Release Plan is the planned curve
Agile Metrics -  Quality Our Understanding Client does not necessarily want to know the defect density, but the working product Quality metric is not only the way to measure the delivery, but also it’s the way to find possible improvements during the project.  - The topic that should be included in the retrospective meeting Defect is only regarding the working product Metrics definition   # defects per sprint # defects per story point  # defects per hour How’s the data collected, analyzed, and used
Sample data and analysis
Agile Metrics - Productivity Our Understanding: We do not focus on #KLOC that the team can produce We want to know how many features/ user stories that the team can finish in a fixed time box Metrics Definition # story points per sprint  # story points per staff-sprint # estimated hours per sprint # estimated hours per staff-sprint How’s the data collected, analyzed, and used
Sample data & Analysis 5% Variation is the trigger for detail analysis for the dropping or improvement of the productivity in retrospective meeting
Q&A

Agile Metrics

  • 1.
    To Know MoreAbout Project Agile Metrics Agile Metrics May 16 th , 2009 Sam Tong
  • 2.
    Agenda Traditional MetricsAgile Metrics measuring the Schedule Agile Metrics measuring the Productivity Agile Metrics measuring the Quality Q&A
  • 3.
    Traditional Metrics SchedulePlan Variation based on Milestones Quality Defect Density based on Integration/System testing/UAT Document Defect Density based on Reviews Productivity KLOC / staff-day
  • 4.
    Agile Metrics -Schedule Sprint Level Effort Burn Down Re-estimated Remaining effort based on the sprint backlog Identify the “Effort” Effort could be estimated hours The whole team agreed estimates Planning Poker can be used for generating the estimates Effort could be “story point” Define a standard story as one story point Story points for stories should follow the Fibonacci Series
  • 5.
    Agile Metrics –Schedule - 1 Sprint Level Effort Burn Down Daily task tracking Previous Sprint experience - Expected curve Daily Remaining Effort - Actual curve
  • 6.
    Agile Metrics –Schedule - 2 Sprint Level Effort Burn Down How’s the data collected, analyzed, and used Collecting data: XPlanner, JIRA, RedMine, Green Hoper We had much experience using the XPlanner (Iteration, Story, Task Tracking, Burn Down Chart functionality provided) RedMine is still developing (Gantt View, Calendar View, Task tracking) JIRA (Issue tracking system, can also be used as Task Tracking system) Green Hoper (JIRA plug-in - Online Task planning tool, Task tracking) Use database (SQL) tool to extract data from the tracking system
  • 7.
    Agile Metrics –Schedule - 3 Sprint Level Effort Burn Down How’s the data collected, analyzed, and used Analyze the data: Burn Down Chart Use the data Expected curve Are we on track? Know when to take actions (20% Variation is the trigger)
  • 8.
    Agile Metrics –Schedule - 4 Iteration N Burn Down – Story Point Iteration N Burn Down - Hours
  • 9.
    Agile Metrics –Schedule - 4 Iteration N+1 with Expected Curve - Hours Iteration N+1 with Expected Curve – Story Point * This is the curve without any change on the scope during the iteration
  • 10.
    Agile Metrics –Schedule - 4 Iteration N+1 with Expected Curve - Hours Iteration N+1 with Expected Curve – Story Point * This is the curve after changing the scope on 12/1
  • 11.
    Agile Metrics – Project Schedule Project Burn Down Remaining effort based on the project backlog Identify the “Effort” Effort could be estimated hours Effort could be “story points” Sprint basis tracking Planned burn down Actual burn down How’s the data collected, analyzed, and used Are we on track Need to identify the indicator (20% Variation)
  • 12.
    Agile Metrics – Project Schedule 2 Iteration Release Plan is the planned curve
  • 13.
    Agile Metrics - Quality Our Understanding Client does not necessarily want to know the defect density, but the working product Quality metric is not only the way to measure the delivery, but also it’s the way to find possible improvements during the project. - The topic that should be included in the retrospective meeting Defect is only regarding the working product Metrics definition # defects per sprint # defects per story point # defects per hour How’s the data collected, analyzed, and used
  • 14.
  • 15.
    Agile Metrics -Productivity Our Understanding: We do not focus on #KLOC that the team can produce We want to know how many features/ user stories that the team can finish in a fixed time box Metrics Definition # story points per sprint # story points per staff-sprint # estimated hours per sprint # estimated hours per staff-sprint How’s the data collected, analyzed, and used
  • 16.
    Sample data &Analysis 5% Variation is the trigger for detail analysis for the dropping or improvement of the productivity in retrospective meeting
  • 17.