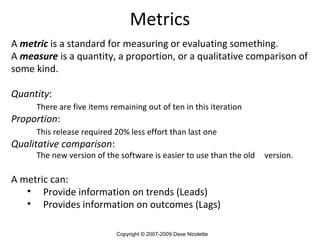
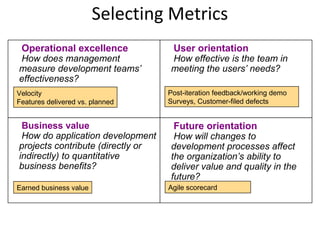
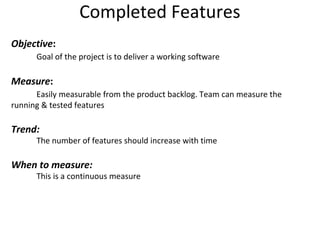
This document discusses various metrics that can be used to measure performance on agile projects. It describes metrics in three main categories: work progress metrics like completed features and velocity, value metrics like financial value and earned business value, and process metrics like code analysis and test-driven development. Common metrics include the number of features delivered, story points completed per iteration, burn down/up charts, cycle time and test coverage. Metrics should provide information on trends, outcomes, business value, user needs and operational excellence.
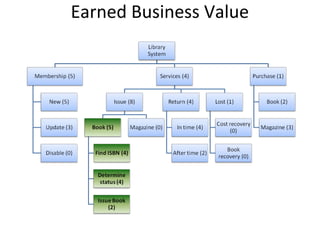
![Earned Business Value Objective : To measure the earned value to business with each delivery Measure : BV of Services Issue Book Issue Book is calculated as: (1/1) * (4/10) * (8/13) * (5/5) * (2/10) ~= 5% BV (bucket) = BV (parent) * [Wt (bucket) / Wt (bucket) + ∑Wt (sibling) ] EBV is the summation of BV of all stories that have been coded and are up and running Trend: A steady or upward trend is desirable When to measure: Post release When the list of stories and features is finalized else BV may change](https://image.slidesharecdn.com/agilemetrics-100316001216-phpapp02/85/Agile-Metrics-10-320.jpg)