AFC Asia Frontier Fund invests in listed equities from Bangladesh, Cambodia, Iraq, Kazakhstan, Kyrgyzstan, Laos, Maldives, Mongolia, Myanmar, Pakistan, Papua New Guinea, Sri Lanka, Uzbekistan and Vietnam.
AFC Asia Frontier Fund: Factsheet as of 31.07.2020Thomas Hugger
The document provides information on the AFC Asia Frontier Fund, an investment fund focused on public equities in emerging Asian frontier markets. Key details include: the fund's monthly subscription and redemption terms, its benchmark index, fund managers and investment manager, available share classes and their fees, fund size and performance since inception in 2012. The summary also includes commentary on the fund's July 2020 performance and positioning at the end of the month.
AFC Asia Frontier Fund Factsheet - May 2017Thomas Hugger
AFC Asia Frontier Fund invests in listed equities of Asian frontier markets like Bangladesh, Cambodia, Iraq, Laos, Maldives, Mongolia, Myanmar, Pakistan, Papua New Guinea, Sri Lanka and Vietnam.
- The document discusses market opportunities in light of current global economic conditions and asset allocation views.
- Key areas discussed include slowing US job growth, low returns requiring defensive positioning, China's bad bank debts limiting stimulus, a structurally weak South African rand, and weakening support from SA consumers.
- The document identifies opportunities in offshore property and bonds, which are highlighted as almost but not quite favorable. It provides analysis to support positive views on offshore assets and cautious views on local South African exposures.
This statistical summary provides an overview of interest rates, equity markets, currencies, metals and crude oil as of April 15, 2013. Key points include:
- 10-year sovereign bond yields fell in the US, Canada, and most European nations but rose in Mexico, Brazil, Portugal and Greece.
- Major stock market indices were down modestly, with the Dow falling 0.08% and S&P 500 down 0.28%. Asian markets also declined around 1.5% on average.
- The US dollar strengthened against most currencies except the Indian rupee and Chinese yuan. Gold and silver prices dropped nearly 4% and 7% respectively.
Over the past 30 years, Australian shares have grown from $10,000 to $331,982, an average annual return of 12.4%, while global shares have grown from $10,000 to $123,883, an average annual return of 8.8%. Regional markets like India, China, and Australia have seen strong growth over the past 10 years, with returns ranging from 3.1% annually for a balanced portfolio to 12.7% for Australian shares. Stock market volatility as measured by one year returns has ranged from -56% to 114% for different markets over the past decade.
Mark Hansen, Head of Asia Governance and Strategic Initiatives, Standard Chartered Bank, talked at London Business School's Asia Business Forum about Asia in 2025 and answered the crucial question: "Will Asia still be relevant in the coming decades?"
The Asia Business Forum is organised by London Business School's Asia club.
Epic research daily commodity report 03rd apr 2017Epic Research
Epic Research contributes in rich returns of traders by depicting with most accurate stock market trading tips. Useful market insights are also offered through daily reports.
The document provides a monthly performance overview for various systematic investment programs and portfolios. In January, the systematic products outperformed despite global market sell-offs. The SAFI2 program returned 7.88% due to increased volatility. The four DAPS portfolios also posted gains compared to their benchmark, with the Defensive DAPS returning 1.32%. Overall, the programs benefited from gains in currencies, interest rates, and commodities, while equity indexes saw losses.
The document is a study of global pension assets from 2016. Some key findings include:
- Global pension assets totaled $35.3 trillion in 2015, a 0.9% decrease from 2014.
- The US, UK and Japan collectively make up over 78% of total pension assets.
- Defined contribution assets have grown faster than defined benefit assets over the last decade, now making up 48.4% of assets in major markets.
- Average asset allocation across major markets is 44% equities, 29% bonds, 24% other assets, and 3% cash.
Defensive investment strategies gained around 1% in August and are up around 4% so far this year. Balanced Income strategies gained 1.7% in August and have the strongest performance so far in 2022, up around 7%. Current portfolio positioning favors U.S. over international equities, emphasizes mortgage-backed securities and credit in fixed income, and includes allocations to absolute return and real asset strategies.
The document summarizes Callan's 2017 10-year capital market projections. Key points include:
- Broad U.S. equity is projected to return 6.85% annually with a standard deviation of 18.25%.
- U.S. fixed income is expected to return 3% annually with less risk (standard deviation of 3.2%) as yields rise gradually.
- Real estate is projected to return 5.75% annually with a standard deviation of 9.15%, reflecting declining cap rates.
The document provides an executive summary and key findings from the Global Pension Assets Study 2016. It finds that total global pension assets decreased slightly in 2015 to $35.4 trillion. The US, UK, and Japan collectively account for over 78% of total assets. Defined contribution plans now represent 48% of assets in the seven largest pension markets, reflecting a trend toward DC dominance. Asset allocation has shifted over time with higher allocations now in other assets like real estate and lower allocations in equities and bonds.
Pioneer Compass: A Quarterly Update on the Direction of the MarketsAmundi Pioneer
The document provides a quarterly update on market direction and outlook for Q1 2017. It discusses the global economic context and outlook for the US economy. It reviews performance of major asset classes in 2016 and provides 10-year returns and volatility. The outlook expects modest US growth pending new policies, corporate earnings to improve, and selectivity in emerging markets. It believes developed sovereign debt looks unattractive while select corporate credit and emerging market debt offer value. Volatility may persist on policy uncertainty.
- The document discusses historical data on bear markets, corrections, and business cycles since the late 19th century. It finds that on average, corrections occur every 2.9 years with a 12.3% loss, while bear markets occur every 5.1 years with a 36.3% average loss.
- It also examines stock market performance around recessions and recoveries, finding that stocks typically bottom 1-7 months before the economy and that recoveries are "front loaded" in the first year after a recession low.
- The document advocates diversification and asset allocation as ways to reduce risk and increase returns, citing data showing portfolios with a mix of stocks and bonds experienced higher returns and lower volatility than 100
This report features world capital market performance and a timeline of events for the past quarter. It begins with a global overview, then features the returns of stock and bond asset classes in the US and international markets.
Anchor Capital is a South African investment management firm founded in 2011 with over R20 billion in assets under management. It has a local and offshore investment team of 20 professionals and offices in several South African cities as well as London. The document discusses investment opportunities within US banks and high yield bonds, the Chinese economy and consumer, and global asset allocation positioning. It also profiles two of Anchor Capital's fund managers, David Gibb and Peter Little.
The fund made a positive return of 0.4% in January, outperforming the -3.0% return of the MSCI World Index. Short equity positions contributed most to performance, along with short equity index futures and options. Notable positive contributors were long positions in KPN and United Continental and short positions in Ashmore and Aberdeen. Notable detractors were short positions in government bond futures and long positions in Best Buy and Ethan Allen.
Mansfield Capital Brochure Ppt Mar2009 1110Trader1mm
Mansfield Capital PowerPoint
presentation showing aggregate performance since 2003 with low-volatility program also shown separately. Note: due my institutional client going out of business last year, and for personal reasons, I took a year off off from trading even though I had top rated performance on risk-adjusted basis. Call or write for details. MansfieldCapital@Gmail.com, or 305-915-3307
ICICI Prudential Global Stable Equity Fund presentationiciciprumf
1) The document describes the NFO period and investment strategy of the ICICI Prudential Global Stable Equity Fund, an open-ended fund of funds scheme.
2) The fund seeks to provide consistent returns through diversification by investing in one or more overseas mutual funds that invest globally in fundamentally strong and stable companies with consistent earnings.
3) The underlying fund, Nordea 1 - Global Stable Equity Fund, aims to identify lower risk, stable companies through fundamental factors and proprietary models, and constructs a portfolio of 100-120 stocks with roughly two-thirds the volatility of the MSCI World Index.
How do you invest when valuations are high? What are the parameters that an investor needs to consider before he decides to invest? Explore the deck where Sorbh Gupta, Fund Manager, Equity, Quantum Mutual Fund answers these questions & more.
www.Quantumamc.com
Markets continued to rise in the second quarter of 2014, with all major asset classes posting gains. Destinations portfolios benefited from their overweight allocation to risk, with aggressive strategies performing best. Positive drivers included overweight positions in global natural resources and yield-advantaged fixed income, while domestic stock selection and an emphasis on absolute return strategies detracted. Defensive and Balanced Income specialty strategies achieved their objectives, helped by similar positions. The report provides an overview of portfolio performance and current positioning.
The US dollar appreciated against most major currencies in May, with a few exceptions. Key highlights include the Russian ruble losing nearly 15% against the dollar due to falling oil prices and investment outflows. The Indian rupee also weakened over 5% versus the dollar amid a risk-averse global environment and high deficits. In contrast, the Japanese yen was the only major currency to gain versus the dollar in May as it is seen as a relatively safer currency. The document provides exchange rate data and forecasts for various currencies against the US dollar.
Deposits and loans in Qatar's banking sector grew in June 2013. Deposits increased 4.8% month-over-month (MoM) and 16.8% year-to-date (YTD), while loans ticked up 1.0% MoM and 6.6% YTD. As a result, the loan-to-deposit ratio declined to 102% in June from 105% in May. Public sector deposits surged 12.7% MoM, driven by growth in government institutions, while private sector deposits were flat. Loan growth was supported by a 1.9% MoM rise in private sector loans. The document provides statistics on deposits, loans, and loan-to-
1) Canaccord Adams raises its peak gold price scenario from $950/oz to $1,100/oz, resulting in approximately 20% higher equity target prices for gold mining companies.
2) The report remains bullish on gold due to ongoing weak global financial conditions and expectations that inflation and currency devaluation will result from monetary and fiscal stimulus policies.
3) Investment demand for gold, as seen in surging SPDR gold trust holdings, is more than offsetting other factors and driving gold prices higher, though the trust remains a small portion of funds on the sidelines.
The document describes the SGMT (Systematic Global Markets Trend) investment strategy. It uses advanced methods to identify macroeconomic trends and trade currencies. The strategy employs signal identification methods to determine probable market directions and manages risk through automatic leverage adjustments. The strategy is fully systematic and integrated into real-time trading and risk management systems. It has delivered strong returns since inception in 2014.
The document provides information on the Systematic Global Macro Trend (SGMT) investment strategy. SGMT uses advanced methods to identify macroeconomic trends and exploit inefficiencies in currency markets. The strategy employs signal identification and risk management techniques. It has delivered strong returns since beginning real-money operations in 2014, outperforming stock and bond market indexes with lower risk. The strategy is fully systematic and rules-based to avoid discretionary decisions.
Westpac - profit result delivers - "bread and butter banking delivers the dou...George Gabriel
WBC has delivered the strongest 2H12 results in the banking sector due to its focus on the fundamentals of banking such as deposit accounts, product cross-selling, maintaining margins, and cost control. Underlying cash earnings growth was up 2.0% in 1H12 and 6.5% in 2H12, outperforming peers. WBC has gained deposit market share which provides opportunities for cross-selling other products. Its efficiency metrics such as revenue per staff and profit per staff are sector-leading. The document recommends retaining a Positive view on WBC with a target share price of $26.84.
From the BPV Capital Management investment team comes our most recent update on capital markets. In this issue, we examine how the stabilizing global economy pushed equities, interest rates, and commodities higher in April.
The MRA CHA Dynamic Tail Protection Index consists of long positions in US treasury bonds and options that are intended to outperform the benchmark ProShares Short S&P 500 ETF during periods of market stress. The allocation between bonds and options is calculated monthly based on macroeconomic indicators. Since inception in 2005, the index has outperformed the benchmark by over 375%.
This document provides an investor presentation for Banco ABC Brasil covering their strategy, business segments, funding and capital base, and financial highlights. It summarizes that Banco ABC Brasil focuses on providing commercial banking services to large corporate and middle-market clients in Brazil. Their strategy is to increase profitability per large corporate client through cross-selling more products, and grow their middle-market client base. They have a diversified funding base and strong capital and financial ratios.
This document provides an overview of structured products including leveraged floating rate notes, reversed leveraged floating rate notes, principal linked notes with look back options, principal linked notes with binary options, principal linked notes with knock-out options, and principal linked notes with quanto options. It discusses the general terms, underlying assets and indexes, and risk-return profiles of each type of structured product. Appendices at the end list research report references and data sources used in the document.
The document compares the performance of various indexes and commodity trading advisors (CTAs) in May and year-to-date. It shows that the S&P 500 declined 2.88% in May while international indexes fell more. The top performing CTAs for the month included Quantitative Investment Management and R.G. Neiderhoffer, returning over 10%.
Banco ABC Brasil had strong financial results in 4Q07. Net income increased 154.6% compared to 4Q06 to R$50.7 million. The credit portfolio grew 71% to R$4,992.2 million with high credit quality maintained. Business segments all saw growth in 4Q07 compared to prior periods. Expenses were well controlled while profitability and efficiency metrics improved. The bank ended 2007 with net income up 93.8% and a solid capital and ratings position supported by its controlling shareholder ABC Banking Corporation.
This document provides inputs and assumptions for a discounted cash flow valuation of Canadian National Railway (TSX: CNR). It includes projections for revenue growth by business segment from 2016-2020, operating expense assumptions, capital expenditure forecasts, tax rates, and weighted average cost of capital calculations to discount future free cash flows. The valuation results in an estimated price per share of $70.75 for CNR based on the DCF analysis.
- The document is the 3Q15 earnings presentation for Las Vegas Sands Corp. It provides financial highlights for the quarter including net revenue, adjusted property EBITDA, margins, EPS, and dividends paid.
- Geographically, EBITDA was derived 49% from Macao, 38% from Singapore, and 13% from the United States. Both LVS and Sands China are committed to returning capital to shareholders through dividends and share repurchases, with over $12 billion returned over the last 15 quarters.
- LVS maintains a strong balance sheet and cash flow with a net debt to TTM EBITDA of 1.6x providing flexibility for growth and capital returns.
3M reported financial results for the fourth quarter of 2015. GAAP EPS was $1.66, down 8.3% year-over-year. Excluding restructuring charges, EPS was $1.80, down 0.6% year-over-year. Sales were $7.3 billion, down 5.4% in dollar terms and 1.1% in organic local currency. Operating margins were 20.5%, down 100 basis points year-over-year but up 60 basis points excluding restructuring. The company returned $1.8 billion to shareholders through dividends and share repurchases.
- Hinduja Global Solutions reported steady quarterly results with revenue up 1.9% quarter-over-quarter and 5.7% year-over-year. EBITDA was down 20.3% quarter-over-quarter due to currency movements and higher headcount.
- Lower capital expenditures of 4.3% of revenue led to a significant rise in free cash flow, which was used to repay debt and strengthen the balance sheet with net debt reduced to Rs. 1,187 million.
- The analyst maintains a 'Buy' rating and target price of Rs. 700 per share, seeing potential for 38% growth, based on strong free cash flow generation and robust balance sheet.
The SGMT trading system generated a gross return of 5.83% in July 2016, with the strongest returns coming from the Japanese Yen and Australian Dollar. Overall market movements were volatile in July as markets assessed risks from Brexit and anticipated monetary policy actions from central banks. SGMT's risk management approach helped reduce volatility and generated modest excess returns compared to maintaining a full model exposure.
The document discusses the strong performance of the Indian stock market after the COVID-19 pandemic. It notes that economic activity and corporate profits are recovering. Some sectors have surpassed pre-pandemic levels while others are recovering gradually. Risks like a potential third wave, rising inflation, and global factors could impact the recovery. The fund manager believes the market rally can continue if COVID containment accelerates and as economic growth remains strong. However, valuations appear elevated and returns may moderate going forward. The portfolio aims to provide value through a focus on quality companies with strong earnings growth at reasonable prices.
Bank of Georgia reported strong results for the first nine months of 2007. Net income increased 188% year-over-year to $30.1 million. Total assets grew 181% to $1.45 billion, driven by a 125% increase in net loans to $770.3 million. Revenue increased 107% to $90.1 million as net interest income rose 115% and non-interest income grew 94%. The loan portfolio became more diversified across business lines and industries. Asset quality remained stable with non-performing loans at 2.3% of gross loans and loan loss reserves covering 129.9% of non-performing loans.
- The document describes an investment strategy focused on preferred stocks that aims to provide attractive risk-adjusted returns uncorrelated to fixed income and equities, with lower volatility than stocks.
- Performance statistics for 2016-2015 show the strategy outperforming the S&P 500 with lower standard deviation, while the fund structure details management and redemption terms.
- Charts show the strategy's NAV growth and rolling 12-month returns, demonstrating compound returns since inception in 2014.
Similar to AFC Asia Frontier Fund Factsheet 30.6.2018 (20)
AFC Uzbekistan Fund - March 2021 fund presentationThomas Hugger
The document discusses an investment opportunity in Uzbekistan through the AFC Uzbekistan Fund. It highlights Uzbekistan's rapid economic growth and liberalization as the country undergoes political and economic reforms. Specifically, it notes Uzbekistan's young population, competitive labor costs, strategic location along trade routes, tourism potential, and improving business environment as reasons for the country's investment potential and expected continued strong economic growth over the next 3-5 years. The main risks mentioned include potential increases in the current account deficit and external economic or political shocks.
AFC Iraq Fund (non-US) - Factsheet 31.07.2020Thomas Hugger
The AFC Iraq Fund (Non-US) is an equity fund that invests in companies located in or doing business with Iraq. In July 2020, the fund returned 11.4%, outperforming its benchmark index which returned 8.2%. The fund's largest holdings are in the financial and communications sectors, with over half of its assets in Iraqi banks. As of July 2020, the fund was 91.1% invested in Iraq, with smaller allocations to Norway and the UK, and held 7.2% in cash.
The AFC Iraq Fund is an equity fund that invests in companies listed on the Iraq Stock Exchange as well as foreign companies conducting business in Iraq. In June 2020, the fund returned 11.4%, outperforming its benchmark which returned 8.2%. As of July 2020, the fund was invested in 14 companies across Iraq, Norway, and the UK, with financials making up over half of assets. The top holdings reported strong earnings growth in the first half of 2020, demonstrating the recovery of the Iraqi banking sector.
AFC Iraq Fund: presentation August 2020Thomas Hugger
This document provides an overview of investment opportunities in Iraq. It discusses Iraq's oil wealth as the positive factor, noting Iraq's large oil reserves and low production costs. However, it also points out weaknesses in Iraq's banking system, infrastructure, and private sector development as challenges. The document argues that despite risks, Iraq presents a attractive risk-reward profile for investors given the gap between the real risks in Iraq versus the higher perceived risks, which are likely to narrow as the country develops.
- The AFC Vietnam Fund is a Vietnam public equities fund focused on small to medium cap equities. In July 2020, the fund gained 0.8% with a NAV of USD 1,632.94, bringing returns since inception in December 2013 to +63.3%.
- The fund's largest positions are in Agriculture Bank Insurance JSC, Vietnam Container Shipping JSC, TanCang Logistics and Stevedoring JSC, Pharmedic Pharmaceutical Medicinal JSC, and LienViet Post Joint Stock Commercial Bank.
- The portfolio is invested in 47 names across various sectors including industrials (28.3%) and consumer goods (21.0%), with 24.1% in
AFC Vietnam Fund: presentation 07.08.2020Thomas Hugger
- The document provides an executive summary, investment strategy, and performance summary for the AFC Vietnam Fund, an open-end fund that invests in undervalued listed Vietnamese equities.
- The fund sees opportunities for capital appreciation over the next 3-5 years based on Vietnam's strong GDP growth, increasing foreign investment, and attractive stock valuations compared to regional markets.
- The investment strategy focuses on fundamental bottom-up stock selection across various sectors, with risk controls like diversification and position limits. The fund held over 60 stocks as of July 2020 and has outperformed the VN Index since inception.
AFC Uzbekistan Fund factsheet 2020 07 31Thomas Hugger
The AFC Uzbekistan Fund is a Cayman Islands domiciled fund that invests primarily in listed companies in Uzbekistan and Kyrgyzstan. In July 2020, the fund returned +3.2% and has returned +3.9% since its inception in March 2019. The largest holding, Qizilqum Cement, appreciated 22.8% on strong domestic cement demand and price increases. However, low trading liquidity impacted some other holdings and overall fund performance. The fund remains focused on materials and industrial companies, with over 90% of assets in Uzbekistan.
AFC Uzbekistan Fund (non-US) factsheet 2020 07 31Thomas Hugger
The document summarizes the AFC Uzbekistan Fund (Non-US), a fund focused on investing in listed equities of companies in Uzbekistan and Kyrgyzstan. The fund returned +3.2% in July 2020, with its largest holdings in cement producer Qizilqum Cement appreciating 22.8% for the month. For the year-to-date period, the fund has returned -5.0%. As of July 2020, the fund was invested in 28 names across Uzbekistan (93.6%) and Kyrgyzstan (2.3%), with largest allocations to materials (59.2%) and industrials (14.6%).
AFC Uzbekistan Fund presentation 2020 08 07Thomas Hugger
The document provides an overview of the investment opportunity in Uzbekistan through the AFC Uzbekistan Fund. Uzbekistan is undergoing rapid economic and political liberalization, with GDP growth averaging over 5% in recent years. The economy is being restructured to attract foreign investment and transform Uzbekistan into a regional manufacturing and logistics hub. The Fund seeks to capture capital appreciation over the next 3-5 years by investing in undervalued companies in Uzbekistan, which are expected to benefit from the country's economic growth and liberalization. Risks include a potential increase in the current account deficit and external economic or political shocks.
- The AFC Vietnam Fund invests in listed Vietnamese companies as well as companies with operations in Vietnam. In June 2018, the fund lost -0.1% while benchmarks declined more sharply.
- The fund has outperformed since inception in 2013 with a return of +80.0% and annualized return of +13.9%, benefiting from broad diversification.
- While Vietnam is still considered a frontier market, the manager believes an upgrade to emerging market status is likely in the future, which could attract substantial new investments to Vietnamese stocks.
AFC Vietnam Fund Presentation 10.7.2018Thomas Hugger
The document provides information on the AFC Vietnam Fund, a fund focused on capturing growth in Vietnam. It summarizes that Vietnam's economy is growing at over 6% annually and attracting strong foreign investment. The fund aims to achieve capital appreciation over the next 3-5 years by investing in undervalued small and medium companies across various sectors in Vietnam through a bottom-up stock selection process. Since inception in 2013, the fund has achieved a return of 80.04% and its net asset value as of June 2018 was $1,800.40.
The AFC Iraq Fund is an equity fund focused on investments in Iraq and foreign companies doing business in Iraq. The fund offers monthly subscriptions and redemptions at net asset value. It aims to achieve long-term capital appreciation by investing in a diversified portfolio of listed Iraqi and foreign equities. As of June 2018, the fund was invested in 14 companies across Iraq, Norway, and the UK, with largest allocations to the financial and consumer staples sectors. For the month, the fund returned -2.5%, outperforming its benchmark which lost -3.5%, and has gained 17.1% year-to-date compared to the benchmark's decline of -0.6%.
AFC Iraq Fund (non-US) Factsheet 30.6.2018Thomas Hugger
This document provides information on the AFC Iraq Fund (Non–US), including its investment objective, focus, subscriptions and redemptions, benchmarks, fees, performance, holdings and allocations. The fund seeks long-term capital appreciation through investing in listed Iraqi equities and foreign companies doing business in Iraq. In June 2018, the fund returned -2.5% compared to -3.5% for its benchmark and is up 17.1% year-to-date. The largest country, sector and security allocations are to Iraq, financials and bank stocks, respectively.
AFC Iraq Fund April 2016 Fund FactsheetThomas Hugger
The AFC Iraq Fund is an equity fund focused on investments in Iraq and foreign companies doing business in Iraq. The fund's Class D shares returned -2.7% in April 2016, outperforming its benchmark index which returned -6.6%. The fund has faced redemptions from another Iraq fund and political protests in Iraq have increased uncertainty. However, interest in emerging markets is resuming and frontier markets like Iraq are expected to see increased investment in the coming months. As of April 30, the fund was invested in 14 companies across Iraq, Norway, and the UK and held 1.2% in cash.
AFC Vietnam Fund invests in a diversified portfolio of listed Vietnamese companies as well as those that relate to non-Vietnamese companies with main business operations in Vietnam. The fund currently has a focus on small to medium cap equities which are considered underpriced.
AFC Asia Frontier Fund Presentation: December 2015Thomas Hugger
The AFC Asia Frontier Fund invests in public equities of Asian frontier countries that are seeing increasing consumption due to favorable demographic trends, rising incomes and high GDP growth. The fund invests in listed equities of companies that have their principal business activities in Bangladesh, Bhutan, Cambodia, Iraq, Laos, Maldives, Mongolia, Myanmar (Burma), Nepal, Pakistan, Papua New Guinea, Sri Lanka and Vietnam. The AFC Asia Frontier Fund is positioned to take advantage of the continuing economic shifts in these countries and offers high returns combined with significant diversification opportunities.
Asia Frontier Capital - AFC Iraq Fund presentationThomas Hugger
The AFC Iraq Fund was launched on the 26th June 2015 and aims to achieve long-term capital appreciation for investors by capturing value and growth potential in the post conflict high-growth & resource rich Iraq market. The fund emphasises long term investment horizon to truly capture the opportunity in Iraq. The fund's investable universe consists of locally listed companies that have their principal business activities in Iraq as well as foreign listed companies that have the majority of the business in Iraq as a whole including the prosperous Kurdish Region of Iraq (KRI). The AFC Iraq Fund offers access to investments in post conflict recovery potential of Iraq, including the KRI, and/or stability in its territory. The AFC Iraq Fund is managed by Asia Frontier Capital (Iraq) Limited, Cayman Islands under the executive leadership team of Thomas Hugger (CEO & Fund Manager) and Ahmed Tabaqchali (CIO) who have more than 47 years of investment experience as well as an extensive background covering global, emerging, frontier and MENA markets.
❼❷⓿❺❻❷❽❷❼❽ Dpboss Matka Result Satta Matka Guessing Satta Fix jodi Kalyan Final ank Satta Matka Dpbos Final ank Satta Matta Matka 143 Kalyan Matka Guessing Final Matka Final ank Today Matka 420 Satta Batta Satta 143 Kalyan Chart Main Bazar Chart vip Matka Guessing Dpboss 143 Guessing Kalyan night
Understanding User Needs and Satisfying ThemAggregage
https://www.productmanagementtoday.com/frs/26903918/understanding-user-needs-and-satisfying-them
We know we want to create products which our customers find to be valuable. Whether we label it as customer-centric or product-led depends on how long we've been doing product management. There are three challenges we face when doing this. The obvious challenge is figuring out what our users need; the non-obvious challenges are in creating a shared understanding of those needs and in sensing if what we're doing is meeting those needs.
In this webinar, we won't focus on the research methods for discovering user-needs. We will focus on synthesis of the needs we discover, communication and alignment tools, and how we operationalize addressing those needs.
Industry expert Scott Sehlhorst will:
• Introduce a taxonomy for user goals with real world examples
• Present the Onion Diagram, a tool for contextualizing task-level goals
• Illustrate how customer journey maps capture activity-level and task-level goals
• Demonstrate the best approach to selection and prioritization of user-goals to address
• Highlight the crucial benchmarks, observable changes, in ensuring fulfillment of customer needs
Brian Fitzsimmons on the Business Strategy and Content Flywheel of Barstool S...Neil Horowitz
On episode 272 of the Digital and Social Media Sports Podcast, Neil chatted with Brian Fitzsimmons, Director of Licensing and Business Development for Barstool Sports.
What follows is a collection of snippets from the podcast. To hear the full interview and more, check out the podcast on all podcast platforms and at www.dsmsports.net
Company Valuation webinar series - Tuesday, 4 June 2024FelixPerez547899
This session provided an update as to the latest valuation data in the UK and then delved into a discussion on the upcoming election and the impacts on valuation. We finished, as always with a Q&A
Best practices for project execution and deliveryCLIVE MINCHIN
A select set of project management best practices to keep your project on-track, on-cost and aligned to scope. Many firms have don't have the necessary skills, diligence, methods and oversight of their projects; this leads to slippage, higher costs and longer timeframes. Often firms have a history of projects that simply failed to move the needle. These best practices will help your firm avoid these pitfalls but they require fortitude to apply.
B2B payments are rapidly changing. Find out the 5 key questions you need to be asking yourself to be sure you are mastering B2B payments today. Learn more at www.BlueSnap.com.
3 Simple Steps To Buy Verified Payoneer Account In 2024SEOSMMEARTH
Buy Verified Payoneer Account: Quick and Secure Way to Receive Payments
Buy Verified Payoneer Account With 100% secure documents, [ USA, UK, CA ]. Are you looking for a reliable and safe way to receive payments online? Then you need buy verified Payoneer account ! Payoneer is a global payment platform that allows businesses and individuals to send and receive money in over 200 countries.
If You Want To More Information just Contact Now:
Skype: SEOSMMEARTH
Telegram: @seosmmearth
Gmail: seosmmearth@gmail.com
Digital Marketing with a Focus on Sustainabilitysssourabhsharma
Digital Marketing best practices including influencer marketing, content creators, and omnichannel marketing for Sustainable Brands at the Sustainable Cosmetics Summit 2024 in New York
Easily Verify Compliance and Security with Binance KYCAny kyc Account
Use our simple KYC verification guide to make sure your Binance account is safe and compliant. Discover the fundamentals, appreciate the significance of KYC, and trade on one of the biggest cryptocurrency exchanges with confidence.
HOW TO START UP A COMPANY A STEP-BY-STEP GUIDE.pdf46adnanshahzad
How to Start Up a Company: A Step-by-Step Guide Starting a company is an exciting adventure that combines creativity, strategy, and hard work. It can seem overwhelming at first, but with the right guidance, anyone can transform a great idea into a successful business. Let's dive into how to start up a company, from the initial spark of an idea to securing funding and launching your startup.
Introduction
Have you ever dreamed of turning your innovative idea into a thriving business? Starting a company involves numerous steps and decisions, but don't worry—we're here to help. Whether you're exploring how to start a startup company or wondering how to start up a small business, this guide will walk you through the process, step by step.
Top mailing list providers in the USA.pptxJeremyPeirce1
Discover the top mailing list providers in the USA, offering targeted lists, segmentation, and analytics to optimize your marketing campaigns and drive engagement.
IMPACT Silver is a pure silver zinc producer with over $260 million in revenue since 2008 and a large 100% owned 210km Mexico land package - 2024 catalysts includes new 14% grade zinc Plomosas mine and 20,000m of fully funded exploration drilling.
How MJ Global Leads the Packaging Industry.pdfMJ Global
MJ Global's success in staying ahead of the curve in the packaging industry is a testament to its dedication to innovation, sustainability, and customer-centricity. By embracing technological advancements, leading in eco-friendly solutions, collaborating with industry leaders, and adapting to evolving consumer preferences, MJ Global continues to set new standards in the packaging sector.
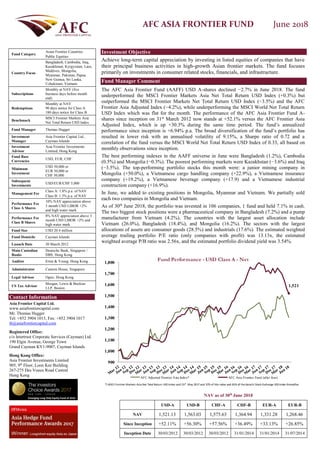
1. AFC ASIA FRONTIER FUND June 2018
Fund Category
Asian Frontier Countries
Public Equities
Country Focus
Bangladesh, Cambodia, Iraq,
Kazakhstan, Kyrgyzstan, Laos,
Maldives, Mongolia,
Myanmar, Pakistan, Papua
New Guinea, Sri Lanka,
Uzbekistan, Vietnam
Subscriptions
Monthly at NAV (five
business days before month
end)
Redemptions
Monthly at NAV
90 days notice for Class A
180 days notice for Class B
Benchmark
MSCI Frontier Markets Asia
Net Total Return USD Index
Fund Manager Thomas Hugger
Investment
Manager
Asia Frontier Capital Ltd.,
Cayman Islands
Investment
Advisor
Asia Frontier Investments
Limited, Hong Kong
Fund Base
Currencies
USD, EUR, CHF
Minimum
Investment
USD 50,000 or
EUR 50,000 or
CHF 50,000
Subsequent
Investments
USD/EUR/CHF 5,000
Management Fee
Class A: 1.8% p.a. of NAV
Class B: 1.5% p.a. of NAV
Performance Fee
Class A Shares
10% NAV appreciation above
3 month USD LIBOR +2%
and high water mark
Performance Fee
Class B Shares
8% NAV appreciation above 3
month USD LIBOR +2% and
high water mark
Fund Size USD 20.4 million
Fund Domicile Cayman Islands
Launch Date 30 March 2012
Main Custodian
Banks
Deutsche Bank, Singapore /
DBS, Hong Kong
Auditor Ernst & Young, Hong Kong
Administrator Custom House, Singapore
Legal Advisor Ogier, Hong Kong
US Tax Advisor
Morgan, Lewis & Bockius
LLP, Boston
Contact Information
Asia Frontier Capital Ltd.
www.asiafrontiercapital.com
Mr. Thomas Hugger
Tel: +852 3904 1015, Fax: +852 3904 1017
th@asiafrontiercapital.com
Registered Office:
c/o Intertrust Corporate Services (Cayman) Ltd.
190 Elgin Avenue, George Town
Grand Cayman KY1-9007, Cayman Islands
Hong Kong Office:
Asia Frontier Investments Limited
905, 9th
Floor, Loon Kee Building
267-275 Des Voeux Road Central
Hong Kong
Investment Objective
Achieve long-term capital appreciation by investing in listed equities of companies that have
their principal business activities in high-growth Asian frontier markets. The fund focuses
primarily on investments in consumer related stocks, financials, and infrastructure.
Fund Manager Comment
The AFC Asia Frontier Fund (AAFF) USD A-shares declined −2.7% in June 2018. The fund
underperformed the MSCI Frontier Markets Asia Net Total Return USD Index (+0.3%) but
outperformed the MSCI Frontier Markets Net Total Return USD Index (−3.5%) and the AFC
Frontier Asia Adjusted Index (−4.2%), while underperforming the MSCI World Net Total Return
USD Index which was flat for the month. The performance of the AFC Asia Frontier Fund A-
shares since inception on 31st
March 2012 now stands at +52.1% versus the AFC Frontier Asia
Adjusted Index, which is up +30.3% during the same time period. The fund’s annualized
performance since inception is +6.94% p.a. The broad diversification of the fund’s portfolio has
resulted in lower risk with an annualised volatility of 9.15%, a Sharpe ratio of 0.72 and a
correlation of the fund versus the MSCI World Net Total Return USD Index of 0.33, all based on
monthly observations since inception.
The best performing indexes in the AAFF universe in June were Bangladesh (1.2%), Cambodia
(0.5%) and Mongolia (−0.3%). The poorest performing markets were Kazakhstan (−3.6%) and Iraq
(−3.5%). The top-performing portfolio stocks this month were: a junior mining company in
Mongolia (+50.0%), a Vietnamese cargo handling company (+22.9%), a Vietnamese insurance
company (+19.2%), a Vietnamese beverage company (+17.9) and a Vietnamese industrial
construction company (+16.9%).
In June, we added to existing positions in Mongolia, Myanmar and Vietnam. We partially sold
each two companies in Mongolia and Vietnam.
As of 30th
June 2018, the portfolio was invested in 106 companies, 1 fund and held 7.1% in cash.
The two biggest stock positions were a pharmaceutical company in Bangladesh (7.2%) and a pump
manufacturer from Vietnam (4.2%). The countries with the largest asset allocation include
Vietnam (26.0%), Bangladesh (18.4%), and Mongolia (16.2%). The sectors with the largest
allocations of assets are consumer goods (28.5%) and industrials (17.6%). The estimated weighted
average trailing portfolio P/E ratio (only companies with profit) was 13.13x, the estimated
weighted average P/B ratio was 2.56x, and the estimated portfolio dividend yield was 3.54%.
NAV as of 30th
June 2018
USD-A USD-B CHF-A CHF-B EUR-A EUR-B
NAV 1,521.13 1,563.03 1,575.63 1,364.94 1,331.28 1,268.46
Since Inception +52.11% +56.30% +57.56% +36.49% +33.13% +26.85%
Inception Date 30/03/2012 30/03/2012 30/03/2012 31/01/2014 31/01/2014 31/07/2014
1,521
900
1,000
1,100
1,200
1,300
1,400
1,500
1,600
1,700
1,800
Fund Performance - USD Class A - Net
AFC Adjusted Frontier Asia Index* AFC Asia Frontier Fund (after fees)
*) MSCI Frontier Markets Asia Net Total Return USD Index until 31st
May 2017 and 37% of this index and 63% of the Karachi Stock Exchange 100 Index thereafter.