- Hinduja Global Solutions reported steady quarterly results with revenue up 1.9% quarter-over-quarter and 5.7% year-over-year. EBITDA was down 20.3% quarter-over-quarter due to currency movements and higher headcount.
- Lower capital expenditures of 4.3% of revenue led to a significant rise in free cash flow, which was used to repay debt and strengthen the balance sheet with net debt reduced to Rs. 1,187 million.
- The analyst maintains a 'Buy' rating and target price of Rs. 700 per share, seeing potential for 38% growth, based on strong free cash flow generation and robust balance sheet.
JM Financial's loan against shares enables you to borrow funds against listed securities such as mutual funds, shares, insurance and bonds to meet your current financial needs. Visit for more info: https://jmfl.com/what-we-do/fund-based-activities
Infomedia (IFM) - equity research initiation reportGeorge Gabriel
Initiation report on Infomedia (IFM) which I published. Overview of key value drivers and analysis of the investment opportunity. Still relevant today. Published for institutional investor market.
Cipla Q2 disappoints, gearing up for strong H2FY15EIndiaNotes.com
Valuation‐Expect strong H2FY15E to overcome shortfall in sales and EBITDA, Maintain ‘Accumulate’, retain TP Rs643: Management maintains guidance for mid‐teen sales growth and 21‐22% Ebitda margin in FY15E. Cipla expects growth in sales and EBITDA in H2FY15E due to (a)rise in EU sales, (b)tender offer for respiratory drugs in South Africa and (c)large institutional offtake following capaicty utilisation improvements in will drive exports, while maintaining mid‐ teen growth in domestic formulaitons. The company however expects strong growth in EU from respiratory drugs in 12‐18 months folllowing registrations from local market regulators. We maintain ‘BUY’ and retain TP at Rs643.
Ashok Leyland Q1FY15: Losses narrowed down to Rs48 mn, holdIndiaNotes.com
Ashok Leyland's Q1FY15 results were inline with estimates on the top-line front at INR 25 bn. Losses narrowed down to INR 48 mn (more than we expected) led by lower raw material costs & higher other income. Rating changed from sell to hold.
EPIC RESEARCH SINGAPORE - Daily SGX Singapore report of 06 August 2015Epic Research Singapore
Epic Research Singapore have best technical research team, Our research team provide Daily report on SGX Singapore and SGX Exchange, You can get Daily Favorable Tips & future Strategy for SGX Stocks Market.
EPIC RESEARCH SINGAPORE - Daily SGX Singapore report of 04 August 2015Epic Research Singapore
Epic Research Singapore have best technical research team, Our research team provide Daily report on SGX Singapore and SGX Exchange, You can get Daily Favorable Tips & future Strategy for SGX Stocks Market.
Citadel Group (CGL) - initiation report - latent value in a trusted it servic...George Gabriel
Citadel Group is a highly trusted provider of IT and health care services, trusted by critical government departments to manage sensitive data. We were pleased to support Citadel with its corporate growth agenda.
Entertainment Network Ltd: Stock Price & Q4 Results Of Entertainment Network ...hdfcsecurities1
Entertainment Network Limited: Check out the institutional research report of Q4 result of Entertainment Network Ltd. ENIL’s 4QFY18 was in-line but muted. Revenue declined 3.7% YoY owing to high base and cut in ad volumes.
In case you need to present economic status of your company then our content-ready financial statement analysis PowerPoint Presentation is ideal for you. This income statement PPT presentation having multiple slides such as financial projections, key financial ratios, liquidity ratios, cash flow statement KPIs, profitability ratios, activity ratios, solvency ratios, income statement overview and funding updates etc. This cash flow assessment PowerPoint template goes well with topics like profitability analysis, business impact analysis, financial health, and income statement, balance sheet, statement of cash flow, business performance analysis, financial health, and future prospects of an organization, project future performance, economic analysis, company analysis, business valuation, fundamental analysis. For successful business presentation, PowerPoint background is as important as the content in the slides. Our accounting statement PPT slide provides you both content rich as well as professional slides. Download our financial statement analysis presentation slides to project your business future performance. Elucidate on your ideas with our Financial Statement Analysis PowerPoint Presentation Slides. Drive your team to excellence.
In case you need to present economic status of your company then our content-ready financial statement analysis PowerPoint Presentation is ideal for you. This income statement PPT presentation having multiple slides such as financial projections, key financial ratios, liquidity ratios, cash flow statement KPIs, profitability ratios, activity ratios, solvency ratios, income statement overview and funding updates etc. This cash flow assessment PowerPoint template goes well with topics like profitability analysis, business impact analysis, financial health, and income statement, balance sheet, statement of cash flow, business performance analysis, financial health, and future prospects of an organization, project future performance, economic analysis, company analysis, business valuation, fundamental analysis. For successful business presentation, PowerPoint background is as important as the content in the slides. Our accounting statement PPT slide provides you both content rich as well as professional slides. Download our financial statement analysis presentation slides to project your business future performance. Elucidate on your ideas with our Financial Statement Analysis Powerpoint Presentation Slides. Drive your team to excellence. https://bit.ly/2VtddrR
Financial Ratio Analysis PowerPoint Presentation SlidesSlideTeam
Whenever you want to inform about your financial updates and projections to management and stakeholders, you have the perfect answer to choose from our financial ratio analysis PowerPoint presentation slides. This Financial Ratio Analysis presentation slide has been crafted by our team of artists to accommodate your need to represent financial details like balance sheet of your company, financial achievements of company, liabilities of company, income and profit and loss statements. This multi icons-based template can be used to update wide variety of information to clients and investors such as your financial projections, companies’ achievements and income statement analysis on yearly basis or monthly basis. Financial ratio analysis PPT template is useful to showcase your business strategy, comparison of business income reports, balance sheet updates, profitability, liquidity updates and activity ratios. This financial ratio presentation covers many areas related to financial, general business overview, funding updates or financial dashboards of your enterprise. Acquire an effective counter with our Financial Ratio Analysis PowerPoint Presentation Slides. They are good for convincing critics.
Need to present financial status of your organization then our financial analysis module PowerPoint Presentation is ideal for you. The income statement PPT slides having multiple slides such as P & L KPIs, balance sheet KPIs, financial projections, key financial ratios, liquidity ratios, cash flow statement KPIs, profitability ratios, activity ratios, solvency ratios, income statement overview and funding updates etc. Our monetary statement PPT presentation goes well with topics like profitability analysis, business impact analysis, financial health, and income statement, balance sheet, statement of cash flow, and financial heath, and financial ratio analysis. You can download this cash flow statement PowerPoint slides to perform some quick profitability analysis. Ratios provided in this presentations can demonstrate how long a company to pay off its account payable. This financial analysis module PowerPoint template is also helpful to showcase how well management is managing its company resources. Our Financial Analysis Module PowerPoint Presentation Slides are exclusively crafted. They can be alluringly awesome.
Idea Cellular: Q1FY15 results above estimates, buyIndiaNotes.com
IDEA’s 1QFY15 consolidated EBITDA grew 19.5% YoY and 12.6% QoQ to INR25.1b vs our estimate of INR23.7b. PAT increased 49% YoY and 23.5% QoQ to INR7.3b (estimate INR6.8b). Maintain buy.
Financing Forecasting Process And Methods PowerPoint Presentation SlidesSlideTeam
Company’s investors will expect to see your financial forecast, profit, and loss statement and cash flow, etc. Therefore, we present our financing forecasting process and methods PowerPoint presentation slides. This budget forecasting PPT presentation will assess the effectiveness with which funds are employed and the profitability of its operations. We have included required templates like fiscal KPI’s like balance sheet, cash flow statements, financial projections, key funding ratios. It also covers ratio analysis, P&L overview, funding updates, etc., in this complete PowerPoint presentation. Using these financial prediction PPT slides, a middle-level manager can depict the company’s budget to top management. If you are planning to create a presentation on the financial forecast, demand forecast, cash flow prediction, economic forecasting, fiscal modeling, qualitative forecasting methods, etc., in future our demand forecast PowerPoint templates will be useful for you. The best thing about our financial prediction PPT designs is that they can be customized as per your needs. What are you waiting for? Download this amazing financing forecasting process and methods PowerPoint presentation template. Facilitate better coordination with our Financing Forecasting Process And Methods PowerPoint Presentation Slides. Create the desire to act cohesively.
LIC Housing Finance Q1FY15 performance in line with estimates; buyIndiaNotes.com
LIC Housing Finance’s 1QFY15 operational performance was in line with estimates. Lower than expected Net interest income (3% below estimate) compensated by 5% below estimated opex. Operating profits grew 13% YoY to INR4.97b (in-line).
As Europe's leading economic powerhouse and the fourth-largest hashtag#economy globally, Germany stands at the forefront of innovation and industrial might. Renowned for its precision engineering and high-tech sectors, Germany's economic structure is heavily supported by a robust service industry, accounting for approximately 68% of its GDP. This economic clout and strategic geopolitical stance position Germany as a focal point in the global cyber threat landscape.
In the face of escalating global tensions, particularly those emanating from geopolitical disputes with nations like hashtag#Russia and hashtag#China, hashtag#Germany has witnessed a significant uptick in targeted cyber operations. Our analysis indicates a marked increase in hashtag#cyberattack sophistication aimed at critical infrastructure and key industrial sectors. These attacks range from ransomware campaigns to hashtag#AdvancedPersistentThreats (hashtag#APTs), threatening national security and business integrity.
🔑 Key findings include:
🔍 Increased frequency and complexity of cyber threats.
🔍 Escalation of state-sponsored and criminally motivated cyber operations.
🔍 Active dark web exchanges of malicious tools and tactics.
Our comprehensive report delves into these challenges, using a blend of open-source and proprietary data collection techniques. By monitoring activity on critical networks and analyzing attack patterns, our team provides a detailed overview of the threats facing German entities.
This report aims to equip stakeholders across public and private sectors with the knowledge to enhance their defensive strategies, reduce exposure to cyber risks, and reinforce Germany's resilience against cyber threats.
Adjusting primitives for graph : SHORT REPORT / NOTESSubhajit Sahu
Graph algorithms, like PageRank Compressed Sparse Row (CSR) is an adjacency-list based graph representation that is
Multiply with different modes (map)
1. Performance of sequential execution based vs OpenMP based vector multiply.
2. Comparing various launch configs for CUDA based vector multiply.
Sum with different storage types (reduce)
1. Performance of vector element sum using float vs bfloat16 as the storage type.
Sum with different modes (reduce)
1. Performance of sequential execution based vs OpenMP based vector element sum.
2. Performance of memcpy vs in-place based CUDA based vector element sum.
3. Comparing various launch configs for CUDA based vector element sum (memcpy).
4. Comparing various launch configs for CUDA based vector element sum (in-place).
Sum with in-place strategies of CUDA mode (reduce)
1. Comparing various launch configs for CUDA based vector element sum (in-place).
Chatty Kathy - UNC Bootcamp Final Project Presentation - Final Version - 5.23...John Andrews
SlideShare Description for "Chatty Kathy - UNC Bootcamp Final Project Presentation"
Title: Chatty Kathy: Enhancing Physical Activity Among Older Adults
Description:
Discover how Chatty Kathy, an innovative project developed at the UNC Bootcamp, aims to tackle the challenge of low physical activity among older adults. Our AI-driven solution uses peer interaction to boost and sustain exercise levels, significantly improving health outcomes. This presentation covers our problem statement, the rationale behind Chatty Kathy, synthetic data and persona creation, model performance metrics, a visual demonstration of the project, and potential future developments. Join us for an insightful Q&A session to explore the potential of this groundbreaking project.
Project Team: Jay Requarth, Jana Avery, John Andrews, Dr. Dick Davis II, Nee Buntoum, Nam Yeongjin & Mat Nicholas
Opendatabay - Open Data Marketplace.pptxOpendatabay
Opendatabay.com unlocks the power of data for everyone. Open Data Marketplace fosters a collaborative hub for data enthusiasts to explore, share, and contribute to a vast collection of datasets.
First ever open hub for data enthusiasts to collaborate and innovate. A platform to explore, share, and contribute to a vast collection of datasets. Through robust quality control and innovative technologies like blockchain verification, opendatabay ensures the authenticity and reliability of datasets, empowering users to make data-driven decisions with confidence. Leverage cutting-edge AI technologies to enhance the data exploration, analysis, and discovery experience.
From intelligent search and recommendations to automated data productisation and quotation, Opendatabay AI-driven features streamline the data workflow. Finding the data you need shouldn't be a complex. Opendatabay simplifies the data acquisition process with an intuitive interface and robust search tools. Effortlessly explore, discover, and access the data you need, allowing you to focus on extracting valuable insights. Opendatabay breaks new ground with a dedicated, AI-generated, synthetic datasets.
Leverage these privacy-preserving datasets for training and testing AI models without compromising sensitive information. Opendatabay prioritizes transparency by providing detailed metadata, provenance information, and usage guidelines for each dataset, ensuring users have a comprehensive understanding of the data they're working with. By leveraging a powerful combination of distributed ledger technology and rigorous third-party audits Opendatabay ensures the authenticity and reliability of every dataset. Security is at the core of Opendatabay. Marketplace implements stringent security measures, including encryption, access controls, and regular vulnerability assessments, to safeguard your data and protect your privacy.
1. Anand Rathi Share and Stock Brokers Limited (hereinafter “ARSSBL”) is a full-service brokerage and equities-research firm and the views expressed therein are solely of
ARSSBL and not of the companies which have been covered in the Research Report. This report is intended for the sole use of the Recipient. Disclosures and analyst
certifications are present in the Appendix.
Anand Rathi Research India Equities
Technology
Company Update
India I Equities
Key financials (YE Mar) FY15 FY16 FY17 FY18e FY19e
Sales (` m) 28,076 33,247 37,110 38,336 40,498
Net profit (` m) 1,651 1,010 1,792 1,932 1,921
EPS (`) 79.7 48.7 86.5 93.2 92.7
Growth (%) -2.8 -38.8 77.4 7.8 -0.6
PE (x) 6.4 10.4 5.9 5.4 5.5
PBV (x) 1.0 0.9 0.8 0.7 0.6
RoE (%) 13.1 9.0 14.2 13.6 12.1
RoCE (%) 12.3 10.9 15.6 16.7 16.5
Dividend yield (%) 4.0 3.0 2.0 2.0 2.0
Net debt/equity (x) 0.2 0.3 0.2 0.1 0.0
Source: Company, Anand Rathi Research
Mohit Jain
Research Analyst
+9122 6626 6531
mohitjain@rathi.com
Shobit Singhal
Research Associate
+9122 6626 6511
shobitsinghal@rathi.com
1,58,329.51 1,58,329.51
`
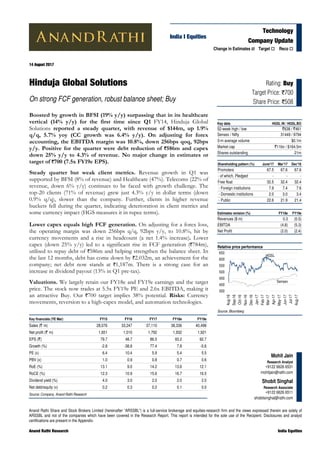
Rating: Buy
Target Price: `700
Share Price: `508
Key data HGSL IN / HGSL.BO
52-week high / low `638 / `461
Sensex / Nifty 31449 / 9794
3-m average volume $0.1m
Market cap `11bn / $164.5m
Shares outstanding 21m
Shareholding pattern (%) June'17 Mar'17 Dec'16
Promoters 67.5 67.6 67.6
- of which, Pledged - - -
Free float 32.5 32.4 32.4
- Foreign institutions 7.9 7.4 7.6
- Domestic institutions 2.0 3.0 3.4
- Public 22.6 21.9 21.4
Change in Estimates Target Reco
14 August 2017
Hinduja Global Solutions
On strong FCF generation, robust balance sheet; Buy
Boosted by growth in BFSI (19% y/y) surpassing that in its healthcare
vertical (14% y/y) for the first time since Q1 FY14, Hinduja Global
Solutions reported a steady quarter, with revenue of $144m, up 1.9%
q/q, 5.7% yoy (CC growth was 6.4% y/y). On adjusting for forex
accounting, the EBITDA margin was 10.8%, down 256bps qoq, 92bps
y/y. Positive for the quarter were debt reduction of `586m and capex
down 25% y/y to 4.3% of revenue. No major change in estimates or
target of `700 (7.5x FY19e EPS).
Steady quarter but weak client metrics. Revenue growth in Q1 was
supported by BFSI (8% of revenue) and Healthcare (47%). Telecoms (22% of
revenue, down 6% y/y) continues to be faced with growth challenge. The
top-20 clients (71% of revenue) grew just 4.3% y/y in dollar terms (down
0.9% q/q), slower than the company. Further, clients in higher revenue
buckets fell during the quarter, indicating deterioration in client metrics and
some currency impact (HGS measures it in rupee terms).
Lower capex equals high FCF generation. On adjusting for a forex loss,
the operating margin was down 256bps q/q, 92bps y/y, to 10.8%, hit by
currency movements and a rise in headcount (a net 1.4% increase). Lower
capex (down 25% y/y) led to a significant rise in FCF generation (`784m),
utilised to repay debt of `586m and helping strengthen the balance sheet. In
the last 12 months, debt has come down by `2.032m, an achievement for the
company; net debt now stands at `1,187m. There is a strong case for an
increase in dividend payout (13% in Q1 pre-tax).
Valuations. We largely retain our FY18e and FY19e earnings and the target
price. The stock now trades at 5.5x FY19e PE and 2.6x EBITDA, making it
an attractive Buy. Our `700 target implies 38% potential. Risks: Currency
movements, reversion to a high-capex model, and automation technologies.
Relative price performance
Source: Bloomberg
HGSL
Sensex
350
400
450
500
550
600
650
Aug-16
Sep-16
Oct-16
Nov-16
Dec-16
Jan-17
Feb-17
Mar-17
Apr-17
May-17
Jun-17
Jul-17
Aug-17
Estimates revision (%) FY18e FY19e
Revenues ($ m) 0.3 (0.5)
EBITDA (4.8) (5.3)
Net Profit (2.0) (2.4)
4. 14 August 2017 Hinduja Global Solutions – On strong FCF generation, robust balance sheet; Buy
Anand Rathi Research 4
Conference Call Takeaways
Company
The focus on FCF and operational efficiencies would continue for the
rest of FY18. However, margins may be affected by currency
movements, minimum wage increases in some states in India (making
tier-2 call centres less viable) and weakness in India’s telecoms sector
(HGS’ India business brings 16% to its revenue). Management would
try to soften the impact by transferring the workforce to states where
minimum wages are not applicable.
Minimum wages in Canada could also come by Q4 FY18. The impact
of this could not be directly transferred to customers by an increase in
pricing but various offset levers are available like higher offshoring,
some price increases, and government subsidies.
Capex is expected to hold in the range of `1.6bn-1.8bn, of which
`395m has already been expensed in Q1 FY18.
Debt now stands at `6.0bn (term loans: 33%,) rest is working capital
loan. The requirements of working capital could increase in response
to growth in revenues
New centres opened in Indore with 700 seats. Two Durgapur centres
will be consolidated into one.
Business outlook
H2 FY18 would be better than H1. Cost pressures in Indian telecoms
would be seen due to consolidation in the telecoms industry generally.
The company is positive on the Healthcare sector and believes that it
would continue to grow at a healthy rate in FY18.
Notes from the last two quarters’ conference calls
From Q4 FY17
Q1 FY18 revenue growth would exhibit the usual seasonality (weak
H1, strong H2). Margins would be similar to Q1 FY17 as currency
headwinds are likely.
Higher dividend/buy-back to be considered later as cash generation is
expected to be strong. The first priority currently is to repay debt,
followed by some capital allocation ($10m-15m) towards M&A.
Forex loss for the quarter was `230m.
From Q3 FY17
Q4 is expected to be little softer than the very strong Q3.
HGS expects to maintain its margins in the current environment than
attempt expanding them through higher offshoring.
5. 14 August 2017 Hinduja Global Solutions – On strong FCF generation, robust balance sheet; Buy
Anand Rathi Research 5
Factsheet
Fig 9 – Revenue
Q1 FY17 Q2 FY17 Q3 FY17 Q4 FY17 Q1 FY18
Revenues ($ m) 136 135 142 141 144
Source: Company Anand Rathi Research
Fig 10 – Revenue by area
(%) Q1 FY17 Q2 FY17 Q3 FY17 Q4 FY17 Q1 FY18
North America 28 28 29 29 28
Canada 12 10 10 10 10
Continental Europe 10 10 7 7 7
India 32 34 35 35 36
Philippine 18 18 19 19 19
Source: Company Anand Rathi Research
Fig 11 – Revenue by vertical
(%) Q1 FY17 Q2 FY17 Q3 FY17 Q4 FY17 Q1 FY18
BFSI 7 7 7 7 8
Telecoms 25 24 22 22 22
Hi-tech / PES (cons. elec) 14 14 13 13 13
Life Sciences (chem, biotech & ins) 43 46 49 48 47
Media and Entertainment 3 3 2 0 4
Others 7 7 6 9 6
Source: Company Anand Rathi Research, * Clubbed in “others”
Fig 12 – Client concentration
(%) Q1 FY17 Q2 FY17 Q3 FY17 Q4 FY17 Q1 FY18
Top client 17 18 18 18 19
Top-5 clients 47 49 50 52 52
Top-10 clients 60 61 61 63 62
Top-20 clients 72 73 72 73 71
Source: Company Anand Rathi Research
Fig 13 – Revenue by currency exposure
(%) Q1 FY17 Q2 FY17 Q3 FY17 Q4 FY17 Q1 FY18
North America 65 66 68 68 65
Canada 12 11 10 10 11
Continental Europe 10 10 7 7 8
India 13 14 14 15 16
Source: Company Anand Rathi Research
Fig 14 – Workforce spread
(%) Q1 FY17 Q2 FY17 Q3 FY17 Q4 FY17 Q1 FY18
North America 5 8 9 9 9
Canada 6 5 5 5 5
Continental Europe 4 4 3 3 3
India 68 66 65 67 67
Philippine 17 17 18 16 16
Total 40,938 43,793 43,750 44,237 44,877
Source: Company Anand Rathi Research
Fig 15 – Seats
(%) Q1 FY17 Q2 FY17 Q3 FY17 Q4 FY17 Q1 FY18
Active clients 189 185 185 183 187
Revenue per active client ($ m) 0.7 0.7 0.8 0.8 0.8
Source: Company, Anand Rathi Research
6. 14 August 2017 Hinduja Global Solutions – On strong FCF generation, robust balance sheet; Buy
Anand Rathi Research 6
Valuations
The stock trades at 5.5x FY19e PE and 2.6x EV/EBITDA, attractive
considering the capex reduction (in Q1 FY18 down 25% yoy, dipping
below 5% of revenue) and consequent greater free-cash-flow generation
(much higher EBITDA and discipline in working capital). Therefore, we
maintain our target multiple at 7.5x (reflecting slower revenue growth,
dependence on one vertical and our view of BPO being at higher risk than
IT due to new technologies). We maintain our Buy rating with an
unchanged target price (`700, at 7.5x FY19e PE).
Firstsource and HGS are experiencing slow organic growth at the industry
level, and growth seems to be concentrated in a few verticals. Of the two,
though, HGS is growing more rapidly organically, but heavily depends on
one vertical: Healthcare. The US is currently traversing a phase of
regulatory uncertainty and that includes healthcare (The Affordable Care
Act). This also constrains our target multiple for HGS.
At the industry level, we are setting a discount to BPO companies
compared to IT-services companies since the latter are higher up the value
chain than the former. We believe that, at this stage, automation threats
may be greater for BPO companies than for IT-services companies.
Therefore, on being exposed to these counters, one needs to build in a
margin of safety in terms of valuations.
Consequently, we believe that HGS is quite close to its peak growth and
margin profile. But valuations have potential if the company can
consistently deliver on free cash-flows and dividends.
Fig 16 – Change in estimates
FY18 FY19
(` m) New Old Chg % New Old Chg %
Revenues ($ m) 594 592 0.3 628 631 (0.5)
Revenues 38,336 39,476 (2.9) 40,498 42,047 (3.7)
EBITDA 4,397 4,619 (4.8) 4,472 4,723 (5.3)
EBITDA margin % 11 12 -23 bps 11 11 -19 bps
EBIT 2,896 3,087 (6.2) 2,843 3,060 (7.1)
EBIT margin % 8 8 -26 bps 7 7 -26 bps
PAT 1,932 1,971 (2.0) 1,921 1,969 (2.4)
Source: Company, Anand Rathi Research
Fig 17 – PE band (one-year forward)
Source : Bloomberg, Anand Rathi Research
0
2
4
6
8
10
12
14
Sep-11
Feb-12
Jul-12
Dec-12
May-13
Oct-13
Mar-14
Aug-14
Jan-15
Jun-15
Nov-15
Apr-16
Sep-16
Feb-17
Jul-17
HGSL
7. 14 August 2017 Hinduja Global Solutions – On strong FCF generation, robust balance sheet; Buy
Anand Rathi Research 7
Risks
Capital allocation: HGS is shifting from a capital-intensive business
model to a low-capex one, and is expected to take up additional areas
on rent to the extent possible. This, if sustained, has the potential to
improve its balance sheet and cash-flows. However, any reversion to
the capex-heavy model would be a huge negative.
Long-term risks due to automation: We reckon that the BPO sector
could see slower-than-industry revenue growth on account of the
impact of automation on the industry.
8. Appendix
Analyst Certification
The views expressed in this Research Report accurately reflect the personal views of the analyst(s) about the subject securities or issuers and no part of the
compensation of the research analyst(s) was, is, or will be directly or indirectly related to the specific recommendations or views expressed by the research
analyst(s) in this report. The research analysts are bound by stringent internal regulations and also legal and statutory requirements of the Securities and Exchange
Board of India (hereinafter “SEBI”) and the analysts’ compensation are completely delinked from all the other companies and/or entities of Anand Rathi, and have
no bearing whatsoever on any recommendation that they have given in the Research Report.
Important Disclosures on subject companies
Rating and Target Price History (as of 14 August 2017)
Date Rating
TP
(`)
Share
Price (`)
1 28-Oct-14 Buy 980 651
2 09-Apr-15 Buy 940 574
3 09-Nov-15 Buy 670 471
4 13-Dec-16 Buy 650 533
5 10-Feb-17 Hold 700 605
6 23-May-17 Buy 700 528
Anand Rathi Ratings Definitions
Analysts’ ratings and the corresponding expected returns take into account our definitions of Large Caps (>US$1bn) and Mid/Small Caps (<US$1bn) as described
in the Ratings Table below:
Ratings Guide (12 months)
Buy Hold Sell
Large Caps (>US$1bn) >15% 5-15% <5%
Mid/Small Caps (<US$1bn) >25% 5-25% <5%
Research Disclaimer and Disclosure inter-alia as required under Securities and Exchange Board of India (Research Analysts) Regulations, 2014
Anand Rathi Share and Stock Brokers Ltd. (hereinafter refer as ARSSBL) (Research Entity) is a subsidiary of Anand Rathi Financial Services Ltd. ARSSBL is a
corporate trading and clearing member of Bombay Stock Exchange Ltd, National Stock Exchange of India Ltd. (NSEIL), Multi Stock Exchange of India Ltd (MCX-
SX), United Stock Exchange and also depository participant with National Securities Depository Ltd (NSDL) and Central Depository Services Ltd. ARSSBL is
engaged in the business of Stock Broking, Depository Participant and Mutual Fund distributor.
The research analysts, strategists, or research associates principally responsible for the preparation of Anand Rathi research have received compensation based
upon various factors, including quality of research, investor client feedback, stock picking, competitive factors and firm revenues.
General Disclaimer: This Research Report (hereinafter called “Report”) is meant solely for use by the recipient and is not for circulation. This Report does not
constitute a personal recommendation or take into account the particular investment objectives, financial situations, or needs of individual clients. The
recommendations, if any, made herein are expression of views and/or opinions and should not be deemed or construed to be neither advice for the purpose of
purchase or sale of any security, derivatives or any other security through ARSSBL nor any solicitation or offering of any investment /trading opportunity on behalf
of the issuer(s) of the respective security (ies) referred to herein. These information / opinions / views are not meant to serve as a professional investment guide for
the readers.No action is solicited based upon the information provided herein. Recipients of this Report should rely on information/data arising out of their own
investigations. Readers are advised to seek independent professional advice and arrive at an informed trading/investment decision before executing any trades or
making any investments. This Report has been prepared on the basis of publicly available information, internally developed data and other sources believed by
ARSSBL to be reliable. ARSSBL or its directors, employees, affiliates or representatives do not assume any responsibility for, or warrant the accuracy,
completeness, adequacy and reliability of such information / opinions / views. While due care has been taken to ensure that the disclosures and opinions given are
fair and reasonable, none of the directors, employees, affiliates or representatives of ARSSBL shall be liable for any direct, indirect, special, incidental,
consequential, punitive or exemplary damages, including lost profits arising in any way whatsoever from the information / opinions / views contained in this Report.
The price and value of the investments referred to in this Report and the income from them may go down as well as up, and investors may realize losses on any
investments. Past performance is not a guide for future performance. ARSSBL does not provide tax advice to its clients, and all investors are strongly advised to
consult with their tax advisers regarding taxation aspects of any potential investment.
Opinions expressed are our current opinions as of the date appearing on this Research only. We do not undertake to advise you as to any change of our views
expressed in this Report. Research Report may differ between ARSSBL’s RAs and/ or ARSSBL’s associate companies on account of differences in research
methodology, personal judgment and difference in time horizons for which recommendations are made. User should keep this risk in mind and not hold ARSSBL,
its employees and associates responsible for any losses, damages of any type whatsoever.
HGSL
6
1
2
3
4
5
350
400
450
500
550
600
650
Jan-14
Apr-14
Jul-14
Oct-14
Jan-15
Apr-15
Jul-15
Oct-15
Jan-16
Apr-16
Jul-16
Oct-16
Jan-17
Apr-17
Jul-17