1. Systematic Global Macro Trend Strategy(SGMT)
Investment Strategy
SGMT (Systematic Global Markets Trend) strategy uses advanced methods to exploit market information and identify world macro-market
cycles to trade currencies. The strategy employs advanced signal identification methods to exploit cross markets information and
determine the most probable directions of macro-economic and capital trends in the currency markets. It has built-in risk control to
automatically adjust effective leverages by using the probable identification information from the strategy. The strategy is built into a
trading system that is fully integrated into real-time data, automated trading and risk management. All trading follows systematic rules
developed from extensive research to avoid discretionary trading activities.
SGMT Managers
Mr. Pan is the founder and investment manager of the SGMT strategy. He developed the SGMT system based on a decade solid research
with full system integrations. He took the researches not only in theory but also series of periodical real-money tests from 2005 and
eventually spent full time in 2012 to built the fully integrated SGMT system and started to manage money since April 2014. Mr. Pan has
more than 25 years of experience in capital market businesses and risk management for large financial institutions like FannieMae, Societe
Generale, FGIC, AMBAC and New York Life in senior positions. As capital market specialist and risk manager, he has depth of knowledge in
financial derivatives, markets and trading and strategies. Prior to the capital market experience, he was a visiting professor at the Wharton
School of University of Pennsylvania and pioneered the first MBS prepayment models. He also held department vice chairman and
professorship of Kunming Technology University in China in 1980’s. Mr. Pan graduated from Electrical Engineering BS at Beijing Industrial
Engineering University and from Management Decision/Computer Sciences program jointly run by Shanghai JiaoTong University and the
Wharton School, University of Pennsylvania.
Mr. Smith is the principal of SGMT to market the strategy and to communicate to the investing communities. He has over 25 years of
experience in capital markets derivatives trading and risk management at large financial institutions like Depfa Bank, Bayern LB, Ambac Inc.
and New York Life. As a portfolio manager at a hedge fund setup by ex-Millenium partners, and in his own managed account business, Mr.
Smith has a documented track record with a 4.0 Sharpe Ratio, specializing in global macro international statistical arbitrage trading. Mr.
Smith has an MBA in Finance from New York University, Stern School of Business.
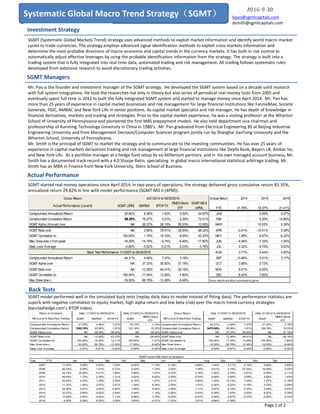
Actual Performance
SGMT started real-money operations since April 2014. In two years of operations, the strategy delivered gross cumulative return 83.35%,
annualized return 29.82% in line with model performance (SGMT MD II (4PM)).
Back Tests
SGMT model performed well in the simulated back tests (replay daily data to model instead of fitting data). The performance statistics are
superb with negative correlation to equity market, high alpha return and low beta (risk) over the macro trend currency strategies
(barclayhedge.com’s BTOP index).
Page 1 of 2
kpan@sgmtcapitals.com
dsmith@sgmtcapitals.com
Gross Return Actual Returns 2014 2015 2016
Actual Performance (Level II) SGMT (3PM) S&P500 BTOPFX
PIMCO Bond
ETF
SGMT MD II
(4PM) YTD 31.76% 18.37% 21.41%
Compounded Annualized Return 29.82% 6.36% 1.42% 0.92% 24.97% JAN 2.06% 0.07%
Compounded Cumulative Return 89.35% 16.27% 3.51% 2.26% 72.51% FEB 0.20% 12.80%
SGMT Alpha (Annual) over NA 26.37% 26.15% 26.53% 10.56% MAR 10.03% 5.39%
SGMT Beta over NA 2.80% 76.41% -38.50% 98.32% APR -0.41% -12.41% 5.38%
SGMT Correlation to 100.00% 1.76% 18.16% -8.06% 93.30% MAY 1.88% 6.87% -6.22%
Max Draw dow n frompeak -18.29% -14.16% -9.74% -6.46% -17.60% JUN -4.94% -7.33% -1.54%
Daily Loss Average -0.80% -0.62% -0.21% -0.23% -0.79% JUL 0.32% 9.72% 5.83%
AUG 0.71% 4.44% -3.93%
Compounded Annualized Return 44.31% 4.46% 7.47% 3.16% SEP 13.46% 0.01% 3.17%
SGMT Alpha over NA 37.33% 36.92% 37.19% OCT 3.68% 0.72%
SGMT Beta over NA -13.36% 46.41% -28.16% NOV 8.01% -2.55%
SGMT Correlation to 100.00% -17.04% 13.26% -7.80% DEC 6.42% 7.82%
Max Draw dow n -16.55% -56.78% -12.49% -6.46% Note:returns are after commissions gross
4/21/2014 to 09/30/2016
Back Test Performance 1/1/2007 to 09/30/2016
SGMT S&P500 BTOP FX SGMT
PIMCO Bond
ETF
SGMT S&P500 BTOP FX SGMT
PIMCO Bond
ETF
Compounded Annualized Return 31.59% 4.46% 7.47% 19.13% 3.16% Compounded Annualized Return 44.31% 4.46% 7.47% 27.05% 3.16%
Compounded Cumulative Return 1353.75% 53.06% 1.81% 123.18% 15.33% Compounded Cumulative Return 3473.05% 53.06% 1.81% 199.79% 15.33%
SGMT Alpha over NA 28.46% 28.06% NA 28.32% SGMT Alpha over NA 37.33% 36.92% NA 37.19%
SGMT Beta over NA -12.90% 43.15% NA -26.46% SGMT Beta over NA -13.36% 46.41% NA -28.16%
SGMT Correlation to 100.00% -16.56% 12.11% 100.00% -7.27% SGMT Correlation to 100.00% -17.04% 13.26% 100.00% -7.80%
Max Draw dow n -20.50% -56.78% -12.49% -17.60% -6.46% Max Draw dow n -16.55% -56.78% -12.49% -16.55% -6.46%
Daily Loss Average -0.57% -0.91% -0.22% -0.59% -0.20% Daily Loss Average -0.53% -0.91% -0.22% -0.56% -0.20%
Year YTD Jan Feb Mar Apr May Jun Jul Aug Sep Oct Nov Dec
2007 11.07% 0.28% 0.90% 1.23% -0.02% -1.13% -2.18% -2.66% -1.24% 4.11% 4.15% 4.59% 2.85%
2008 82.33% 5.59% 1.91% 0.73% 0.42% 1.72% 3.04% 1.59% 5.51% 3.19% 27.52% 10.49% 2.55%
2009 42.13% 18.90% -0.01% 1.69% 2.89% 1.91% 0.23% 2.16% 1.30% 2.75% 4.01% -0.95% 2.11%
2010 49.64% 1.72% 2.34% 1.31% 0.52% 8.42% 2.09% 5.70% 5.09% 4.94% 3.08% 4.62% 1.43%
2011 55.02% 2.35% 1.45% 3.78% 9.15% 1.67% 2.51% 0.90% 1.32% 13.14% 7.44% 1.57% 0.19%
2012 11.32% 1.04% -3.07% 3.41% 1.34% 8.34% 2.00% 1.01% -3.30% -0.22% 0.19% 0.23% 0.28%
2013 24.60% 0.61% 2.82% -0.82% 1.58% 0.62% 2.36% 1.11% 2.87% 5.18% 2.33% 2.84% 0.83%
2014 32.27% 2.84% 0.62% 2.94% 0.44% 1.14% -2.85% 0.43% 0.29% 7.43% 3.53% 6.57% 5.39%
2015 13.84% 3.54% -0.44% 7.13% -9.96% 3.79% -6.09% 6.81% 3.34% 0.87% -0.33% -0.80% 6.72%
2016 4.20% 0.09% 8.32% 3.39% 3.63% -4.21% -7.33% 3.51% -4.66% 2.38%
Gross Return Daily 1/1/2007 to 09/30/2016 Daily 3/1/2012 to 09/30/2016
MD (Level II) BackTest Trading MD (Level II) BackTest Trading
SGMT Level II MD return to Investors
Return to Investors Daily 1/1/2007 to 09/30/2016 Daily 3/1/2012 to 09/30/2016
2. Appendix:SGMT and BTOP index components/Other Ranked Funds Performance Statistics
The information contained in this document is qualified in its entirety as an outline only. This document is neither an offer to
sell nor a solicitation of an offer to buy an interest in any fund or vehicle managed or advised by the author(s). Any offer can
only be made by the relevant documents, together with the relevant subscription application, all of which must be read and
understood in their entirety, and in compliance with the relevant laws and regulatory requirements. Past performance and
simulation are not necessarily indicative of future results. There is the risk of loss as well as the opportunity for gain when
investing in the strategy, funds or vehicles managed or advised by the author(s). This document is not an advertisement, or
construed as such, and is not intended for public use or distribution. Any opinion should not be regarded as constituting
advice or recommendation. This document is private and confidential. No part of this document should be distributed or
reproduced without the prior permission of the author(s).
Disclaimer
Page 2 of 2
FundName (SGMTAs of August-2016) 2016 2015 2014 AnnualRet Inception Sharpe Maxdown
Alpha vs
SP500
Beta vs
SP500
SGMT(Net) 11.27% 15.28% 24.17% 20.41% May-14 1.10 20.18% 1.669 -0.02
SGMT(Gross) 17.68% 21.34% 32.90% 29.28% May-14 1.38 18.29% 2.311 -0.02
Alder Capital (Alder Global 20) 5.90% -3.27% 1.15% 6.29% Feb-01 0.32 28.51% 0.61 -0.01
FDO Partners, LLC(Emerging Markets Quant. Currency) -7.22% -2.37% 1.98% 0.42% Jul-01 -0.37 11.62% 0.02 0.03
First Quadrant L.P. (Tactical CurrencyAllocationL/S USD) 4.63% -1.53% 1.08% 1.82% May-95 -0.14 6.72% 0.17 -0.01
Harmonic Capital (Currency10v) -6.68% 7.91% 10.45% 4.06% May-03 0.32 16.73% 0.28 0.10
Harness Investment GroupLimited(FX) -4.27% -3.64% 8.28% 5.12% Apr-09 0.49 13.52% -0.15 0.48
P/E Investments (FX Strategy- Aggressive) -15.75% 13.82% 49.08% 11.15% Oct-03 0.50 33.33% 1.02 0.04
Premium Capital Advisors AG (Premium Currencies) -1.70% 5.22% 5.16% 3.28% Jan-04 0.28 14.51% 0.38 -0.13
Quaesta Capital AG (v-ProVolatility) -3.16% 20.08% 1.00% 5.57% Jul-07 0.84 9.39% 0.52 -0.08
Salix Capital UK Ltd. (FDFX) -17.49% 13.50% 10.82% 5.69% Jan-11 0.53 13.76% 0.73 -0.16
RhiconCurrencyManagement (Pte) Ltd(Strategic) 1.02% -3.33% 8.25% 4.94% Jan-04 0.51 8.56% 0.45 -0.03
Investment Capital Advisors LLC(ICA ManagedAccounts) 21.85% 266.22% 26.02% 72.09% Nov-10 0.74 29.65% 7.77 -0.92
Alternative Asset Management Ltd(ACMP (Long Only)) -9.65% 48.45% 122.39% 57.06% Sep-12 1.38 4.35% 8.87 0.32
Quaesta Capital AG (v-ProDynamic Volatility) -4.77% 43.36% 2.58% 10.52% Jul-07 0.88 17.98% 0.98 -0.15
CenturionFx Ltd(CENTURIONFX - 6X) 12.97% 39.44% 36.21% 51.90% Jan-06 2.01 21.60% 3.94 -0.20
24FX Global Advisors Ltd. 76.60% 27.81% 26.94% 29.71% Jan-01 1.59 19.28% 2.32 0.03
Hong Investment Advisors Ltd(HCM Rapier FX Index) -7.82% 25.32% 8.64% 8.31% May-13 0.65 13.55% 0.96 -0.23
AE Capital Systematic FX Fund 4.13% 19.35% 5.74% 14.50% Oct-12 1.73 6.51% 1.32 -0.04
P/E Investments (FX Strategy- Aggressive) -15.75% 13.82% 49.08% 11.15% Oct-03 0.50 33.33% 1.02 0.04
Salix Capital UK Ltd. (FDFX) -17.49% 13.50% 10.82% 5.69% Jan-11 0.53 13.76% 0.73 -0.16
Sequoia Capital FundManagement LLP (Systematic FX) -4.95% 12.97% -9.14% 6.24% Jun-11 0.62 19.09% 0.51 0.02
Investment Capital Advisors LLC(ICA ManagedAccounts) 21.85% 266.22% 26.02% 72.09% Nov-10 0.74 29.65% 7.77 -0.92
First Quadrant L.P. (Tactical CurrencyAllocationL/S USD20%) 21.89% -12.19% 4.18% 5.26% Feb-11 0.25 31.76% 1.33 -0.73
Alder Capital (Alder Global 20) 5.90% -3.27% 1.15% 6.29% Feb-01 0.32 28.51% 0.61 -0.01
TMS Capital Ltd(Arktos GCS II) 3.83% -5.78% 3.83% 3.50% Feb-10 0.43 10.15% 0.38 -0.05
IPM InformedPortfolioMgmt. (IPM Systematic Curr. A) 14.89% 2.56% 7.01% 4.96% Apr-05 0.41 14.97% 0.59 -0.19
P/E Investments (FX Strategy- Aggressive) -15.75% 13.82% 49.08% 11.15% Oct-03 0.50 33.33% 1.02 0.04
24FX Global Advisors Ltd. 76.60% 27.81% 26.94% 29.71% Jan-01 1.59 19.28% 2.32 0.03
CurrencyInsight Ltd(Global CurrencyProgram) -2.94% 4.56% 2.24% 6.51% Jan-02 0.51 11.57% 0.59 -0.03
Ortus Capital Management Ltd(Currency- Aggressive) 11.04% 0.87% 18.71% 12.90% Mar-04 0.43 52.79% 1.23 0.18
TraubCapital Management, LLC(FX StrategyFundI) -10.95% 9.39% 30.98% 2.46% Mar-11 0.15 22.87% 0.73 -0.42
Source:BarclayHedge.com for other funds andSGMT Capital Inc. as of June 16 (redcoloredmarks discountinuedor no-updatedfunds)
SGMTPerformance Statistics As of September 30,2016
SGMT(Net) 14.67% 14.71% 24.17% 21.15% May-14 1.09 20.18% 1.652 -0.02
SGMT(Gross) 21.41% 20.68% 32.90% 29.82% May-14 1.37 18.29% 2.292 -0.02
BTOPFXIndexComponentsasofAugust-2016
Year2015 TopRankedCTACurrencyProgramsasofAugust-2016
January2016 MonthlyTopRankedCTACurrencyasofAugust-2016