1. MRA CHA Dynamic Tail Protection Index by Mayfair
Research Associates
DESCRIPTION
MRA CHA Dynamic Tail Protection Index consists of long positions
in options and US treasury bonds (ishares 20+ Year Treasury Bond
ETF), which leads to strong performance versus the benchmark
ProShares Short S&P 500 ETF in times of market stress, and
outperformance of the outright short index in rallying markets.
The sizes and strikes of the options are defined by short-term
dynamics of macro-economic indicators.
STRATEGY OVERVIEW
The allocation between iShares 20+ Year Treasury Bond ETF and
long positions in options is calculated according to a signal, based
on the short-term dynamics of macro-economic indicators.
Depending on the signal, the cash position is allocated with either
99% in bonds and 1% in long options, or 90% in bonds and 10% in
long options. At the base date there is a starting value of $100.
The roll days are every first Thursday of the month.
KEY FACTS
Benchmark: ProShares Short S&P 500 ETF
Asset Type: Equities
Index Type: Total Return
Inception Date: 13.06.2005
Currency: USD
Calculation: daily
Index Rebalancing: monthly
Number of Components: 2
Volatility Target: NO
Index Sponsor: Mayfair Research Associates
Index Calculator: Mayfair Research Associates
Bloomberg Ticker:
Available Format:
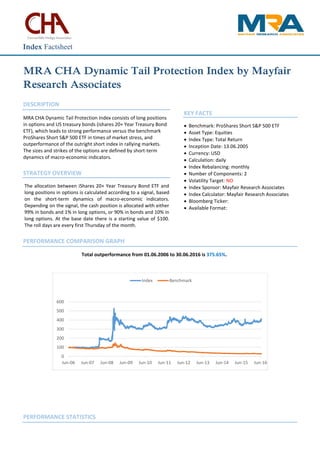
PERFORMANCE COMPARISON GRAPH
Total outperformance from 01.06.2006 to 30.06.2016 is 375.65%.
PERFORMANCE STATISTICS
0
100
200
300
400
500
600
Jun-06 Jun-07 Jun-08 Jun-09 Jun-10 Jun-11 Jun-12 Jun-13 Jun-14 Jun-15 Jun-16
Index Benchmark
Index Factsheet
2. -30%
20%
70%
120%
170%
220%
270%
Index Benchmark
YTD 3y 5y Since inception
Index Outperformance - 20.03% 51.17% 50.40% 375.65%
Performance (annualized)
Index 22.60% 12.63% 2.63% 29.28%
Benchmark -14.35% -10.73% -14.76% -10.92%
Average quarterly
Index 3.84% 2.37% 0.02% 4.84%
Benchmark -2.57% -2.36% -3.72% -2.81%
Maximum Drawdown
Index -7.20% -19.06% -28.80% -46.36%
Benchmark -16.55% -27.65% -51.45% -81.38%
Volatility (annualized)
Index 15.31% 16.05% 15.39% 41.28%
Benchmark 15.79% 14.11% 13.19% 21.24%
Sharpe ratio
Index 1.48 0.79 0.17 0.71
Benchmark -0.91 -0.76 -1.12 -0.51
HISTORICAL PERFORMANCE COMPARISON
MONTHLY AND QUARTERLY PERFORMANCE COMPARISON
Year Index Benchmark Index
Outperformance
2006 -1.23% -11.04% 9.81%
2007 6.06% -2.49% 8.55%
2008 295.25% 18.69% 276.56%
2009 -26.74% -27.07% 0.33%
2010 4.08% -16.50% 20.57%
2011 31.53% -7.95% 39.48%
2012 -4.20% -15.79% 11.59%
2013 -20.54% -25.81% 5.27%
2014 21.10% -13.67% 34.76%
2015 -5.80% -4.18% -1.62%
YTD 22.60% -14.35% 36.95%
Best Year Worst Year
Index 2008 295.25% 2009 -26.74%
Benchmark 2008 18.69% 2009 -27.07%
Best Month Worst Month Best Quarter Worst Quarter
Rate Start End Rate Start End Rate Start End Rate Start End
Index 93.97% 1/1/2008 31/1/2008 -13.58% 1/12/2008 31/12/2008 90.60% 1/10/2008 1/1/2009 -12.59% 1/4/2009 1/7/2009
Benchmark 13.86% 1/10/2008 31/10/2008 -16.38% 1/9/2008 30/9/2008 12.66% 1/7/2011 1/10/2011 -15.40% 1/4/2009 1/7/2009
-30%
20%
70%
120%
170%
220%
270%
2006 2007 2008 2009 2010 2011 2012 2013 2014 2015 2016
Index Outperformance