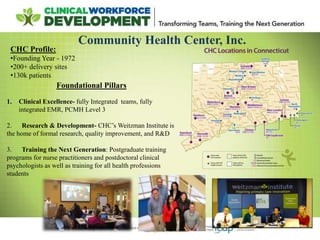
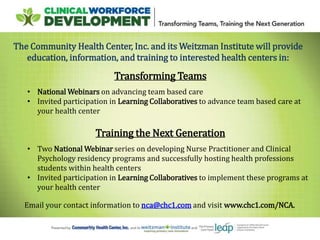
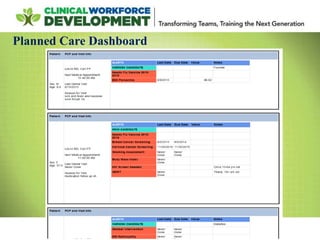
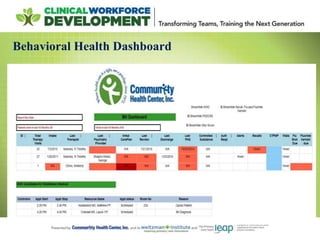
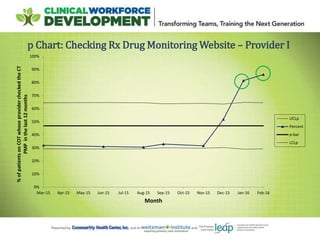
Welcome
The National Cooperative Agreement on
Advancing Team-Based Care
WEBINAR 4: Data Driven Dashboards to Support Team-Based Care
April 7th, 2016
Presented by the
the Community Health Center, Inc.
& the MacColl Center for Health Care Innovation
Speakers
From MacColl Center for Health Care Innovation, Group Health Research Institute:
Ed Wagner, MD, MPH, Director Emeritus
Brian Austin, Deputy Director
Katie Coleman, MSPH, Research Associate
From Community Health Center, Inc.:
Margaret Flinter, APRN, PhD, Senior Vice President & Clinical Director
Kerry Bamrick, MBA, Senior Program Manager
Veena Channamsetty, MD, Chief Medical Officer
Nicholas Ciaburri, BS, Director of Business Intelligence
Tierney Giannotti, MPA, Quality Improvement Data Analyst
Lori Clavette, RDH, Mobile Dental Program Manager
Ramon Clark, Medical Assistant
From Community Health Partners:
Lander Cooney, MS, Chief Executive Officer
Hannah Pulaski, MSN, RN, Nursing Director
Amber Traxinger, Data Analyst
Community Health Center, Inc.
Foundational Pillars
1. Clinical Excellence- fully Integrated teams, fully
integrated EMR, PCMH Level 3
2. Research & Development- CHC’s Weitzman Institute is
the home of formal research, quality improvement, and R&D
3. Training the Next Generation: Postgraduate training
programs for nurse practitioners and postdoctoral clinical
psychologists as well as training for all health professions
students
CHC Profile:
•Founding Year - 1972
•200+ delivery sites
•130k patients
The Community Health Center, Inc. and its Weitzman Institute will provide
education, information, and training to interested health centers in:
Transforming Teams
• National Webinars on advancing team based care
• Invited participation in Learning Collaboratives to advance team based care at
your health center
Training the Next Generation
• Two National Webinar series on developing Nurse Practitioner and Clinical
Psychology residency programs and successfully hosting health professions
students within health centers
• Invited participation in Learning Collaboratives to implement these programs at
your health center
Email your contact information to nca@chc1.com and visit www.chc1.com/NCA.
Learning Objectives:
1. Participants will be able to identify how two different members of the team
can utilize data driven dashboards.
2. Participants will be able to identify two potential impacts of using clinical
dashboards on UDS outcomes.
Get the Most Out of Your Zoom Experience
• Send your questions using Q&A function in Zoom
• Look for our polling questions
• Live tweet us at @CHCworkforceNCA and #primarycareteams and #HRSAnca
• Recording and slides are available after the presentation on our website within one week
• CME approved activity; requires survey completion
• Upcoming webinars: Register at www.chc1.com/nca
CHC’s Timeline in Using Data-Driven Dashboards
• 1970s: Participated in initiatives around
data collection using computers
• 2006: First fully integrated electronic
health record system
• eClinicalWorks
• 2010: Built our own data warehouse, for
reporting and data analysis
• Covers clinical, financial, and
Human Resources
• Currently: Integrating data and process
involvement with the goal of better
patient outcomes
Creating Effective Dashboards and Reports
• Team Based approach
• Each team member uses different sets of data, and gets a different dashboard
• Work with clinical leadership to identify the goal of the dashboard
• Work with care teams and clinical microsystems to determine what data is
useful to them and how it best fits in with their workflows
• Work with EHR staff to determine the best way to input the data
• Actionable Data
• Distributing the data to the team members that can take action on it
• Only include the data that is actionable – Too much data can be a bad thing!
Why develop my own reporting environment?
• Control
• Buying vs. Renting
• More transparent access to your data
• Flexibility
• Customize your dashboards and reports
as you see fit
• Combine your data with data from other
sources (payers, EHX’s, finance, HR,
etc.)
• Workflows
• Design your dashboards around your
workflows rather than your workflows
around your reporting tools
BI Data
Environment• Having Useful data starts with the EHR
• Structured Data
• Reformat the data to make reporting easier
• Include business rules
• Connect to data from other sources
• Format for easier reporting
• EHR’s are designed for inputting
data, not reporting
• Clean the data
• Exclude non-valid values
• Map data to categories
• Analytics Cube allows for drag-and-drop
high level data analytics
Utilizing Data Starts on the Front Lines
Our phone script
includes data on which
appointments the
patient is due for so that
we can schedule all of
their appointments at
once.
Planned Care Dashboard
Complex Care Management Dashboard
Behavioral Health Dashboard
Dental Dashboard
Dental Dashboard (continued)
Strategies for Success:
Using Measurement to Guide
Improvement
Chronic Opioid Dashboard: Background
• One example of using data to improve quality of care
• Developed to support care teams in management of
patients using chronic opioids
• November 2015: Grand Rounds on the management of
patients on chronic opioid therapy (COT)
• New and improved Opioid Dashboard unveiled
• Didactic information about managing COT patients
• Provider-specific report distributed
• Panel management time to review cases on the Opioid
Dashboard
Chronic Opioid Dashboard
Control Charts: Explanation
Lines on graphs:
• Solid line = average
• Dashed lines = 3 std dev limits
Patterns to Look For:
• Point(s) outside limits
• Shift (8 or more consecutive points
on same side of average)
• Trend (7 or more points with
consecutive increase or decrease)
Interpretation:
• Pattern absent = random variation
• Pattern present = significant ∆
0
10
20
30
40
50
60
70
80
90
100
Mar-15 Jun-15 Jul-15 Aug-15 Sep-15 Nov-15 Dec-15 Jan-16 Feb-16
Urine Toxicology Screening (past 6 months)
0
20
40
60
80
100
Mar-15 Jun-15 Jul-15 Aug-15 Sep-15 Nov-15 Dec-15 Jan-16 Feb-16
Pain Assessment (past 3 months)
statistically significant increase for one month
Opioid Measures: % Patients Meeting Measure
0
20
40
60
80
100
Mar-15 Jun-15 Jul-15 Aug-15 Sep-15 Nov-15 Dec-15 Jan-16 Feb-16
Opioid Agreement (ever)
0
20
40
60
80
100
Mar-15 Jun-15 Jul-15 Aug-15 Sep-15 Nov-15 Dec-15 Jan-16 Feb-16
Urine Toxicology Screening (past 6 months)
0
20
40
60
80
100
Mar-15 Jun-15 Jul-15 Aug-15 Sep-15 Nov-15 Dec-15 Jan-16 Feb-16
Patients Receiving Behavioral Health
(past 3 months)
0
20
40
60
80
100
Mar-15 Jun-15 Jul-15 Aug-15 Sep-15 Nov-15 Dec-15 Jan-16 Feb-16
Pain Assessment (past 3 months)
statistically significant increase for one month
0
20
40
60
80
100
Mar-15 Jun-15 Jul-15 Aug-15 Sep-15 Nov-15 Dec-15 Jan-16 Feb-16
Prescription Monitoring Drug Website Queried (12 months)
statistically significant increase for two months
p Chart: Checking Rx Drug Monitoring Website – Site I
0%
10%
20%
30%
40%
50%
60%
70%
80%
90%
100%
Mar-15 Apr-15 May-15 Jun-15 Jul-15 Aug-15 Sep-15 Oct-15 Nov-15 Dec-15 Jan-16 Feb-16
%ofpatientsonCOTwhoseproviderchecked
theCTPMPinthelast12months
Month
UCLp
Percent
p-bar
LCLp
statistically significant increase for one month
p Chart: Checking Rx Drug Monitoring Website – Provider I
0%
10%
20%
30%
40%
50%
60%
70%
80%
90%
100%
Mar-15 Apr-15 May-15 Jun-15 Jul-15 Aug-15 Sep-15 Oct-15 Nov-15 Dec-15 Jan-16 Feb-16
%ofpatientsonCOTwhoseprovidercheckedtheCT
PMPinthelast12months
Month
UCLp
Percent
p-bar
LCLp
Resource Spotlight #1
Resource Spotlight #2
www.improvingprimarycare.org
Community Health Partners, Inc.
• FQHC started in 1997, rural/frontier, ~130
employees, 6 sites
• Medical, dental, behavioral health, pharmacy,
and educational programming
• 12,000 patients during 45,000 visits in 2015
• NCQA-recognized Level 3 PCMH since 2012
• Live on NextGen EHR since April 2009, added
integrated EDR June 2012
Open Space for Discussion
Reminders
Sign up for our next webinar in this series:
A Team Approach to Prevention and Chronic Illness Management
Thurs., April 21st, 3–4 p.m. EST
Complete our survey!
Sign up at www.chc1.com/NCA

Advancing Team-Based Care:Data Driven Dashboards to Support Team Based Care

  • 1.
    Welcome The National CooperativeAgreement on Advancing Team-Based Care WEBINAR 4: Data Driven Dashboards to Support Team-Based Care April 7th, 2016 Presented by the the Community Health Center, Inc. & the MacColl Center for Health Care Innovation
  • 2.
    Speakers From MacColl Centerfor Health Care Innovation, Group Health Research Institute: Ed Wagner, MD, MPH, Director Emeritus Brian Austin, Deputy Director Katie Coleman, MSPH, Research Associate From Community Health Center, Inc.: Margaret Flinter, APRN, PhD, Senior Vice President & Clinical Director Kerry Bamrick, MBA, Senior Program Manager Veena Channamsetty, MD, Chief Medical Officer Nicholas Ciaburri, BS, Director of Business Intelligence Tierney Giannotti, MPA, Quality Improvement Data Analyst Lori Clavette, RDH, Mobile Dental Program Manager Ramon Clark, Medical Assistant From Community Health Partners: Lander Cooney, MS, Chief Executive Officer Hannah Pulaski, MSN, RN, Nursing Director Amber Traxinger, Data Analyst
  • 3.
    Community Health Center,Inc. Foundational Pillars 1. Clinical Excellence- fully Integrated teams, fully integrated EMR, PCMH Level 3 2. Research & Development- CHC’s Weitzman Institute is the home of formal research, quality improvement, and R&D 3. Training the Next Generation: Postgraduate training programs for nurse practitioners and postdoctoral clinical psychologists as well as training for all health professions students CHC Profile: •Founding Year - 1972 •200+ delivery sites •130k patients
  • 4.
    The Community HealthCenter, Inc. and its Weitzman Institute will provide education, information, and training to interested health centers in: Transforming Teams • National Webinars on advancing team based care • Invited participation in Learning Collaboratives to advance team based care at your health center Training the Next Generation • Two National Webinar series on developing Nurse Practitioner and Clinical Psychology residency programs and successfully hosting health professions students within health centers • Invited participation in Learning Collaboratives to implement these programs at your health center Email your contact information to nca@chc1.com and visit www.chc1.com/NCA.
  • 5.
    Learning Objectives: 1. Participantswill be able to identify how two different members of the team can utilize data driven dashboards. 2. Participants will be able to identify two potential impacts of using clinical dashboards on UDS outcomes.
  • 6.
    Get the MostOut of Your Zoom Experience • Send your questions using Q&A function in Zoom • Look for our polling questions • Live tweet us at @CHCworkforceNCA and #primarycareteams and #HRSAnca • Recording and slides are available after the presentation on our website within one week • CME approved activity; requires survey completion • Upcoming webinars: Register at www.chc1.com/nca
  • 7.
    CHC’s Timeline inUsing Data-Driven Dashboards • 1970s: Participated in initiatives around data collection using computers • 2006: First fully integrated electronic health record system • eClinicalWorks • 2010: Built our own data warehouse, for reporting and data analysis • Covers clinical, financial, and Human Resources • Currently: Integrating data and process involvement with the goal of better patient outcomes
  • 8.
    Creating Effective Dashboardsand Reports • Team Based approach • Each team member uses different sets of data, and gets a different dashboard • Work with clinical leadership to identify the goal of the dashboard • Work with care teams and clinical microsystems to determine what data is useful to them and how it best fits in with their workflows • Work with EHR staff to determine the best way to input the data • Actionable Data • Distributing the data to the team members that can take action on it • Only include the data that is actionable – Too much data can be a bad thing!
  • 9.
    Why develop myown reporting environment? • Control • Buying vs. Renting • More transparent access to your data • Flexibility • Customize your dashboards and reports as you see fit • Combine your data with data from other sources (payers, EHX’s, finance, HR, etc.) • Workflows • Design your dashboards around your workflows rather than your workflows around your reporting tools
  • 10.
    BI Data Environment• HavingUseful data starts with the EHR • Structured Data • Reformat the data to make reporting easier • Include business rules • Connect to data from other sources • Format for easier reporting • EHR’s are designed for inputting data, not reporting • Clean the data • Exclude non-valid values • Map data to categories • Analytics Cube allows for drag-and-drop high level data analytics
  • 11.
    Utilizing Data Startson the Front Lines Our phone script includes data on which appointments the patient is due for so that we can schedule all of their appointments at once.
  • 12.
  • 13.
  • 14.
  • 15.
  • 16.
  • 17.
    Strategies for Success: UsingMeasurement to Guide Improvement
  • 18.
    Chronic Opioid Dashboard:Background • One example of using data to improve quality of care • Developed to support care teams in management of patients using chronic opioids • November 2015: Grand Rounds on the management of patients on chronic opioid therapy (COT) • New and improved Opioid Dashboard unveiled • Didactic information about managing COT patients • Provider-specific report distributed • Panel management time to review cases on the Opioid Dashboard
  • 19.
  • 20.
    Control Charts: Explanation Lineson graphs: • Solid line = average • Dashed lines = 3 std dev limits Patterns to Look For: • Point(s) outside limits • Shift (8 or more consecutive points on same side of average) • Trend (7 or more points with consecutive increase or decrease) Interpretation: • Pattern absent = random variation • Pattern present = significant ∆ 0 10 20 30 40 50 60 70 80 90 100 Mar-15 Jun-15 Jul-15 Aug-15 Sep-15 Nov-15 Dec-15 Jan-16 Feb-16 Urine Toxicology Screening (past 6 months) 0 20 40 60 80 100 Mar-15 Jun-15 Jul-15 Aug-15 Sep-15 Nov-15 Dec-15 Jan-16 Feb-16 Pain Assessment (past 3 months) statistically significant increase for one month
  • 21.
    Opioid Measures: %Patients Meeting Measure 0 20 40 60 80 100 Mar-15 Jun-15 Jul-15 Aug-15 Sep-15 Nov-15 Dec-15 Jan-16 Feb-16 Opioid Agreement (ever) 0 20 40 60 80 100 Mar-15 Jun-15 Jul-15 Aug-15 Sep-15 Nov-15 Dec-15 Jan-16 Feb-16 Urine Toxicology Screening (past 6 months) 0 20 40 60 80 100 Mar-15 Jun-15 Jul-15 Aug-15 Sep-15 Nov-15 Dec-15 Jan-16 Feb-16 Patients Receiving Behavioral Health (past 3 months) 0 20 40 60 80 100 Mar-15 Jun-15 Jul-15 Aug-15 Sep-15 Nov-15 Dec-15 Jan-16 Feb-16 Pain Assessment (past 3 months) statistically significant increase for one month 0 20 40 60 80 100 Mar-15 Jun-15 Jul-15 Aug-15 Sep-15 Nov-15 Dec-15 Jan-16 Feb-16 Prescription Monitoring Drug Website Queried (12 months) statistically significant increase for two months
  • 22.
    p Chart: CheckingRx Drug Monitoring Website – Site I 0% 10% 20% 30% 40% 50% 60% 70% 80% 90% 100% Mar-15 Apr-15 May-15 Jun-15 Jul-15 Aug-15 Sep-15 Oct-15 Nov-15 Dec-15 Jan-16 Feb-16 %ofpatientsonCOTwhoseproviderchecked theCTPMPinthelast12months Month UCLp Percent p-bar LCLp statistically significant increase for one month
  • 23.
    p Chart: CheckingRx Drug Monitoring Website – Provider I 0% 10% 20% 30% 40% 50% 60% 70% 80% 90% 100% Mar-15 Apr-15 May-15 Jun-15 Jul-15 Aug-15 Sep-15 Oct-15 Nov-15 Dec-15 Jan-16 Feb-16 %ofpatientsonCOTwhoseprovidercheckedtheCT PMPinthelast12months Month UCLp Percent p-bar LCLp
  • 25.
  • 26.
  • 27.
  • 28.
  • 29.
    Community Health Partners,Inc. • FQHC started in 1997, rural/frontier, ~130 employees, 6 sites • Medical, dental, behavioral health, pharmacy, and educational programming • 12,000 patients during 45,000 visits in 2015 • NCQA-recognized Level 3 PCMH since 2012 • Live on NextGen EHR since April 2009, added integrated EDR June 2012
  • 30.
    Open Space forDiscussion
  • 31.
    Reminders Sign up forour next webinar in this series: A Team Approach to Prevention and Chronic Illness Management Thurs., April 21st, 3–4 p.m. EST Complete our survey! Sign up at www.chc1.com/NCA