Download to read offline


![Agenda (3:00-4:30)
3:00 5 min Welcome and Introductions
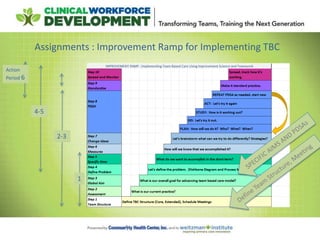
Putting it All Together : Improvement Ramp
3:05 10 min Action Period 2 Milestones and Challenges
3:15 35 min Using Data for Improvement
3:50 30 min TBC Improvement Work
-Healthcare for the Homeless Team
-Carolina Family Health Center Team
-The Children’s Clinic
4:20 10 min Path Forward and Resources [ Introduce Progress Check List]
Action Period 3 Assignments](https://image.slidesharecdn.com/ncatbcsession3dec142016-161214190944/85/NCA-TBC-Session-3-Dec-14-2016-13-320.jpg)


![Agenda (3:00-4:30)
3:00 5 min Welcome and Introductions
Putting it All Together : Improvement Ramp
3:05 10 min Action Period 2 Milestones and Challenges
3:15 35 min Using Data for Improvement
3:50 30 min TBC Improvement Work
-Healthcare for the Homeless Team
-Carolina Family Health Center Team
-The Children’s Clinic
4:20 10 min Path Forward and Resources [ Introduce Progress Check List]
Action Period 3 Assignments](https://image.slidesharecdn.com/ncatbcsession3dec142016-161214190944/85/NCA-TBC-Session-3-Dec-14-2016-65-320.jpg)


![Agenda (3:00-4:30)
3:00 5 min Welcome and Introductions
Putting it All Together : Improvement Ramp
3:05 10 min Action Period 2 Milestones and Challenges
3:15 35 min Using Data for Improvement
3:50 30 min TBC Improvement Work
-Healthcare for the Homeless Team
-Carolina Family Health Center Team
-The Children’s Clinic
4:20 10 min Path Forward and Resources [ Introduce Progress Check List]
Action Period 3 Assignments](https://image.slidesharecdn.com/ncatbcsession3dec142016-161214190944/85/NCA-TBC-Session-3-Dec-14-2016-84-320.jpg)


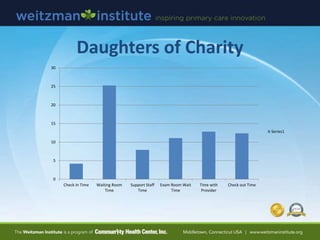
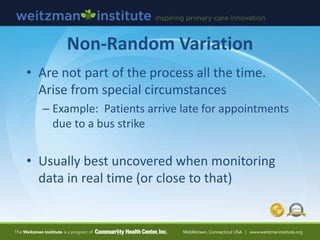
The document provides an agenda and materials for a session on developing team-based care capabilities. The session will include: 1) Summarizing progress and milestones from the previous six weeks, learning how to use data for improvement, and learning from specific aims and tests of change from various healthcare teams. 2) A presentation on using data for improvement, including displaying data over time, types of variation, and run charts. 3) Reports from three healthcare teams on their specific aims and tests of change from the previous period to improve team-based care. 4) Next steps and resources for the teams to continue their work in the coming six weeks.