Download as PDF, PPTX
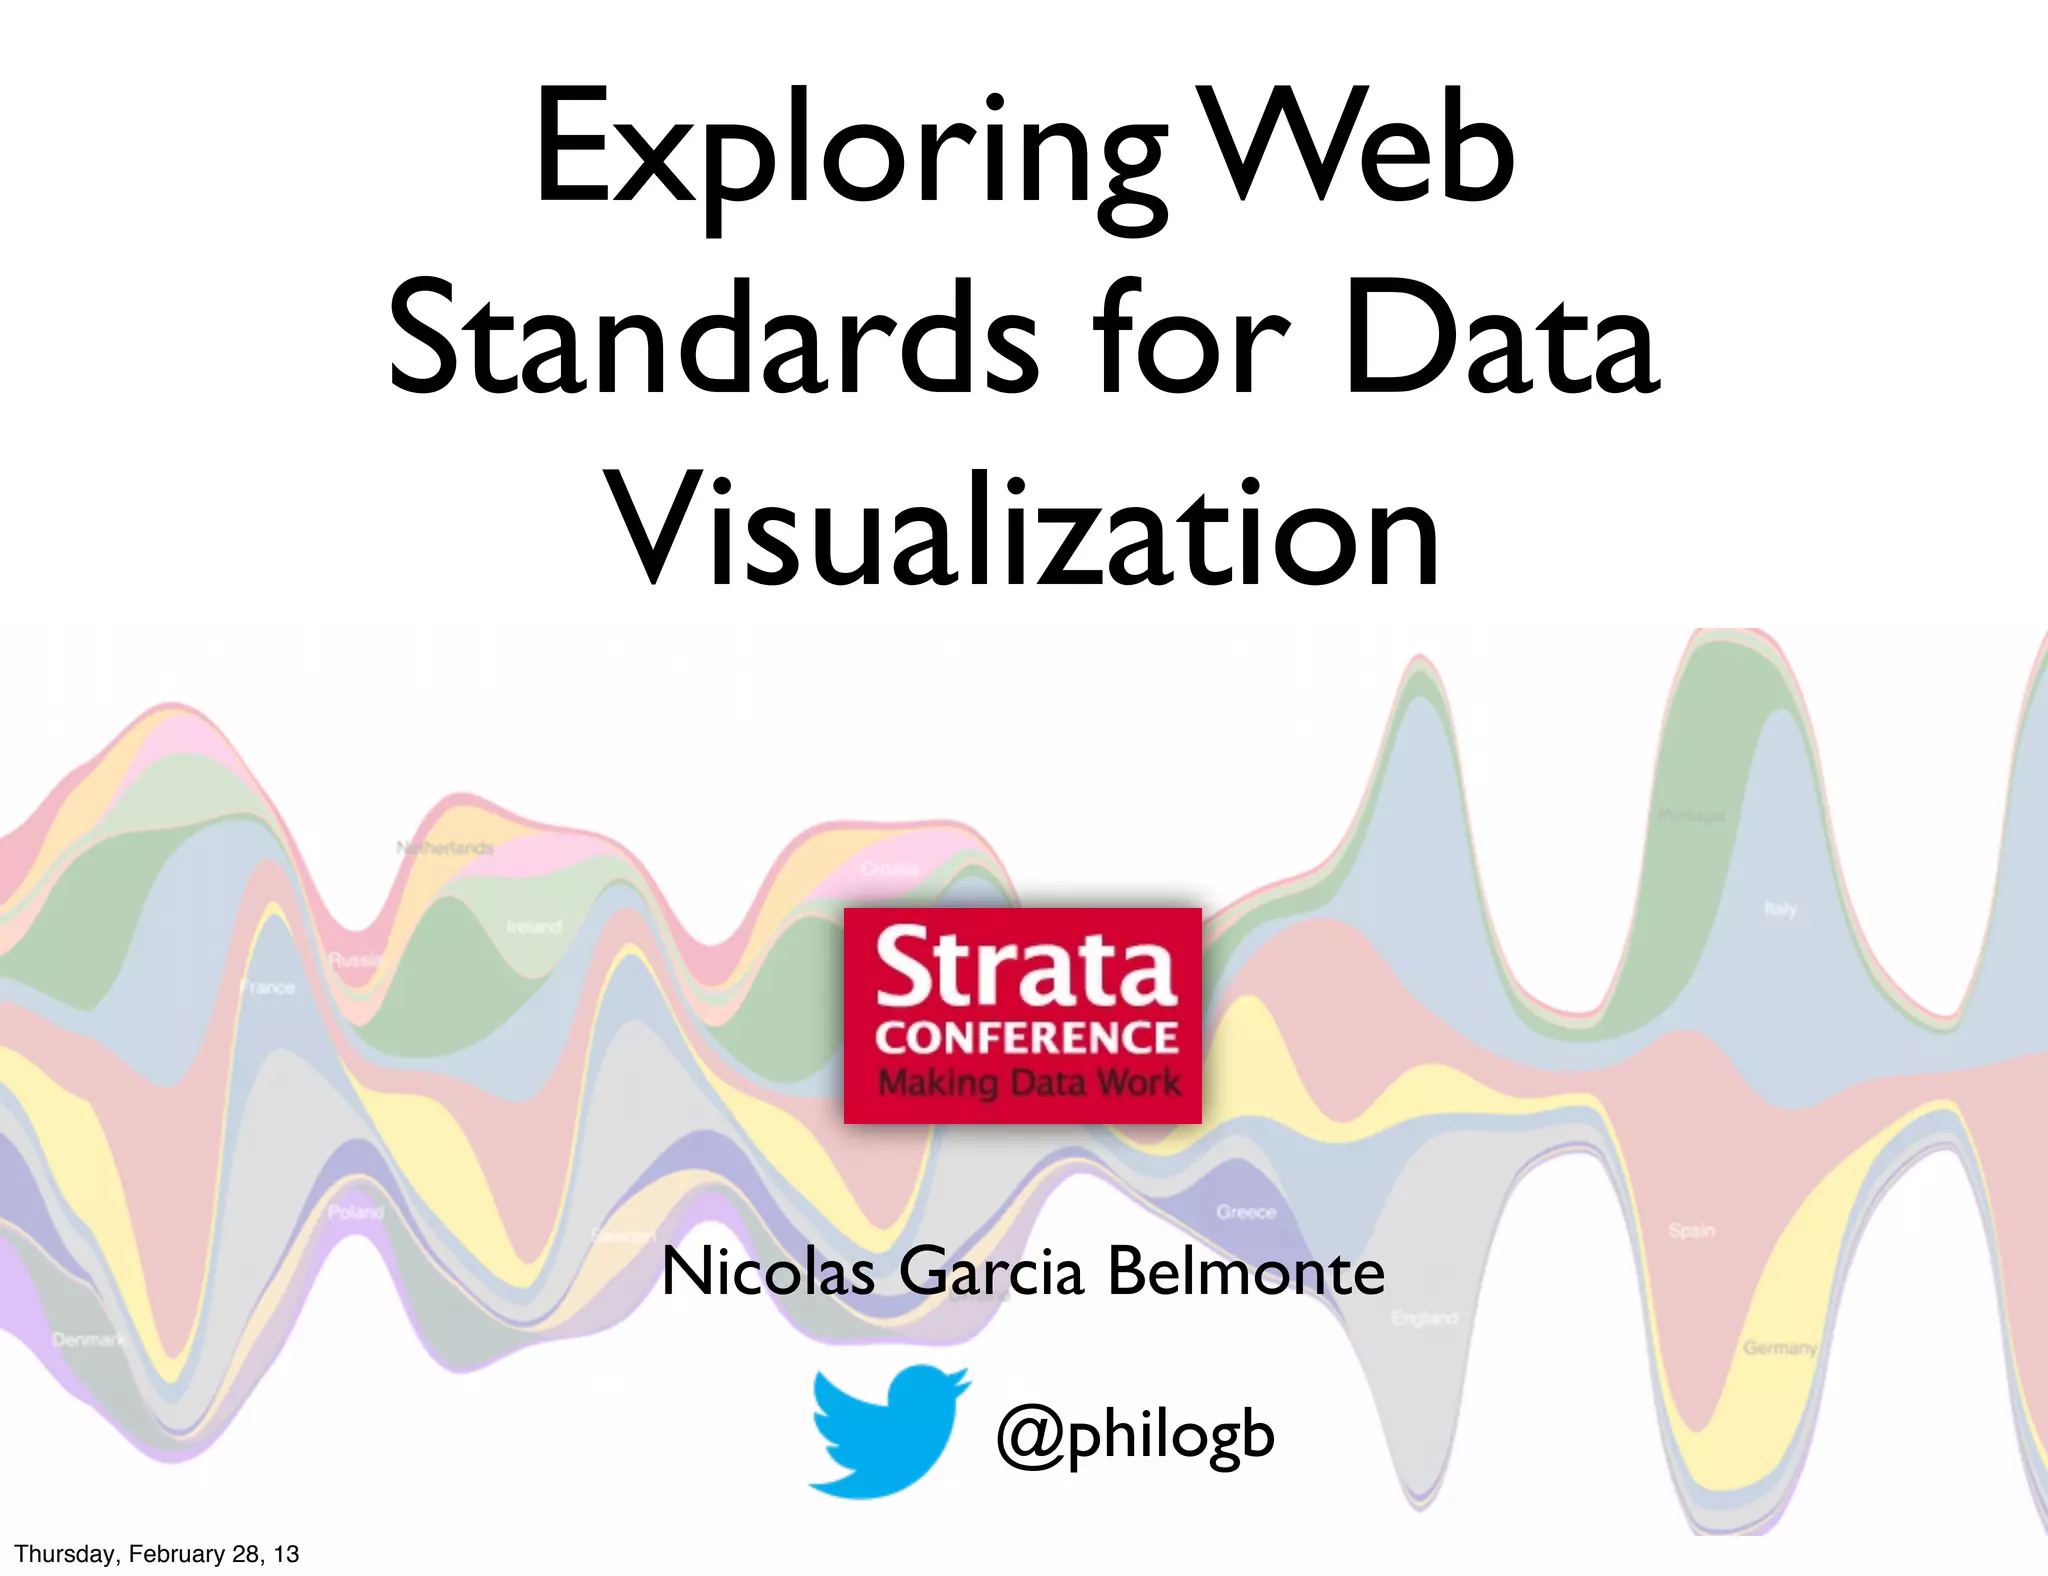
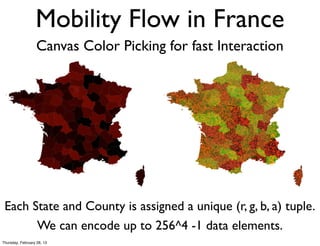
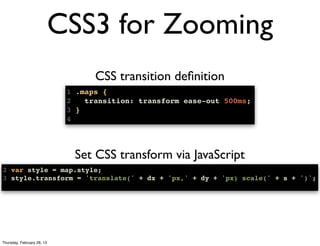
![2D Canvas Color Picking for fast Interaction
Offline: Encode index to county data array in colors
3 counties.forEach(function(county, i) {
4 var r = i % 256,
5 g = ((i / 256) >>> 0) % 256,
6 b = ((i / (256 * 256)) >>> 0) % 256;
7
8 county.setAttribute('fill', 'rgb(' + r + ',' + g + ',' + b + ')');
9 });
Online: Decode RGB color to array index
1 //decode index from image
2 function getCounty(canvas, counties, x, y) {
3 var imageData = canvas.getImageData(),
4 width = imageData.width,
5 data = imageData.data,
6 index = (x + y * width) * 4, //RGBA components
7 r = data[index],
8 g = data[index + 1],
9 b = data[index + 2],
10 i = r + (g + b * 256) * 256;
11
12 return counties[i];
13 }
Thursday, February 28, 13](https://image.slidesharecdn.com/talk-feb2013-exploringwebstandards-130228115945-phpapp01/85/Exploring-Web-standards-for-data-visualization-20-320.jpg)
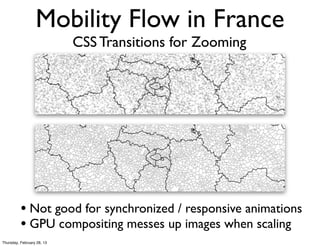
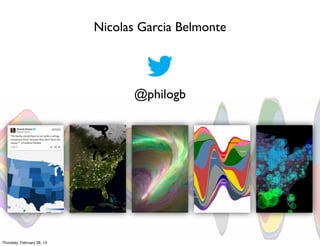
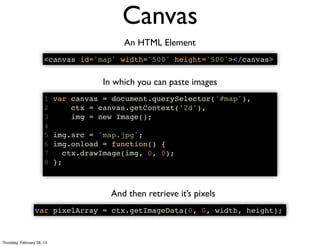
![//Create application
PhiloGL('canvasId', {
program: {
from: 'uris',
vs: 'shader.vs.glsl',
WebGL / PhiloGL
fs: 'shader.fs.glsl'
}, Rendering
camera: {
position: {
x: 0, y: 0, z: -50
}
},
textures: {
src: ['arroway.jpg', 'earth.jpg']
},
events: {
onDragMove: function(e) {
//do things...
},
onMouseWheel: function(e) {
//do things...
}
},
onError: function() {
alert("There was an error creating the app.");
},
onLoad: function(app) {
/* Do things here */
}
});
Thursday, February 28, 13](https://image.slidesharecdn.com/talk-feb2013-exploringwebstandards-130228115945-phpapp01/85/Exploring-Web-standards-for-data-visualization-33-320.jpg)

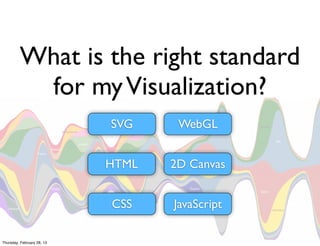
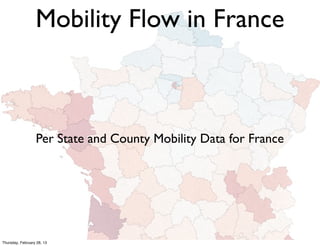
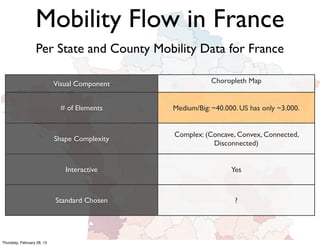
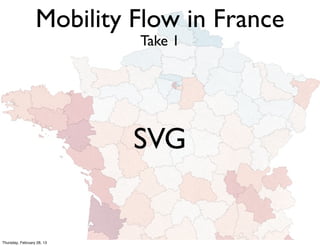
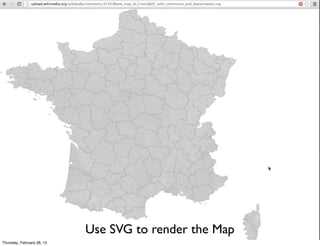
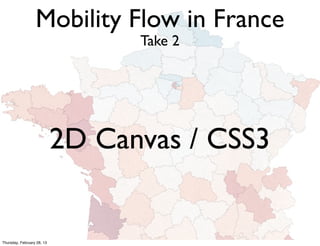
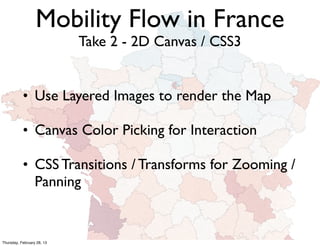
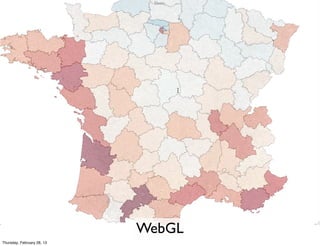
The document discusses various web standards for data visualization, including SVG, WebGL, HTML, and 2D canvas. It outlines the strengths and weaknesses of each standard based on different visualization needs, such as complexity, interactivity, and the number of elements. The author shares practical examples of rendering mobility flow data for France using these technologies.


![Getting Started with Apache Spark: Big Data Made Simple [Free Meetup]](https://cdn.slidesharecdn.com/ss_thumbnails/apachesparkgettingstarted-260203175547-8361bcc3-thumbnail.jpg?width=640&height=640&fit=bounds)


