Module 4:Advanced Characterization
Techniques
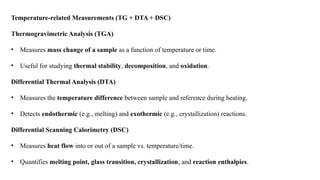
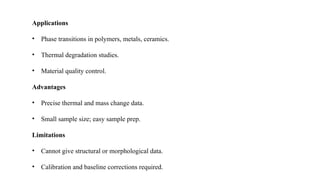
Introduction to Orientation Imaging Microscopy (OIM), 3-Dimensional
FIB/EBSD, Insitu testing facilities, Nano indentation, Combined
spectroscopy and microscopy techniques, Temperature related measurement
(TG+DTA) and DSC, Thermomechanical physical simulator, Gleeble,
Neutron diffraction techniques.
What is OIM?
• A technique used to study the crystallographic orientation of grains in
polycrystalline materials.
• Primarily implemented through Electron Backscatter Diffraction (EBSD) in a
Scanning Electron Microscope (SEM).
• Provides 2D or 3D maps of grain structure, orientation, and phase distribution.
How OIM Works
• Electron beam interacts with tilted sample → produces
Kikuchi patterns.
• Patterns are indexed to determine crystal orientation.
• Multiple points scanned to create orientation maps.
Key Outputs from OIM
• Inverse Pole Figure (IPF) maps
• Grain boundary maps
• Orientation Distribution Functions (ODF)
• Misorientation and strain maps (KAM)
Applications of OIM
• Analyzing grain size, texture, and boundary types.
• Studying phase transformations and recrystallization.
• Investigating deformation mechanisms in metals and ceramics.
• Quality control in advanced manufacturing processes.
Advantages of OIM
• High spatial resolution (down to ~20 nm).
• Fast data acquisition and automated analysis.
• Can be coupled with EDS for phase and composition mapping.
Limitations
• Surface must be flat and well-polished.
• Conductive coating needed for non-conductive samples.
• Resolution limited by SEM and EBSD detector
performance.
Recent Developments
• High-speed EBSD for faster mapping.
• In-situ OIM under mechanical or thermal loads.
• Integration with AI and machine learning for automated feature
recognition.
3-Dimensional
FIB/EBSD
What is 3D FIB/EBSD?
• Combines Focused Ion Beam (FIB) slicing with Electron
Backscatter Diffraction (EBSD).
• Reconstructs 3D microstructures layer-by-layer.
How It Works:
• FIB mills successive layers of the material.
• EBSD scans after each slice generate orientation maps.
• Data stacked using software to form a 3D model.
Applications:
• Study of grain morphology, phase distribution, and triple junctions.
• Analysis of recrystallization and deformation mechanisms.
• Used in additive manufacturing, geology, and metallurgy.
Advantages:
• True 3D microstructural insights.
• High spatial resolution (~50–100 nm).
Limitations:
• Time-consuming and destructive.
• Requires vacuum-compatible, conductive samples.
In-situ Testing Facilities
What is In-situ Testing?
• Real-time testing of materials under mechanical, thermal, or environmental stress.
• Performed inside SEM, TEM, X-ray, or neutron facilities.
Key Features:
• Visualizes deformation, crack growth, and phase transformations as they happen.
• Equipped with tensile/compression stages, heating elements, and environmental chambers.
• Often combined with EBSD, DIC, or spectroscopy.
Applications:
• Studying fracture mechanics, corrosion, and fatigue behavior.
• Battery research (e.g., electrode expansion).
• Biomedical implants under physiological conditions.
Advantages:
• Links material structure with real-time performance.
• Enables multi-physics testing (thermal, mechanical, electrical).
Limitations:
• Complex setup and calibration.
• Limited to micro-scale samples in many cases.
Nanoindentation
What is Nanoindentation?
• Measures mechanical properties (e.g., hardness, modulus) at the nano to micro-
scale.
• Uses a sharp indenter (e.g., Berkovich tip) with precise load-displacement
monitoring.
Working Principle:
• Load applied → indenter penetrates sample.
• Load-displacement curve analyzed (Oliver-Pharr method).
Key Measurements:
• Hardness (H)
• Elastic modulus (E)
• Time-dependent behavior (e.g., creep, viscoelasticity)
Applications:
• Thin films, coatings, MEMS devices.
• Biomedical materials (e.g., dental, bone coatings).
• Semiconductor and energy materials.
Advanced Modes:
• High-temperature nanoindentation
• Continuous stiffness measurement (CSM)
• AFM-nanoindentation hybrid systems
Advantages:
• High resolution in both force and depth.
• Localized property measurement.
Limitations:
• Sensitive to surface quality.
• Requires calibration and homogeneous test areas.
Combined Spectroscopy and Microscopy Techniques
What Are They?
• Integration of spectroscopy (chemical analysis) and microscopy
(spatial/structural analysis).
• Enables correlated chemical, structural, and morphological
characterization at micro to nano scales.
• Commonly used in materials science, nanotechnology, and life sciences.
Key Techniques & Combinations
1.SEM + EDS (Energy Dispersive X-ray Spectroscopy)
1. Provides element mapping with microstructure imaging.
2. Widely used in failure analysis and alloy characterization.
2.TEM + EELS (Electron Energy Loss Spectroscopy)
1. Offers atomic-scale imaging and chemical state analysis.
2. Suitable for studying defects, interfaces, and electronic structures.
3.AFM + Raman Spectroscopy
1. Combines topographical imaging with vibrational spectroscopy.
2. Ideal for 2D materials, polymers, and biomaterials.
4.SEM + CL (Cathodoluminescence)
1. Reveals optical/electronic properties along with morphology.
2. Used in semiconductors, geology, and optoelectronics.
5.ToF-SIMS + SEM
3. Combines high-resolution surface imaging and mass spectrometry.
4. Detects chemical species and isotopes at the nanoscale.
Applications
• Correlative analysis of structure–property relationships.
• Mapping of chemical composition, phase, and defects.
• Research in semiconductors, biomaterials, nanocomposites, and catalysis.
• Environmental studies (e.g., pollutant analysis on microstructures).
Advantages
• Multimodal datasets from a single sample region.
• High spatial + chemical resolution.
• Saves time and preserves sample integrity.
Limitations
• Instrument complexity and high cost.
• Requires careful alignment and calibration.
• Data interpretation can be challenging due to overlapping signals.
Temperature-related Measurements (TG + DTA + DSC)
Thermogravimetric Analysis (TGA)
• Measures mass change of a sample as a function of temperature or time.
• Useful for studying thermal stability, decomposition, and oxidation.
Differential Thermal Analysis (DTA)
• Measures the temperature difference between sample and reference during heating.
• Detects endothermic (e.g., melting) and exothermic (e.g., crystallization) reactions.
Differential Scanning Calorimetry (DSC)
• Measures heat flow into or out of a sample vs. temperature/time.
• Quantifies melting point, glass transition, crystallization, and reaction enthalpies.
TGA schematic diagram
DSC schematic diagram
DTA schematic diagram
Applications
• Phase transitions in polymers, metals, ceramics.
• Thermal degradation studies.
• Material quality control.
Advantages
• Precise thermal and mass change data.
• Small sample size; easy sample prep.
Limitations
• Cannot give structural or morphological data.
• Calibration and baseline corrections required.
Thermomechanical Physical Simulator
What It Is
• A lab-scale machine to simulate industrial thermo-mechanical processes (e.g., rolling,
forging, welding).
• Applies controlled heating, cooling, and deformation cycles to samples.
Functions
• Simulates real thermal-mechanical history of industrial processes.
• Produces realistic microstructures for study.
Features
• Programmable thermal profiles.
• Multi-axis deformation control.
• Real-time data capture (load, strain, temp).
Applications
• Welding simulations, phase transformation studies.
• Formability and heat treatment optimization.
Advantages
• Replicates complex industrial conditions.
• Enables microstructure-performance correlation.
Gleeble Thermomechanical Simulator
What is Gleeble?
• A high-precision thermomechanical testing system.
• Simulates industrial processing conditions like hot forming, quenching, and joining.
Capabilities
• Rapid heating/cooling (up to 10,000°C/s).
• Simultaneous mechanical loading (tensile/compressive).
• High-temp testing up to ~3000°C.
Key Applications
• Continuous casting, heat-affected zone (HAZ) simulation.
• Crack sensitivity testing in welds.
• Stress-strain behavior at elevated temps.
Advantages
• Full control of strain rate, temp, and force.
• Realistic simulation of real-world manufacturing.
• Supports metallurgical, mechanical, and failure analysis.
Neutron Diffraction Techniques
What is Neutron Diffraction?
• Uses neutron beams to study atomic arrangement and stresses in materials.
• Similar to X-ray diffraction but with deeper penetration.
Key Features
• Non-destructive, bulk material analysis.
• Sensitive to light elements (e.g., hydrogen).
• Can operate under in-situ conditions (temp, stress).
Applications
• Residual stress mapping in components (e.g., railway wheels, turbine blades).
• Crystal structure and texture analysis.
• Phase quantification and kinetics studies.
Advantages
• Deeper penetration than X-rays.
• Accurate internal stress and texture data.
• In-situ studies during heating/cooling or loading.
Limitations
• Requires access to a nuclear reactor or spallation source.
• Long data acquisition time.
Neutron Diffraction schematic diagram

Advanced material characterisation technique

  • 1.
    Module 4:Advanced Characterization Techniques Introductionto Orientation Imaging Microscopy (OIM), 3-Dimensional FIB/EBSD, Insitu testing facilities, Nano indentation, Combined spectroscopy and microscopy techniques, Temperature related measurement (TG+DTA) and DSC, Thermomechanical physical simulator, Gleeble, Neutron diffraction techniques.
  • 2.
    What is OIM? •A technique used to study the crystallographic orientation of grains in polycrystalline materials. • Primarily implemented through Electron Backscatter Diffraction (EBSD) in a Scanning Electron Microscope (SEM). • Provides 2D or 3D maps of grain structure, orientation, and phase distribution.
  • 4.
    How OIM Works •Electron beam interacts with tilted sample → produces Kikuchi patterns. • Patterns are indexed to determine crystal orientation. • Multiple points scanned to create orientation maps.
  • 5.
    Key Outputs fromOIM • Inverse Pole Figure (IPF) maps • Grain boundary maps • Orientation Distribution Functions (ODF) • Misorientation and strain maps (KAM)
  • 6.
    Applications of OIM •Analyzing grain size, texture, and boundary types. • Studying phase transformations and recrystallization. • Investigating deformation mechanisms in metals and ceramics. • Quality control in advanced manufacturing processes.
  • 7.
    Advantages of OIM •High spatial resolution (down to ~20 nm). • Fast data acquisition and automated analysis. • Can be coupled with EDS for phase and composition mapping.
  • 8.
    Limitations • Surface mustbe flat and well-polished. • Conductive coating needed for non-conductive samples. • Resolution limited by SEM and EBSD detector performance.
  • 9.
    Recent Developments • High-speedEBSD for faster mapping. • In-situ OIM under mechanical or thermal loads. • Integration with AI and machine learning for automated feature recognition.
  • 10.
  • 11.
    What is 3DFIB/EBSD? • Combines Focused Ion Beam (FIB) slicing with Electron Backscatter Diffraction (EBSD). • Reconstructs 3D microstructures layer-by-layer. How It Works: • FIB mills successive layers of the material. • EBSD scans after each slice generate orientation maps. • Data stacked using software to form a 3D model.
  • 12.
    Applications: • Study ofgrain morphology, phase distribution, and triple junctions. • Analysis of recrystallization and deformation mechanisms. • Used in additive manufacturing, geology, and metallurgy. Advantages: • True 3D microstructural insights. • High spatial resolution (~50–100 nm). Limitations: • Time-consuming and destructive. • Requires vacuum-compatible, conductive samples.
  • 13.
    In-situ Testing Facilities Whatis In-situ Testing? • Real-time testing of materials under mechanical, thermal, or environmental stress. • Performed inside SEM, TEM, X-ray, or neutron facilities. Key Features: • Visualizes deformation, crack growth, and phase transformations as they happen. • Equipped with tensile/compression stages, heating elements, and environmental chambers. • Often combined with EBSD, DIC, or spectroscopy.
  • 14.
    Applications: • Studying fracturemechanics, corrosion, and fatigue behavior. • Battery research (e.g., electrode expansion). • Biomedical implants under physiological conditions. Advantages: • Links material structure with real-time performance. • Enables multi-physics testing (thermal, mechanical, electrical). Limitations: • Complex setup and calibration. • Limited to micro-scale samples in many cases.
  • 15.
    Nanoindentation What is Nanoindentation? •Measures mechanical properties (e.g., hardness, modulus) at the nano to micro- scale. • Uses a sharp indenter (e.g., Berkovich tip) with precise load-displacement monitoring. Working Principle: • Load applied → indenter penetrates sample. • Load-displacement curve analyzed (Oliver-Pharr method). Key Measurements: • Hardness (H) • Elastic modulus (E) • Time-dependent behavior (e.g., creep, viscoelasticity)
  • 17.
    Applications: • Thin films,coatings, MEMS devices. • Biomedical materials (e.g., dental, bone coatings). • Semiconductor and energy materials. Advanced Modes: • High-temperature nanoindentation • Continuous stiffness measurement (CSM) • AFM-nanoindentation hybrid systems
  • 18.
    Advantages: • High resolutionin both force and depth. • Localized property measurement. Limitations: • Sensitive to surface quality. • Requires calibration and homogeneous test areas.
  • 19.
    Combined Spectroscopy andMicroscopy Techniques What Are They? • Integration of spectroscopy (chemical analysis) and microscopy (spatial/structural analysis). • Enables correlated chemical, structural, and morphological characterization at micro to nano scales. • Commonly used in materials science, nanotechnology, and life sciences.
  • 20.
    Key Techniques &Combinations 1.SEM + EDS (Energy Dispersive X-ray Spectroscopy) 1. Provides element mapping with microstructure imaging. 2. Widely used in failure analysis and alloy characterization. 2.TEM + EELS (Electron Energy Loss Spectroscopy) 1. Offers atomic-scale imaging and chemical state analysis. 2. Suitable for studying defects, interfaces, and electronic structures. 3.AFM + Raman Spectroscopy 1. Combines topographical imaging with vibrational spectroscopy. 2. Ideal for 2D materials, polymers, and biomaterials.
  • 21.
    4.SEM + CL(Cathodoluminescence) 1. Reveals optical/electronic properties along with morphology. 2. Used in semiconductors, geology, and optoelectronics. 5.ToF-SIMS + SEM 3. Combines high-resolution surface imaging and mass spectrometry. 4. Detects chemical species and isotopes at the nanoscale.
  • 22.
    Applications • Correlative analysisof structure–property relationships. • Mapping of chemical composition, phase, and defects. • Research in semiconductors, biomaterials, nanocomposites, and catalysis. • Environmental studies (e.g., pollutant analysis on microstructures). Advantages • Multimodal datasets from a single sample region. • High spatial + chemical resolution. • Saves time and preserves sample integrity. Limitations • Instrument complexity and high cost. • Requires careful alignment and calibration. • Data interpretation can be challenging due to overlapping signals.
  • 23.
    Temperature-related Measurements (TG+ DTA + DSC) Thermogravimetric Analysis (TGA) • Measures mass change of a sample as a function of temperature or time. • Useful for studying thermal stability, decomposition, and oxidation. Differential Thermal Analysis (DTA) • Measures the temperature difference between sample and reference during heating. • Detects endothermic (e.g., melting) and exothermic (e.g., crystallization) reactions. Differential Scanning Calorimetry (DSC) • Measures heat flow into or out of a sample vs. temperature/time. • Quantifies melting point, glass transition, crystallization, and reaction enthalpies.
  • 24.
  • 25.
  • 26.
  • 27.
    Applications • Phase transitionsin polymers, metals, ceramics. • Thermal degradation studies. • Material quality control. Advantages • Precise thermal and mass change data. • Small sample size; easy sample prep. Limitations • Cannot give structural or morphological data. • Calibration and baseline corrections required.
  • 28.
    Thermomechanical Physical Simulator WhatIt Is • A lab-scale machine to simulate industrial thermo-mechanical processes (e.g., rolling, forging, welding). • Applies controlled heating, cooling, and deformation cycles to samples. Functions • Simulates real thermal-mechanical history of industrial processes. • Produces realistic microstructures for study.
  • 29.
    Features • Programmable thermalprofiles. • Multi-axis deformation control. • Real-time data capture (load, strain, temp). Applications • Welding simulations, phase transformation studies. • Formability and heat treatment optimization. Advantages • Replicates complex industrial conditions. • Enables microstructure-performance correlation.
  • 30.
    Gleeble Thermomechanical Simulator Whatis Gleeble? • A high-precision thermomechanical testing system. • Simulates industrial processing conditions like hot forming, quenching, and joining. Capabilities • Rapid heating/cooling (up to 10,000°C/s). • Simultaneous mechanical loading (tensile/compressive). • High-temp testing up to ~3000°C. Key Applications • Continuous casting, heat-affected zone (HAZ) simulation. • Crack sensitivity testing in welds. • Stress-strain behavior at elevated temps. Advantages • Full control of strain rate, temp, and force. • Realistic simulation of real-world manufacturing. • Supports metallurgical, mechanical, and failure analysis.
  • 31.
    Neutron Diffraction Techniques Whatis Neutron Diffraction? • Uses neutron beams to study atomic arrangement and stresses in materials. • Similar to X-ray diffraction but with deeper penetration. Key Features • Non-destructive, bulk material analysis. • Sensitive to light elements (e.g., hydrogen). • Can operate under in-situ conditions (temp, stress). Applications • Residual stress mapping in components (e.g., railway wheels, turbine blades). • Crystal structure and texture analysis. • Phase quantification and kinetics studies. Advantages • Deeper penetration than X-rays. • Accurate internal stress and texture data. • In-situ studies during heating/cooling or loading. Limitations • Requires access to a nuclear reactor or spallation source. • Long data acquisition time.
  • 32.