Download to read offline


![Data Division
• Random Division (train_test_split(X, y, test_size=0.3, random_state=42)
• Kennord-Stone Division : Selecting the two data points that are
farthest apart in the feature space.
• Activity Based Division : Selecting specific activity or property in
predicting or modeling. Represent the full range of activity levels in the dataset.
• Euclidean Distance Based: Compute the Euclidean distance
between all pairs of data in a multidimensional space. (euclidean_distances =
np.linalg.norm(X[:, np.newaxis] - X, axis=2)
• K-Medois based: Clustering algorithm that divides data into groups.
(clusterer = KMedoids(n_clusters=K, random_state=0)](https://image.slidesharecdn.com/admet-231103150127-0f6cb92e/85/ADMET-pptx-6-320.jpg)
![Feature Selection
• Genetic Algorithm : GA’s feature selection is the process of choosing a
subset of the most relevant features (variables) from the original feature set to
improve model performance and reduce computational complexity.
ga = GeneticAlgorithm(num_features=X.shape[1], fitness_func=fitness_function)
• Lasso Feature Selection: Lasso (Least Absolute Shrinkage and
Selection Operator) adding a penalty term to the linear regression or logistic
regression cost function, which encourages the model to set the coefficients of some
features to zero, effectively removing them from the model.
lasso = sklearn.linear_model.Lasso(alpha=1.0)
• Stepwise Selection: select the most relevant features (Forward
Selection, Backward Elimination, Bidirectional Selection, Stopping Criteria)
rfe = sklearn.feature_selection.RFE(LogisticRegression(), 10) # Select the top 10 features](https://image.slidesharecdn.com/admet-231103150127-0f6cb92e/85/ADMET-pptx-7-320.jpg)


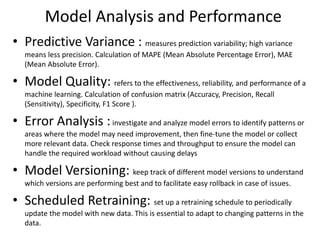


The document discusses optimizing drug discovery using ADMET (Absorption, Distribution, Metabolism, Excretion, and Toxicity) by employing machine learning techniques. It covers molecular representation, data selection from various online databases, feature selection methods, and learning algorithms for regression and classification tasks. Additionally, it highlights model analysis, performance evaluation, and model deployment strategies to handle data effectively in drug development.


![[DSC Europe 23][DigiHealth] Vesna Pajic - Machine Learning Techniques for omi...](https://cdn.slidesharecdn.com/ss_thumbnails/dxgiw6wysauhxm3dnays-vesna-pajic-machine-learning-techniques-for-omics-data-analysis-231130112724-c1268146-thumbnail.jpg?width=640&height=640&fit=bounds)


![[DSC Europe 25] Ivan Lukovic & Marija Djukic - From Data to Value: Why Maturi...](https://cdn.slidesharecdn.com/ss_thumbnails/ahrfps8xr6knowwhacxh-1-ivan-marija-dsc-2025-ld-v1-presentation-260115093812-be21adfc-thumbnail.jpg?width=640&height=640&fit=bounds)

![[DSC Europe 25] Nikola Vasiljevic - Player segmentation by combat playstyles ...](https://cdn.slidesharecdn.com/ss_thumbnails/mnvbf0yvrwaqsipzrrv3-2-nikola-vasiljevic-player-segmentation-by-playstyles-in-action-shooter-games-260114111931-b4d766cd-thumbnail.jpg?width=640&height=640&fit=bounds)


![[DSC Europe 25] Danilo Djukanovic - From Vibes to KPIs: Turning Culture Into ...](https://cdn.slidesharecdn.com/ss_thumbnails/inqestws5wf0cik2glgv-3-danilo-djukanovic-from-vibes-to-kpis-presentation-260114111931-dacff81f-thumbnail.jpg?width=640&height=640&fit=bounds)


![[DSC Europe 25] Dragan Jerosimovic - The Anatomy of a Narrative Simulation.pdf](https://cdn.slidesharecdn.com/ss_thumbnails/vzputuprdqr6zwbrwdcw-1-dragan-jerosimovic-the-anatomy-of-a-narrative-simulation-260114111931-9d04fba2-thumbnail.jpg?width=640&height=640&fit=bounds)

![[DSC Europe 25] Slobodan Dolinic - Smart and Intelligent Green Region.pptx](https://cdn.slidesharecdn.com/ss_thumbnails/0bribinjsp6ghwtvsvor-2-sigre-slobodan-dolinic-260115093812-c9c10e90-thumbnail.jpg?width=640&height=640&fit=bounds)

