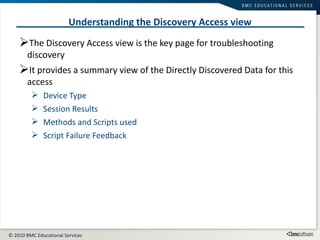
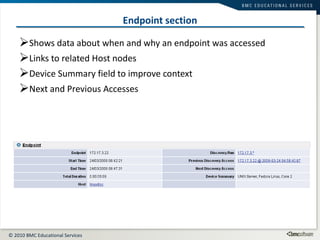
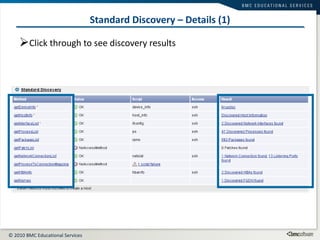
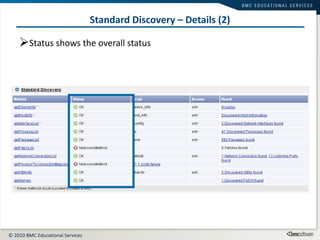
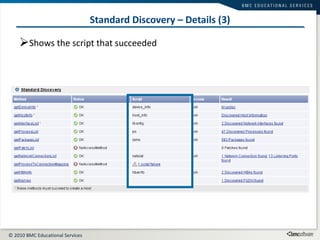
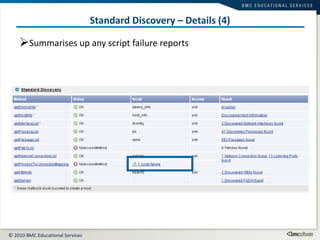
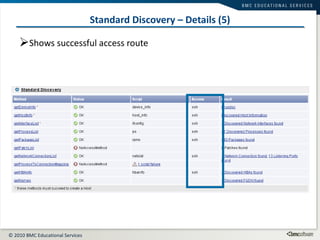
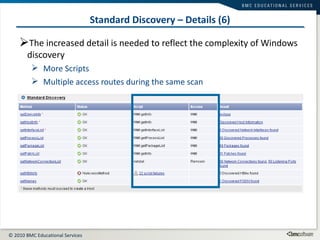
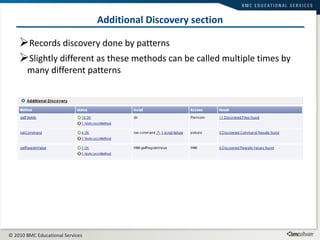
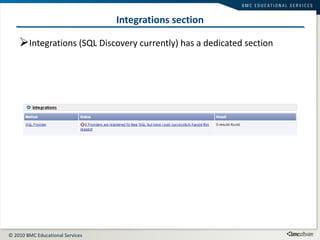
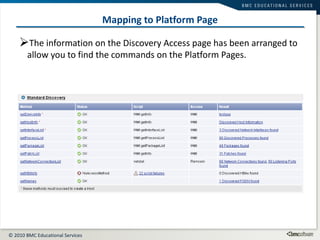
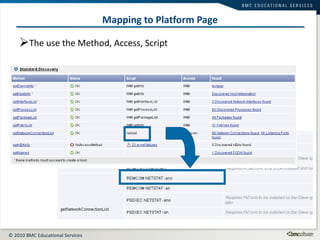
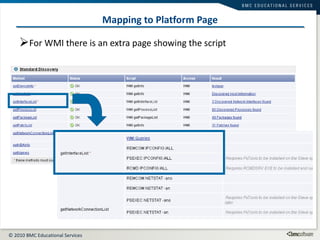
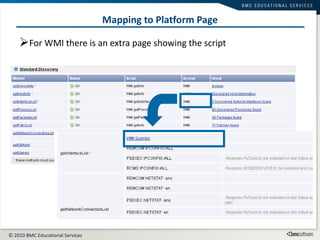
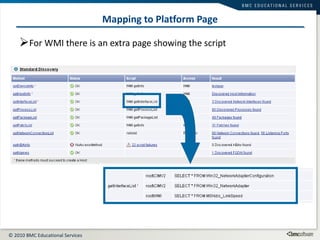
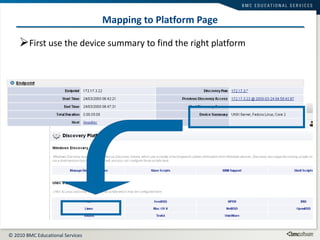
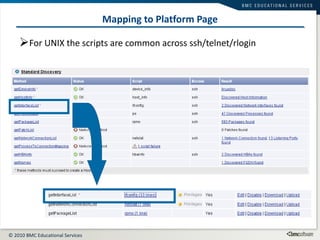
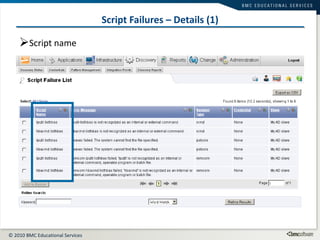
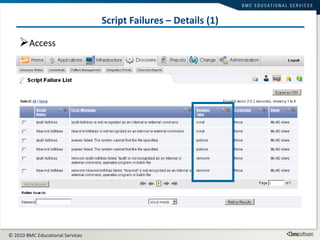
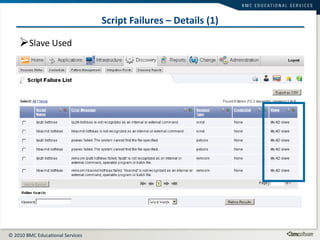
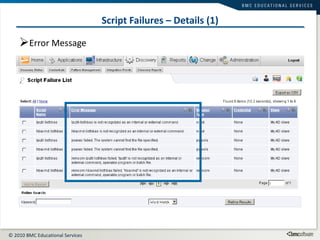
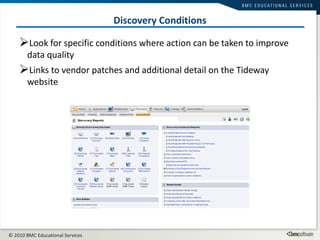
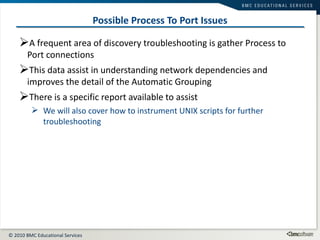
The document discusses troubleshooting discovery by understanding the Discovery Access page, which provides a summary of discovery sessions and results. It describes how to interpret the data on the page to identify issues and locate scripts that failed. The document also recommends specific reports and techniques for instrumenting scripts that can help troubleshoot common problems with discovery.
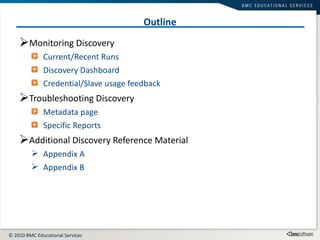
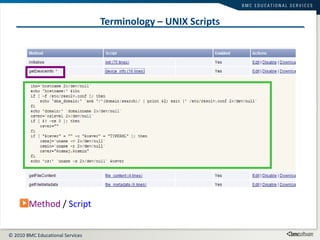
![Instrumenting UNIX Script Edit the script to add instrumentation Doesn’t happen out of the box Precede the command with tw_capture tw_capture <name> <command> [<args>..] <name> needs to be a unique identifier within that script tw_capture will record the exit code and stderr This will result in a CommandFailure node being created and linked to the discovery result But ONLY if the command fails](https://image.slidesharecdn.com/addmi-16-5-discoverytroubleshooting-110215160427-phpapp01/85/Addmi-16-5-discovery-troubleshooting-49-320.jpg)
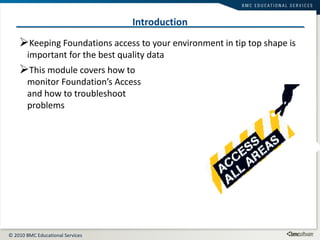
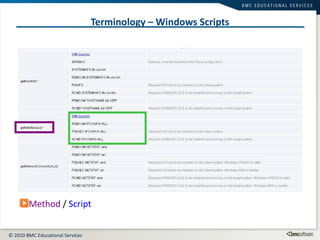
![CommandFailure: Enable tw_capture <name> <command> [<args>..] <name> needs to be a unique identifier within that script If used with PRIV_XXXX the tw_capture must go first tw_capture lsof_i PRIV_LSOF lsof -l -n -P -F ptPTn -i 2>/dev/null](https://image.slidesharecdn.com/addmi-16-5-discoverytroubleshooting-110215160427-phpapp01/85/Addmi-16-5-discovery-troubleshooting-52-320.jpg)


![5G Explained! A High Level Overview [Introduction]](https://cdn.slidesharecdn.com/ss_thumbnails/5gexplainedahighleveloverview-260119165306-cc137a3e-thumbnail.jpg?width=640&height=640&fit=bounds)


