Downloaded 21 times


![Who is Energy Census?
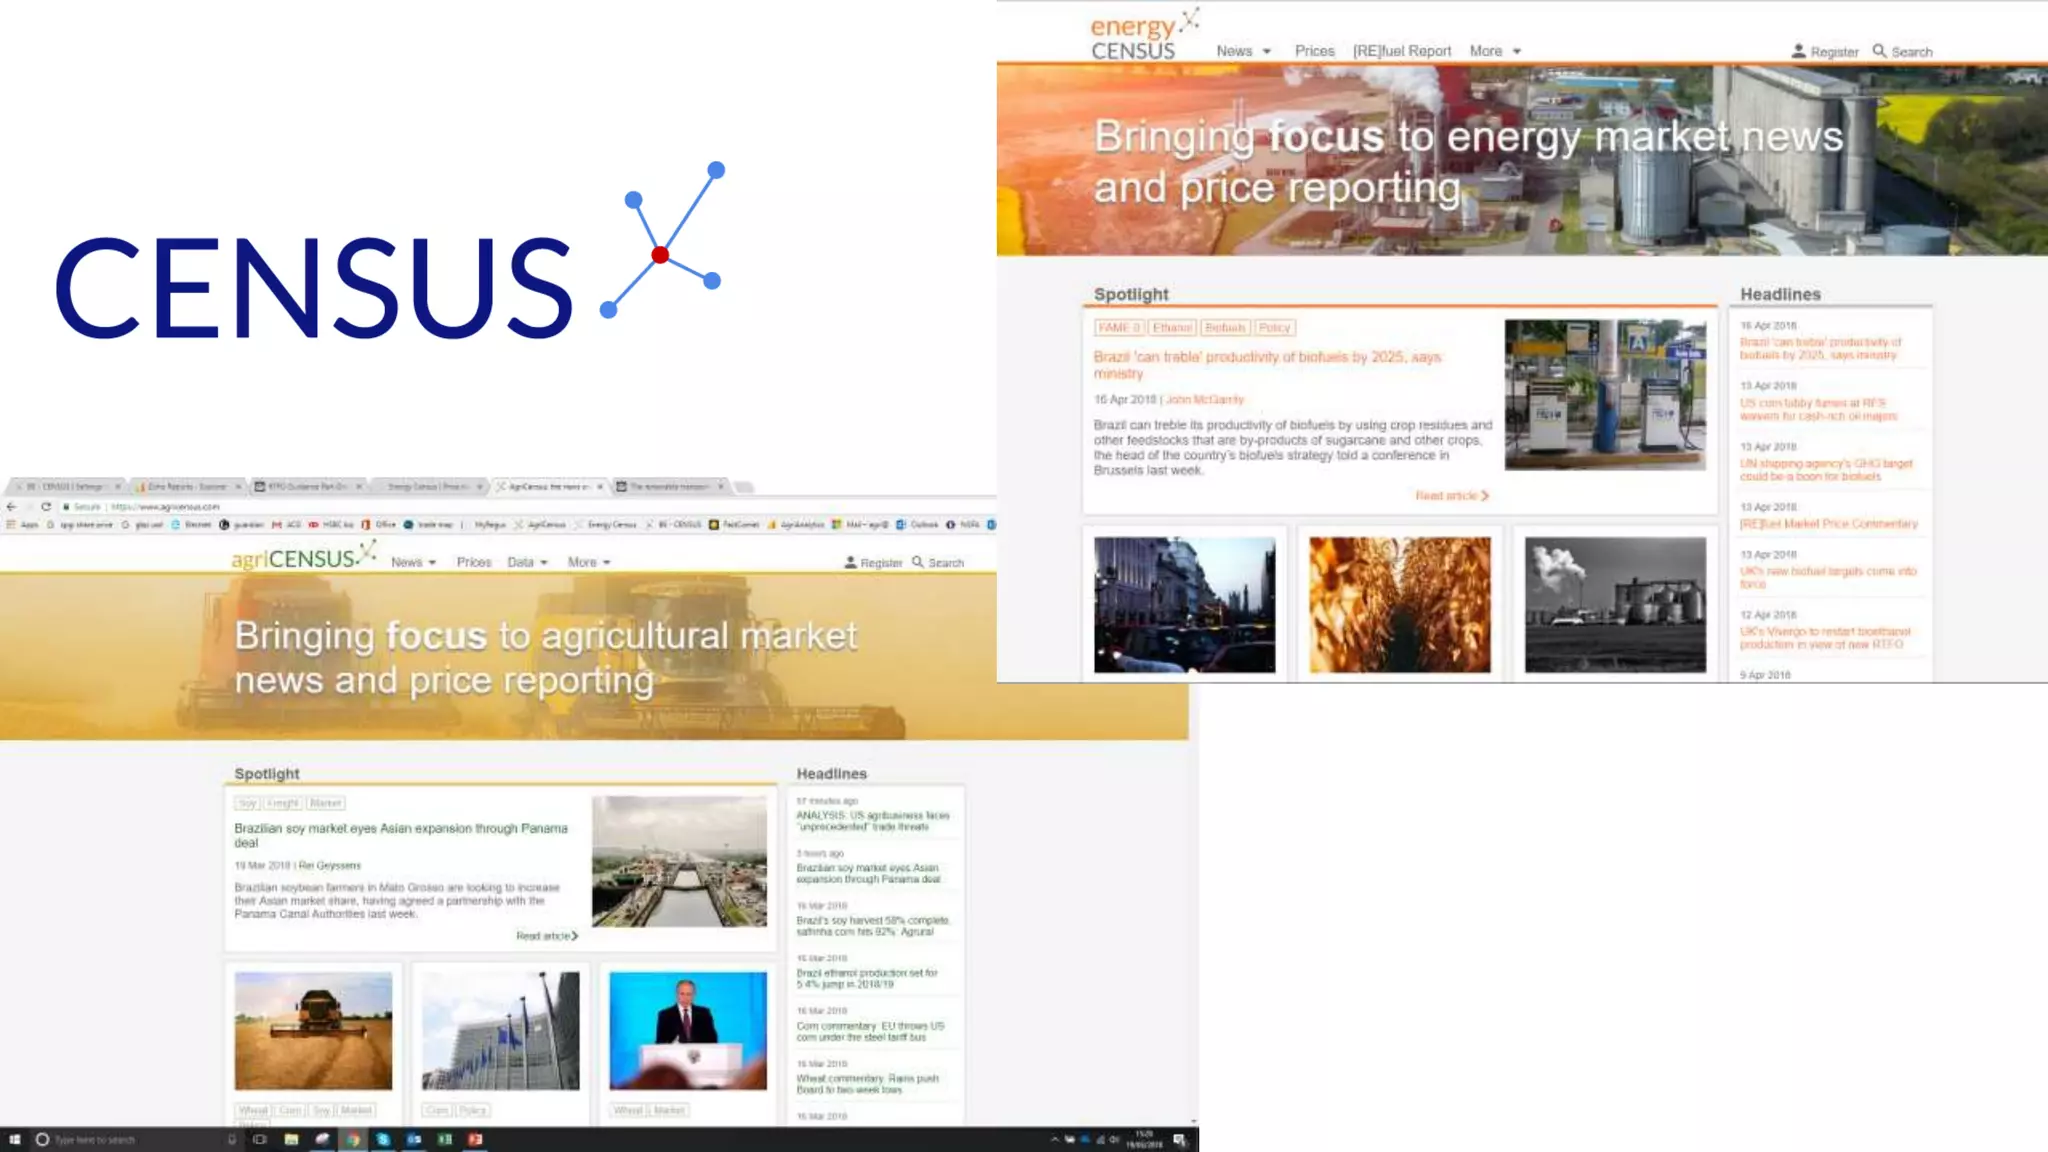
• Commodity news and price reporting agency
(PRA) for the biofuel and associated certificate
markets
• Independent unbiased prices that can be
used in trading contracts
• Prices and news published at
www.energycensus.com and in the weekly
[RE]fuel Report](https://image.slidesharecdn.com/springmembersmeeeting2018slideshare-180419133013/75/ADBA-Spring-Members-Meeting-2018-110-2048.jpg)

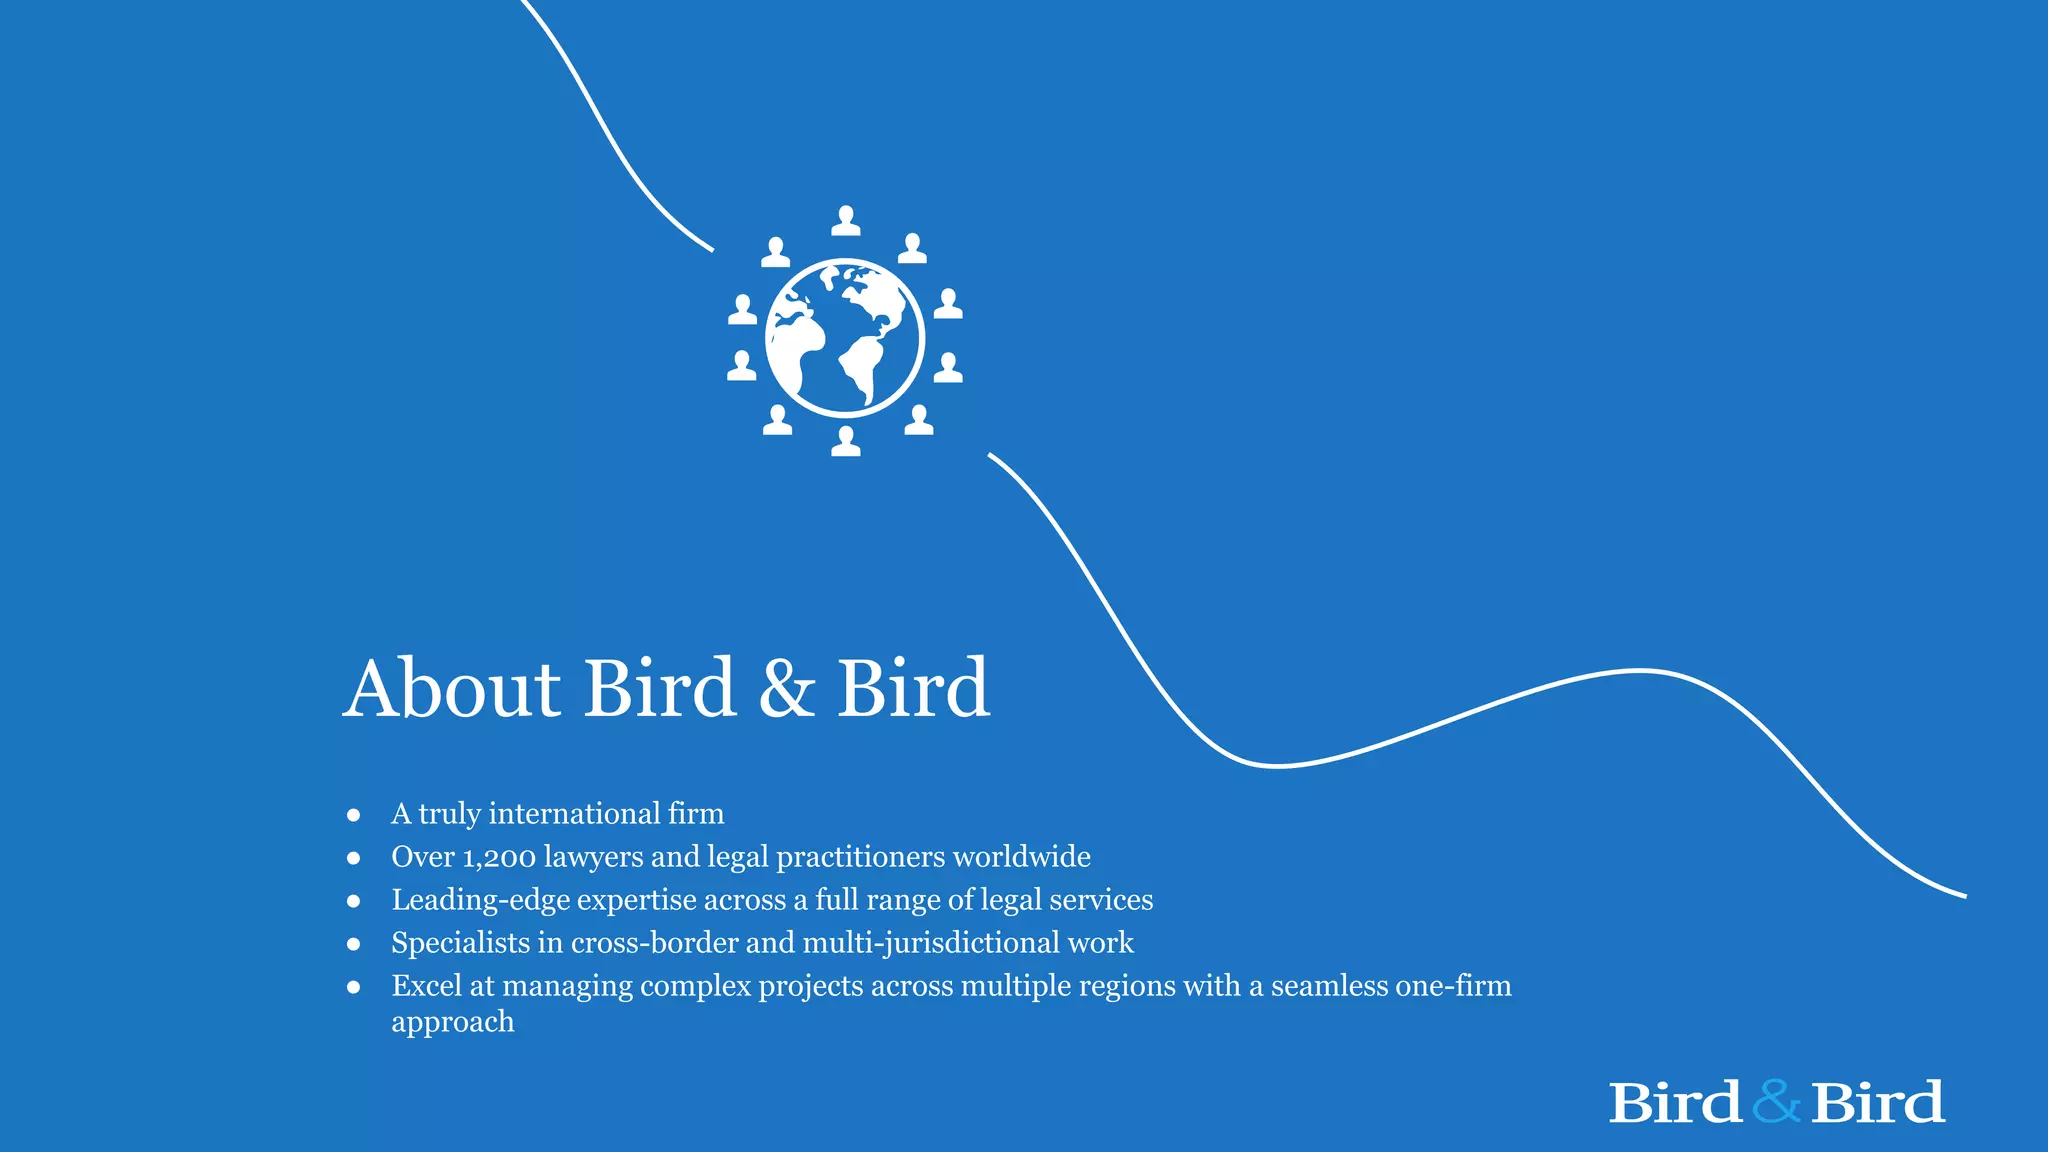
The document summarizes the agenda and presentations for the ADBA Spring Members Meeting held on 18 April 2018 at Bird & Bird LLP in London. Key topics included: 1. Welcome and introductions from Charlotte Morton of ADBA and Levent Gürdenli of Bird & Bird LLP. 2. An overview of Bird & Bird LLP as an international law firm and their energy and utilities practice. 3. A presentation on the political context for anaerobic digestion in the UK, including the potential impacts of Brexit, public finances, climate change targets, and opportunities for the industry. 4. An update on the Non-Domestic Renewable Heat Incentive and


