Downloaded 163 times

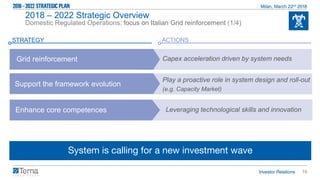
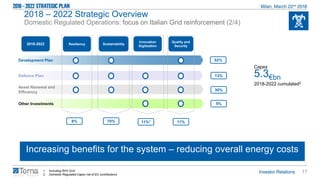
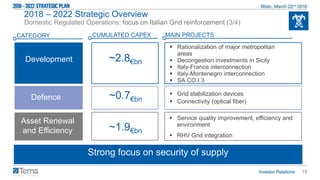
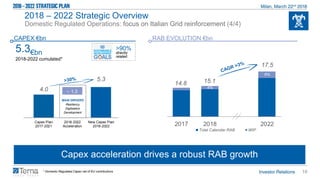
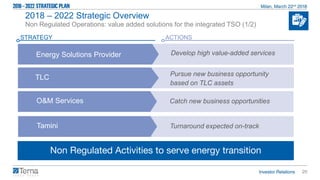
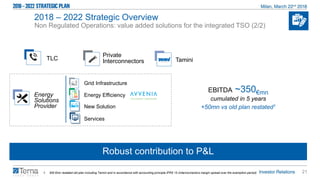
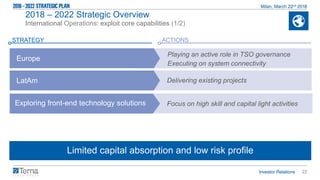
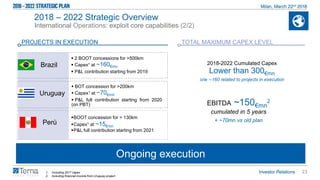
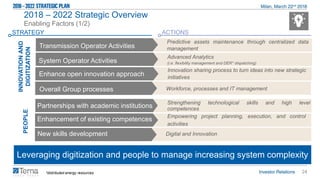
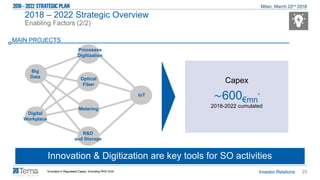
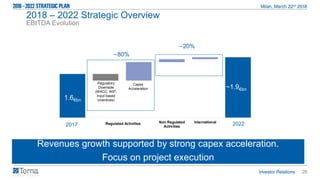
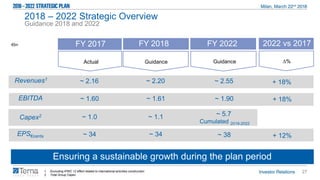

This document provides an agenda and overview for Terna's 2018-2022 strategic plan. The key points are: 1) Terna will focus on reinforcing Italy's transmission grid through accelerated investments of €5.3 billion from 2018-2022 to support the energy transition toward renewables and system reliability. 2) Non-regulated activities like energy solutions, telecommunications, and O&M services will contribute an estimated €350 million in EBITDA over the period. 3) International projects in Latin America will involve up to €300 million in limited-risk investments leveraging Terna's grid expertise. 4) Innovation and digitization are emphasized as enabling factors to manage increasing grid complexity through data


