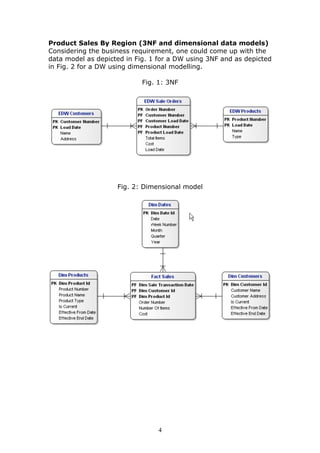
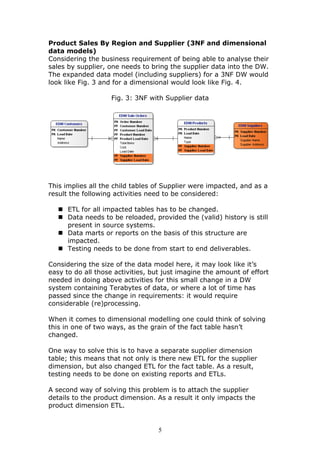
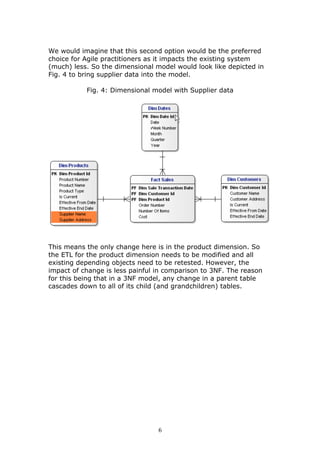
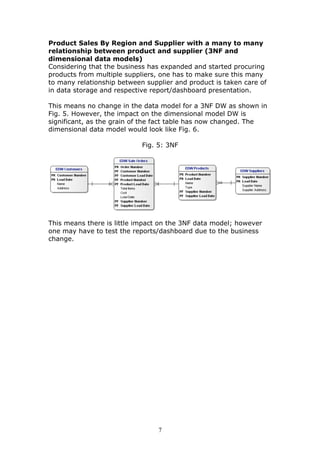
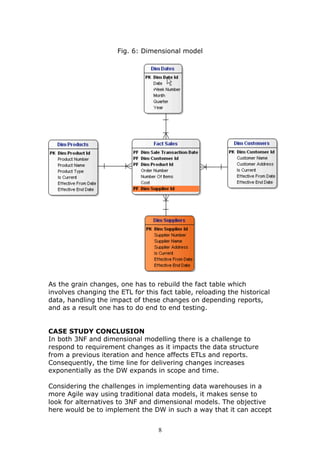
This document discusses adapting data warehouse architecture to benefit from agile methodologies. It presents a case study comparing traditional 3NF and dimensional data models to the Data Vault model. The case study shows that traditional models have challenges responding to changing requirements, while the Data Vault model more gracefully accommodates changes with minimal impact to the existing structure. The document concludes that agile development can be successfully adapted to data warehousing by using a hyper-normalized central hub like Data Vault that is resilient to changes in requirements.
International Refereed Journal of Engineering and Science (IRJES) irjes
International Refereed Journal of Engineering and Science (IRJES)
Ad hoc & sensor networks, Adaptive applications, Aeronautical Engineering, Aerospace Engineering
Agricultural Engineering, AI and Image Recognition, Allied engineering materials, Applied mechanics,
Architecture & Planning, Artificial intelligence, Audio Engineering, Automation and Mobile Robots
Automotive Engineering….
Plan ahead and act proficiently for reporting - Lessons LearnedEinar Karlsen
This presentation – held at Interconnect 2016 in Las Vegas - describes the top 10 mistakes an organization can make when deploying document generation tools in terms of implied costs, risk and impact. More importantly however it also gives you best practices as well as tips and tricks on how to avoid repeating those mistakes. The presentation is based on many years of experience in deploying document generation tools such as the IBM Rational Publishing Engine and the discussion takes it origin in real life examples.
SAS DATAFLUX DATA MANAGEMENT STUDIO TRAININGbidwhm
SAS DataFlux Management studio training,Technical support ,Outsourcing ,DataFlux Data Management Platform
Overview of DataFlux Data Management Studio
DataFlux Methodology: Plan, Act, and Monitor
Managing Repositories
Different types of Data Connections
Creating and Managing Data Collections
Creating , Setting , Working with Data Explorations
Introduction ,Creating Business Rules and Custom Metrics
Overview, Creating , Preparing of Data Profiles
This is my presentation at SQLBits 8, Brighton, 9th April 2011. This session is about advanced dimensional modelling topics such as Fact Table Primary Key, Vertical Fact Tables, Aggregate Fact Tables, SCD Type 6, Snapshotting Transaction Fact Tables, 1 or 2 Dimensions, Dealing with Currency Rates, When to Snowflake, Dimensions with Multi Valued Attributes, Transaction-Level Dimensions, Very Large Dimensions, A Dimension With Only 1 Attribute, Rapidly Changing Dimensions, Banding Dimension Rows, Stamping Dimension Rows and Real Time Fact Table. Prerequisites: You need have a basic knowledge of dimensional modelling and relational database design.
My name is Vincent Rainardi. I am a data warehouse & BI architect. I wrote a book on SQL Server data warehousing & BI, as well as many articles on my blog, www.datawarehouse.org.uk. I welcome questions and discussions on data warehousing on vrainardi@gmail.com. Enjoy the presentation.
BI Architecture in support of data qualityTom Breur
Business intelligence (BI) projects that involve substantial data integration have often proven failure prone and difficult to plan. Data quality issues trigger rework, which makes it difficult to accurately schedule deliverables. Two things can bring improvement. Firstly, one should deliver information products in the smallest possible chunks, but without adding prohibitive overhead for breaking up the work in tiny increments. This will increase the frequency and improve timeliness of feedback on suitability of information products and hence make planning and progress more predictable. Secondly, BI teams need to provide better stewardship when they facilitate discussions between departments whose data cannot easily be integrated. Many so-called data quality errors do not stem from inaccurate source data, but rather from incorrect interpretation of data. This is mostly caused by different interpretation of essentially the same underlying source system facts across departments with misaligned performance objectives. Such problems require prudent stakeholder management and informed negotiations to resolve such differences. In this chapter I suggest an innovation to data warehouse architecture to help accomplish these objectives.
Migrating existing projects to Rational solutionsEinar Karlsen
The benefits of introducing new IBM Rational tools into an existing
project often clearly outweigh the difficulties associated with making a change midstream. Read about the various techniques you can use to manage the process.
BPM-X Pattern-based model transformations (v2)BPM-Xchange
Model data conversions can be achieved with a pattern-based transformation engine, a component included into the BPM-Xchange® enterprise application integration (EAI) software.
An ontological approach to handle multidimensional schema evolution for data ...ijdms
In recent years, the number of digital information storage and retrieval systems has increased immensely.
Data warehousing has been found to be an extremely useful technology for integrating such heterogeneous
and autonomous information sources. Data within the data warehouse is modelled in the form of a star or
snowflake schema which facilitates business analysis in a multidimensional perspective. As user
requirements are interesting measures of business processes, the data warehouse schema is derived from
the information sources and business requirements. Due to the changing business scenario, the information
sources not only change their data, but also change their schema structure. In addition to the source
changes the business requirements for data warehouse may also change. Both these changes results in data
warehouse schema evolution. These changes can be handled either by just updating it in the DW model, or
can be developed as a new version of the DW structure. Existing approaches either deal with source
changes or requirements changes in a manual way and changes to the data warehouse schema is carried
out at the physical level. This may induce high maintenance costs and complex OLAP server
administration. As ontology seems to be a promising solution for the data warehouse research, in this
paper an ontological approach to automate the evolution of a data warehouse schema is proposed. This
method assists the data warehouse designer in handling evolution at the ontological level based on which
decision can be made to carry out the changes at the physical level. We evaluate the proposed ontological
approach with the existing method of manual adaptation of data warehouse schema.
Data marts,Types of Data Marts,Multidimensional Data Model,Fact table ,Dimension table ,Data Warehouse Schema,Star Schema,Snowflake Schema,Fact-Constellation Schema
USING FACTORY DESIGN PATTERNS IN MAP REDUCE DESIGN FOR BIG DATA ANALYTICSHCL Technologies
Though insights from Big Data gives a breakthrough to make better business decision, it poses its own set of challenges. This paper addresses the gap of Variety problem and suggest a way to seamlessly handle data processing even if there is change in data type/processing algorithm. It explores the various map reduce design patterns and comes out with a unified working solution (library). The library has the potential to ‘adapt’ itself to any data processing need which can be achieved by Map Reduce saving lot of man hours and enforce good practices in code.
Accelerating Machine Learning as a Service with Automated Feature EngineeringCognizant
Building scalable machine learning as a service, or MLaaS, is critical to enterprise success. Key to translate machine learning project success into program success is to solve the evolving convoluted data engineering challenge, using local and global data. Enabling sharing of data features across a multitude of models within and across various line of business is pivotal to program success.
Canadian Experts Discuss Modern Data Stacks and Cloud Computing for 5 Years o...Daniel Zivkovic
Two #ModernDataStack talks and one DevOps talk: https://youtu.be/4R--iLnjCmU
1. "From Data-driven Business to Business-driven Data: Hands-on #DataModelling exercise" by Jacob Frackson of Montreal Analytics
2. "Trends in the #DataEngineering Consulting Landscape" by Nadji Bessa of Infostrux Solutions
3. "Building Secure #Serverless Delivery Pipelines on #GCP" by Ugo Udokporo of Google Cloud Canada
We ran out of time for the 4th presenter, so the event will CONTINUE in March... stay tuned! Compliments of #ServerlessTO.
Distributed RDBMS: Data Distribution Policy: Part 3 - Changing Your Data Dist...ScaleBase
Distributed RDBMSs provide many scalability, availability and performance advantages.
This presentation takes a deeper look at distributed RDBMS efficiency over the long haul as application usage patterns, user requirements, and workloads change.
The presentation discusses:
1. Three stages of your data distribution policy’s life-cycle.
2. Adapting the distributed RDBMS to match application changes.
3. Ensuring that your distributed relational database is flexible and elastic enough to accommodate endless growth and change.
Chapter 3 • Nature of Data, Statistical Modeling, and Visuali.docxpoulterbarbara
Chapter 3 • Nature of Data, Statistical Modeling, and Visualization 185
of thousands of BI dashboards, scorecards, and BI interfaces used by businesses of all
sizes and industries, nonprofits, and government agencies.
According to Eckerson (2006), a well-known expert on BI in general and dash-
boards in particular, the most distinctive feature of a dashboard is its three layers of
information:
1. Monitoring: Graphical, abstracted data to monitor key performance metrics.
2. Analysis: Summarized dimensional data to analyze the root cause of problems.
3. Management: Detailed operational data that identify what actions to take to re-
solve a problem.
Because of these layers, dashboards pack a large amount of information into a sin-
gle screen. According to Few (2005), “The fundamental challenge of dashboard design is
to display all the required information on a single screen, clearly and without distraction,
in a manner that can be assimilated quickly.” To speed assimilation of the numbers, they
need to be placed in context. This can be done by comparing the numbers of interest to
other baseline or target numbers, by indicating whether the numbers are good or bad,
by denoting whether a trend is better or worse, and by using specialized display widgets
or components to set the comparative and evaluative context. Some of the common
comparisons that are typically made in BI systems include comparisons against past val-
ues, forecasted values, targeted values, benchmark or average values, multiple instances
of the same measure, and the values of other measures (e.g., revenues versus costs).
Even with comparative measures, it is important to specifically point out whether a
particular number is good or bad and whether it is trending in the right direction. Without
these types of evaluative designations, it can be time consuming to determine the status
of a particular number or result. Typically, either specialized visual objects (e.g., traffic
lights, dials, and gauges) or visual attributes (e.g., color coding) are used to set the evalu-
ative context. An interactive dashboard-driven reporting data exploration solution built by
an energy company is featured in Application Case 3.8.
Energy markets all around the world are going
through a significant change and transformation,
creating ample opportunities along with significant
challenges. As is the case in any industry, oppor-
tunities are attracting more players in the market-
place, increasing the competition, and reducing the
tolerances for less-than-optimal business decision
making. Success requires creating and disseminat-
ing accurate and timely information to whomever
whenever it is needed. For instance, if you need to
easily track marketing budgets, balance employee
workloads, and target customers with tailored mar-
keting messages, you would need three different
reporting solutions. Electrabel GDF SUEZ is doing
all of that for its marketing and sales business .
Migrating Data Warehouse Solutions from Oracle to non-Oracle DatabasesJade Global
Though there are many standardized data warehouse solutions in the industry today, many organizations want to migrate their data warehouses to Oracle based ones primarily because of its widely accepted user base and superb support.
This whitepaper is a step-by-step guide for migrating non-Oracle database solutions to Oracle ones.
At eMerge Technologies, we have integrated dozens of API’s over a period of 15 years. And in doing so, we have developed an “API integration process” that we feel is the best way to bridge two separate applications and have them work together in seamless harmony. For more: https://emergetech.com/api-integration-process/
Performance Analysis of Leading Application Lifecycle Management Systems for...Daniel van den Hoven
The performance of three leading application lifecycle management (ALM) systems (Rally by Rally Software, VersionOne by VersionOne, and JIRA+GreenHopper by Atlassian) was assessed to draw comparative performance observations when customer data exceeds a 500,000-
artifact threshold. The focus of this performance testing was how each system handles a
simulated “large” customer (i.e., a customer with half a million artifacts). A near-identical representative data set of 512,000 objects was constructed and populated in each system in order
to simulate identical use cases as closely as possible. Timed browser testing was performed to gauge the performance of common usage scenarios, and comparisons were then made. Nine tests were performed based on measurable, single-operation events
54 C o m m u n i C at i o n s o F t h e a C m | j u Ly 2 0 1 2 | v o L . 5 5 | n o . 7
practice
i
l
l
u
s
t
r
a
t
i
o
n
b
y
g
a
r
y
n
e
i
l
l
A r e s o f T wA r e M e T r i C s helpful tools or a waste of time?
For every developer who treasures these
mathematical abstractions of software systems
there is a developer who thinks software metrics are
invented just to keep project managers busy. Software
metrics can be very powerful tools that help achieve
your goals but it is important to use them correctly, as
they also have the power to demotivate project teams
and steer development in the wrong direction.
For the past 11 years, the Software Improvement
Group has advised hundreds of organizations
concerning software development and risk
management on the basis of software metrics.
We have used software metrics in more than 200
investigations in which we examined a single snapshot
of a system. Additionally, we use software metrics to
track the ongoing development effort of more than
400 systems. While executing these projects, we have
learned some pitfalls to avoid when using software
metrics in a project management setting. This
article addresses the four most important of these:
˲ Metric in a bubble;
˲ Treating the metric;
˲ One-track metric; and
˲ Metrics galore.
Knowing about these pitfalls will
help you recognize them and, hopeful-
ly, avoid them, which ultimately leads
to making your project successful. As
a software engineer, your knowledge
of these pitfalls helps you understand
why project managers want to use soft-
ware metrics and helps you assist the
managers when they are applying met-
rics in an inefficient manner. As an
outside consultant, you need to take
the pitfalls into account when pre-
senting advice and proposing actions.
Finally, if you are doing research in
the area of software metrics, knowing
these pitfalls will help place your new
metric in the right context when pre-
senting it to practitioners. Before div-
ing into the pitfalls, let’s look at why
software metrics can be considered a
useful tool.
software metrics steer People
“You get what you measure.” This
phrase definitely applies to software
project teams. No matter what you de-
fine as a metric, as soon as it is used to
evaluate a team, the value of the metric
moves toward the desired value. Thus,
to reach a particular goal, you can con-
tinuously measure properties of the
desired goal and plot these measure-
ments in a place visible to the team.
Ideally, the desired goal is plotted
alongside the current measurement to
indicate the distance to the goal.
Imagine a project in which the run-
time performance of a particular use
case is of critical importance. In this
case it helps to create a test in which
the execution time of the use case is
measured daily. By plotting this daily
data point against the desired value,
and making sure the team sees this
mea.
Accelerate your Kubernetes clusters with Varnish CachingThijs Feryn
A presentation about the usage and availability of Varnish on Kubernetes. This talk explores the capabilities of Varnish caching and shows how to use the Varnish Helm chart to deploy it to Kubernetes.
This presentation was delivered at K8SUG Singapore. See https://feryn.eu/presentations/accelerate-your-kubernetes-clusters-with-varnish-caching-k8sug-singapore-28-2024 for more details.
UiPath Test Automation using UiPath Test Suite series, part 4DianaGray10
Welcome to UiPath Test Automation using UiPath Test Suite series part 4. In this session, we will cover Test Manager overview along with SAP heatmap.
The UiPath Test Manager overview with SAP heatmap webinar offers a concise yet comprehensive exploration of the role of a Test Manager within SAP environments, coupled with the utilization of heatmaps for effective testing strategies.
Participants will gain insights into the responsibilities, challenges, and best practices associated with test management in SAP projects. Additionally, the webinar delves into the significance of heatmaps as a visual aid for identifying testing priorities, areas of risk, and resource allocation within SAP landscapes. Through this session, attendees can expect to enhance their understanding of test management principles while learning practical approaches to optimize testing processes in SAP environments using heatmap visualization techniques
What will you get from this session?
1. Insights into SAP testing best practices
2. Heatmap utilization for testing
3. Optimization of testing processes
4. Demo
Topics covered:
Execution from the test manager
Orchestrator execution result
Defect reporting
SAP heatmap example with demo
Speaker:
Deepak Rai, Automation Practice Lead, Boundaryless Group and UiPath MVP
DevOps and Testing slides at DASA ConnectKari Kakkonen
My and Rik Marselis slides at 30.5.2024 DASA Connect conference. We discuss about what is testing, then what is agile testing and finally what is Testing in DevOps. Finally we had lovely workshop with the participants trying to find out different ways to think about quality and testing in different parts of the DevOps infinity loop.
Securing your Kubernetes cluster_ a step-by-step guide to success !KatiaHIMEUR1
Today, after several years of existence, an extremely active community and an ultra-dynamic ecosystem, Kubernetes has established itself as the de facto standard in container orchestration. Thanks to a wide range of managed services, it has never been so easy to set up a ready-to-use Kubernetes cluster.
However, this ease of use means that the subject of security in Kubernetes is often left for later, or even neglected. This exposes companies to significant risks.
In this talk, I'll show you step-by-step how to secure your Kubernetes cluster for greater peace of mind and reliability.
Essentials of Automations: Optimizing FME Workflows with ParametersSafe Software
Are you looking to streamline your workflows and boost your projects’ efficiency? Do you find yourself searching for ways to add flexibility and control over your FME workflows? If so, you’re in the right place.
Join us for an insightful dive into the world of FME parameters, a critical element in optimizing workflow efficiency. This webinar marks the beginning of our three-part “Essentials of Automation” series. This first webinar is designed to equip you with the knowledge and skills to utilize parameters effectively: enhancing the flexibility, maintainability, and user control of your FME projects.
Here’s what you’ll gain:
- Essentials of FME Parameters: Understand the pivotal role of parameters, including Reader/Writer, Transformer, User, and FME Flow categories. Discover how they are the key to unlocking automation and optimization within your workflows.
- Practical Applications in FME Form: Delve into key user parameter types including choice, connections, and file URLs. Allow users to control how a workflow runs, making your workflows more reusable. Learn to import values and deliver the best user experience for your workflows while enhancing accuracy.
- Optimization Strategies in FME Flow: Explore the creation and strategic deployment of parameters in FME Flow, including the use of deployment and geometry parameters, to maximize workflow efficiency.
- Pro Tips for Success: Gain insights on parameterizing connections and leveraging new features like Conditional Visibility for clarity and simplicity.
We’ll wrap up with a glimpse into future webinars, followed by a Q&A session to address your specific questions surrounding this topic.
Don’t miss this opportunity to elevate your FME expertise and drive your projects to new heights of efficiency.
JMeter webinar - integration with InfluxDB and GrafanaRTTS
Watch this recorded webinar about real-time monitoring of application performance. See how to integrate Apache JMeter, the open-source leader in performance testing, with InfluxDB, the open-source time-series database, and Grafana, the open-source analytics and visualization application.
In this webinar, we will review the benefits of leveraging InfluxDB and Grafana when executing load tests and demonstrate how these tools are used to visualize performance metrics.
Length: 30 minutes
Session Overview
-------------------------------------------
During this webinar, we will cover the following topics while demonstrating the integrations of JMeter, InfluxDB and Grafana:
- What out-of-the-box solutions are available for real-time monitoring JMeter tests?
- What are the benefits of integrating InfluxDB and Grafana into the load testing stack?
- Which features are provided by Grafana?
- Demonstration of InfluxDB and Grafana using a practice web application
To view the webinar recording, go to:
https://www.rttsweb.com/jmeter-integration-webinar
GDG Cloud Southlake #33: Boule & Rebala: Effective AppSec in SDLC using Deplo...James Anderson
Effective Application Security in Software Delivery lifecycle using Deployment Firewall and DBOM
The modern software delivery process (or the CI/CD process) includes many tools, distributed teams, open-source code, and cloud platforms. Constant focus on speed to release software to market, along with the traditional slow and manual security checks has caused gaps in continuous security as an important piece in the software supply chain. Today organizations feel more susceptible to external and internal cyber threats due to the vast attack surface in their applications supply chain and the lack of end-to-end governance and risk management.
The software team must secure its software delivery process to avoid vulnerability and security breaches. This needs to be achieved with existing tool chains and without extensive rework of the delivery processes. This talk will present strategies and techniques for providing visibility into the true risk of the existing vulnerabilities, preventing the introduction of security issues in the software, resolving vulnerabilities in production environments quickly, and capturing the deployment bill of materials (DBOM).
Speakers:
Bob Boule
Robert Boule is a technology enthusiast with PASSION for technology and making things work along with a knack for helping others understand how things work. He comes with around 20 years of solution engineering experience in application security, software continuous delivery, and SaaS platforms. He is known for his dynamic presentations in CI/CD and application security integrated in software delivery lifecycle.
Gopinath Rebala
Gopinath Rebala is the CTO of OpsMx, where he has overall responsibility for the machine learning and data processing architectures for Secure Software Delivery. Gopi also has a strong connection with our customers, leading design and architecture for strategic implementations. Gopi is a frequent speaker and well-known leader in continuous delivery and integrating security into software delivery.
Transcript: Selling digital books in 2024: Insights from industry leaders - T...BookNet Canada
The publishing industry has been selling digital audiobooks and ebooks for over a decade and has found its groove. What’s changed? What has stayed the same? Where do we go from here? Join a group of leading sales peers from across the industry for a conversation about the lessons learned since the popularization of digital books, best practices, digital book supply chain management, and more.
Link to video recording: https://bnctechforum.ca/sessions/selling-digital-books-in-2024-insights-from-industry-leaders/
Presented by BookNet Canada on May 28, 2024, with support from the Department of Canadian Heritage.
Slack (or Teams) Automation for Bonterra Impact Management (fka Social Soluti...Jeffrey Haguewood
Sidekick Solutions uses Bonterra Impact Management (fka Social Solutions Apricot) and automation solutions to integrate data for business workflows.
We believe integration and automation are essential to user experience and the promise of efficient work through technology. Automation is the critical ingredient to realizing that full vision. We develop integration products and services for Bonterra Case Management software to support the deployment of automations for a variety of use cases.
This video focuses on the notifications, alerts, and approval requests using Slack for Bonterra Impact Management. The solutions covered in this webinar can also be deployed for Microsoft Teams.
Interested in deploying notification automations for Bonterra Impact Management? Contact us at sales@sidekicksolutionsllc.com to discuss next steps.
Builder.ai Founder Sachin Dev Duggal's Strategic Approach to Create an Innova...Ramesh Iyer
In today's fast-changing business world, Companies that adapt and embrace new ideas often need help to keep up with the competition. However, fostering a culture of innovation takes much work. It takes vision, leadership and willingness to take risks in the right proportion. Sachin Dev Duggal, co-founder of Builder.ai, has perfected the art of this balance, creating a company culture where creativity and growth are nurtured at each stage.
Neuro-symbolic is not enough, we need neuro-*semantic*Frank van Harmelen
Neuro-symbolic (NeSy) AI is on the rise. However, simply machine learning on just any symbolic structure is not sufficient to really harvest the gains of NeSy. These will only be gained when the symbolic structures have an actual semantics. I give an operational definition of semantics as “predictable inference”.
All of this illustrated with link prediction over knowledge graphs, but the argument is general.
LF Energy Webinar: Electrical Grid Modelling and Simulation Through PowSyBl -...DanBrown980551
Do you want to learn how to model and simulate an electrical network from scratch in under an hour?
Then welcome to this PowSyBl workshop, hosted by Rte, the French Transmission System Operator (TSO)!
During the webinar, you will discover the PowSyBl ecosystem as well as handle and study an electrical network through an interactive Python notebook.
PowSyBl is an open source project hosted by LF Energy, which offers a comprehensive set of features for electrical grid modelling and simulation. Among other advanced features, PowSyBl provides:
- A fully editable and extendable library for grid component modelling;
- Visualization tools to display your network;
- Grid simulation tools, such as power flows, security analyses (with or without remedial actions) and sensitivity analyses;
The framework is mostly written in Java, with a Python binding so that Python developers can access PowSyBl functionalities as well.
What you will learn during the webinar:
- For beginners: discover PowSyBl's functionalities through a quick general presentation and the notebook, without needing any expert coding skills;
- For advanced developers: master the skills to efficiently apply PowSyBl functionalities to your real-world scenarios.
LF Energy Webinar: Electrical Grid Modelling and Simulation Through PowSyBl -...
Adapting data warehouse architecture to benefit from agile methodologies
1. Adapting Data Warehouse Architecture to
Benefit from Agile methodologies
Badarinath Boyina & Tom Breur
March 2013
INTRODUCTION
Data warehouse (DW) projects are different from other software
development projects in that a data warehouse is a program, not a
project with a fixed set of start and end dates. Each phase of a DW
project can have a start and end date, but this doesn’t hold for the
DW in its entirety. It should therefore be considered an ongoing
process (Kimball et al, 2008). One could argue that a “purely”
departmental DW project could be limited in scope so that it
resembles a more traditional project, but more often than not at
some point in time a need for query and reporting across business
units arises, and the project will turn into a “normal” DW program
again.
The traditional waterfall methodology doesn’t seem to work very
well to control DW projects due to the nature of ever changing
requirements. Analysts firms like Gartner and Standish Group have
reported appallingly bad success statistics for DW projects. This is
why management might favour Agile methodologies for DW projects
to mitigate risks, and ensure better results.
There is uncertainty in any DW project, and that can come in one of
two “flavours”: means and ends uncertainty (Cohn, 2005). The
former refers to uncertainty as to how to deliver requested
functionality. The latter refers to uncertainty as to what exactly
should be delivered. Any software project has to cope with means
uncertainty, but in DW projects we are also faced with ends
uncertainty. Delivering (part of) the requested functionality
invariably leads to new information requests that then trigger calls
for new, unforeseen functionality. Lawrence Corr (Corr & Stagnito,
2011) refers to the accretive nature of business intelligence
requirements. Such is the intrinsic nature of DW projects, and this
reality and accompanying change needs to be built into the
development process.
One of the characteristics of agile software development is
“continuous refactoring.” This requires special attention in a DW
because new iterations of the data model should not invalidate
historical data that were previously loaded based on a prior data
model. Besides refactoring, changing requirements can also trigger
(unforeseen) expansion of scope or alterations of the current
1
2. version of the data model. As a result, data conversion (ETL) and
data validation (Testing) become necessary activities in subsequent
data warehouse iterations. Successful adaptation of Agile
development methodologies to data warehousing boils down to
minimising these ETL and Testing activities by choosing an
appropriate (efficient) architecture for the DW system.
This paper looks into specific challenges when applying Agile
development methodologies to traditional DW data models (i.e. 3NF
and dimensional). We will elaborate on a way to overcome these
problems to more successfully adapt Agile methodologies to DW
projects.
We will also look into two-tier versus three-tier DW architecture,
and why three-tier architectures are better suited to adapt Agile
development methodologies to data warehousing. We will highlight
how Inmon’s initial suggestion of modelling the central hub in third
normal form (3NF) provides insufficient flexibility to deal with
changes. Instead we will make a case for a hyper normalized hub to
connect source system data with end-user owned data marts.
Currently two popular data modelling paradigms for such a central
hub DW that employ hyper normalization are Data Vault (Linstedt,
2011) and Anchor Modelling (Rönnbäck,
www.anchormodeling.com).
AGILE METHODOLOGY
Agile software development refers to a group of software
development methodologies based on iterative development, where
requirements and solutions evolve through close collaboration
within self-organizing cross-functional teams. The term “Agile” was
coined in 2001 when the Agile Manifesto was formulated (2001).
Many different flavours of agile can be employed like Extreme
Programming, DSDM, Lean Software Development, Feature Driven
Development, or Scrum.
Software methods are considered more agile when they adhere to
the four principles of the Agile Manifesto (2001):
1. Individuals and interactions over processes and tools
2. Working software over comprehensive documentation
3. Customer collaboration over contract negotiation
4. Responding to change over following a plan
For this paper we are looking predominantly at the fourth point:
responding to change in the DW. How quickly and easily can one
respond to requirement changes? How little effort will this cost?
2
3. APPLYING AGILE METHODOLOGIES TO BUILD A DW
The “great debate” that raged between Ralph Kimball and Bill
Inmon in the late 90’s concerned whether one should build DW
systems using either 3NF or dimensional modelling. We will look at
adapting Agile methodologies to fulfil business requirement for both
of these DW modelling techniques. First we will look at 3NF
modelling and later dimensional modelling for a case study below to
highlight the pain points. Then we will look into a possible solution
to eliminate those pain points.
CASE STUDY
Let’s consider a case study for a retail business that (initially) wants
to analyse popularity of products. Let’s assume they have been
analysing their popular products in a certain region at some point in
time, and notice that the popularity of those products is degrading
rapidly 6 months down the line. Now the business wonders whether
this is due to a change of supplier for some of those products, and
they want to see evidence for this. As the data speaks for itself, the
requirement is to bring supplier data into the data warehouse.
Later, as business expands, they decide to procure products from
multiple suppliers in order to gain a competitive edge.
Speaking in Agile terminology, the first User Story is to fulfil the
requirement of analysing product popularity by customer region
over a period of time. The Story card might read something along
the lines of: “As a product marketer I want to compare sales across
regions so that I can know where to concentrate my market
activities to increase sales.”
The second User Story is to enable business to analyse their product
popularity by region and suppliers over the same period of time.
The Story card might read something like: “As a product marketer I
want to compare sales across regions and suppliers so that I can
identify a potential reason for sales degrade is due to change of
supplier.”
The third User Story is to make sure business still is able to do their
analysis as in the above two stories even after the business starts
procuring same products from multiple suppliers. The story card
might read something like: “ As a product marketer I want to
compare sales across regions and suppliers so that I can migrate
procurement to more cost effective parties.”
3
4. Product Sales By Region (3NF and dimensional data models)
Considering the business requirement, one could come up with the
data model as depicted in Fig. 1 for a DW using 3NF and as depicted
in Fig. 2 for a DW using dimensional modelling.
Fig. 1: 3NF
Fig. 2: Dimensional model
4
5. Product Sales By Region and Supplier (3NF and dimensional
data models)
Considering the business requirement of being able to analyse their
sales by supplier, one needs to bring the supplier data into the DW.
The expanded data model (including suppliers) for a 3NF DW would
look like Fig. 3 and for a dimensional would look like Fig. 4.
Fig. 3: 3NF with Supplier data
This implies all the child tables of Supplier were impacted, and as a
result the following activities need to be considered:
ETL for all impacted tables has to be changed.
Data needs to be reloaded, provided the (valid) history is still
present in source systems.
Data marts or reports on the basis of this structure are
impacted.
Testing needs to be done from start to end deliverables.
Considering the size of the data model here, it may look like it’s
easy to do all those activities, but just imagine the amount of effort
needed in doing above activities for this small change in a DW
system containing Terabytes of data, or where a lot of time has
passed since the change in requirements: it would require
considerable (re)processing.
When it comes to dimensional modelling one could think of solving
this in one of two ways, as the grain of the fact table hasn’t
changed.
One way to solve this is to have a separate supplier dimension
table; this means that not only is there new ETL for the supplier
dimension, but also changed ETL for the fact table. As a result,
testing needs to be done on existing reports and ETLs.
A second way of solving this problem is to attach the supplier
details to the product dimension. As a result it only impacts the
product dimension ETL.
5
6. We would imagine that this second option would be the preferred
choice for Agile practitioners as it impacts the existing system
(much) less. So the dimensional model would look like depicted in
Fig. 4 to bring supplier data into the model.
Fig. 4: Dimensional model with Supplier data
This means the only change here is in the product dimension. So
the ETL for the product dimension needs to be modified and all
existing depending objects need to be retested. However, the
impact of change is less painful in comparison to 3NF. The reason
for this being that in a 3NF model, any change in a parent table
cascades down to all of its child (and grandchildren) tables.
6
7. Product Sales By Region and Supplier with a many to many
relationship between product and supplier (3NF and
dimensional data models)
Considering that the business has expanded and started procuring
products from multiple suppliers, one has to make sure this many
to many relationship between supplier and product is taken care of
in data storage and respective report/dashboard presentation.
This means no change in the data model for a 3NF DW as shown in
Fig. 5. However, the impact on the dimensional model DW is
significant, as the grain of the fact table has now changed. The
dimensional data model would look like Fig. 6.
Fig. 5: 3NF
This means there is little impact on the 3NF data model; however
one may have to test the reports/dashboard due to the business
change.
7
8. Fig. 6: Dimensional model
As the grain changes, one has to rebuild the fact table which
involves changing the ETL for this fact table, reloading the historical
data, handling the impact of these changes on depending reports,
and as a result one has to do end to end testing.
CASE STUDY CONCLUSION
In both 3NF and dimensional modelling there is a challenge to
respond to requirement changes as it impacts the data structure
from a previous iteration and hence affects ETLs and reports.
Consequently, the time line for delivering changes increases
exponentially as the DW expands in scope and time.
Considering the challenges in implementing data warehouses in a
more Agile way using traditional data models, it makes sense to
look for alternatives to 3NF and dimensional models. The objective
here would be to implement the DW in such a way that it can accept
8
9. changes more gracefully. It reminds us of the Chinese proverb:
“Unless you change direction, you are apt to end up where you are
headed.”
A HYPER NORMALIZED DATA MODELLING ALTERNATIVE:
DATA VAULT
In the search for an alternative approach, we came across Data
Vault data modelling as originally promoted by Dan Linstedt for DW
systems (Linstedt, 2011, or Hultgren, 2012). Data Vault (DV) has
the concept of separating business keys from descriptive attributes.
Business keys are generally static, whereas descriptive attributes
tend to be dynamic. A business key is the information that the
business (not IT) uses to uniquely identify an important entity like
“Customer”, “Sale”, “Shipment”, etc. This suggests keeping the
history of all descriptive attributes at an atomic level to be able to
meet changing demands inexpensively, irrespective of business
requirements. End-user requirements are reporting requests, not
storage directives.
The Data Vault approach to data warehousing is similar to Bill
Inmon’s approach of a three-tiered architecture (3NF), but (vastly)
different in the way source system facts get stored in the central
hub. Among others, the choice to connect Hub tables via many-to-
many Link tables provides an “insulation” to altering requirements
(data model changes/expansions) that prevents change from
cascading from parent to child tables.
In Data Vault modelling you decompose 3NF tables into a set of
flexible component parts. Business keys are stored independently
from descriptive context and history, and independent from
relations. This practice is called Unified Decomposition (Hultgren,
2012). The business key joins tables that are grouped together.
Generically, the practice of hyper normalizing by breaking out
business keys from descriptive attributes (and history), and from
relations, is called Ensemble Modelling.
Hultgren (2012): “… data vault modeling will result in more tables
and more joins. While this is largely mitigated by repeating
patterns, templates, selective joins, and automation, the truth is
that these things must be built and maintained.”
The highly standardized data model components make for
straightforward and maintainable ETL that is amenable to
automation. Such meta data (model) driven development
dramatically improves speed of delivery and code hygiene.
9
10. If we think about it that is what data warehouse systems are for: to
record every single event that happens in source systems. Also, this
approach eliminates in part the need for doing preliminary business
requirement gathering to find out for which attributes history is to
be tracked. By “simply” tracking history for every descriptive
attribute, you wind up with a smaller number of highly standardized
loading patterns and therefore ETL that is easier to maintain. Later,
reports can be developed with or without reference to historical
changes (Type I or II Slowly Changing Dimensions, SCD’s).
If one has to build the DW using a DV data model, it would look like
Fig. 7 for User Story 1, like Fig. 8 for User Story 2 and like Fig. 9 for
User Story 3 that is identical to the data model from User Story 2.
DV Model for User Story 1:
Fig. 7 DV model for User Story 1
10
11. DV model for User Story 2:
Fig. 8: DV model with Supplier data
As you can see in Fig. 8, the changes are not impacting the existing
structure. Rather, adding Supplier data extends the existing
structure. This example also shows why this architecture provides
superior support to incremental development in tiny iterations
(without triggering prohibitive overhead).
As a result the changes remain local and hence the additional ETL
and testing effort merely grows linearly over time. This
demonstrates that the response to changes is more graceful than
would have been experienced in traditional DW data models. The
impact on the existing data model as we progress form User Story 1
to User Story 2 is negligible.
11
12. DV model for User Story 3:
Fig. 9: DV model for User Story 3
The impact of business change as we progress from User Story 2 to
User Story 3 on the existing DV data model is non-existent, the
models are identical.
12
13. CONCLUSION
Agile methodologies can indeed be adapted to DW systems.
However, as we have demonstrated, traditional modeling paradigms
(3NF, dimensional) are unfavourably impacted by “late arriving
requirements”, changes in business needs that need to be
incorporated in an existing data model. It therefore becomes
imperative to model the data differently in order to be able to truly
embrace change, and not make the cost of change grow as the Bi
solution expands.
An Agile credo is to deliver value early and continuously. As we
have shown, traditional DW architectures may be able to deliver
early, but their design does not hold up so well against changes
over time. That is why the “continuous” delivery will tend to slow
down as the solution grows. To overcome this problem, we
recommend a revival of three-tiered DW architectures, provided you
model the central hub in some hyper normalized fashion. This is
reflected in a design approach that is resilient to change and that
can grow infinitely at (approximately) linearly rising cost.
The case study we presented clearly shows that one can adapt Agile
methodologies to DW systems successfully. The provision is you
have to design architectures differently to avoid accruing technical
debt so that one can truly embrace change in DW systems.
REFERENCES
Agile Manifesto (2001) www.agilemanifesto.org
Ralph Kimball, Margy Ross, Warren Thornthwaite, Joy Mundy & Bob
Becker (2008) The Data Warehouse Lifecycle Toolkit, 2nd Ed. ISBN#
0470149779
Mike Cohn (2005) Agile Estimating and Planning. ISBN#
0131479415
Lawrence Corr & Jim Stagnitto (2011) Agile Data Warehouse
Design: Collaborative Dimensional Modeling, from Whiteboard to
Star Schema. ISBN# 0956817203
Dan Linstedt (2011) Super Charge Your Data Warehouse:
Invaluable Data Modeling Rules to Implement Your Data Vault.
ISBN# 1463778686
Hans Hultgren (2012) Modeling the Agile Data Warehouse with Data
Vault. ISBN# 9780615723082
13