Download as PDF, PPTX
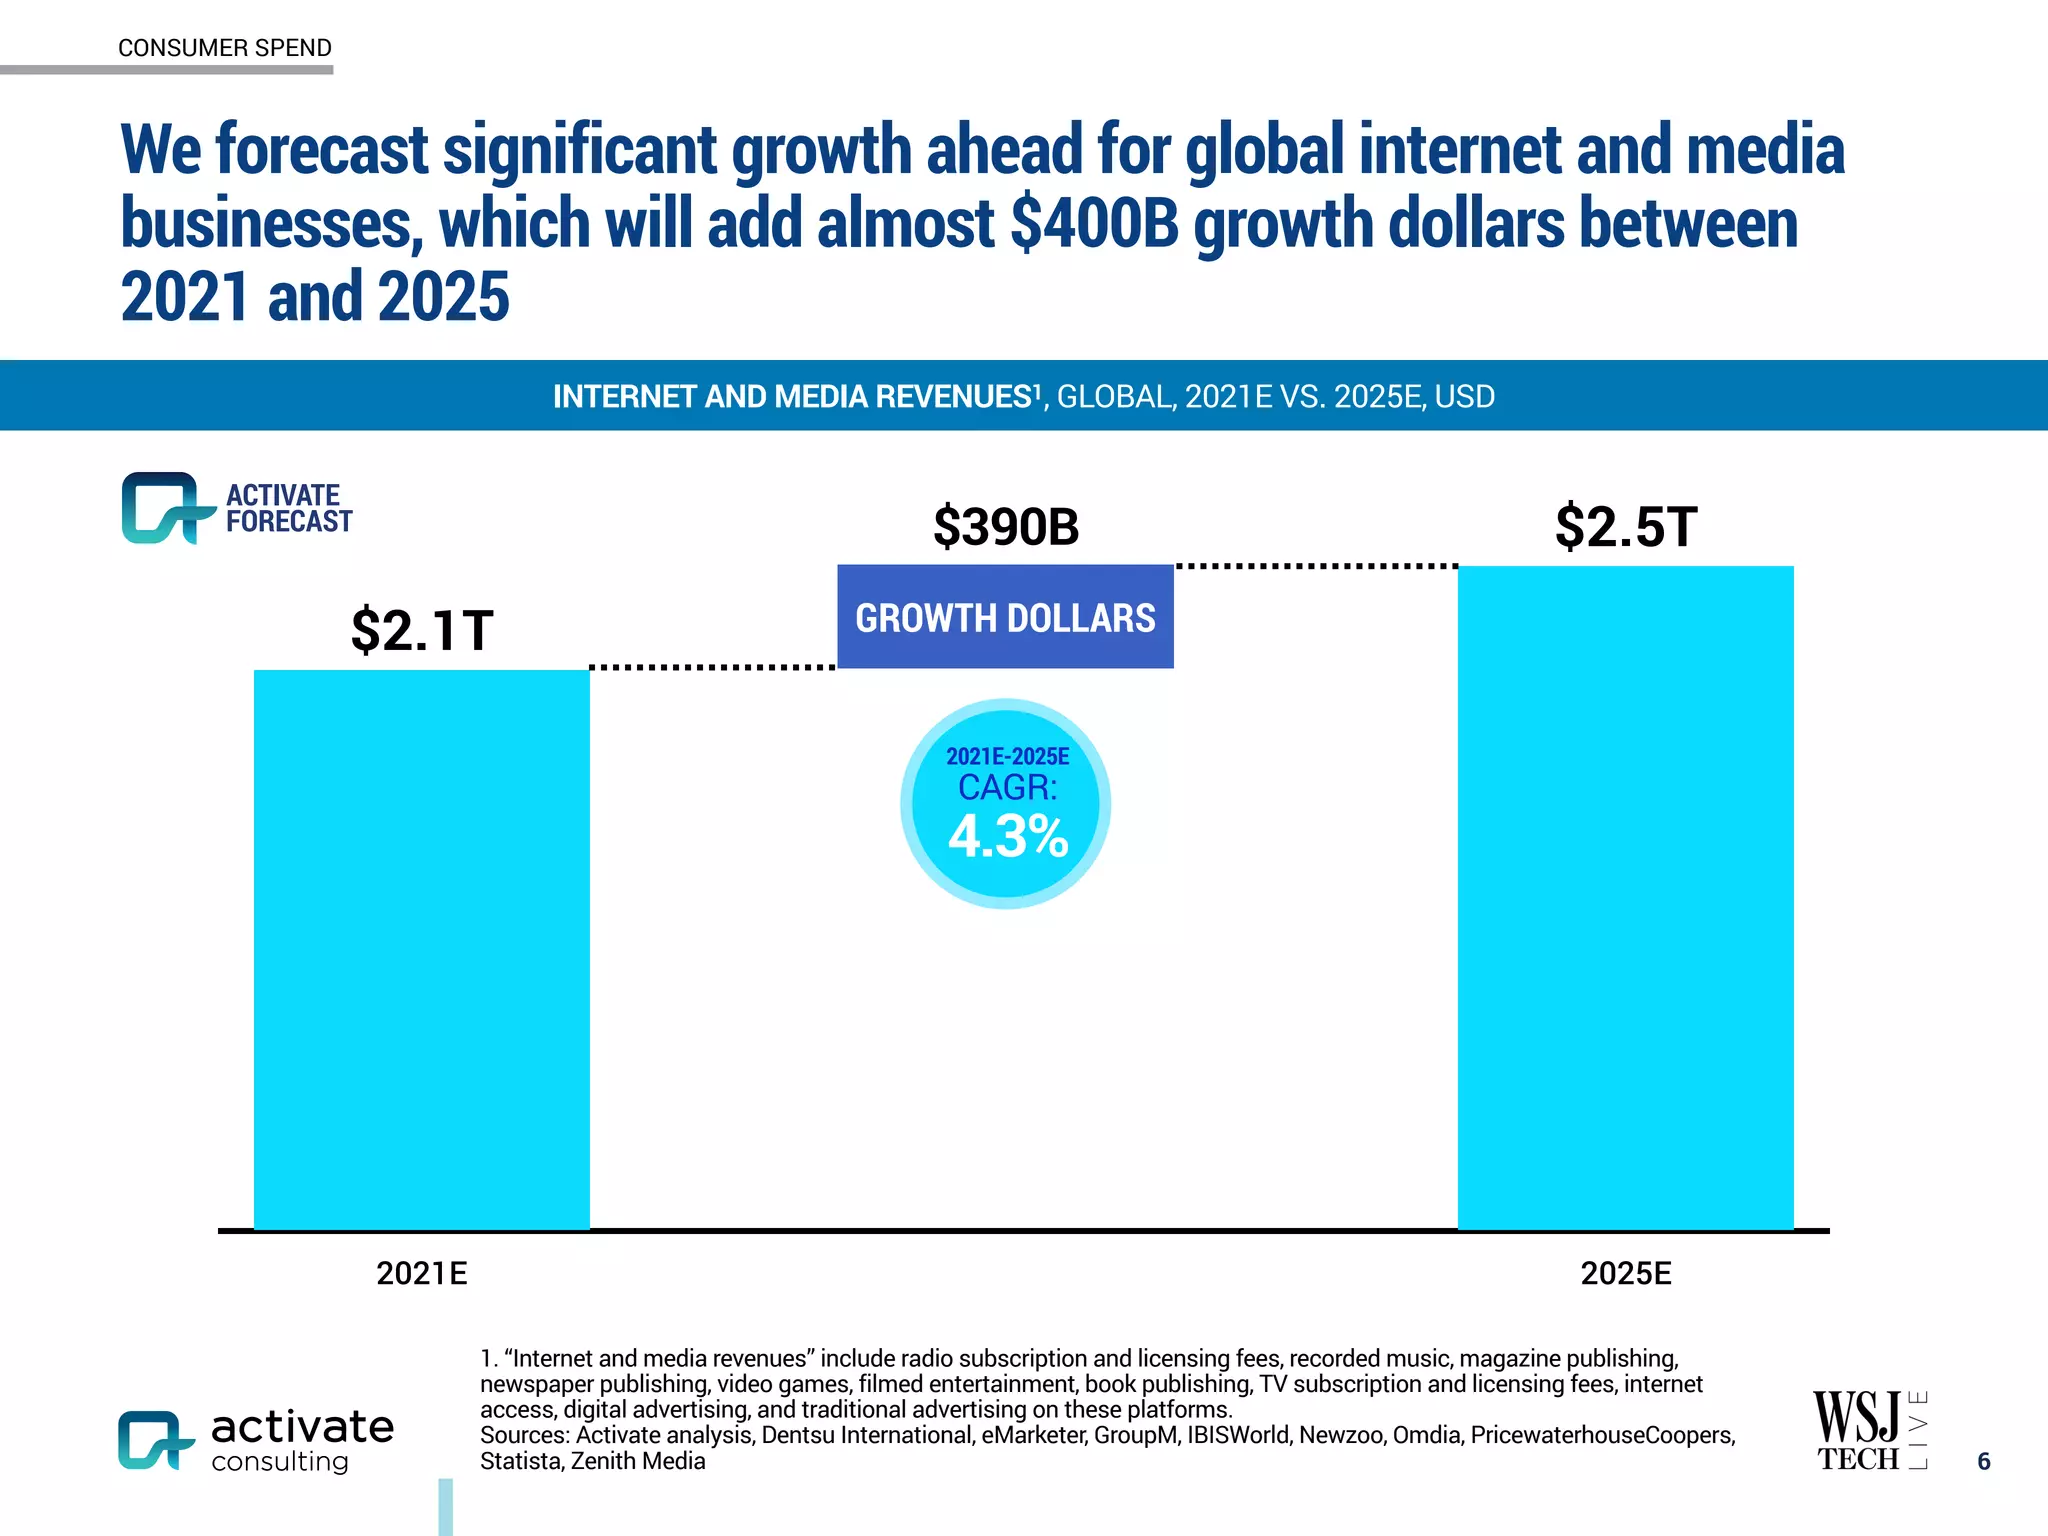

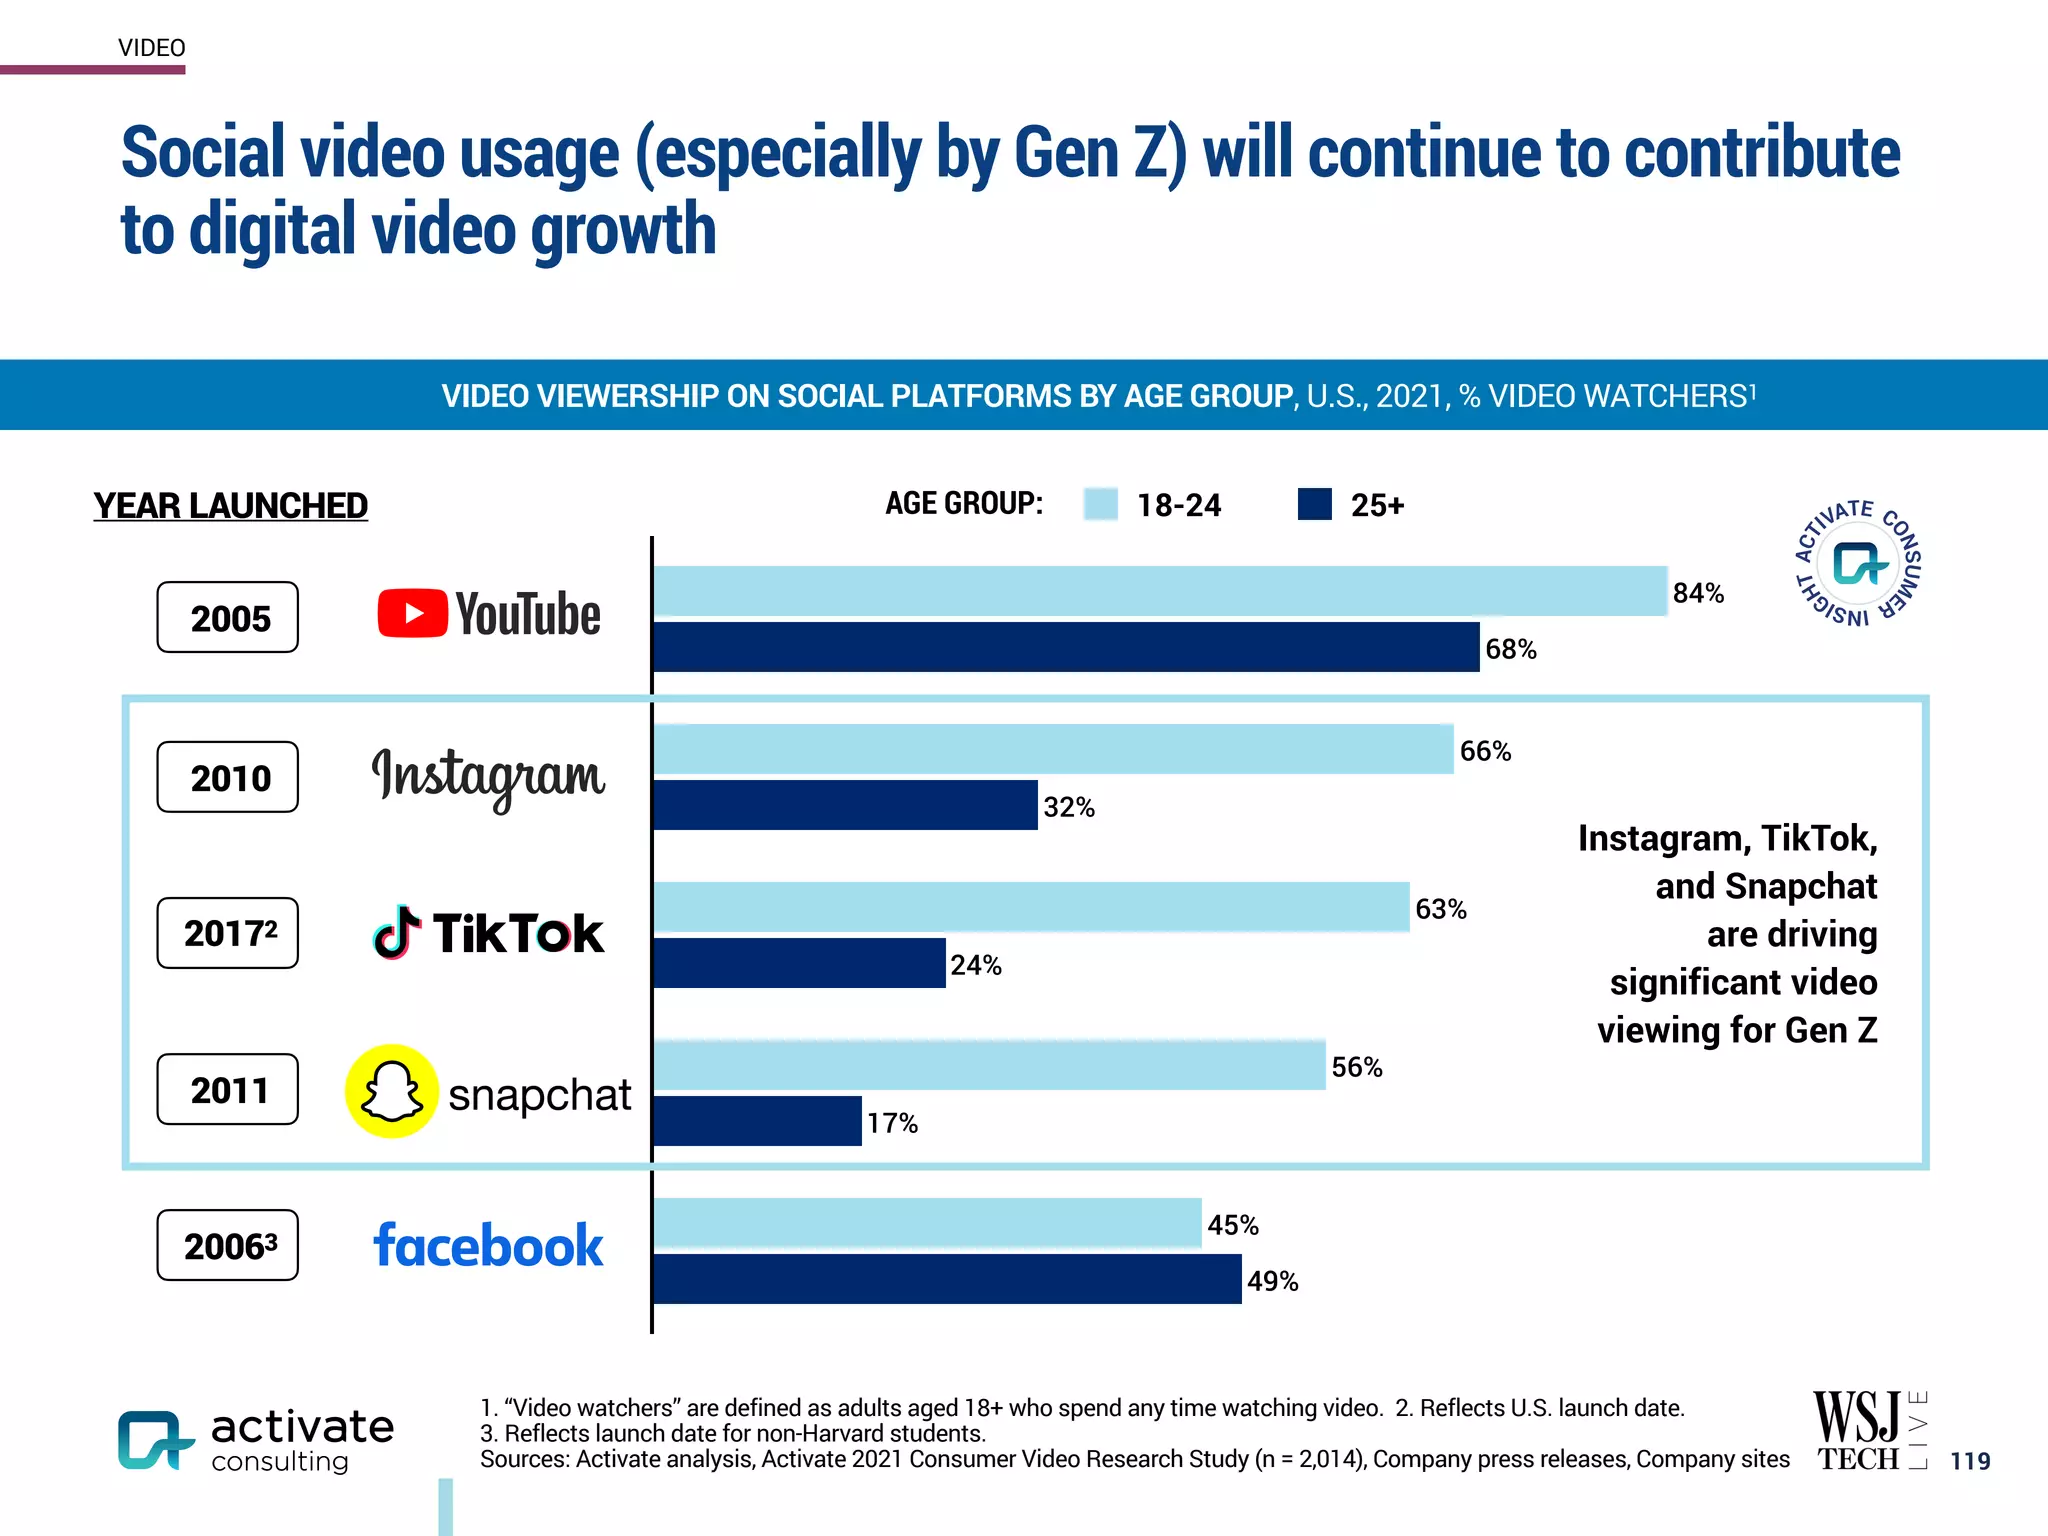
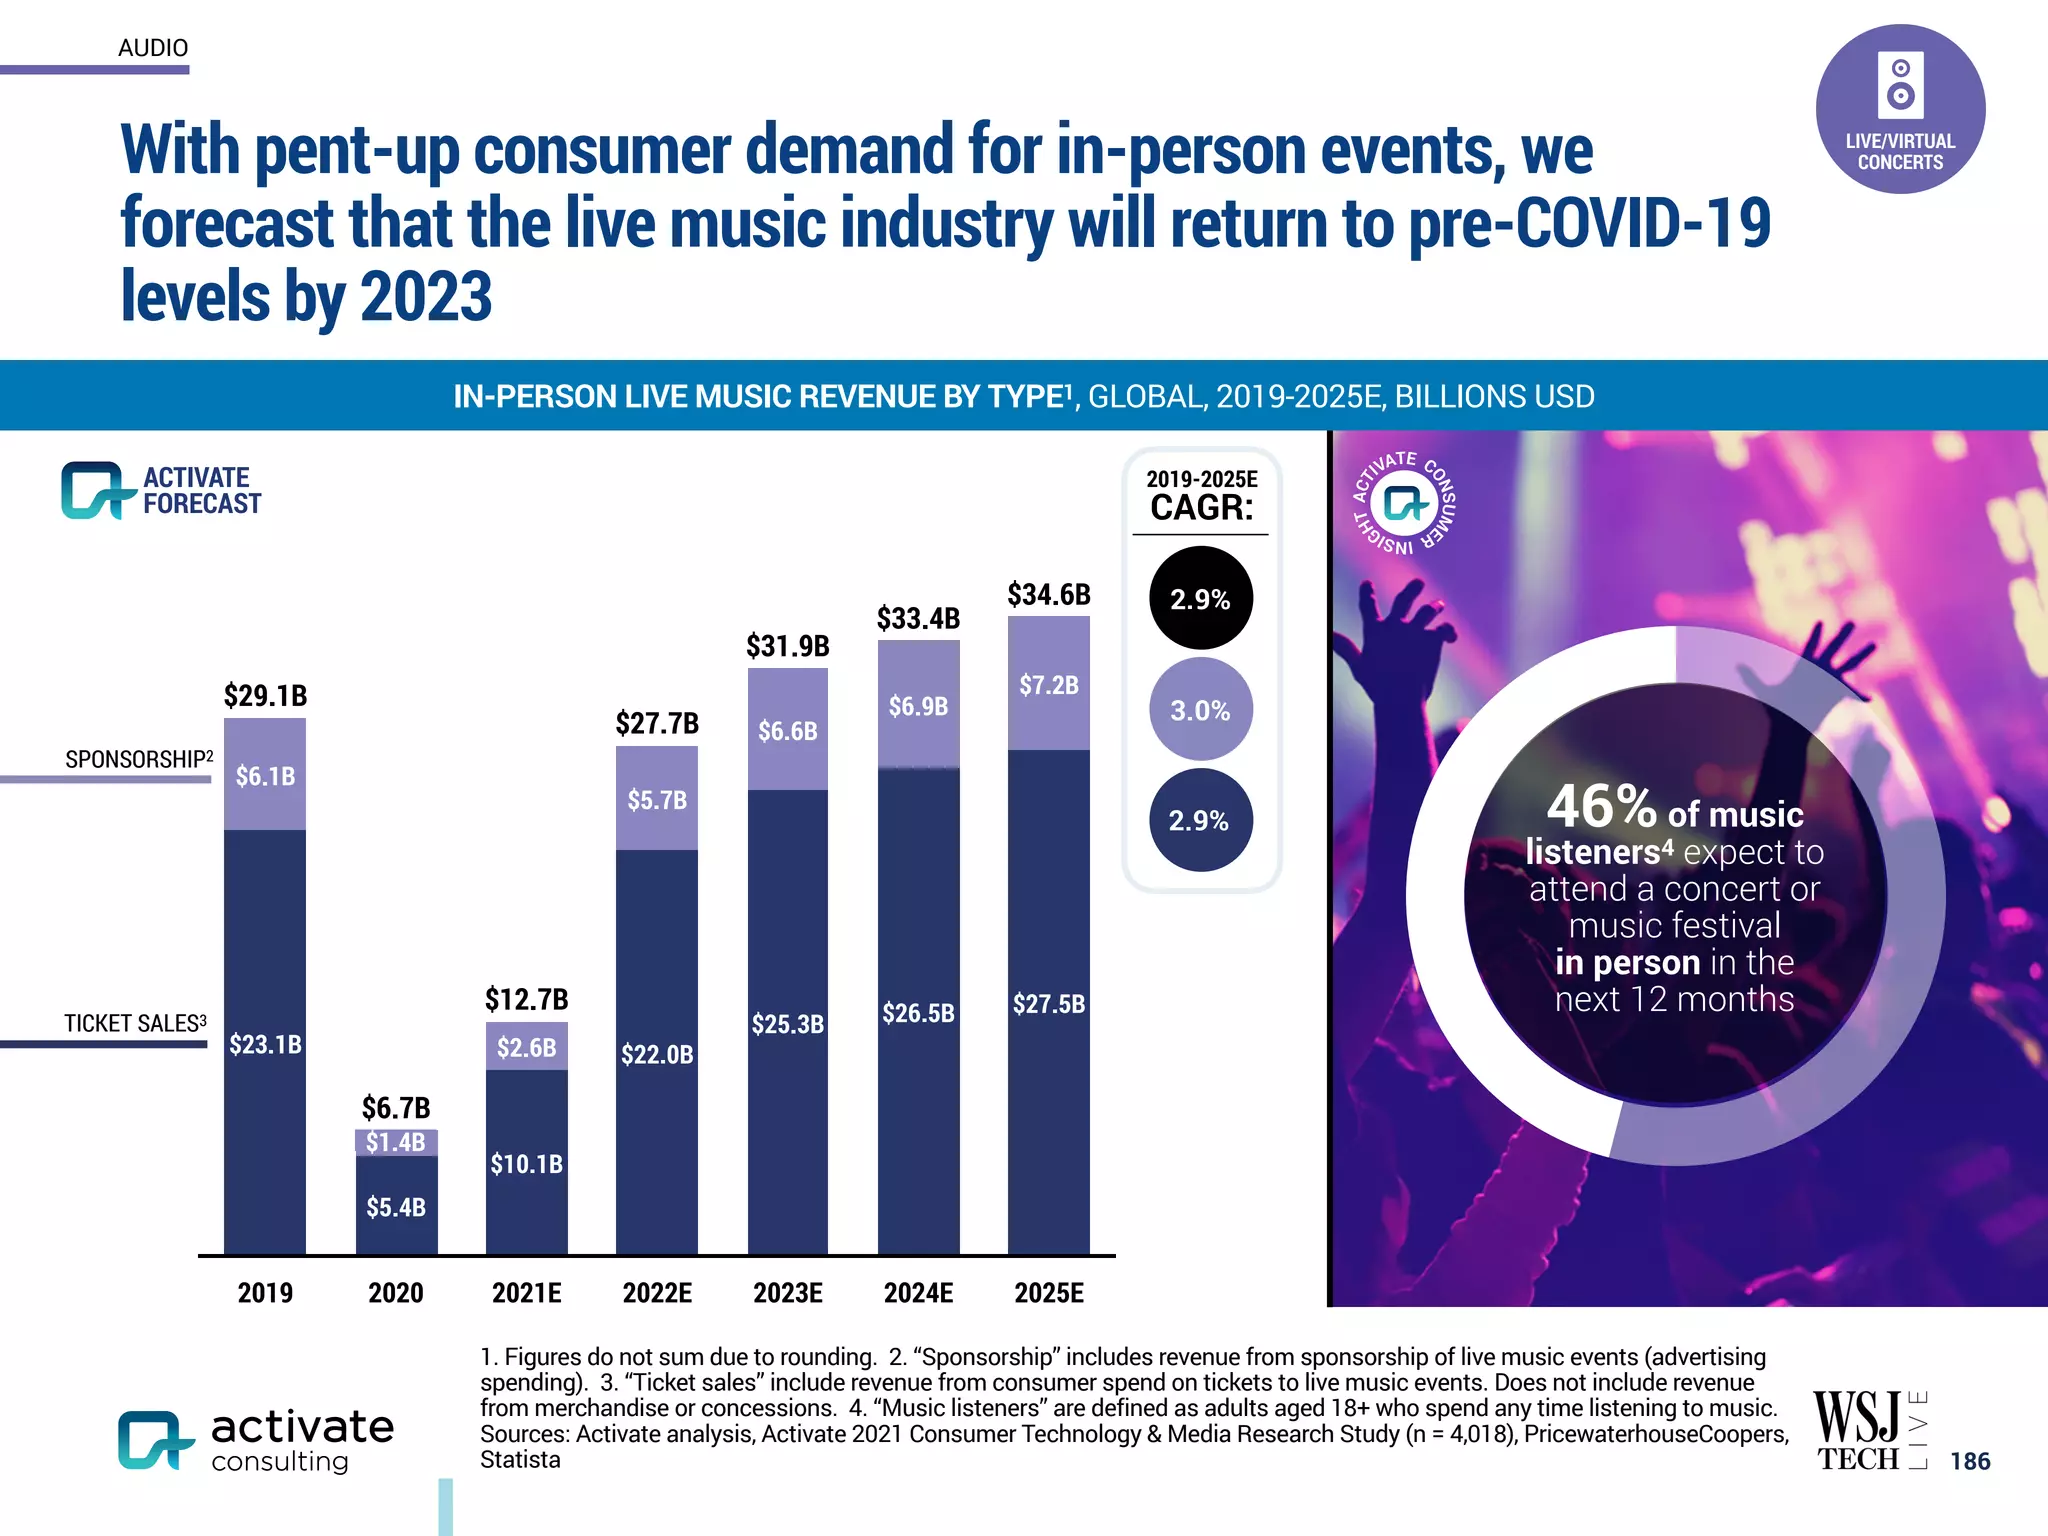
![Competition among the major streaming services is intensifying, as
new paid and free services compete with other forms of digital video
and television for consumer attention
124
ESTIMATED NUMBER OF SUBSCRIBERS/USERS BY SELECT VIDEO STREAMING SERVICES,
U.S., 2021 OR MOST RECENT, MILLIONS SUBSCRIBERS / MILLIONS MONTHLY ACTIVE USERS
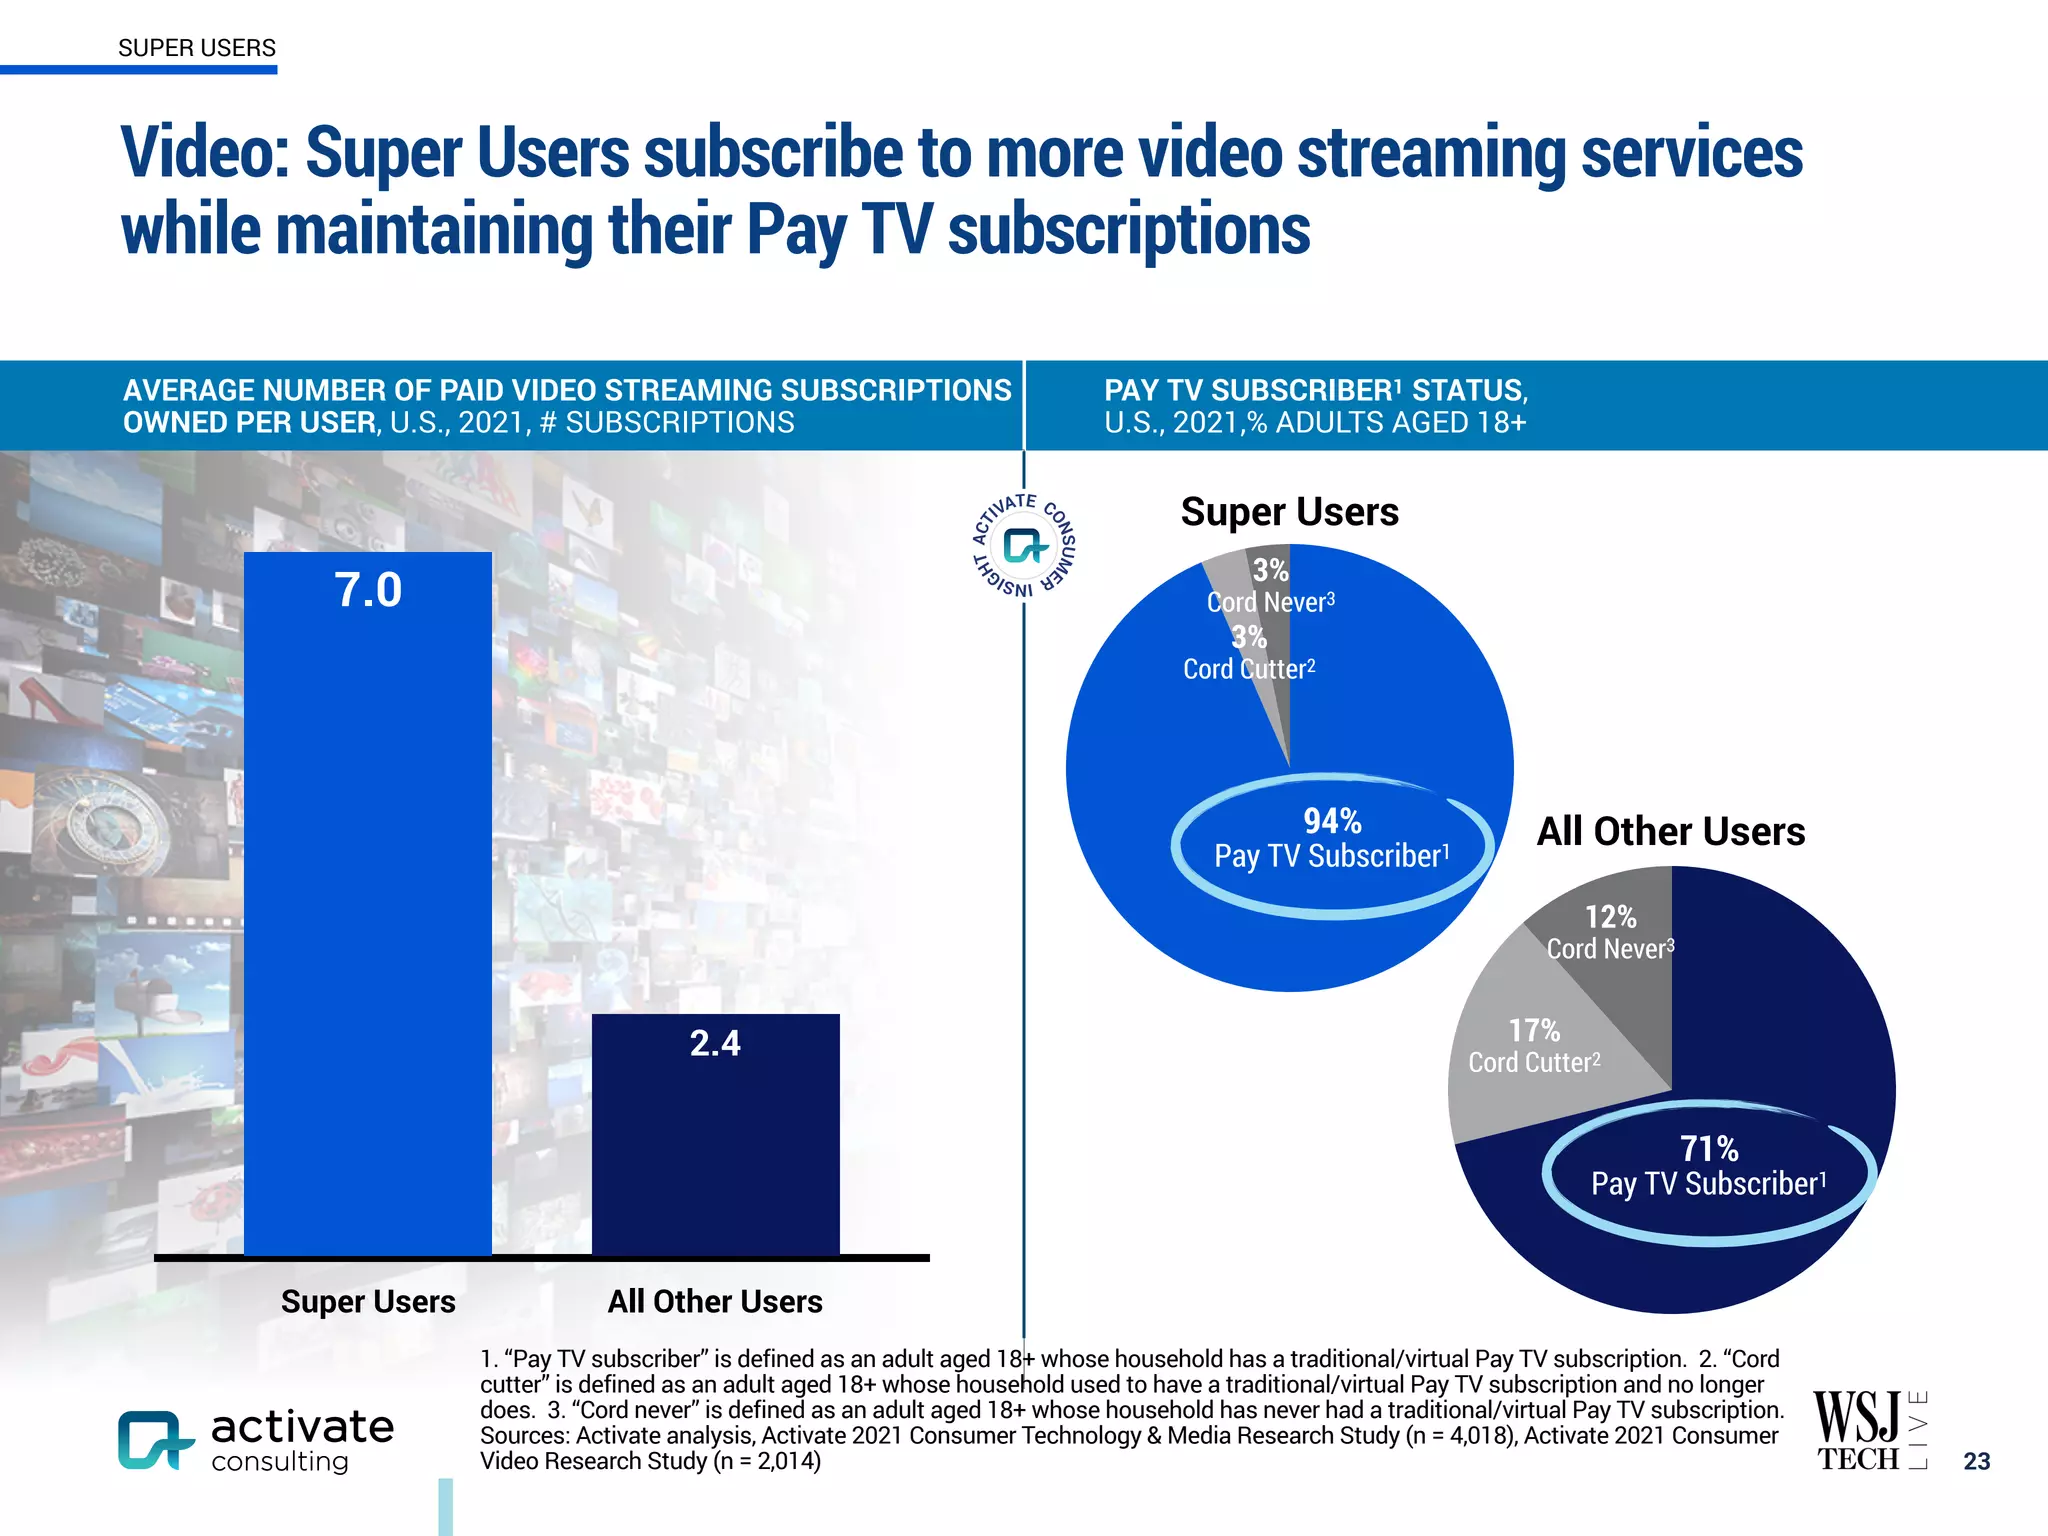
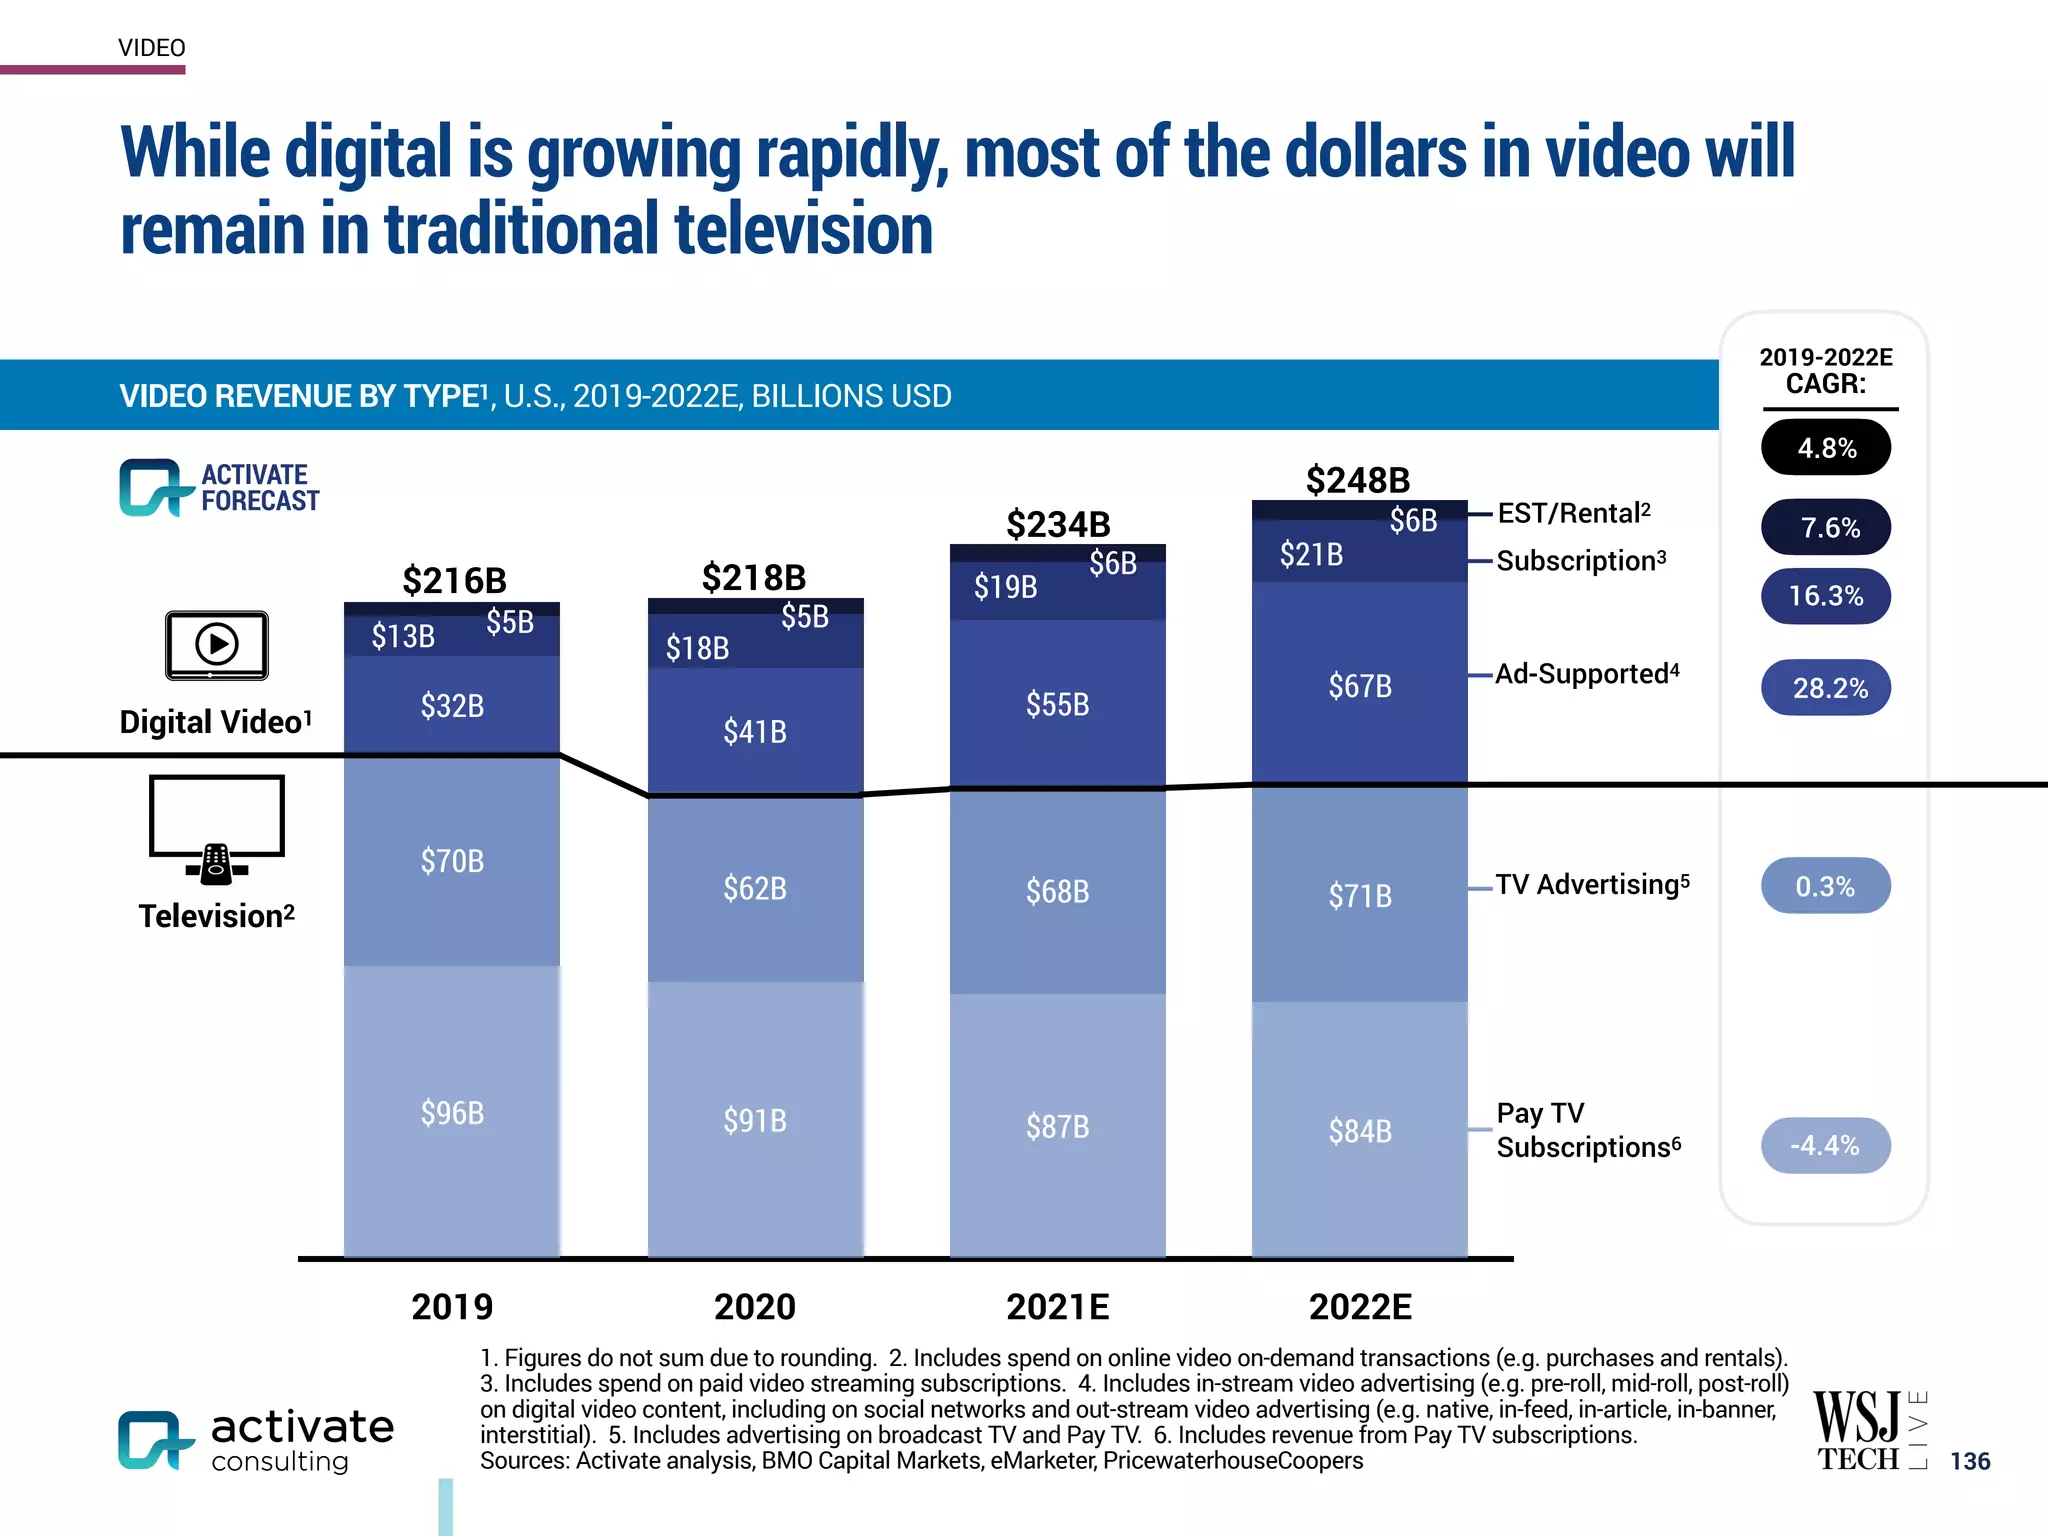
VIDEO
Paid video streaming subscription service [SVOD]
(Millions subscribers)
Free video streaming service with ads [AVOD, FAST]
(Millions monthly active users)
Video streaming service with a paid subscription
tier and a free tier with ads (Millions monthly active users)
Virtual Pay TV service1 [vMVPD]
(Millions subscribers)
153M
66M
33M 33M
22M
20M
18M
16M
15M
10M
2M 2M 1.5M 1.5M 0.9M 0.8M 0.7M 0.5M
34M
0.5M
(including Prime Video)
2 2 2 2 2 2
2 2
3 4 5
2
2 2 2
1.0M
4M 4M
39M
38M
9M 8M
Note: Figures reflect latest publicly disclosed statistics, unless noted otherwise. 1. “Virtual Pay TV service” is defined as a service
that delivers TV through the internet without a set-top box. 2. Reflects estimate. 3. Reflects monthly active users disclosed by
Peacock. Total sign-ups reached 54M. 4. Reflects estimated paid subscribers. 5. Reflects paid subscribers to AT&T TV Now,
which was rebranded as DirecTV Stream in August 2021.
Sources: Activate analysis, Activate 2021 Consumer Technology & Media Research Study (n = 4,018), Activate 2021 Consumer
Video Research Study (n = 2,014), Bank of America, Company filings, Company press releases, Company sites, Consumer
Intelligence Research Partners LLC, Deutsche Bank, FierceVideo, J.P
. Morgan, Los Angeles Times, MarketScreener,
MoffettNathanson, RBC Capital Markets, The Streamable, TechCrunch, Variety, The Verge, The Washington Post](https://image.slidesharecdn.com/activatetechnologymediaoutlook2022print-211020211710/75/Activate-Technology-Media-Outlook-2022-125-2048.jpg)


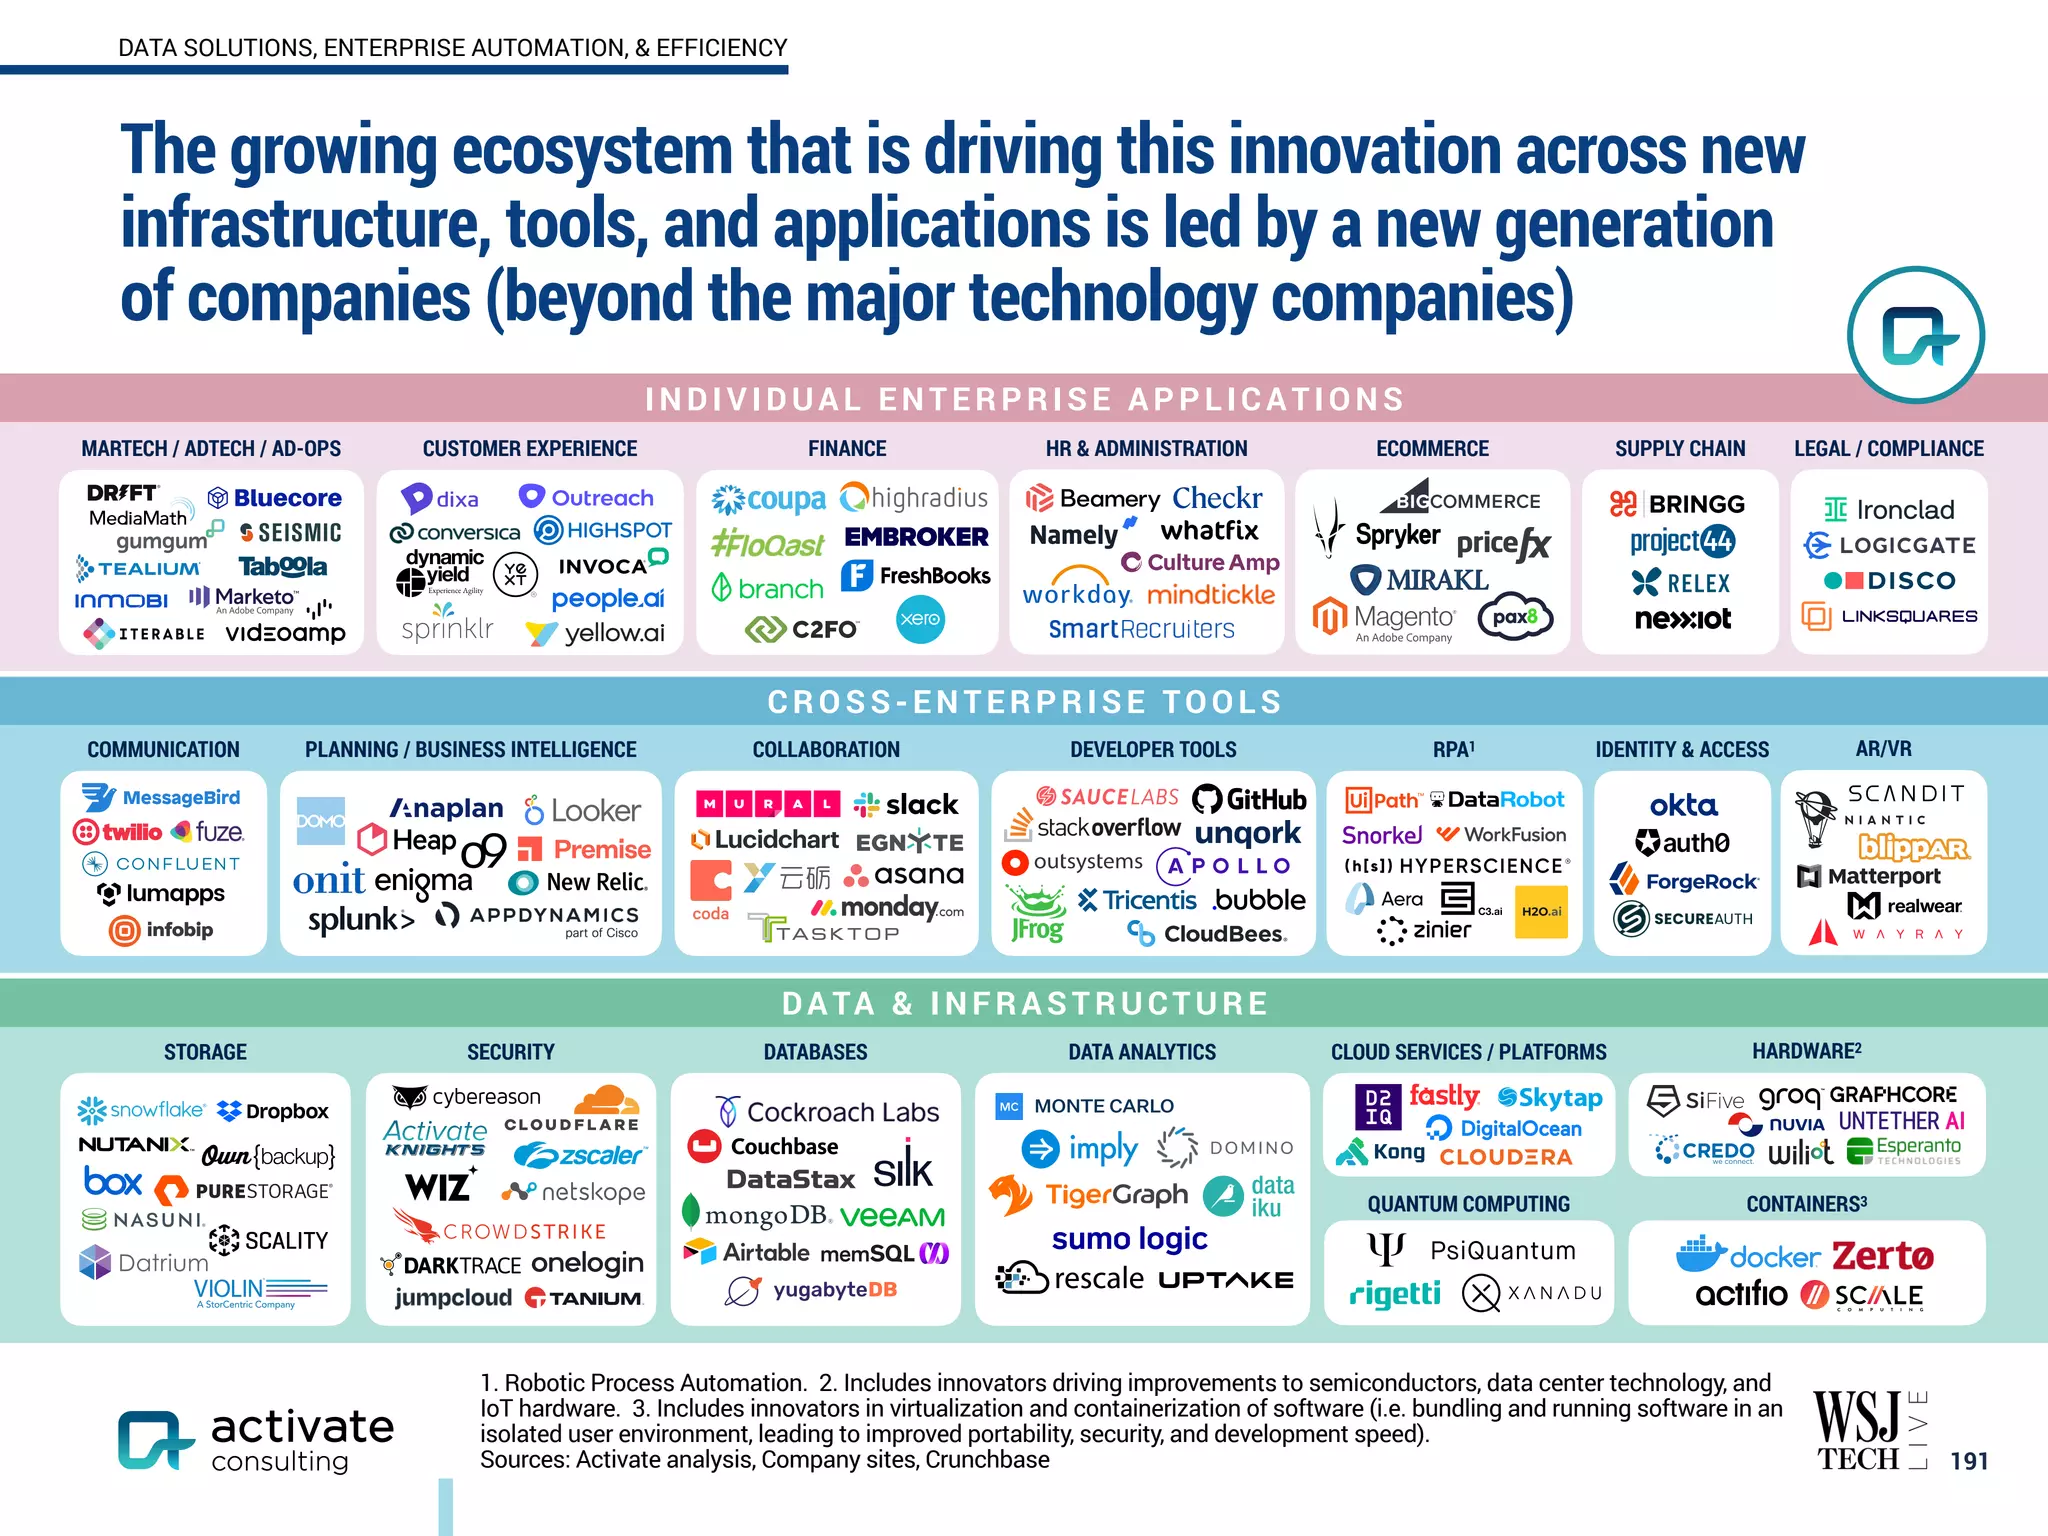


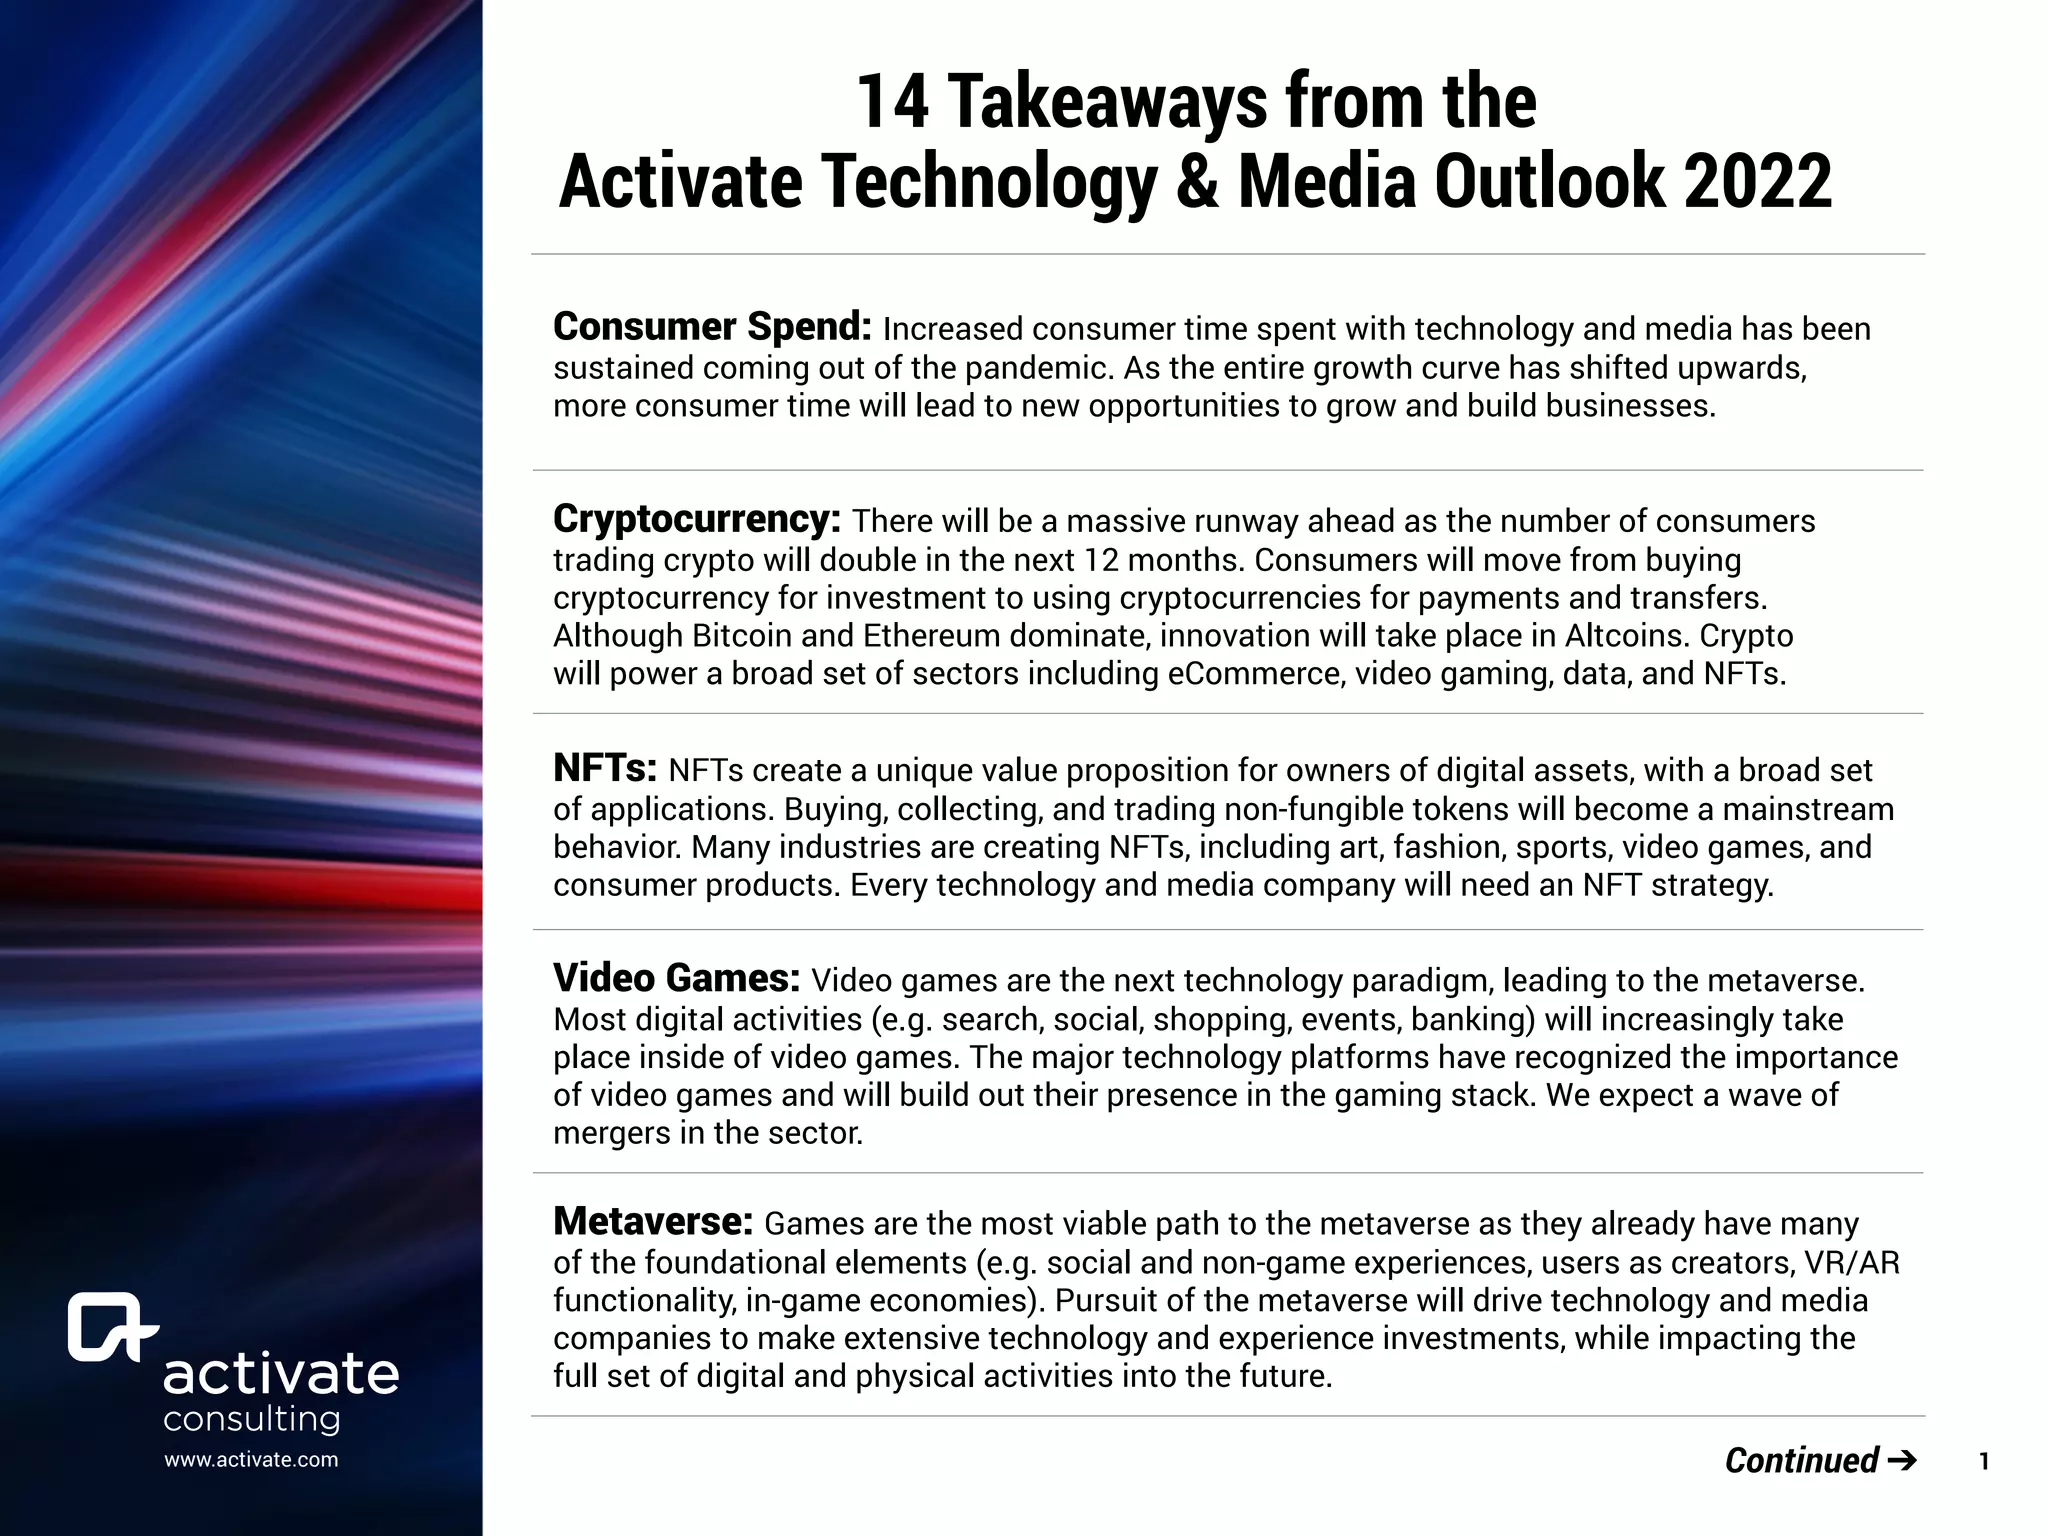
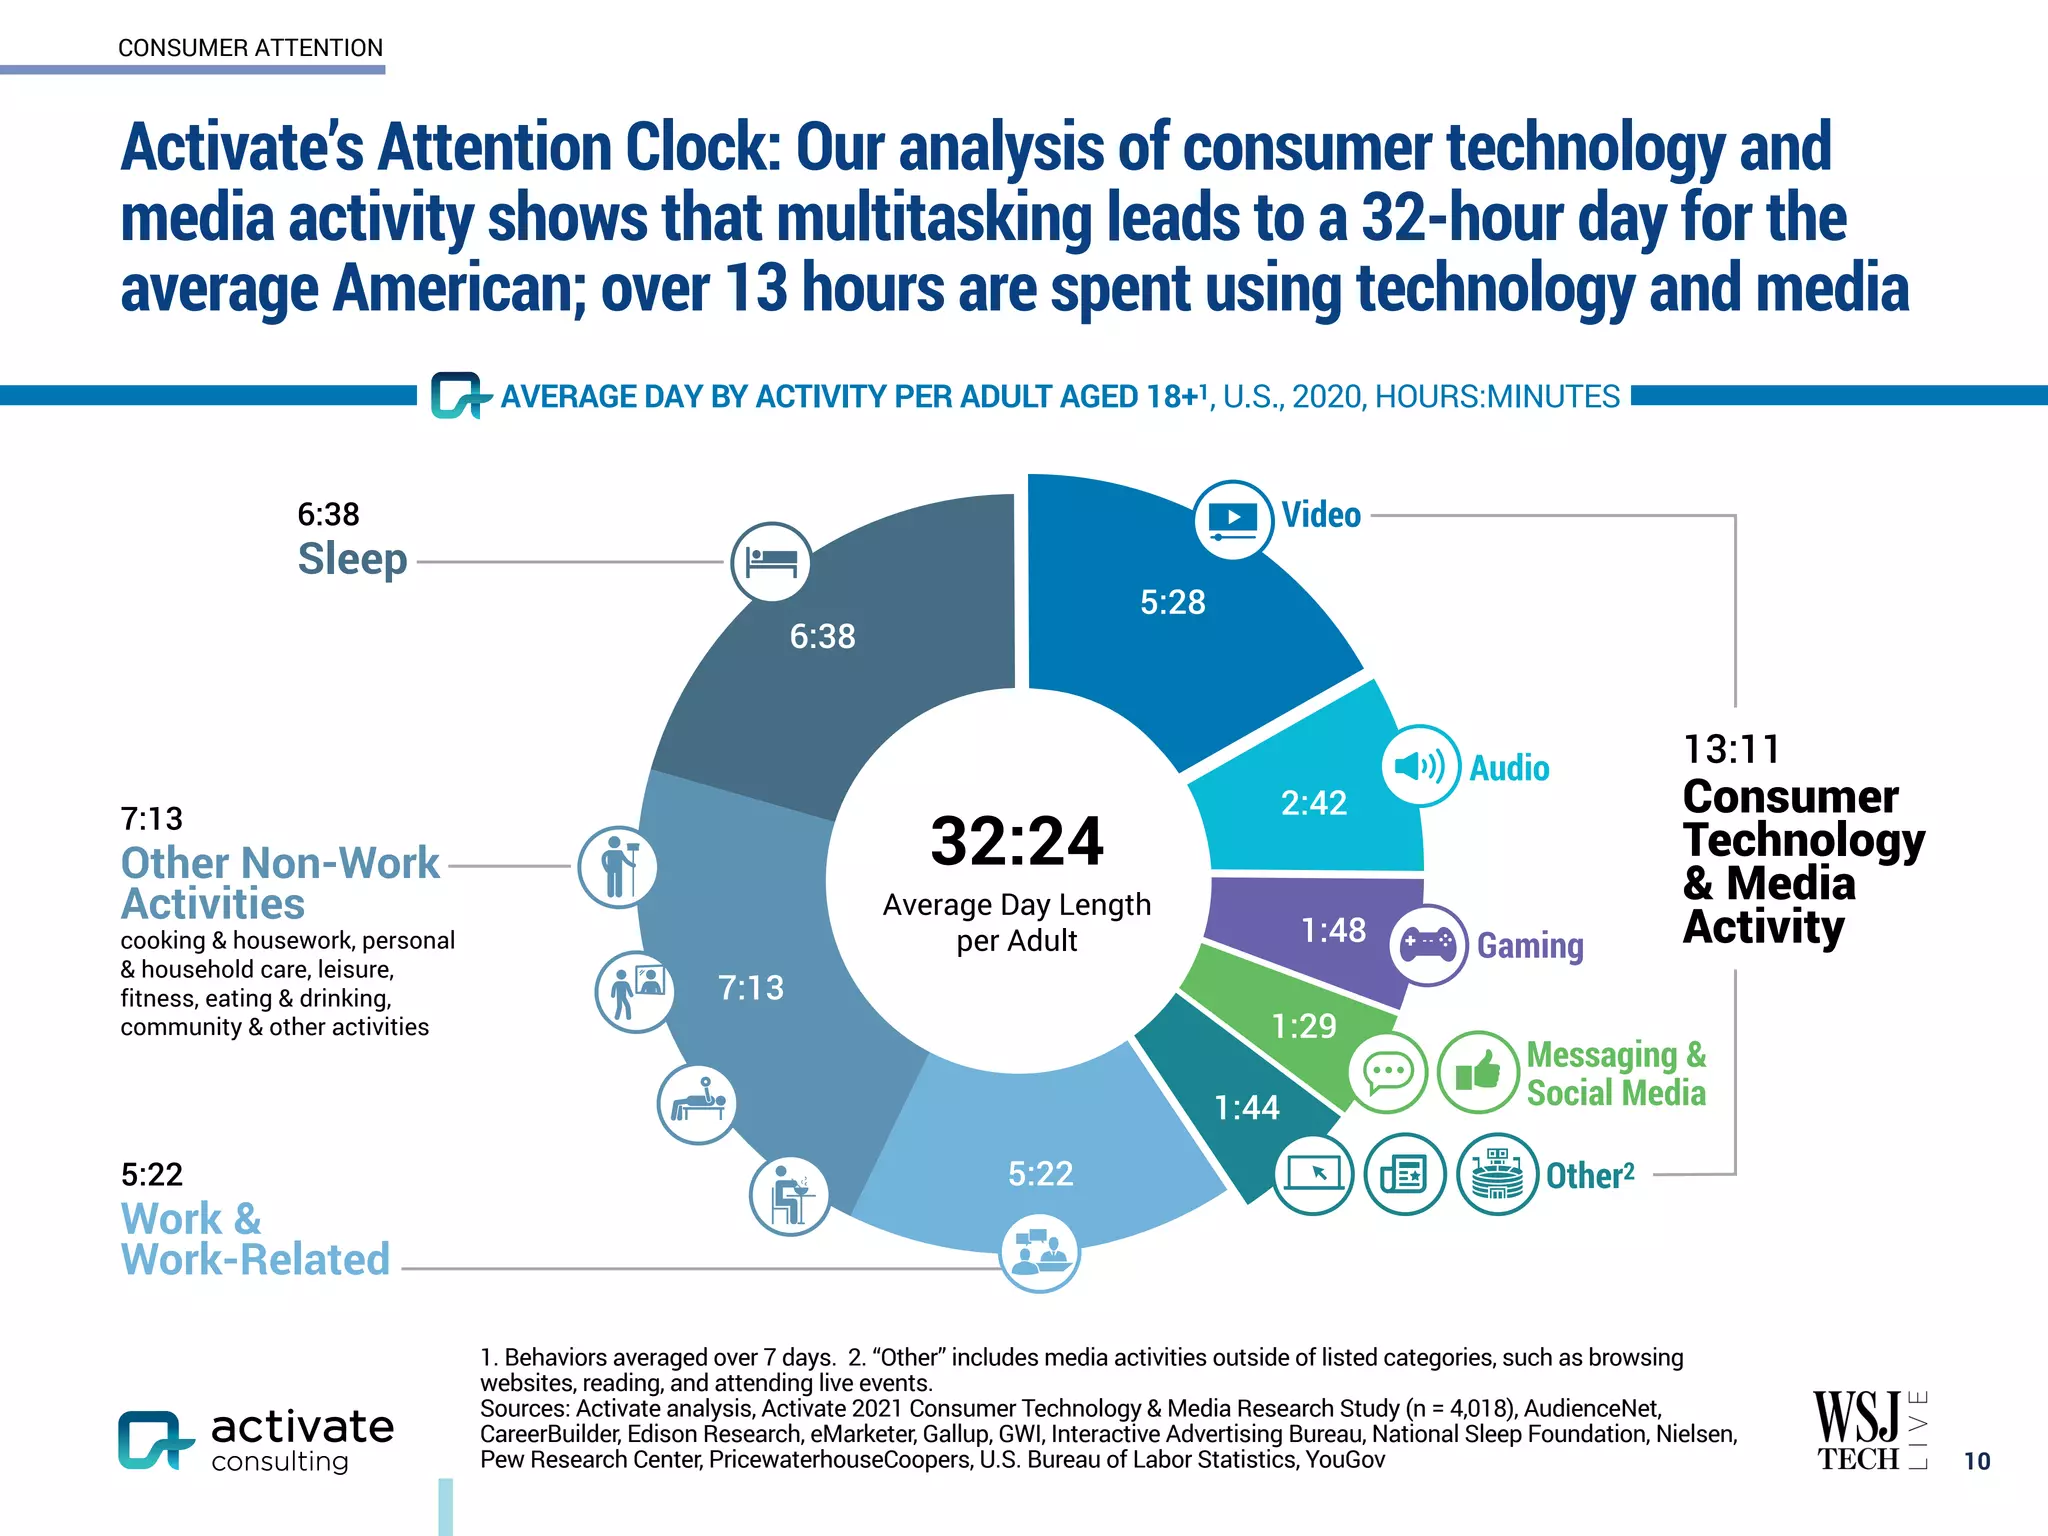
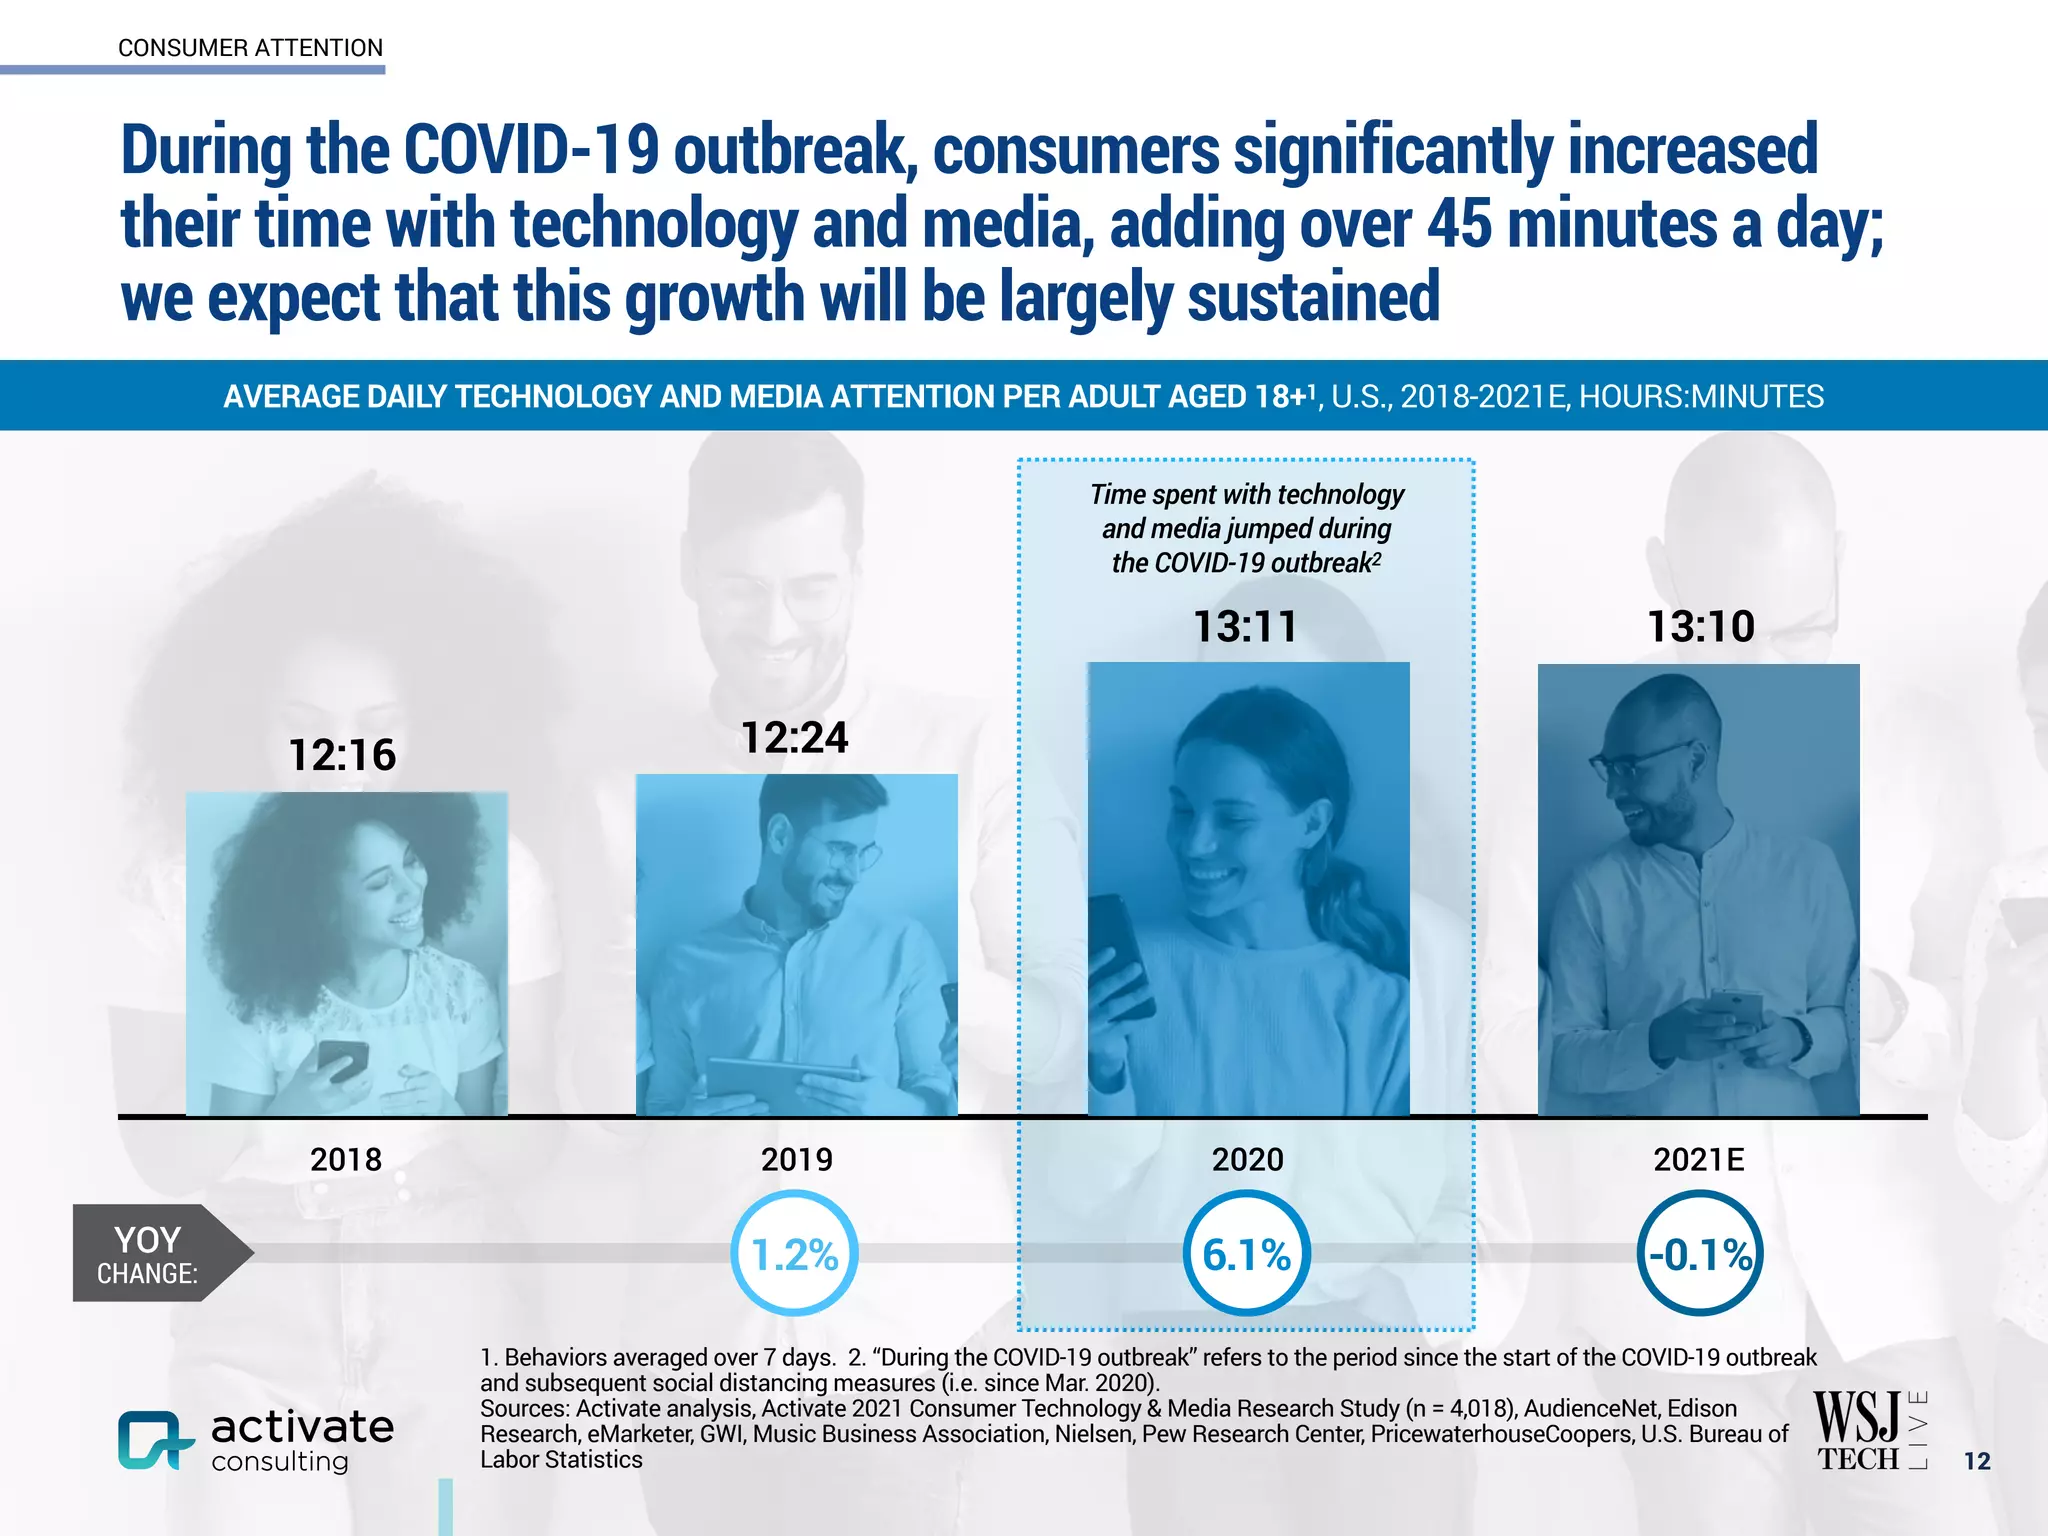
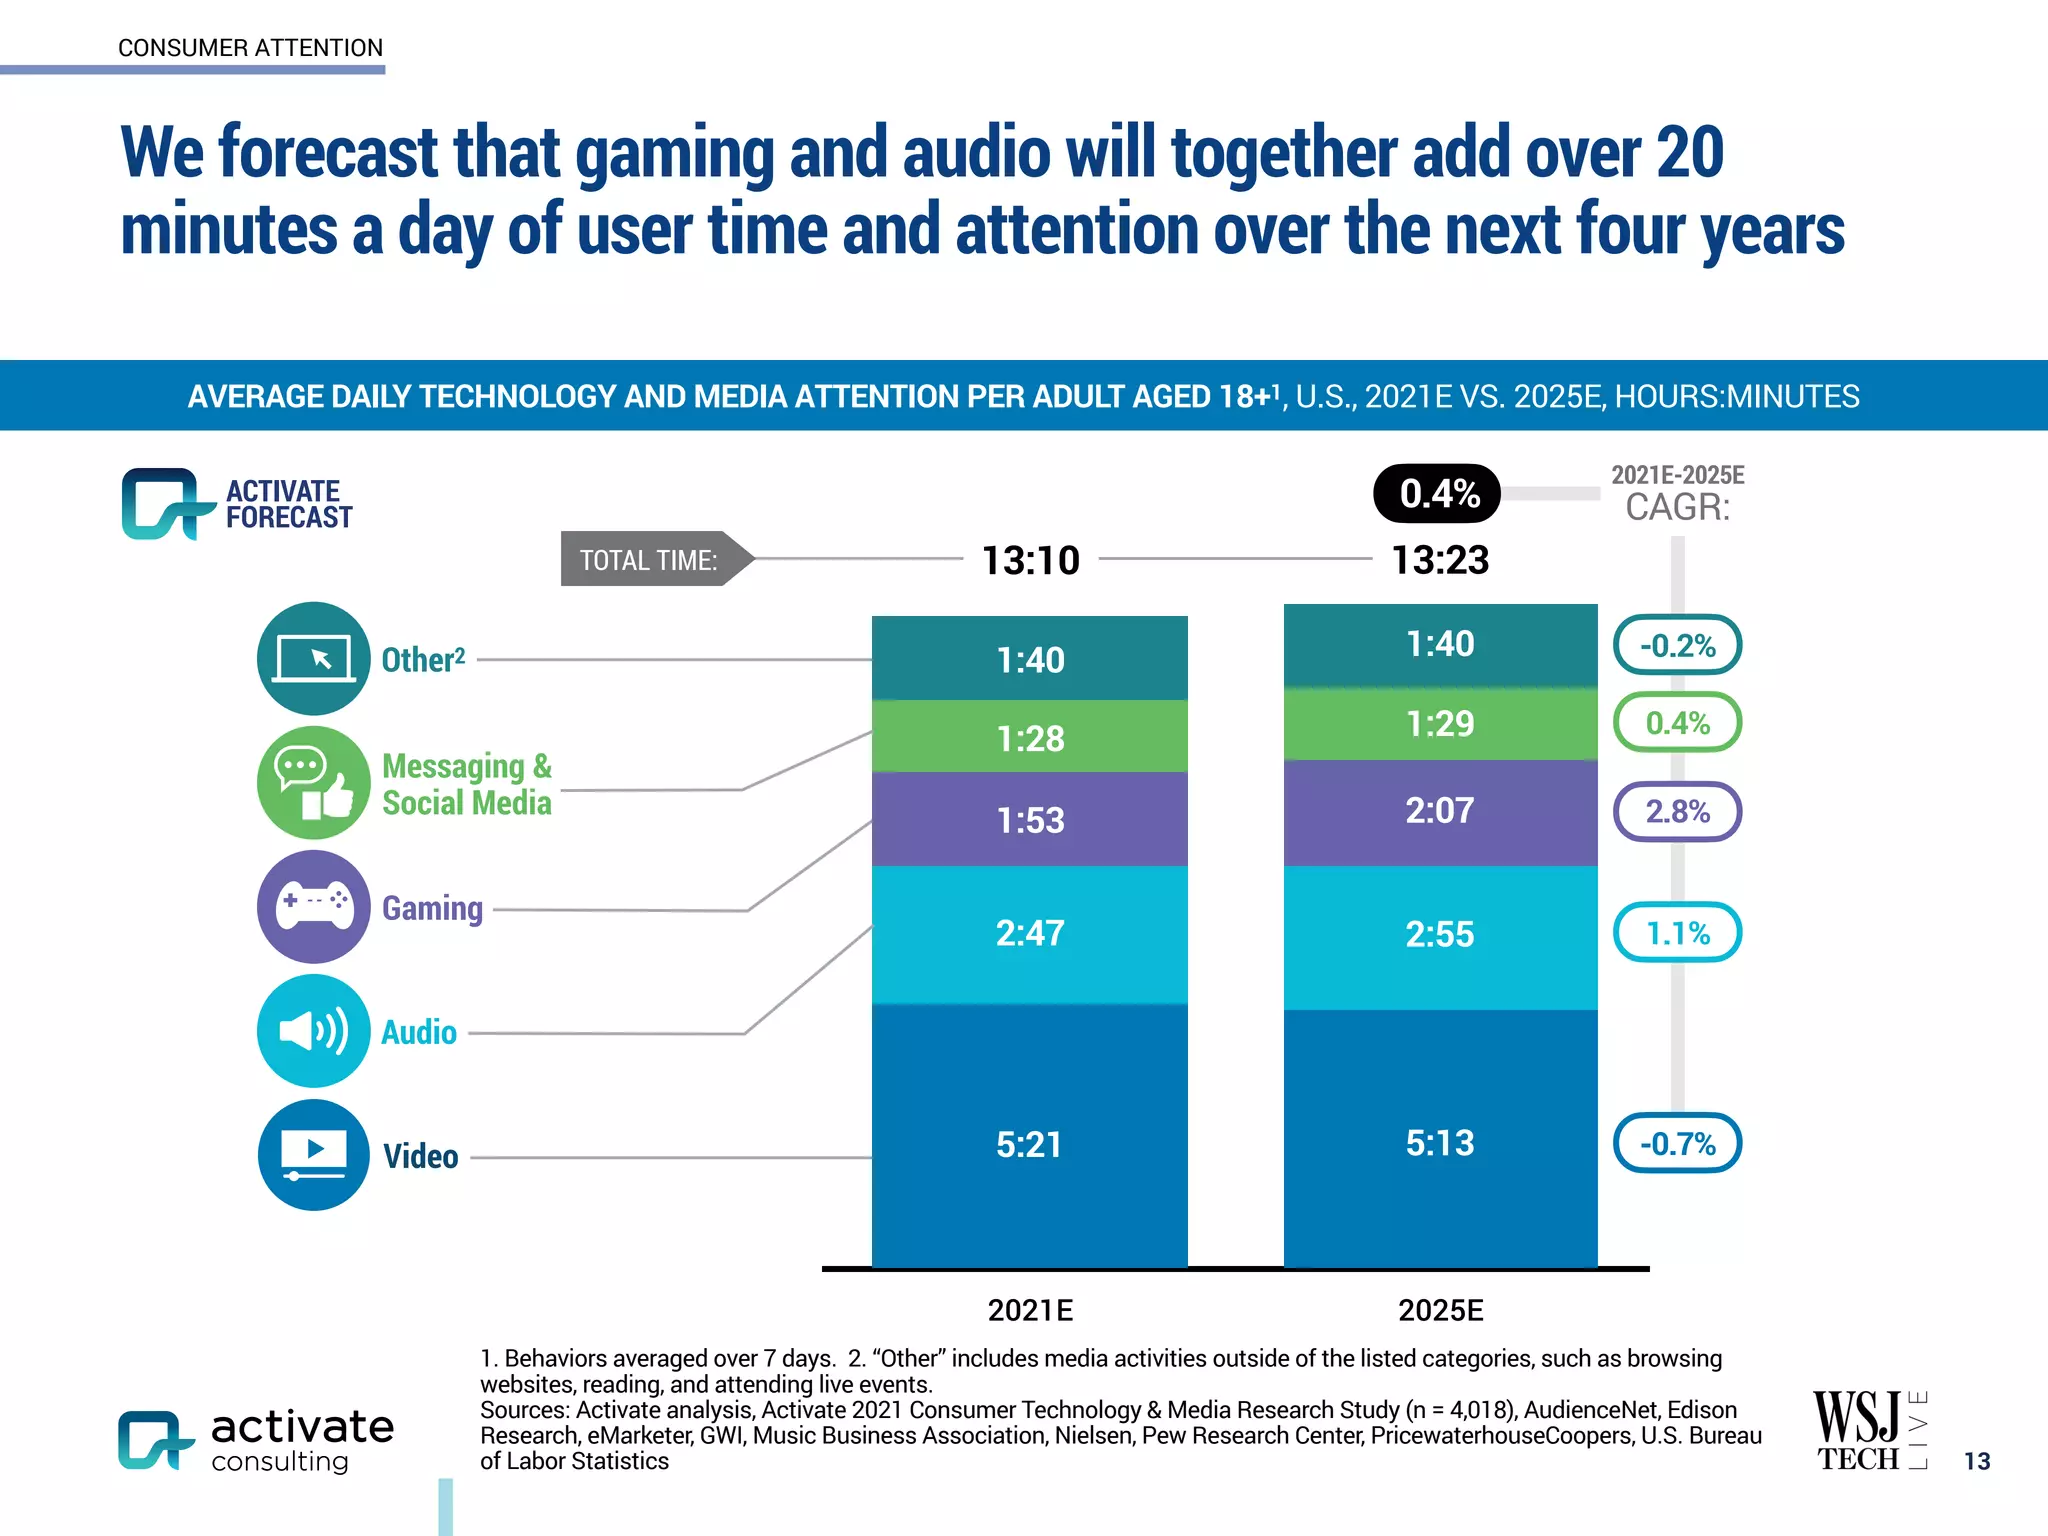
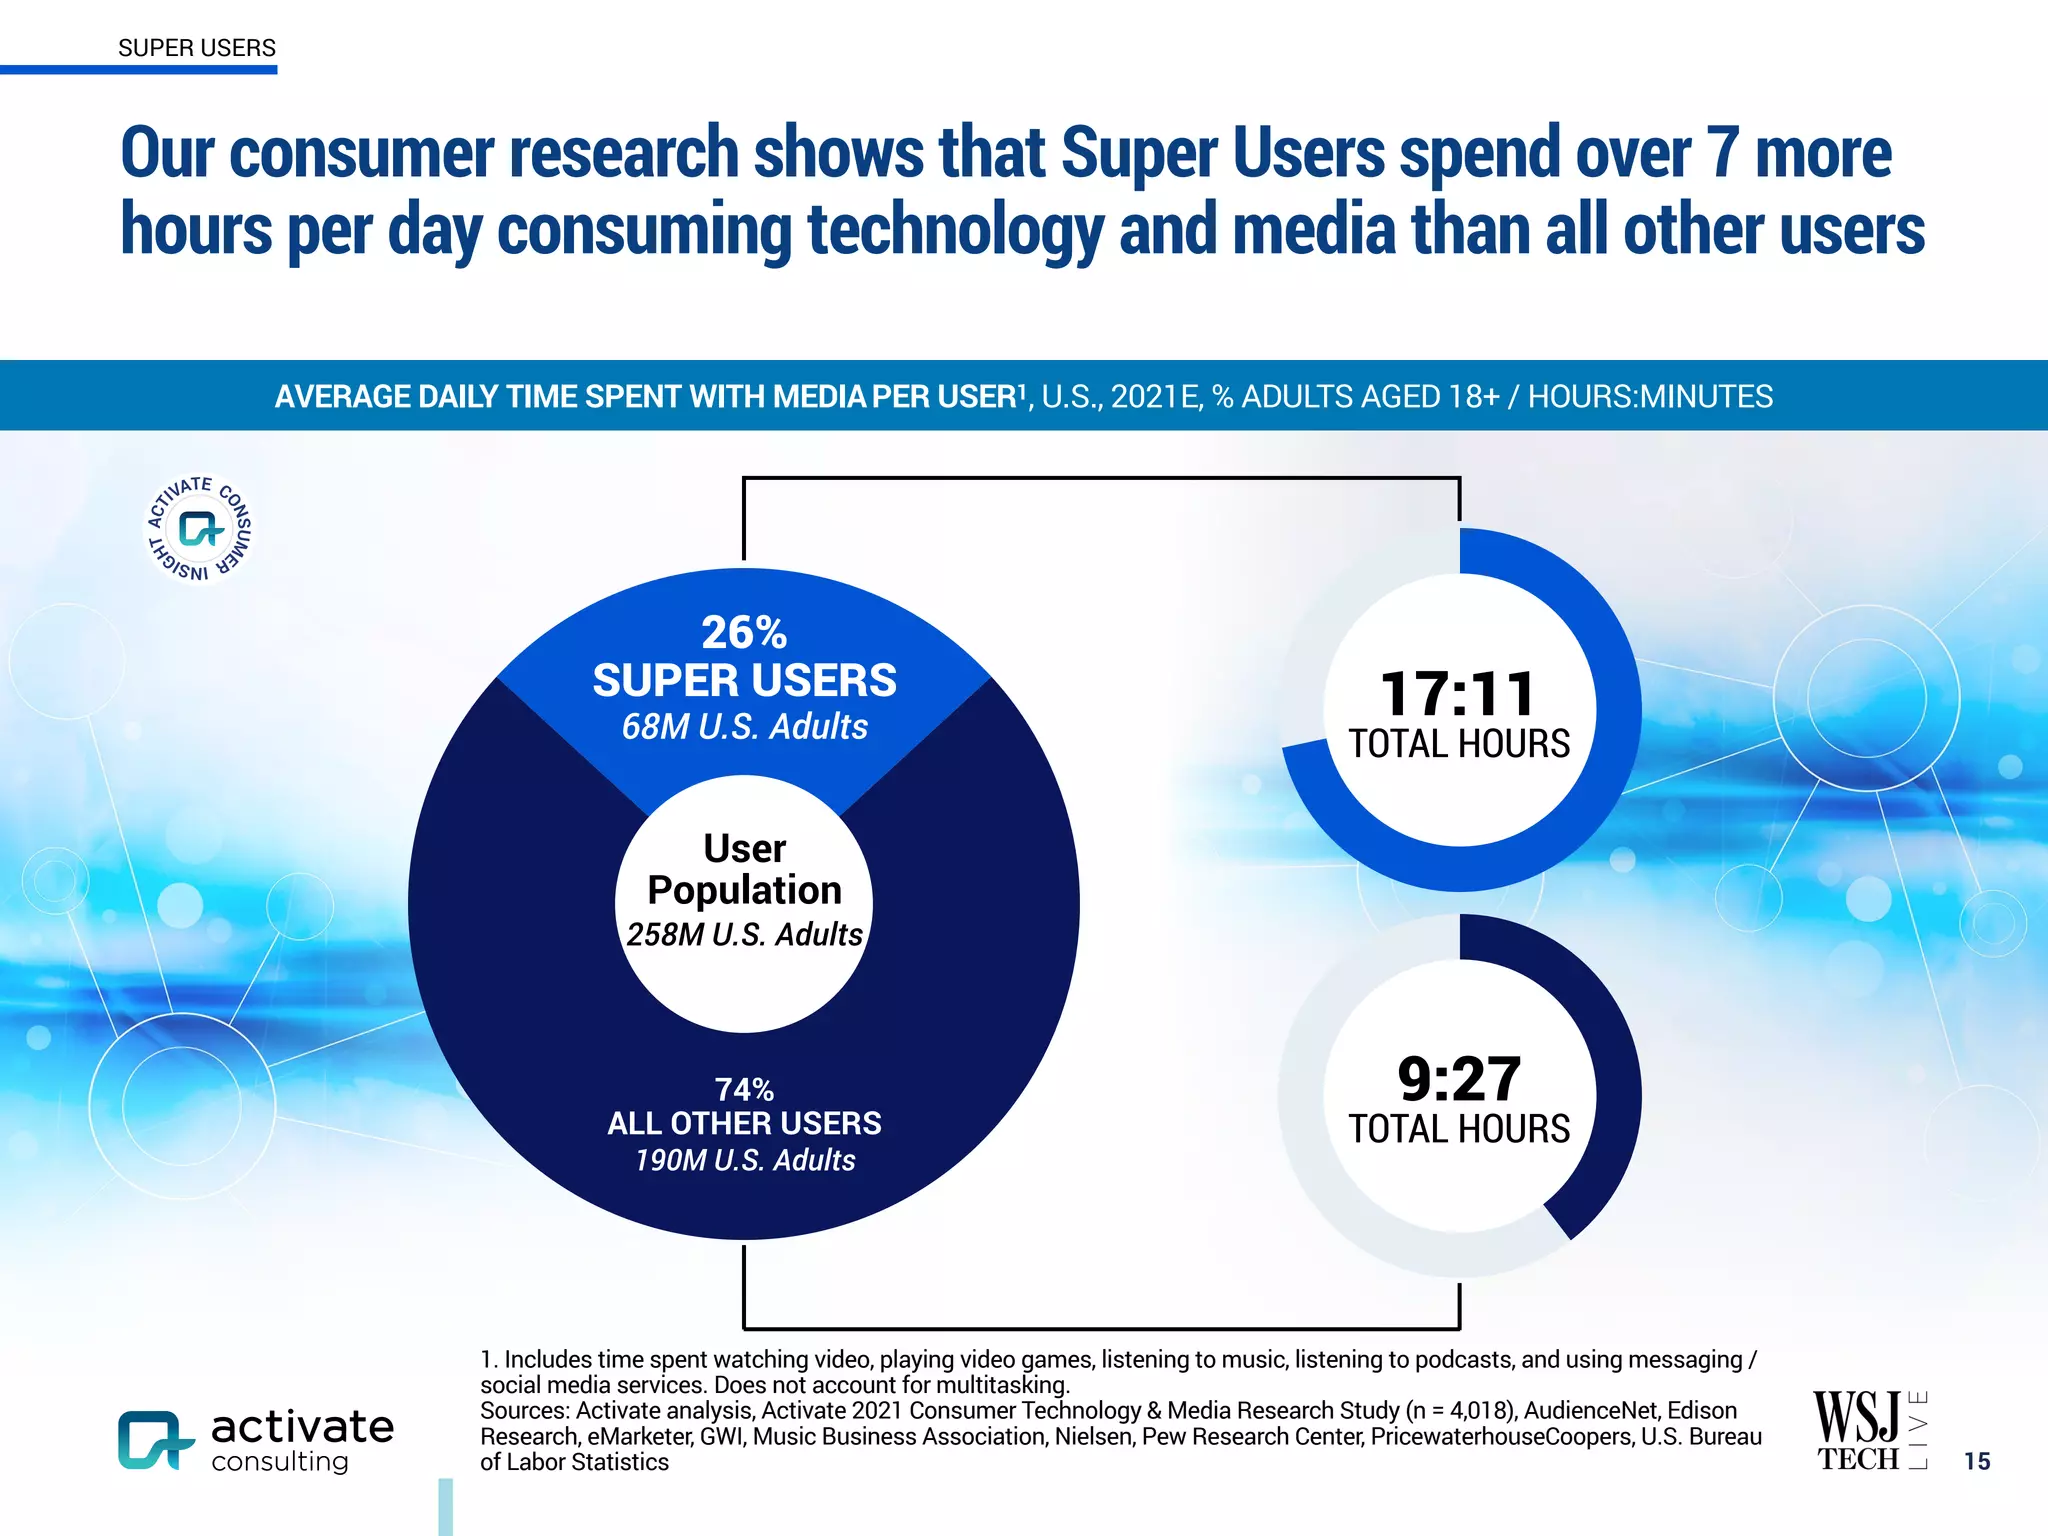
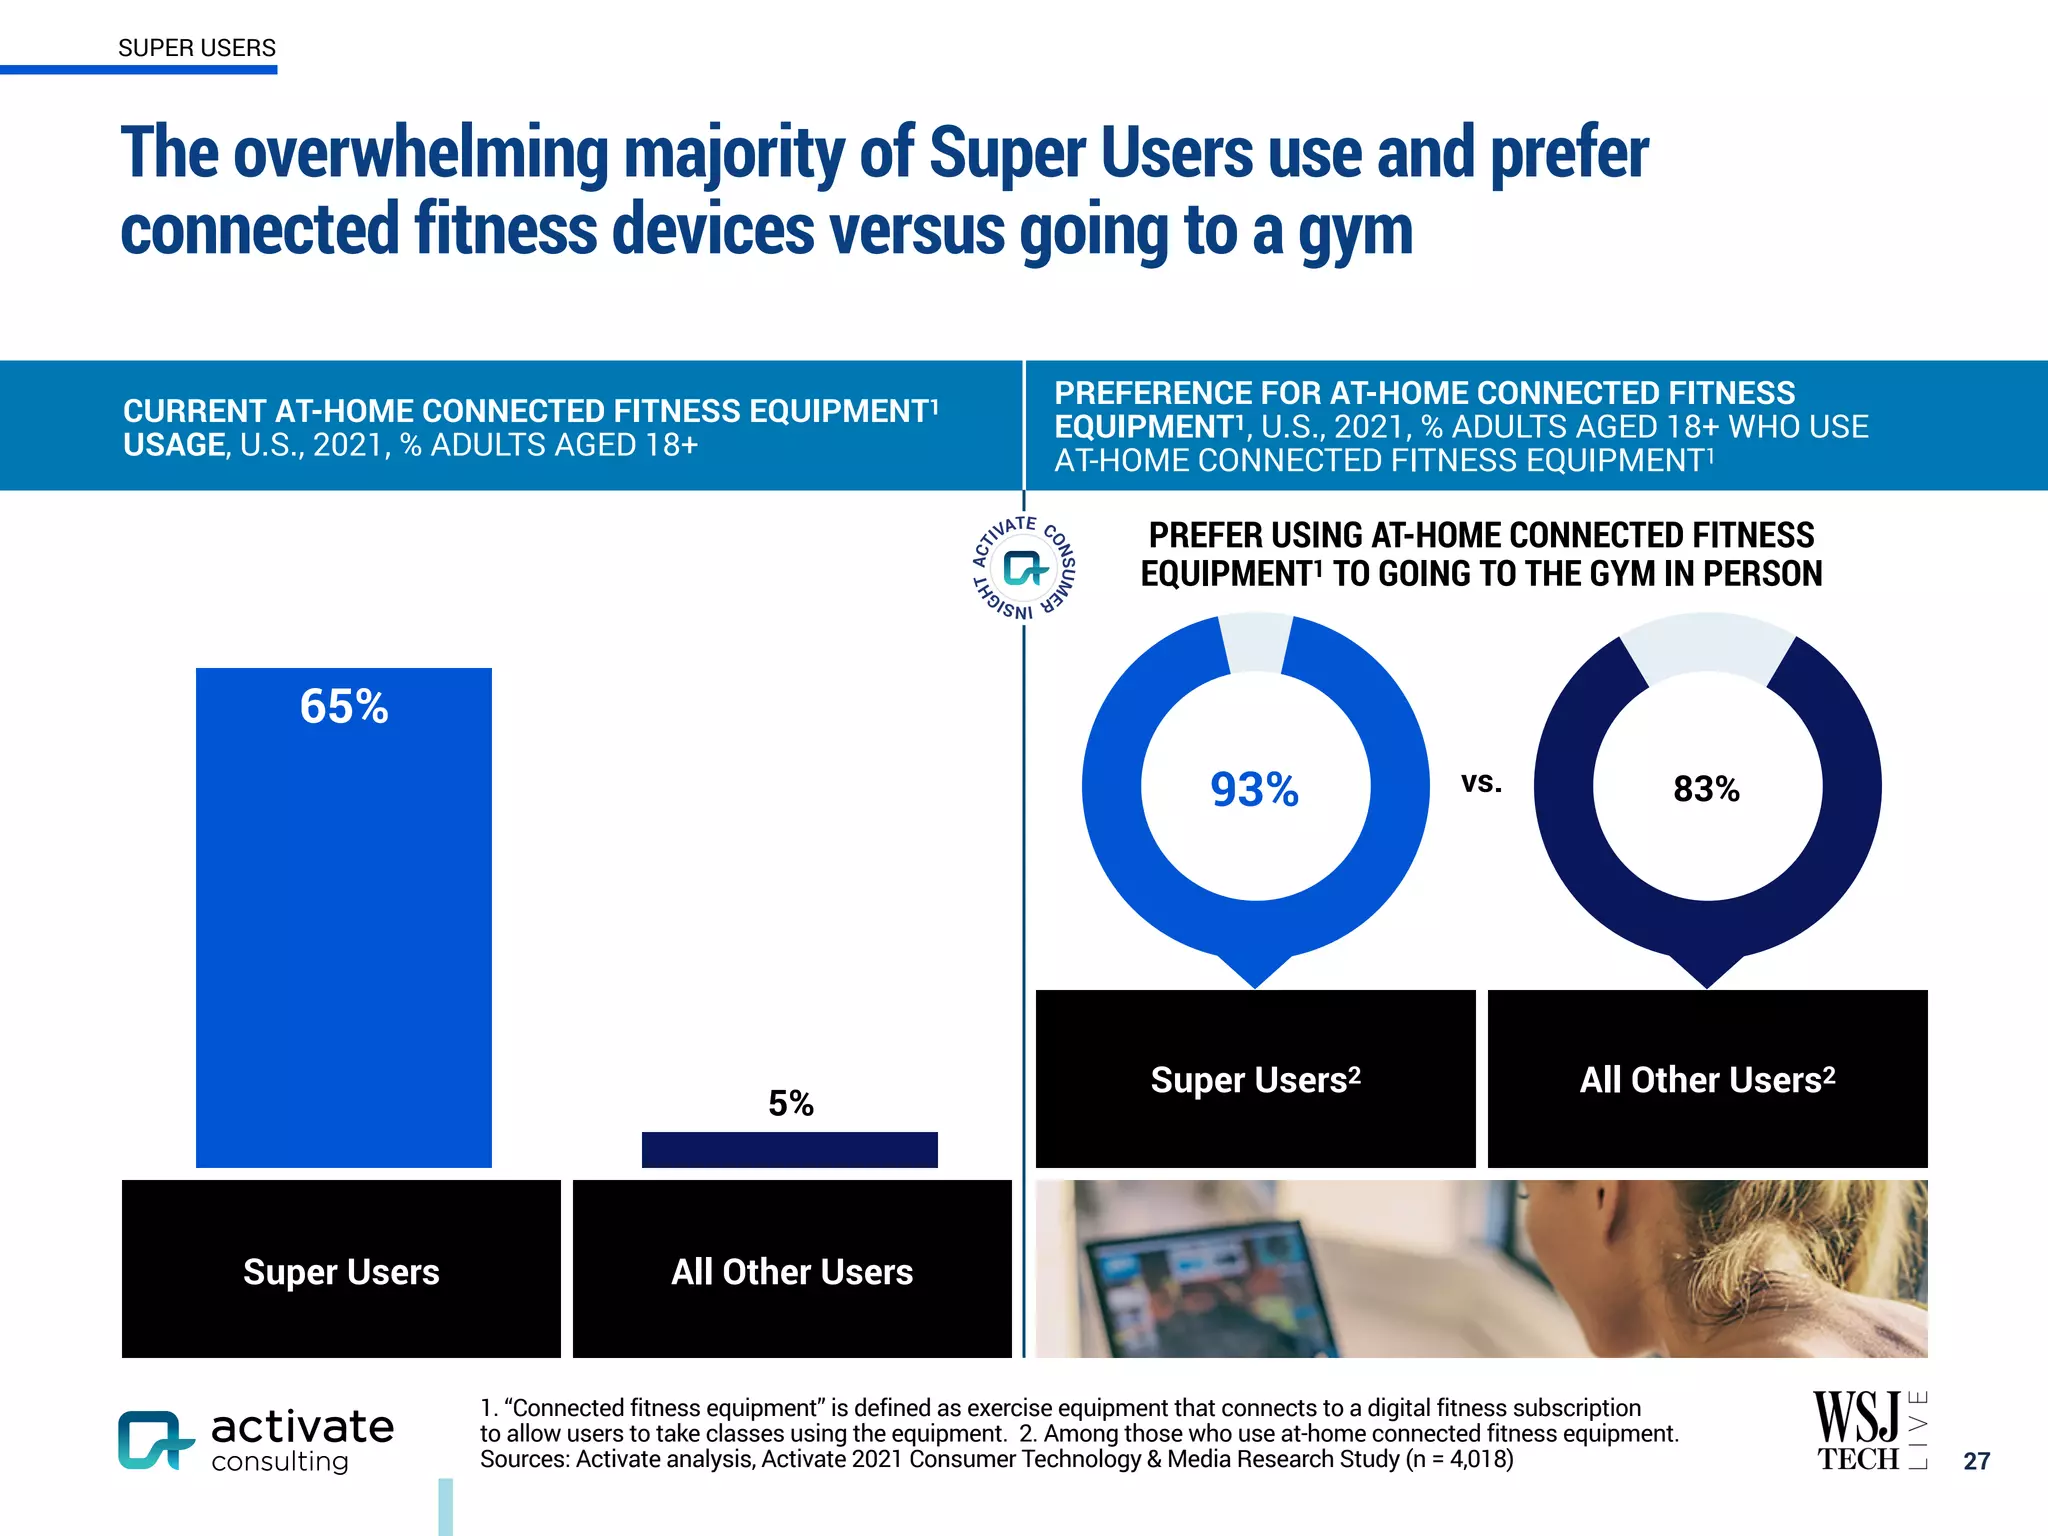
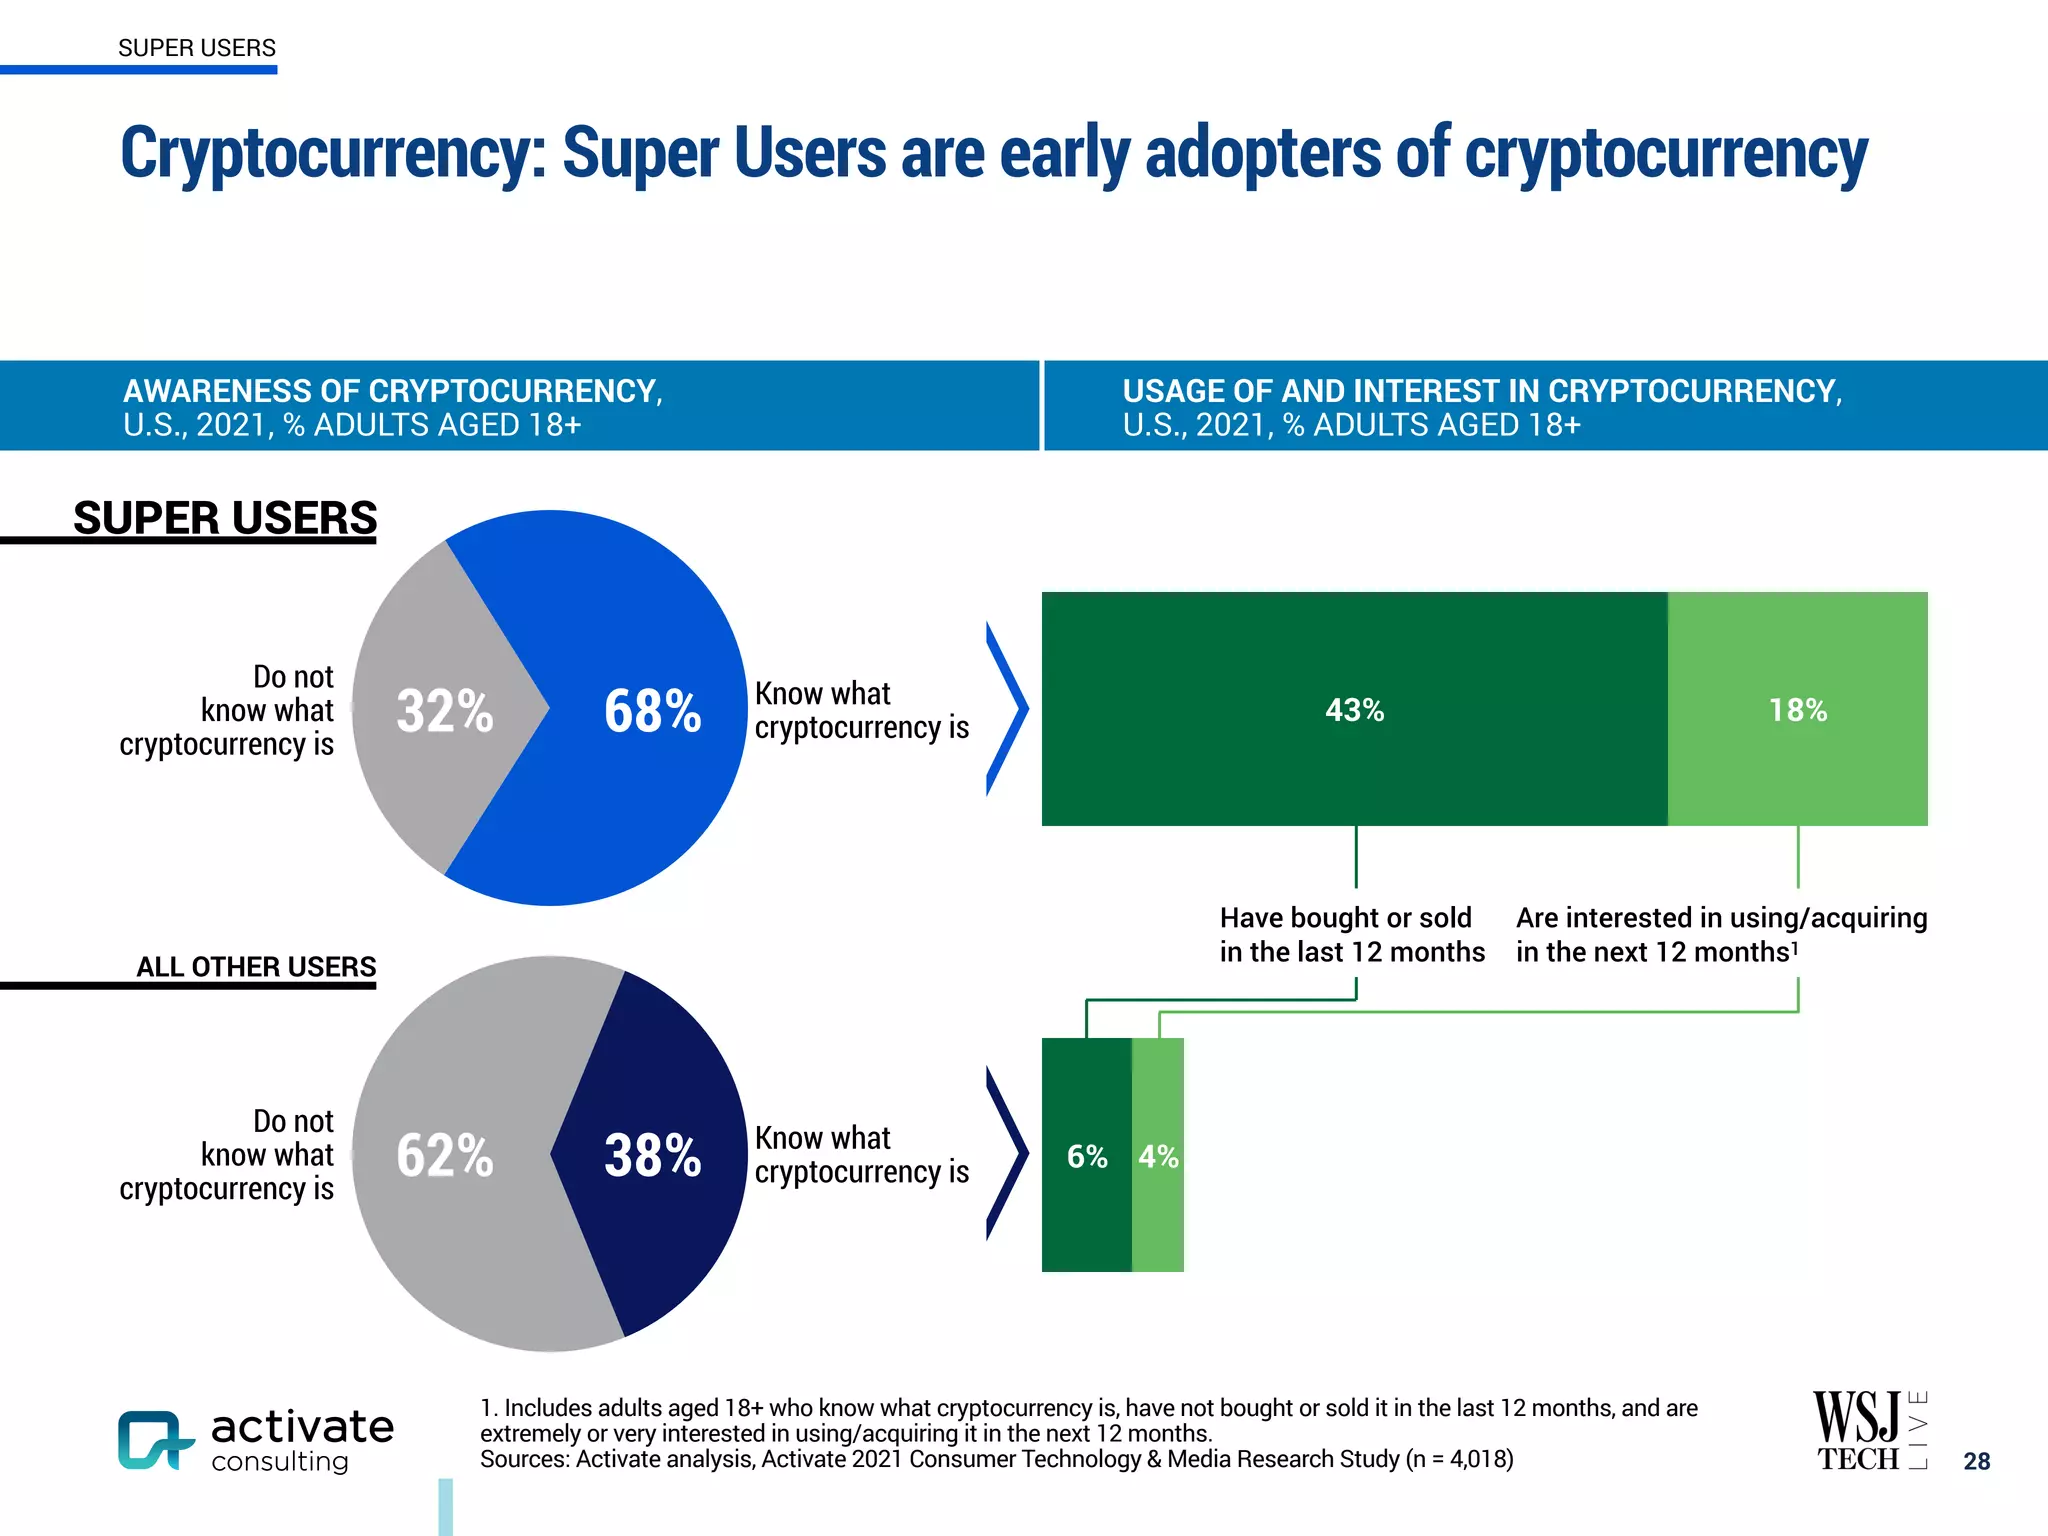
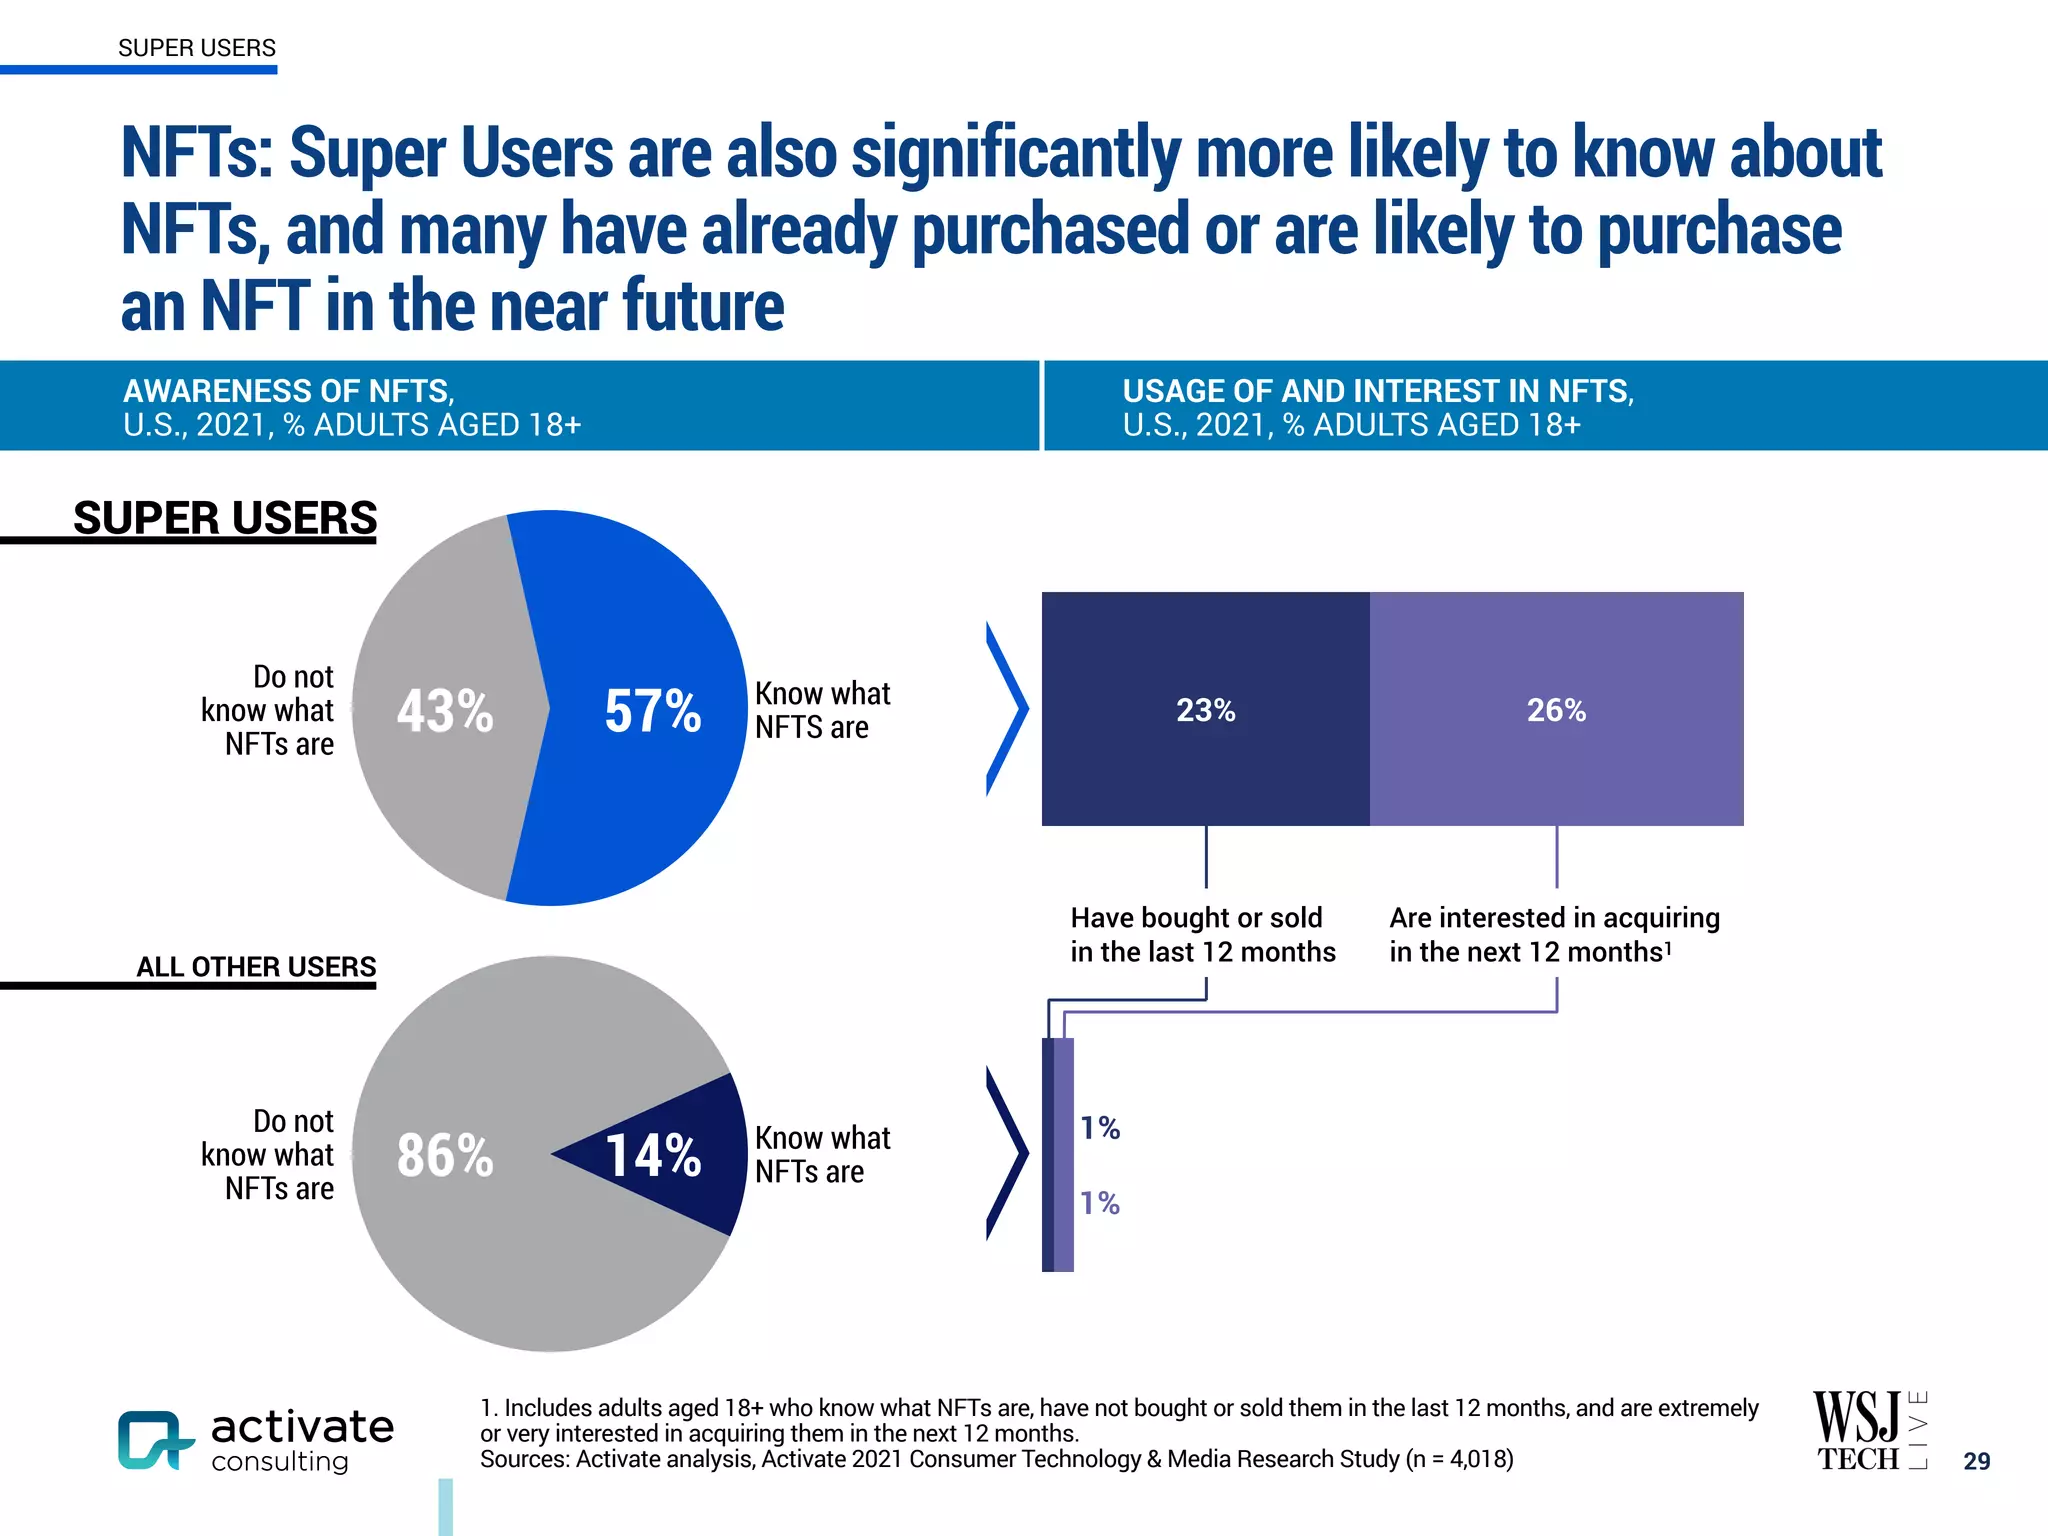
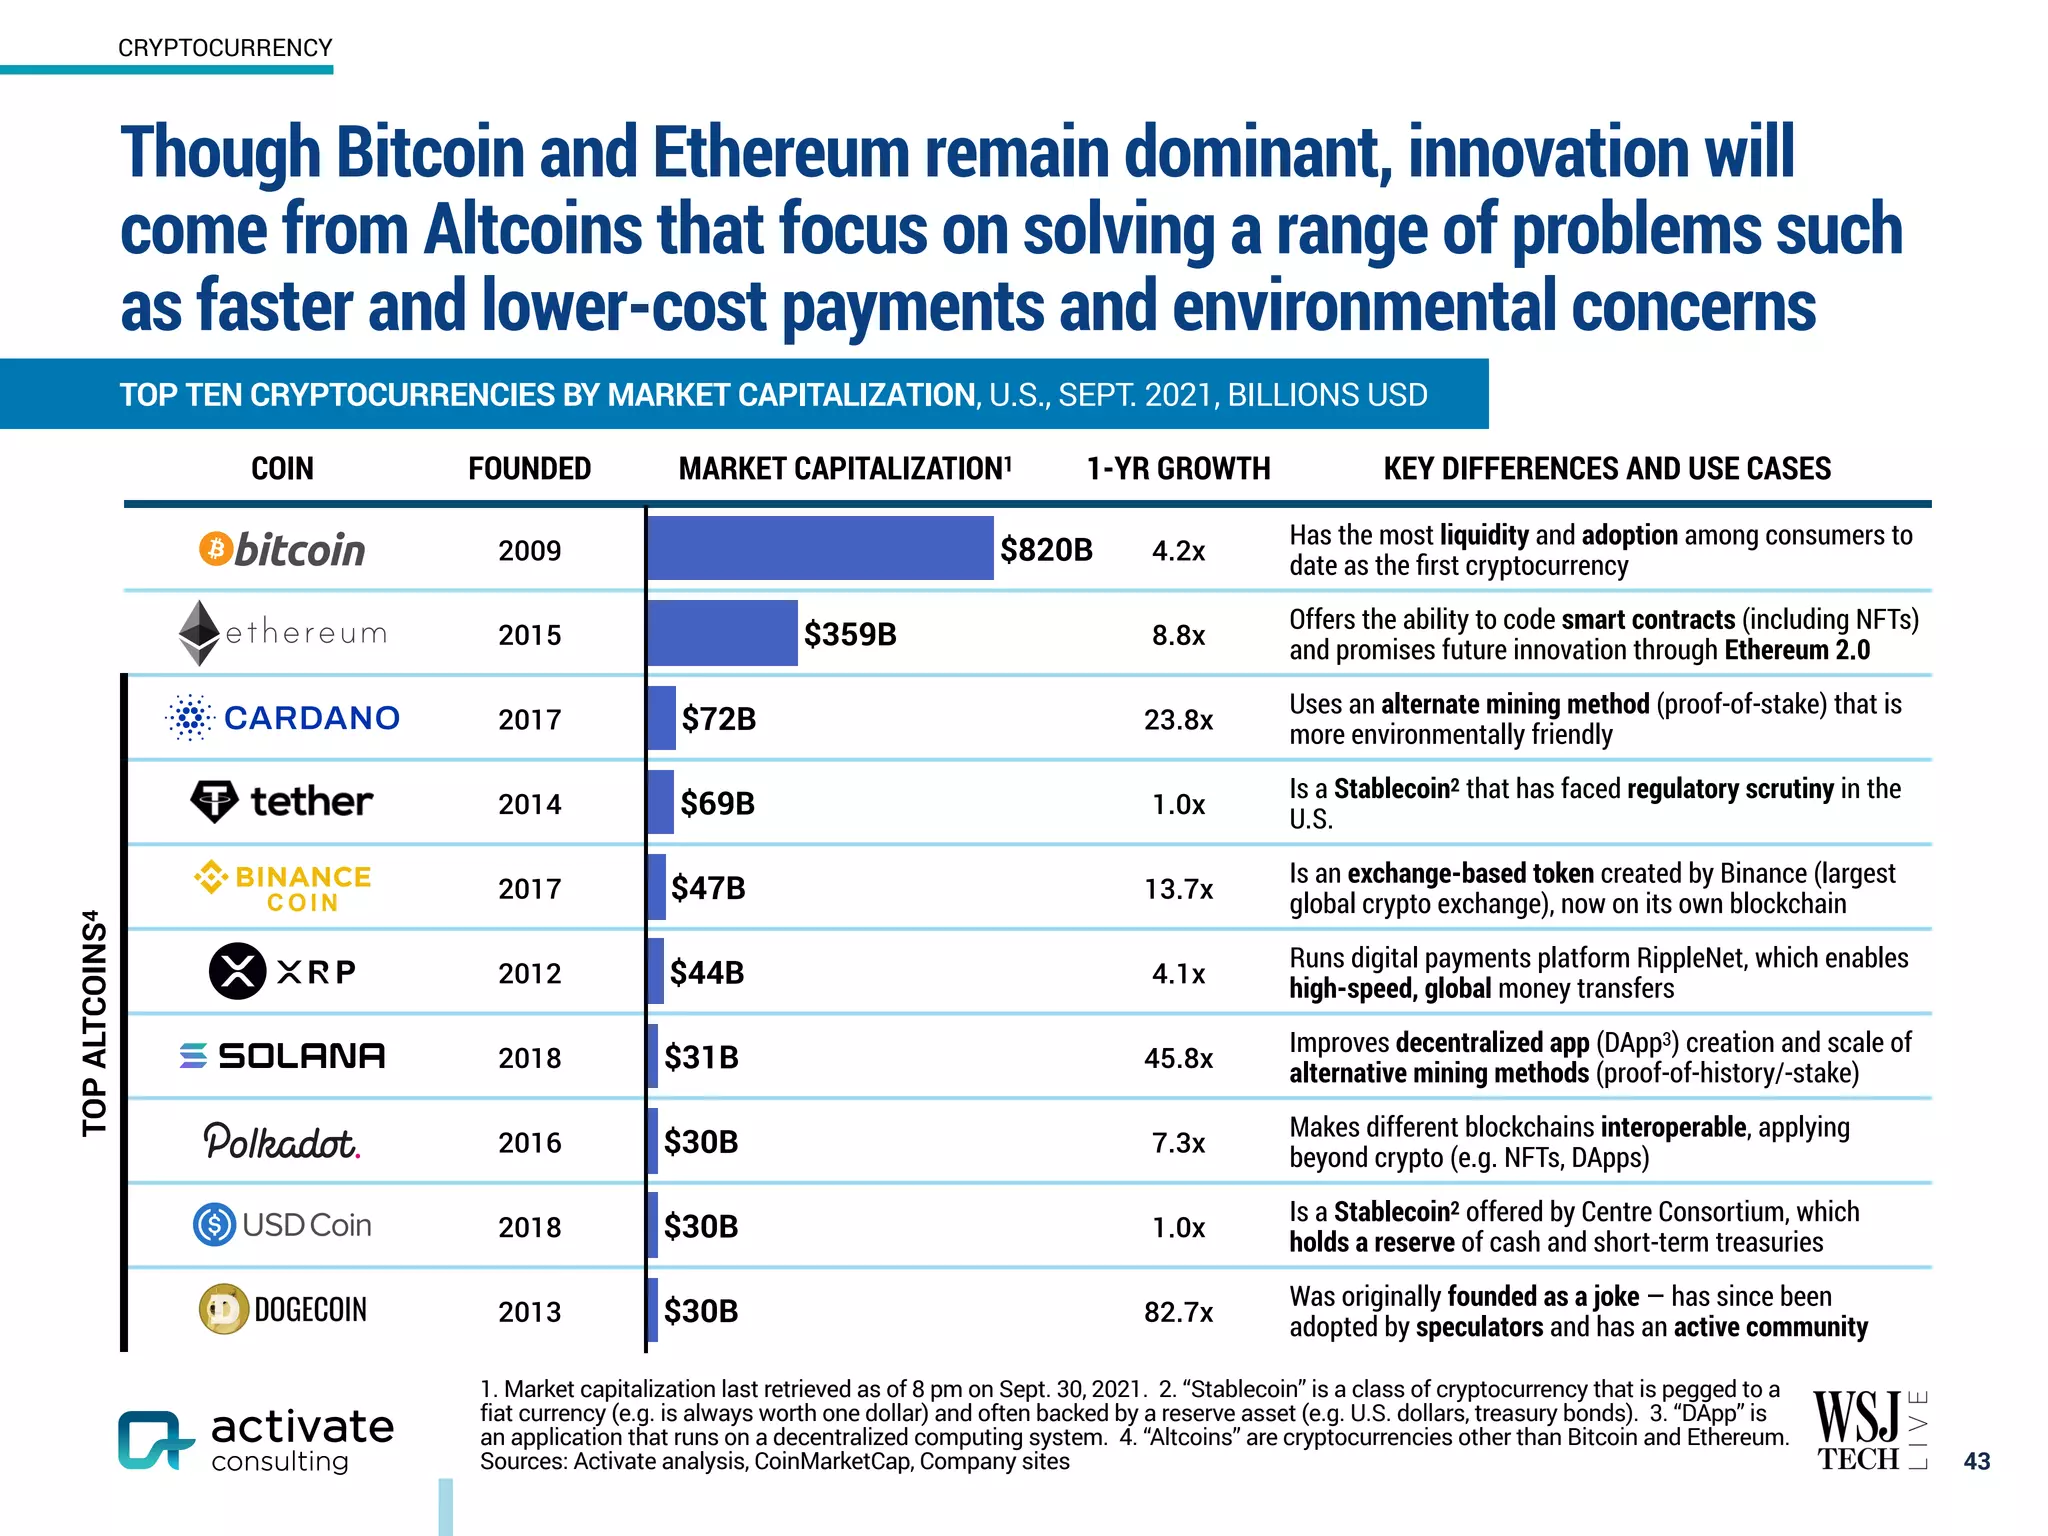
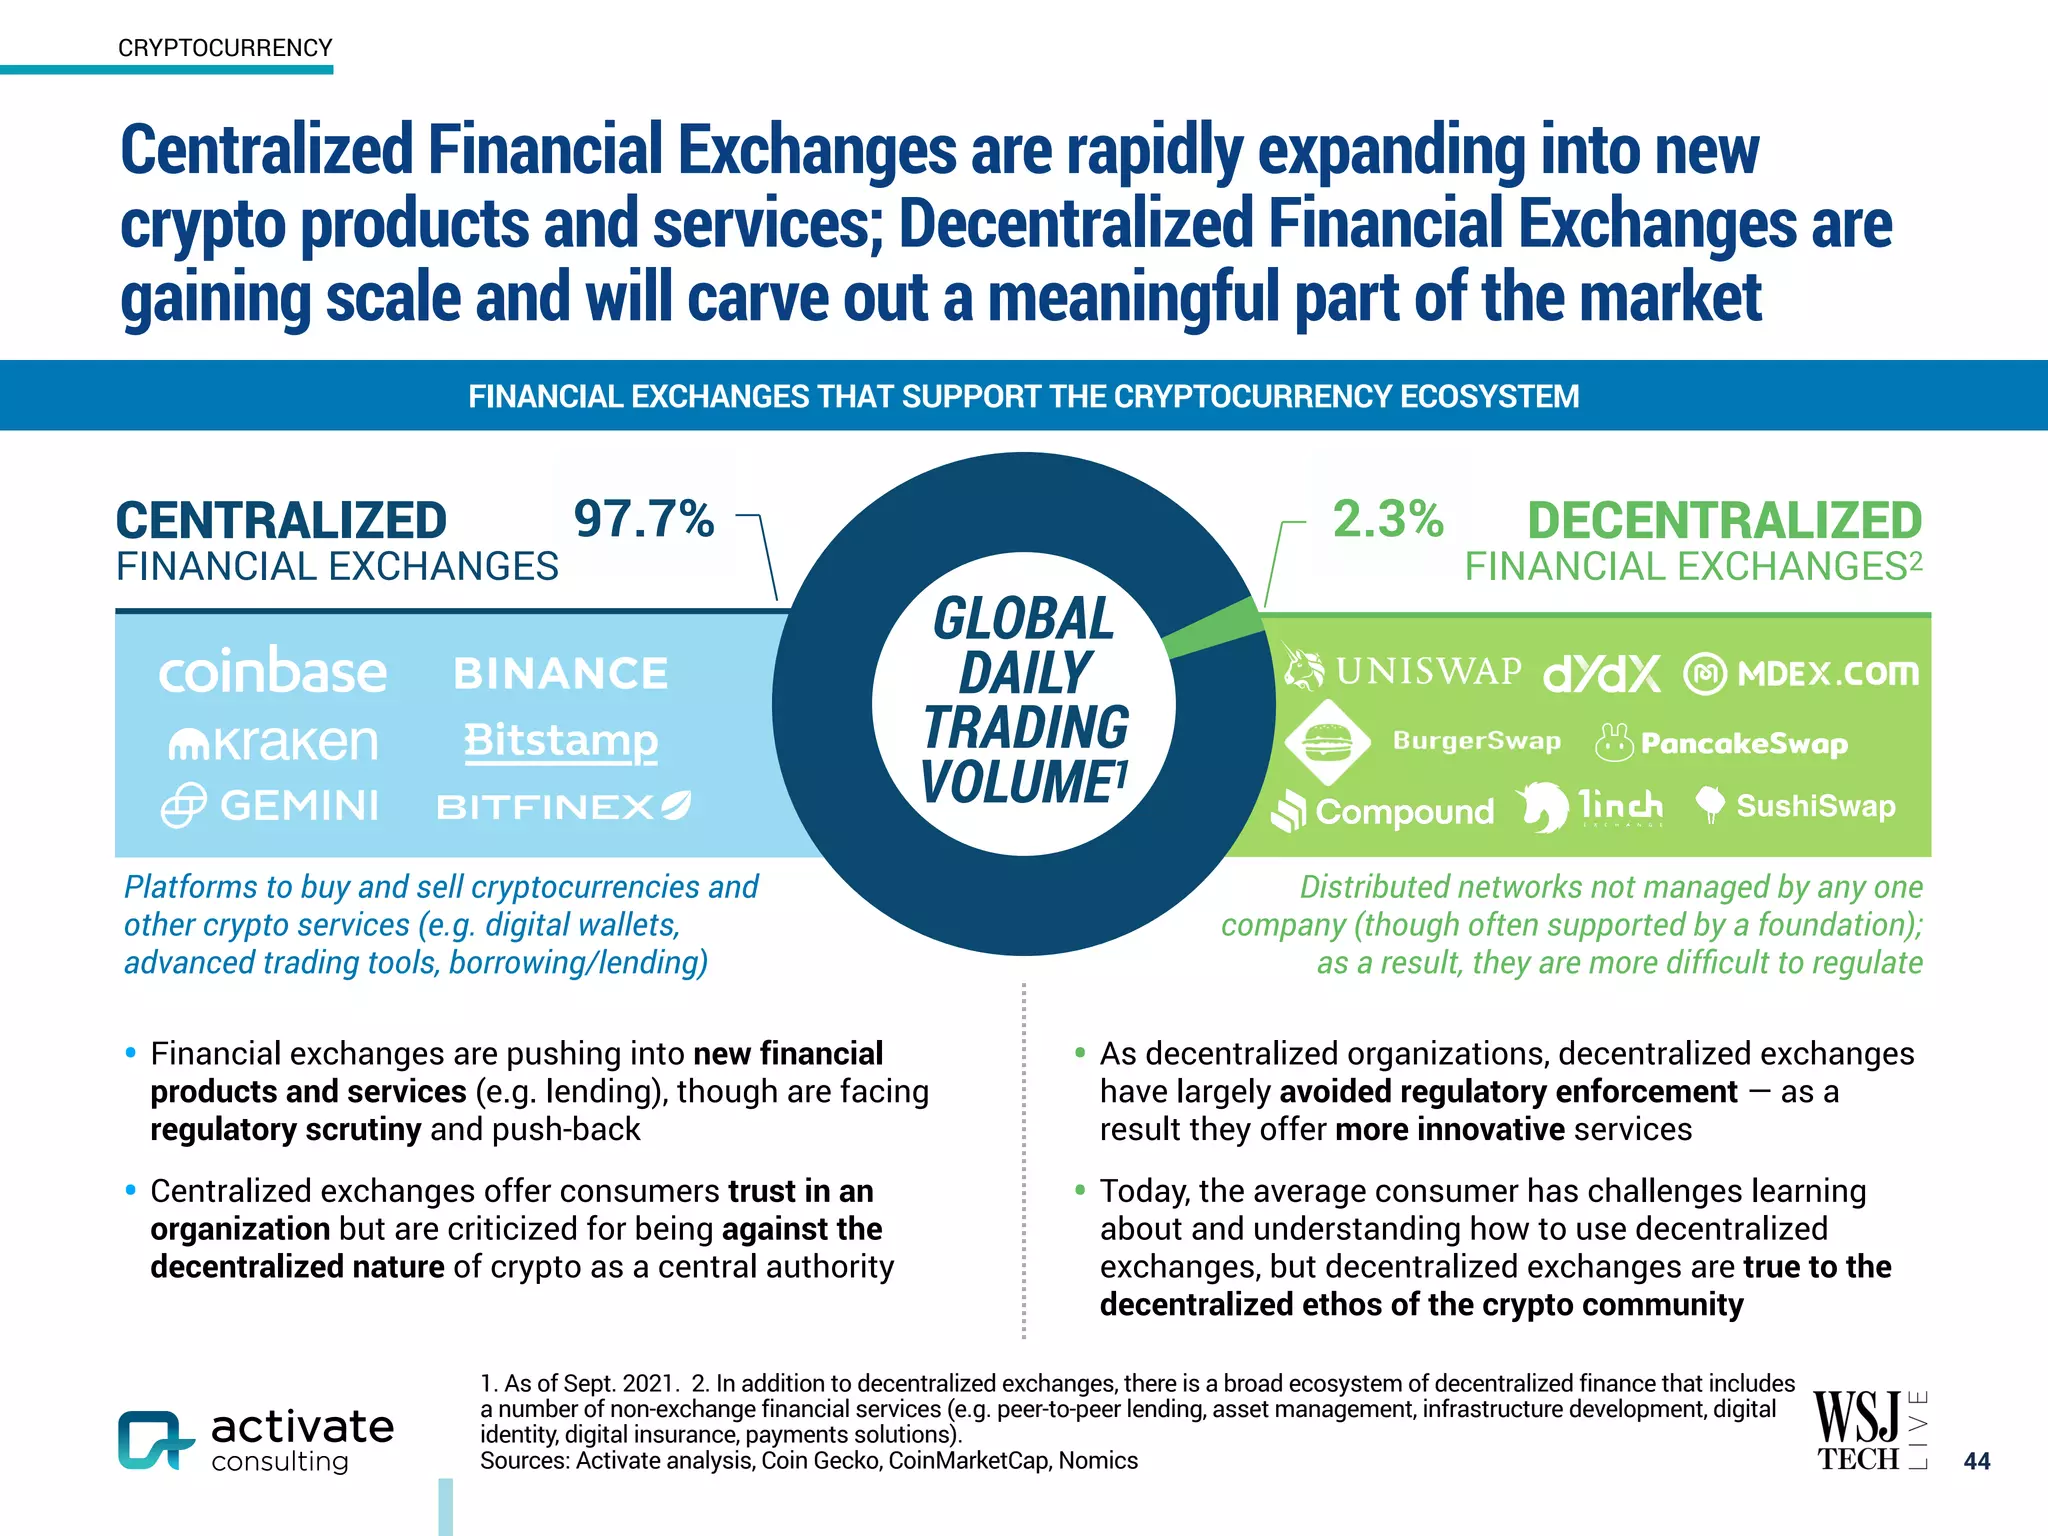
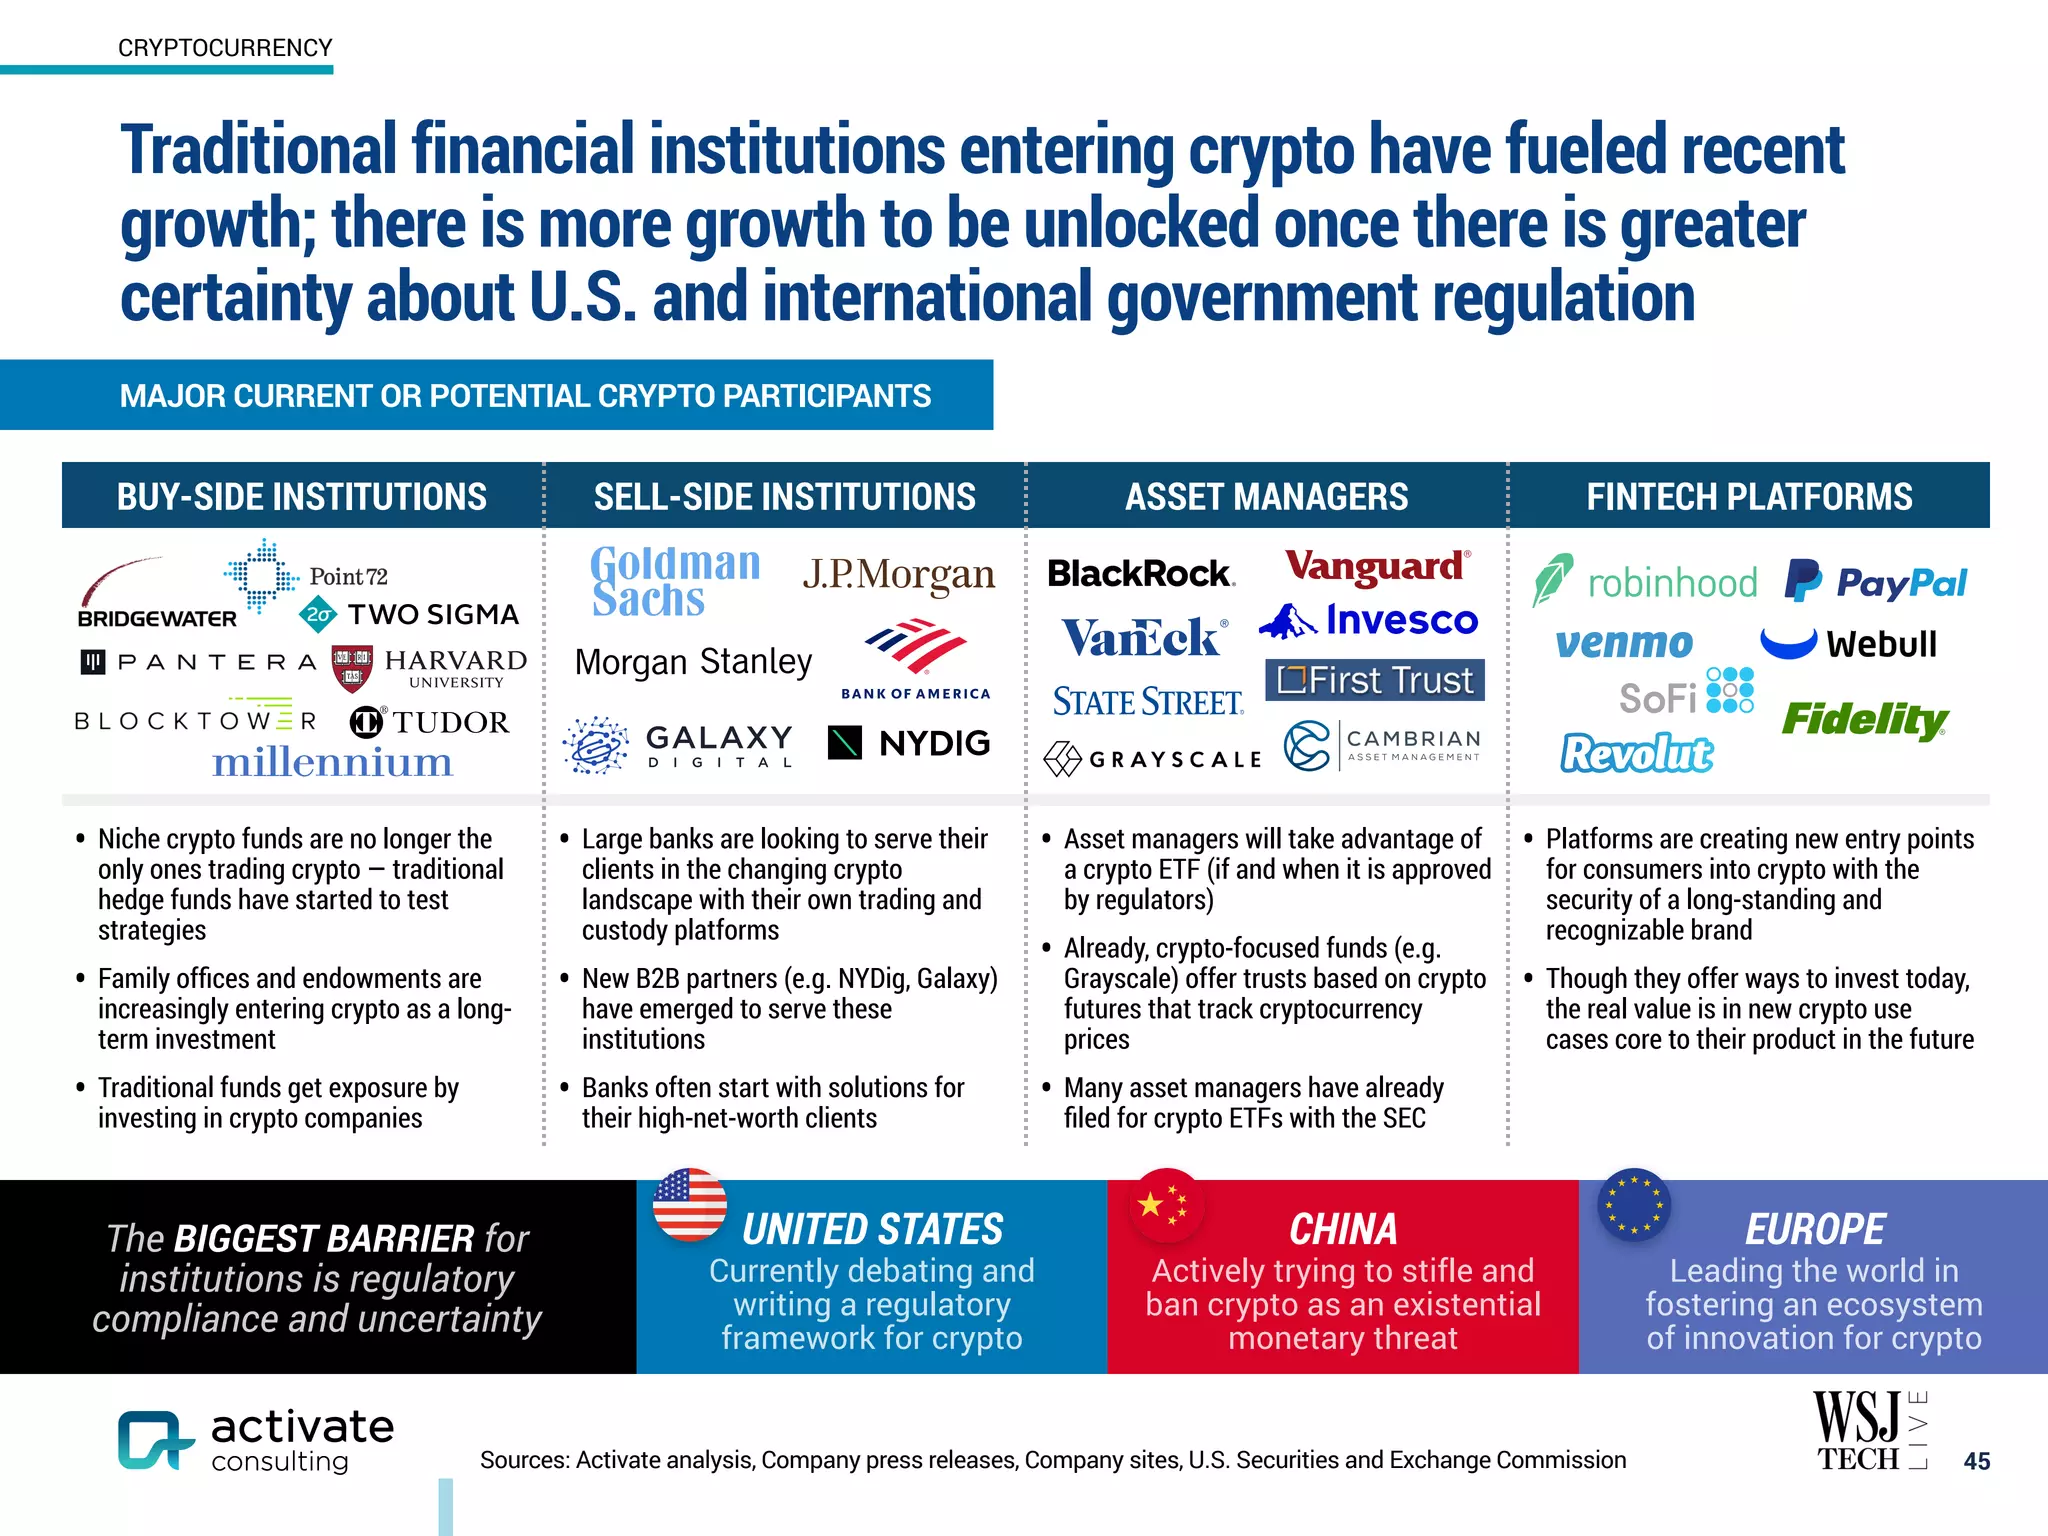
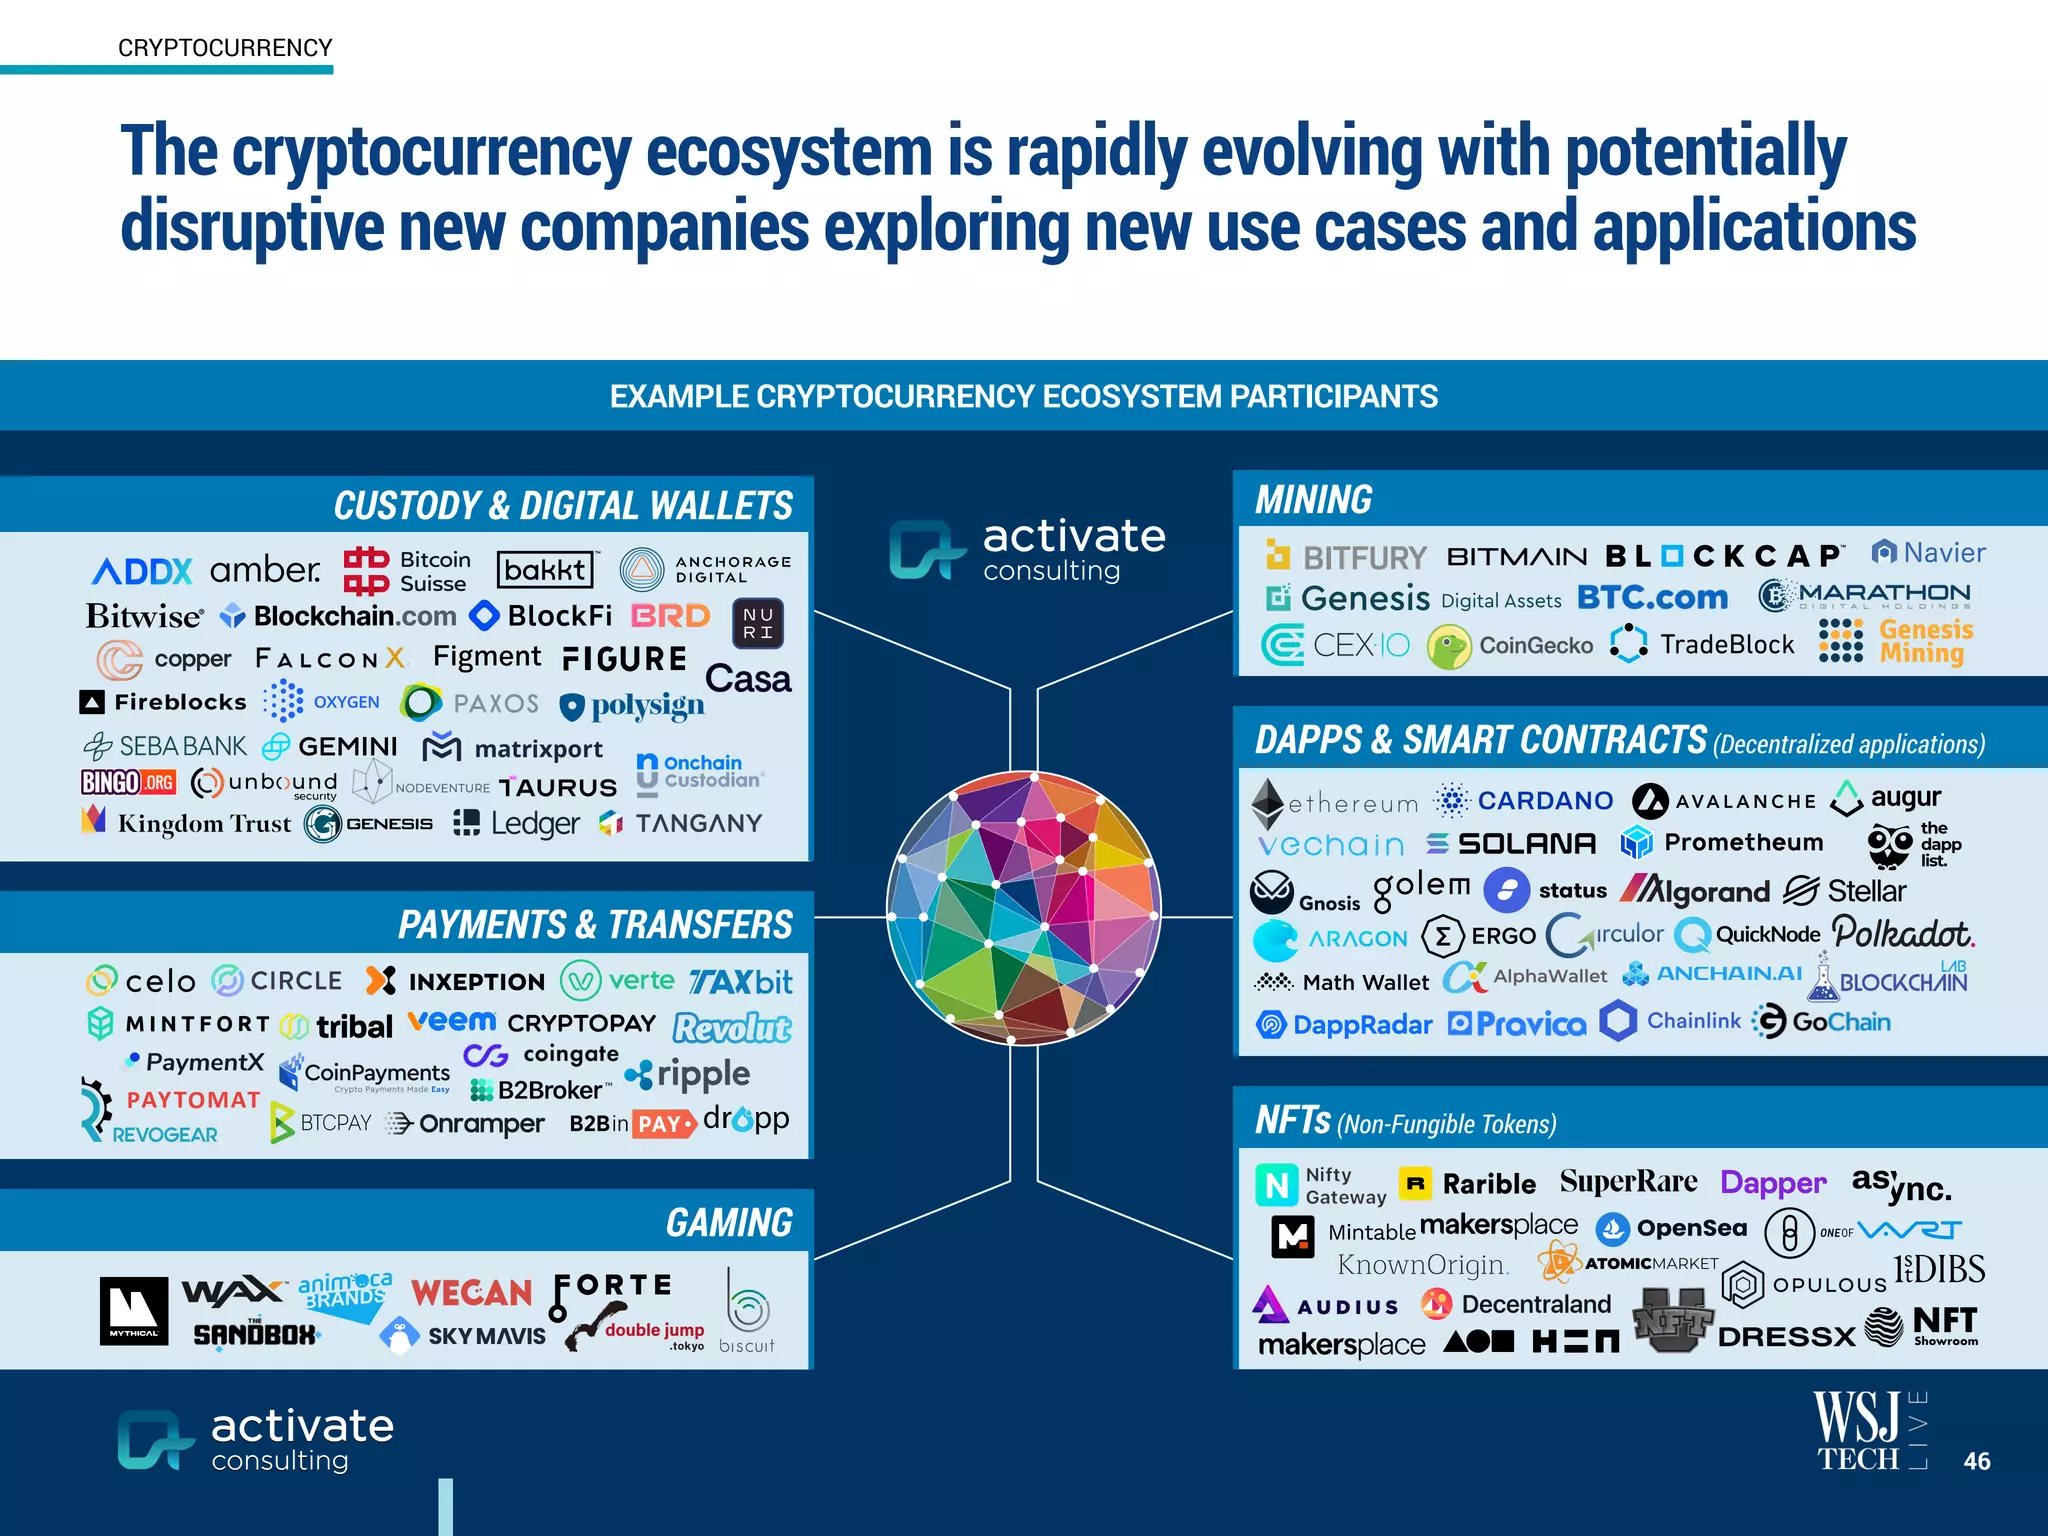
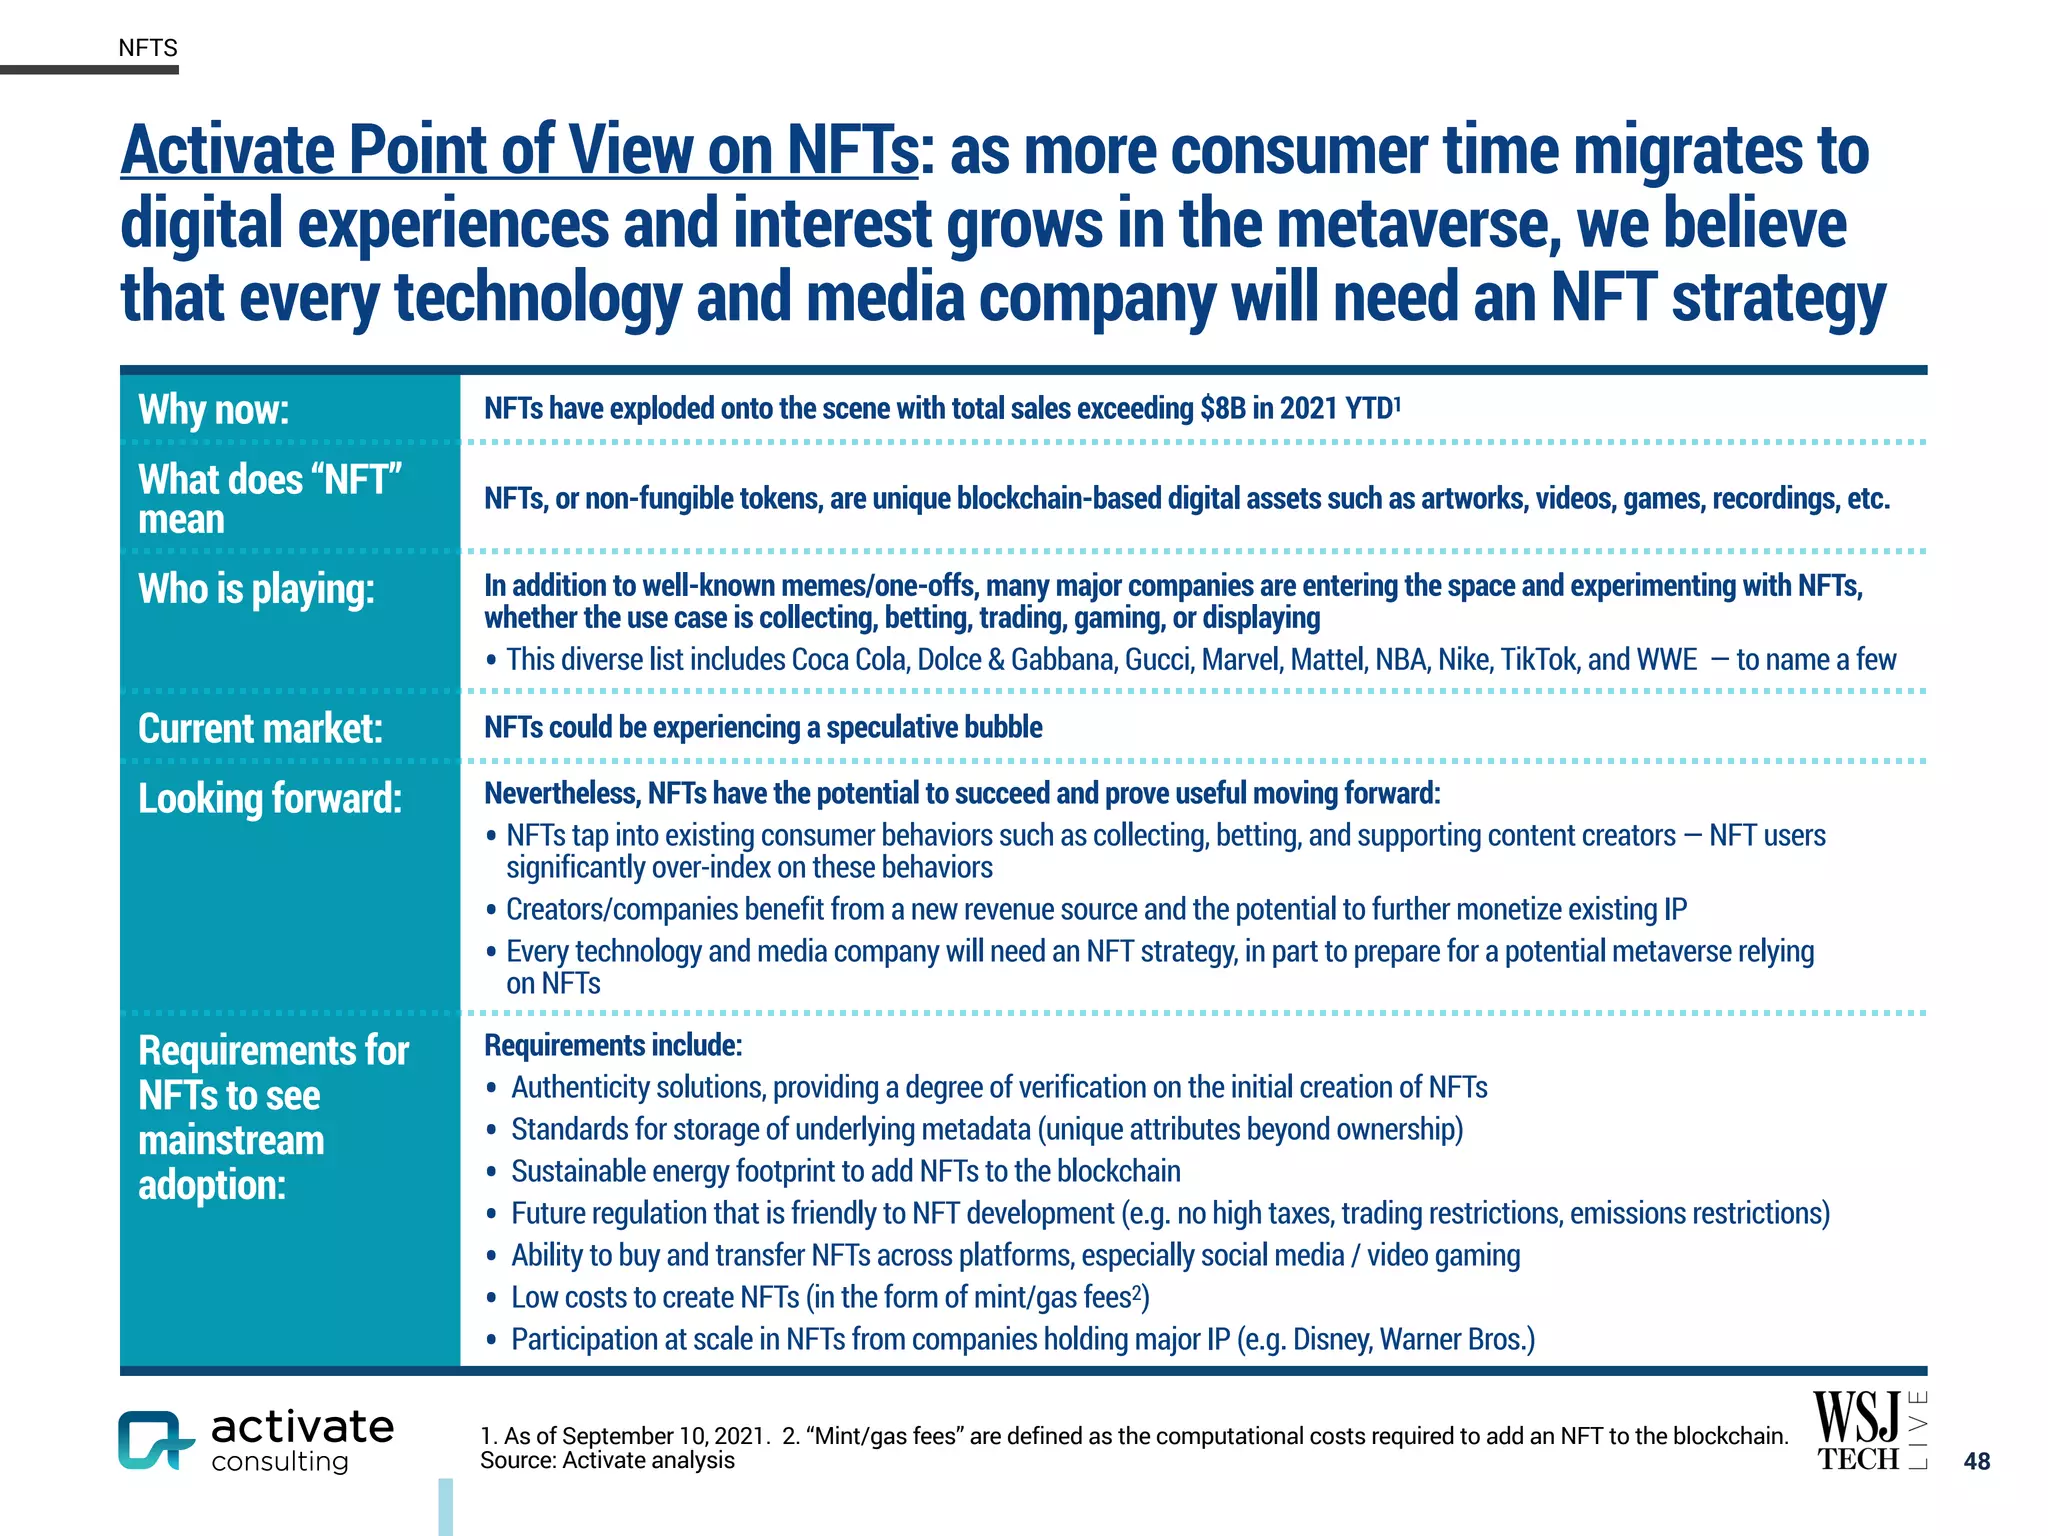
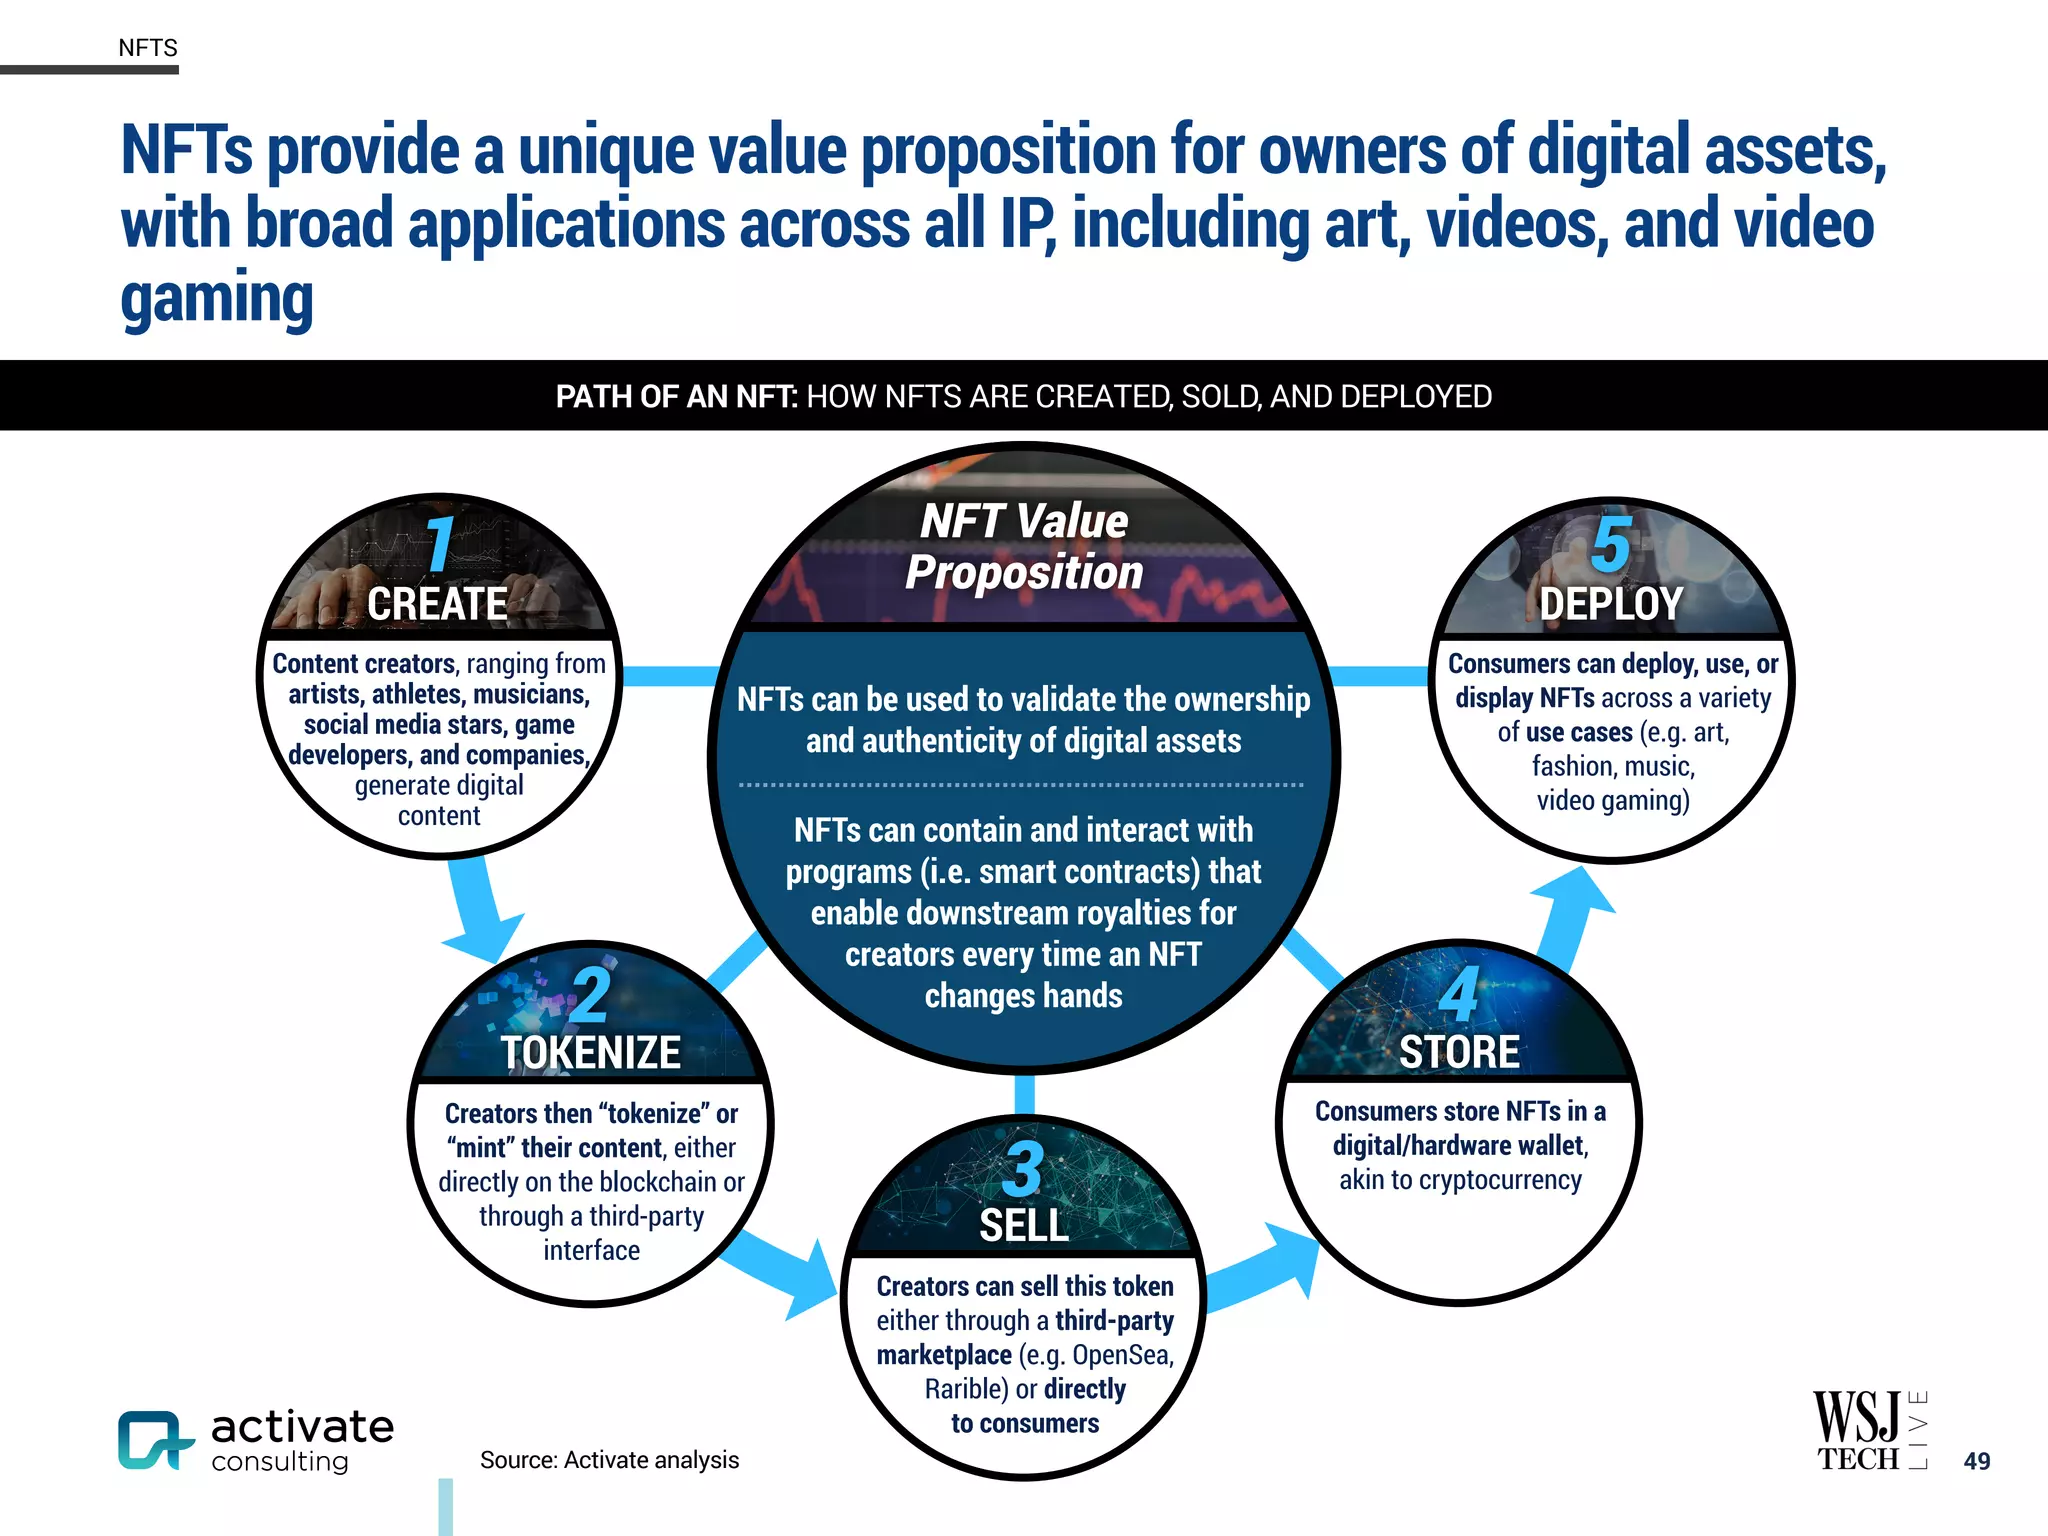
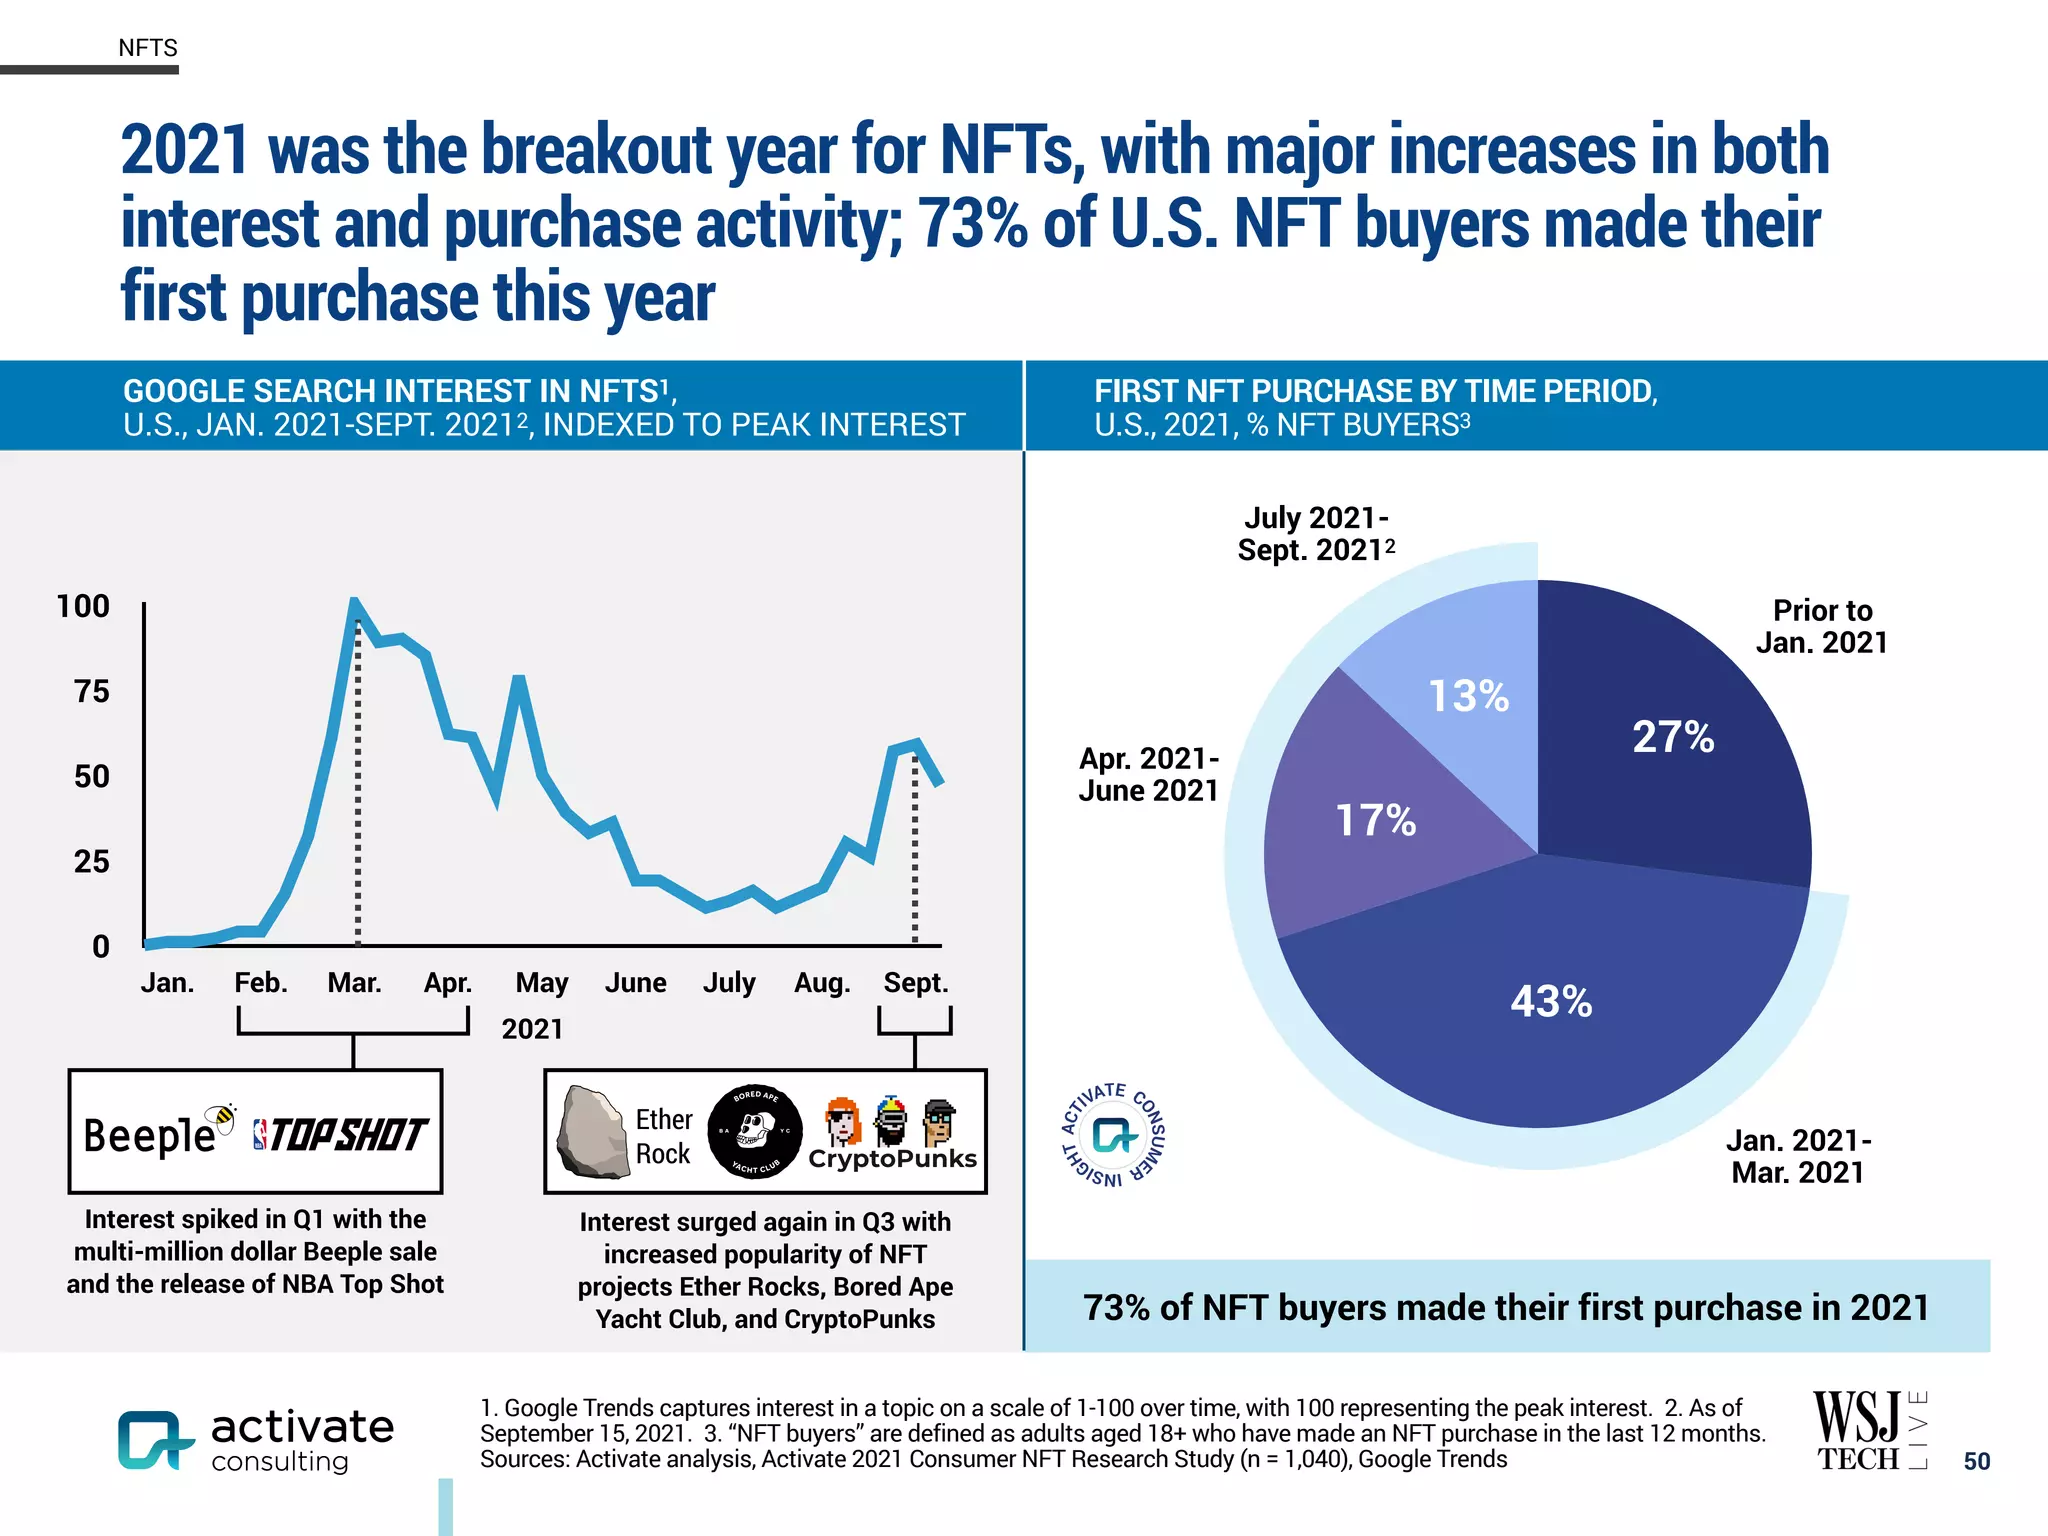
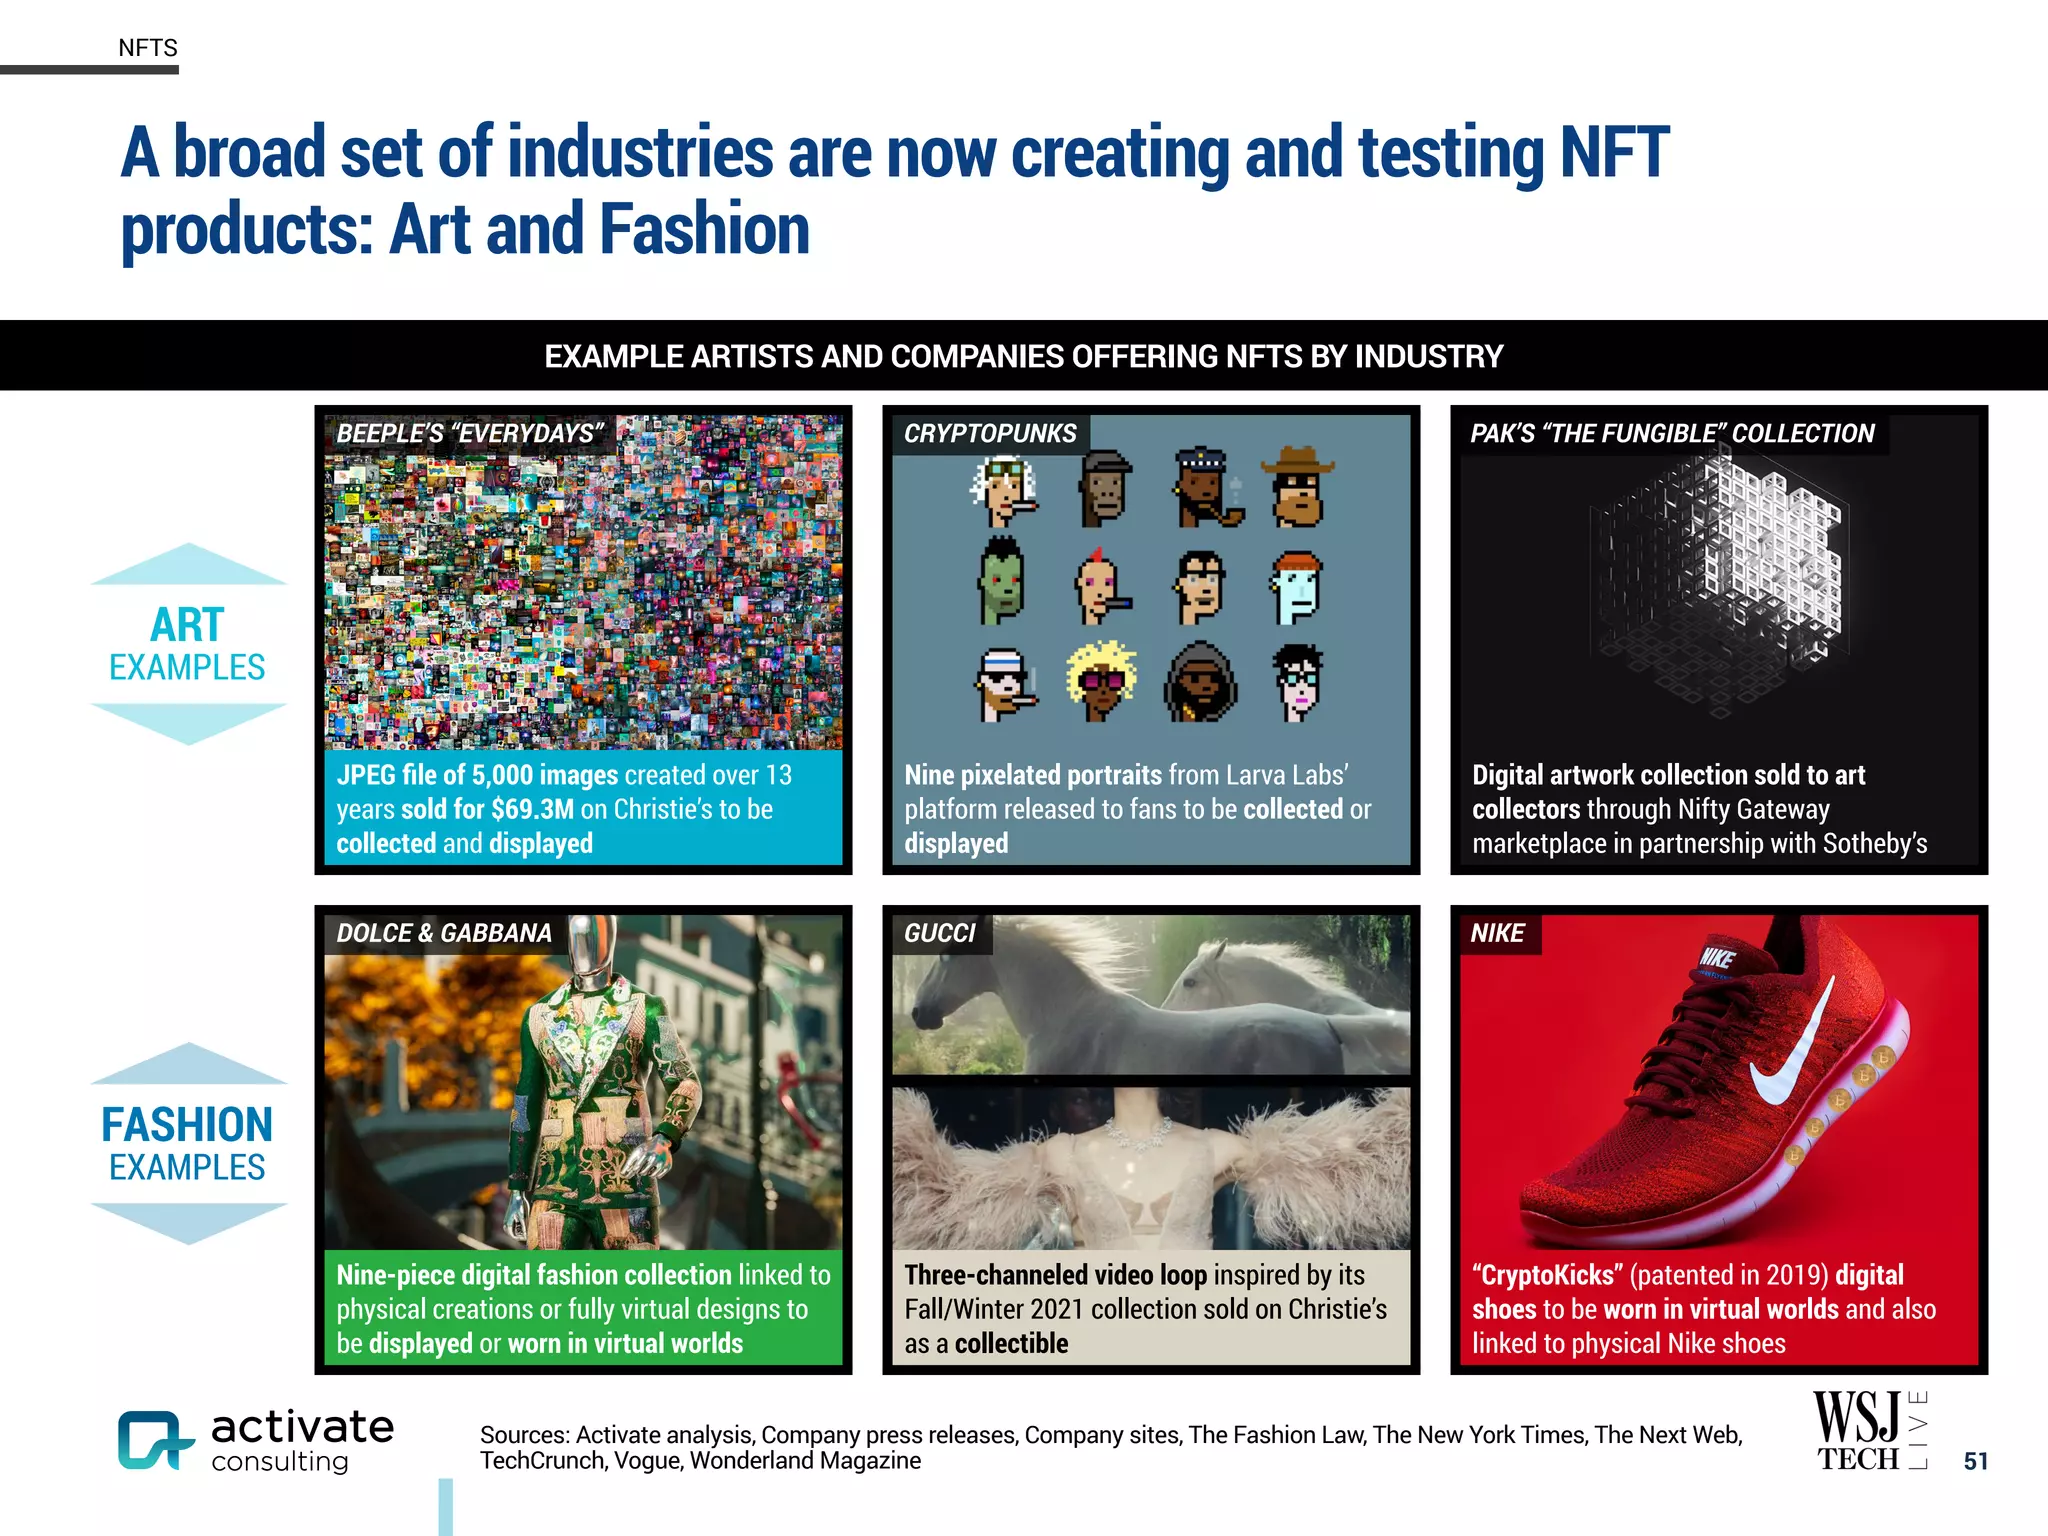
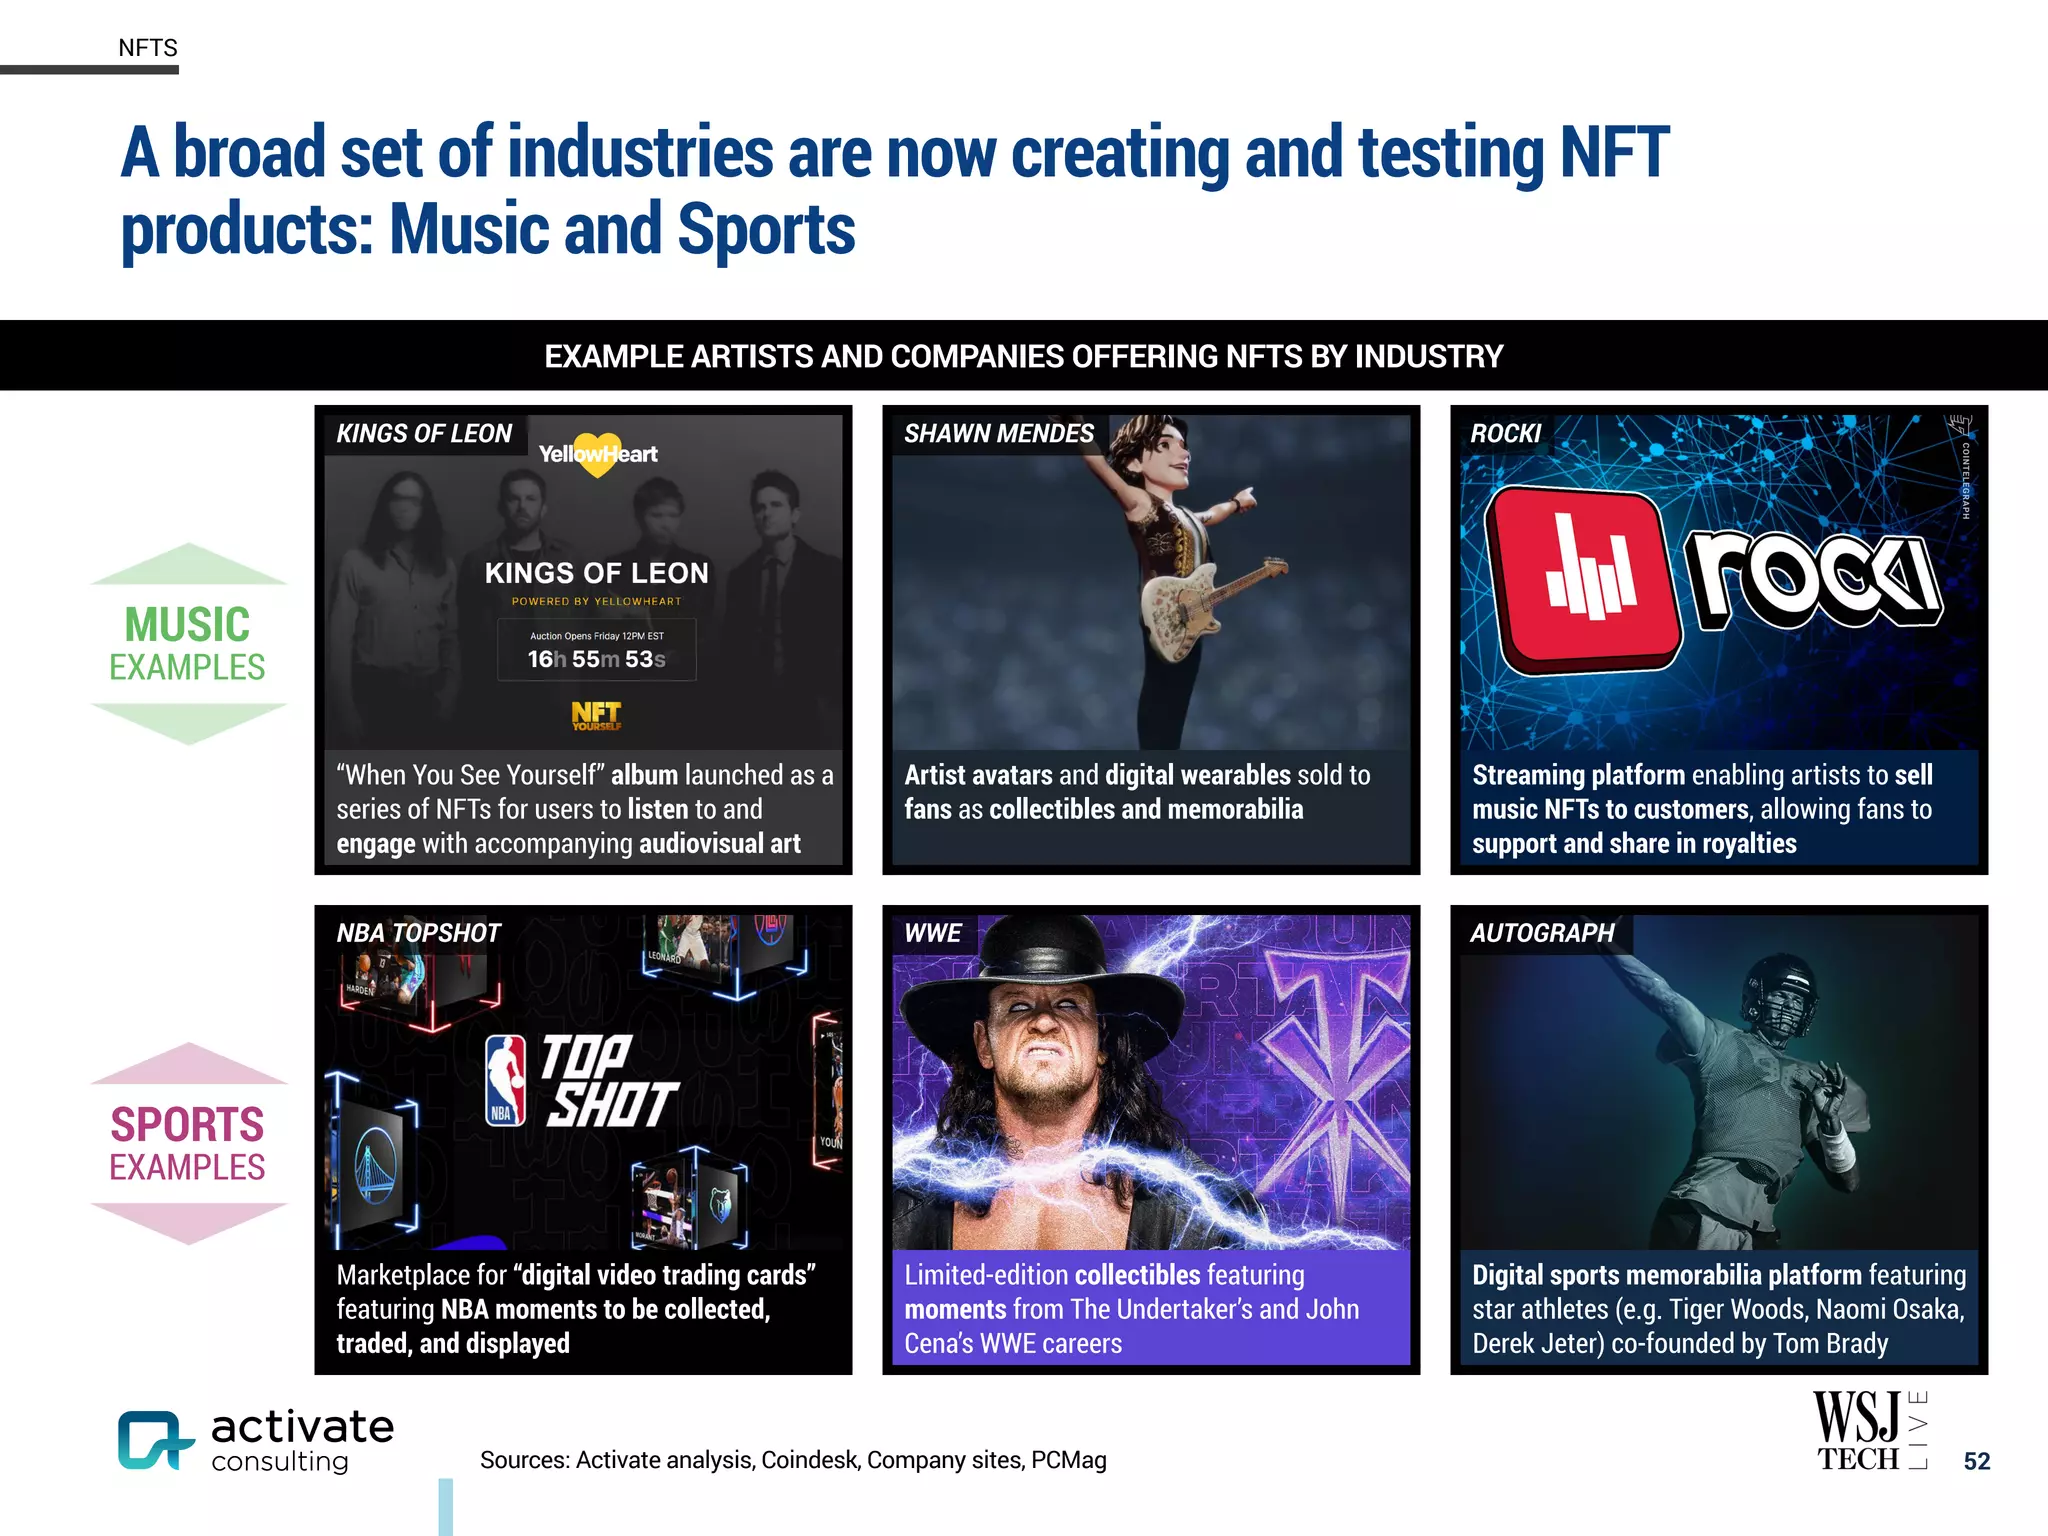
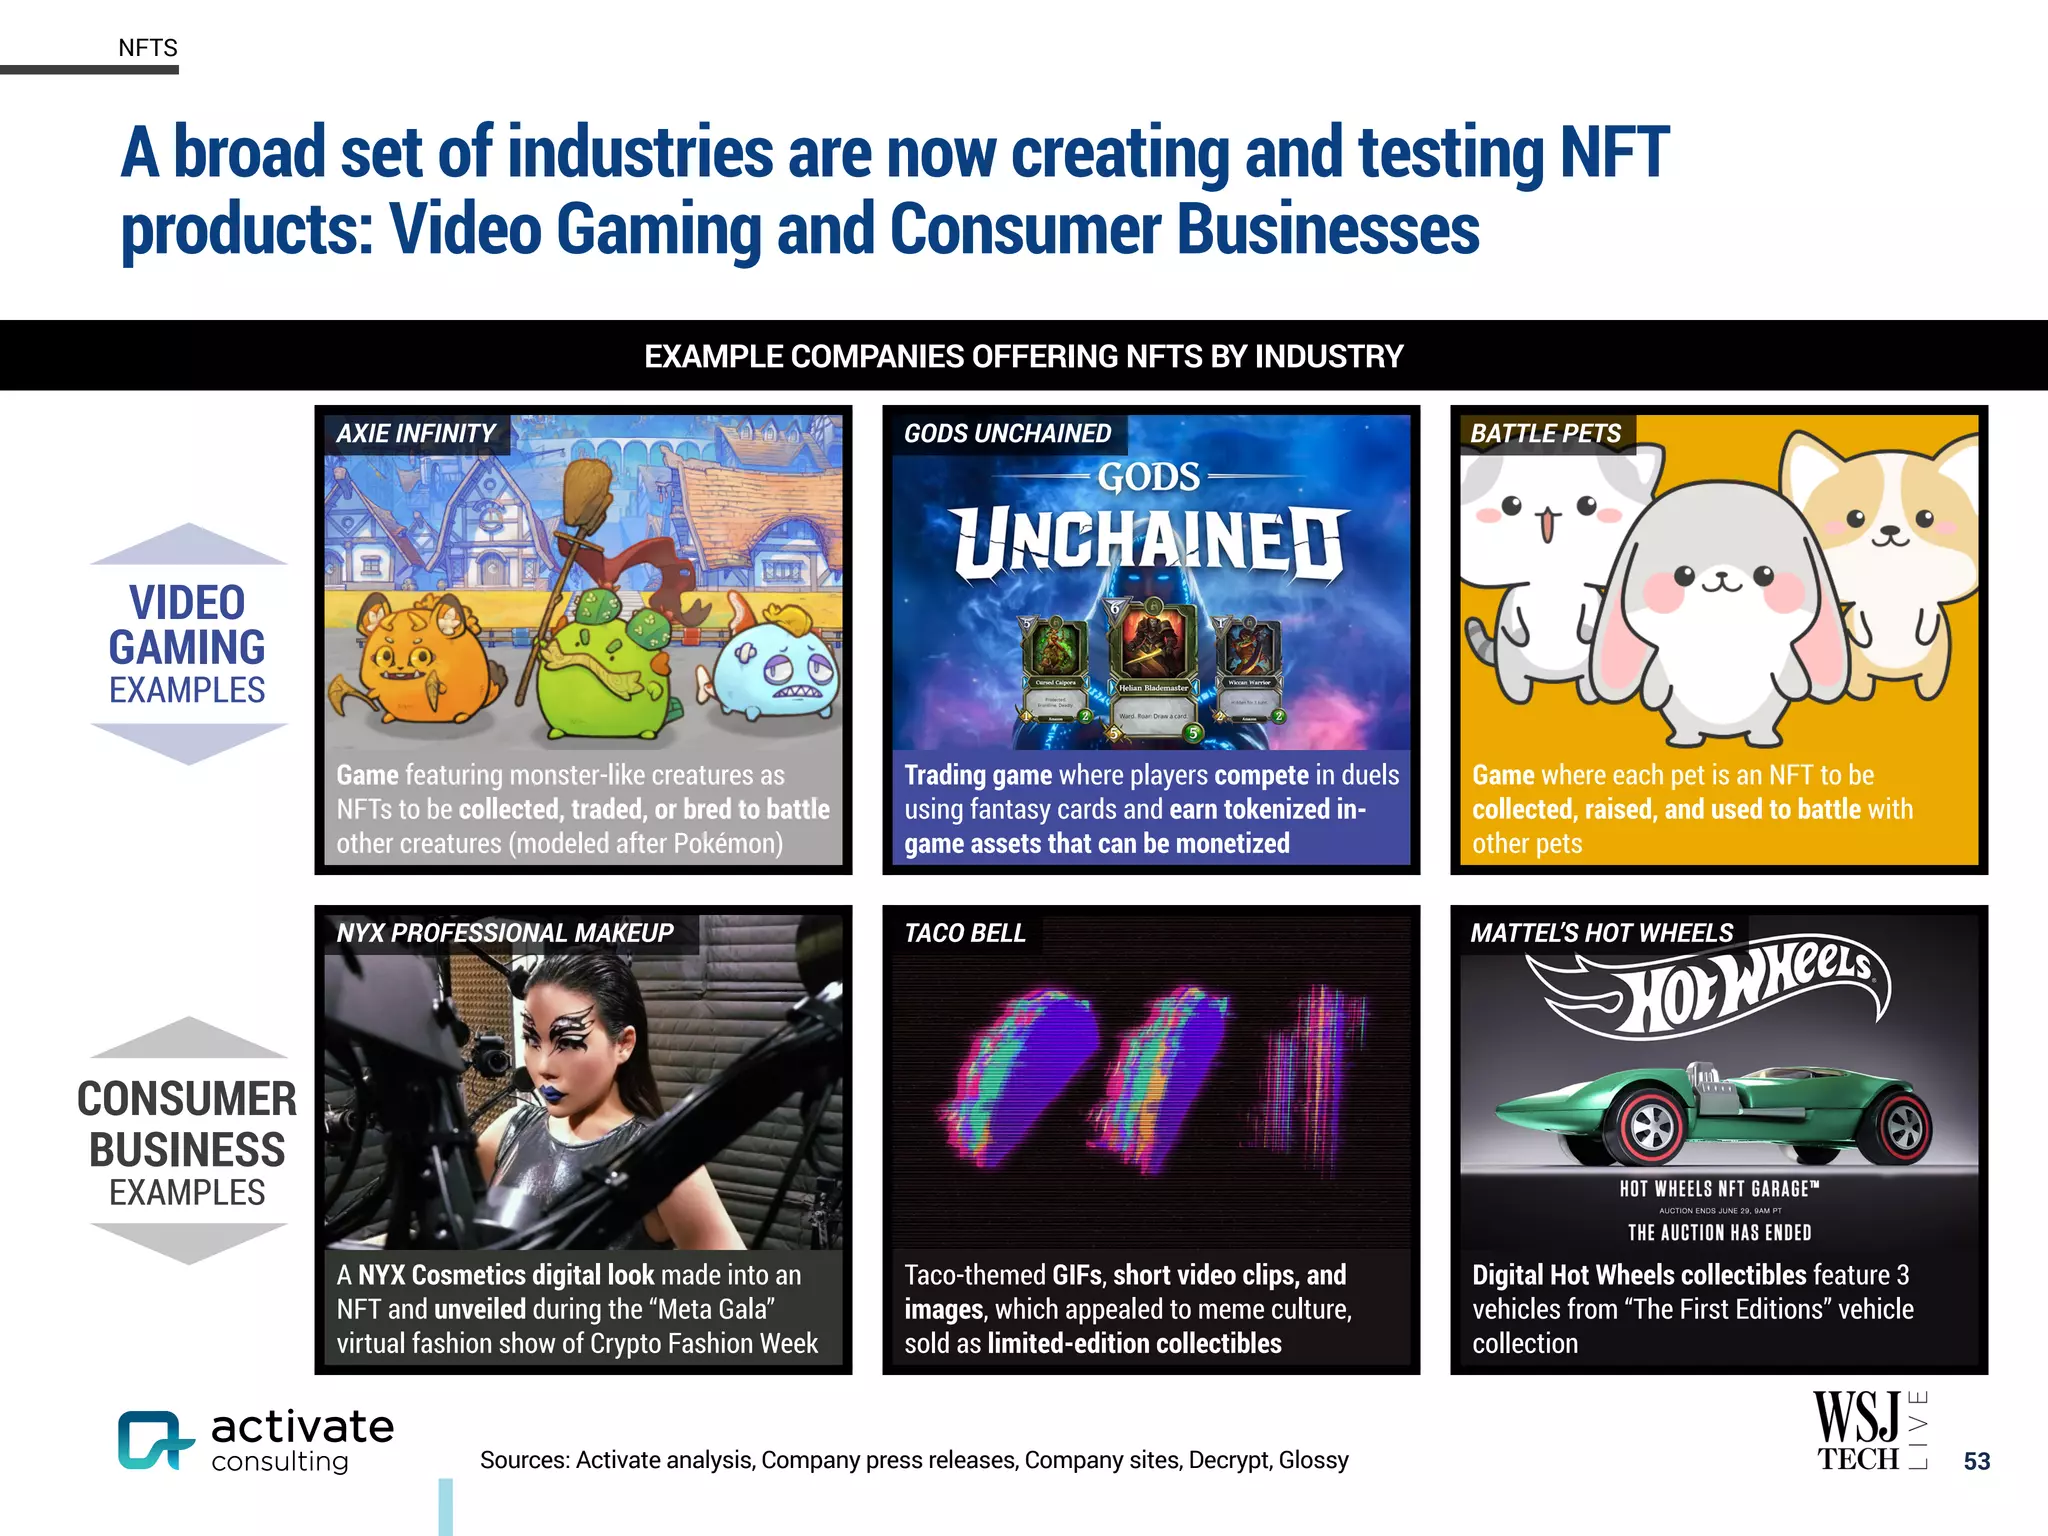
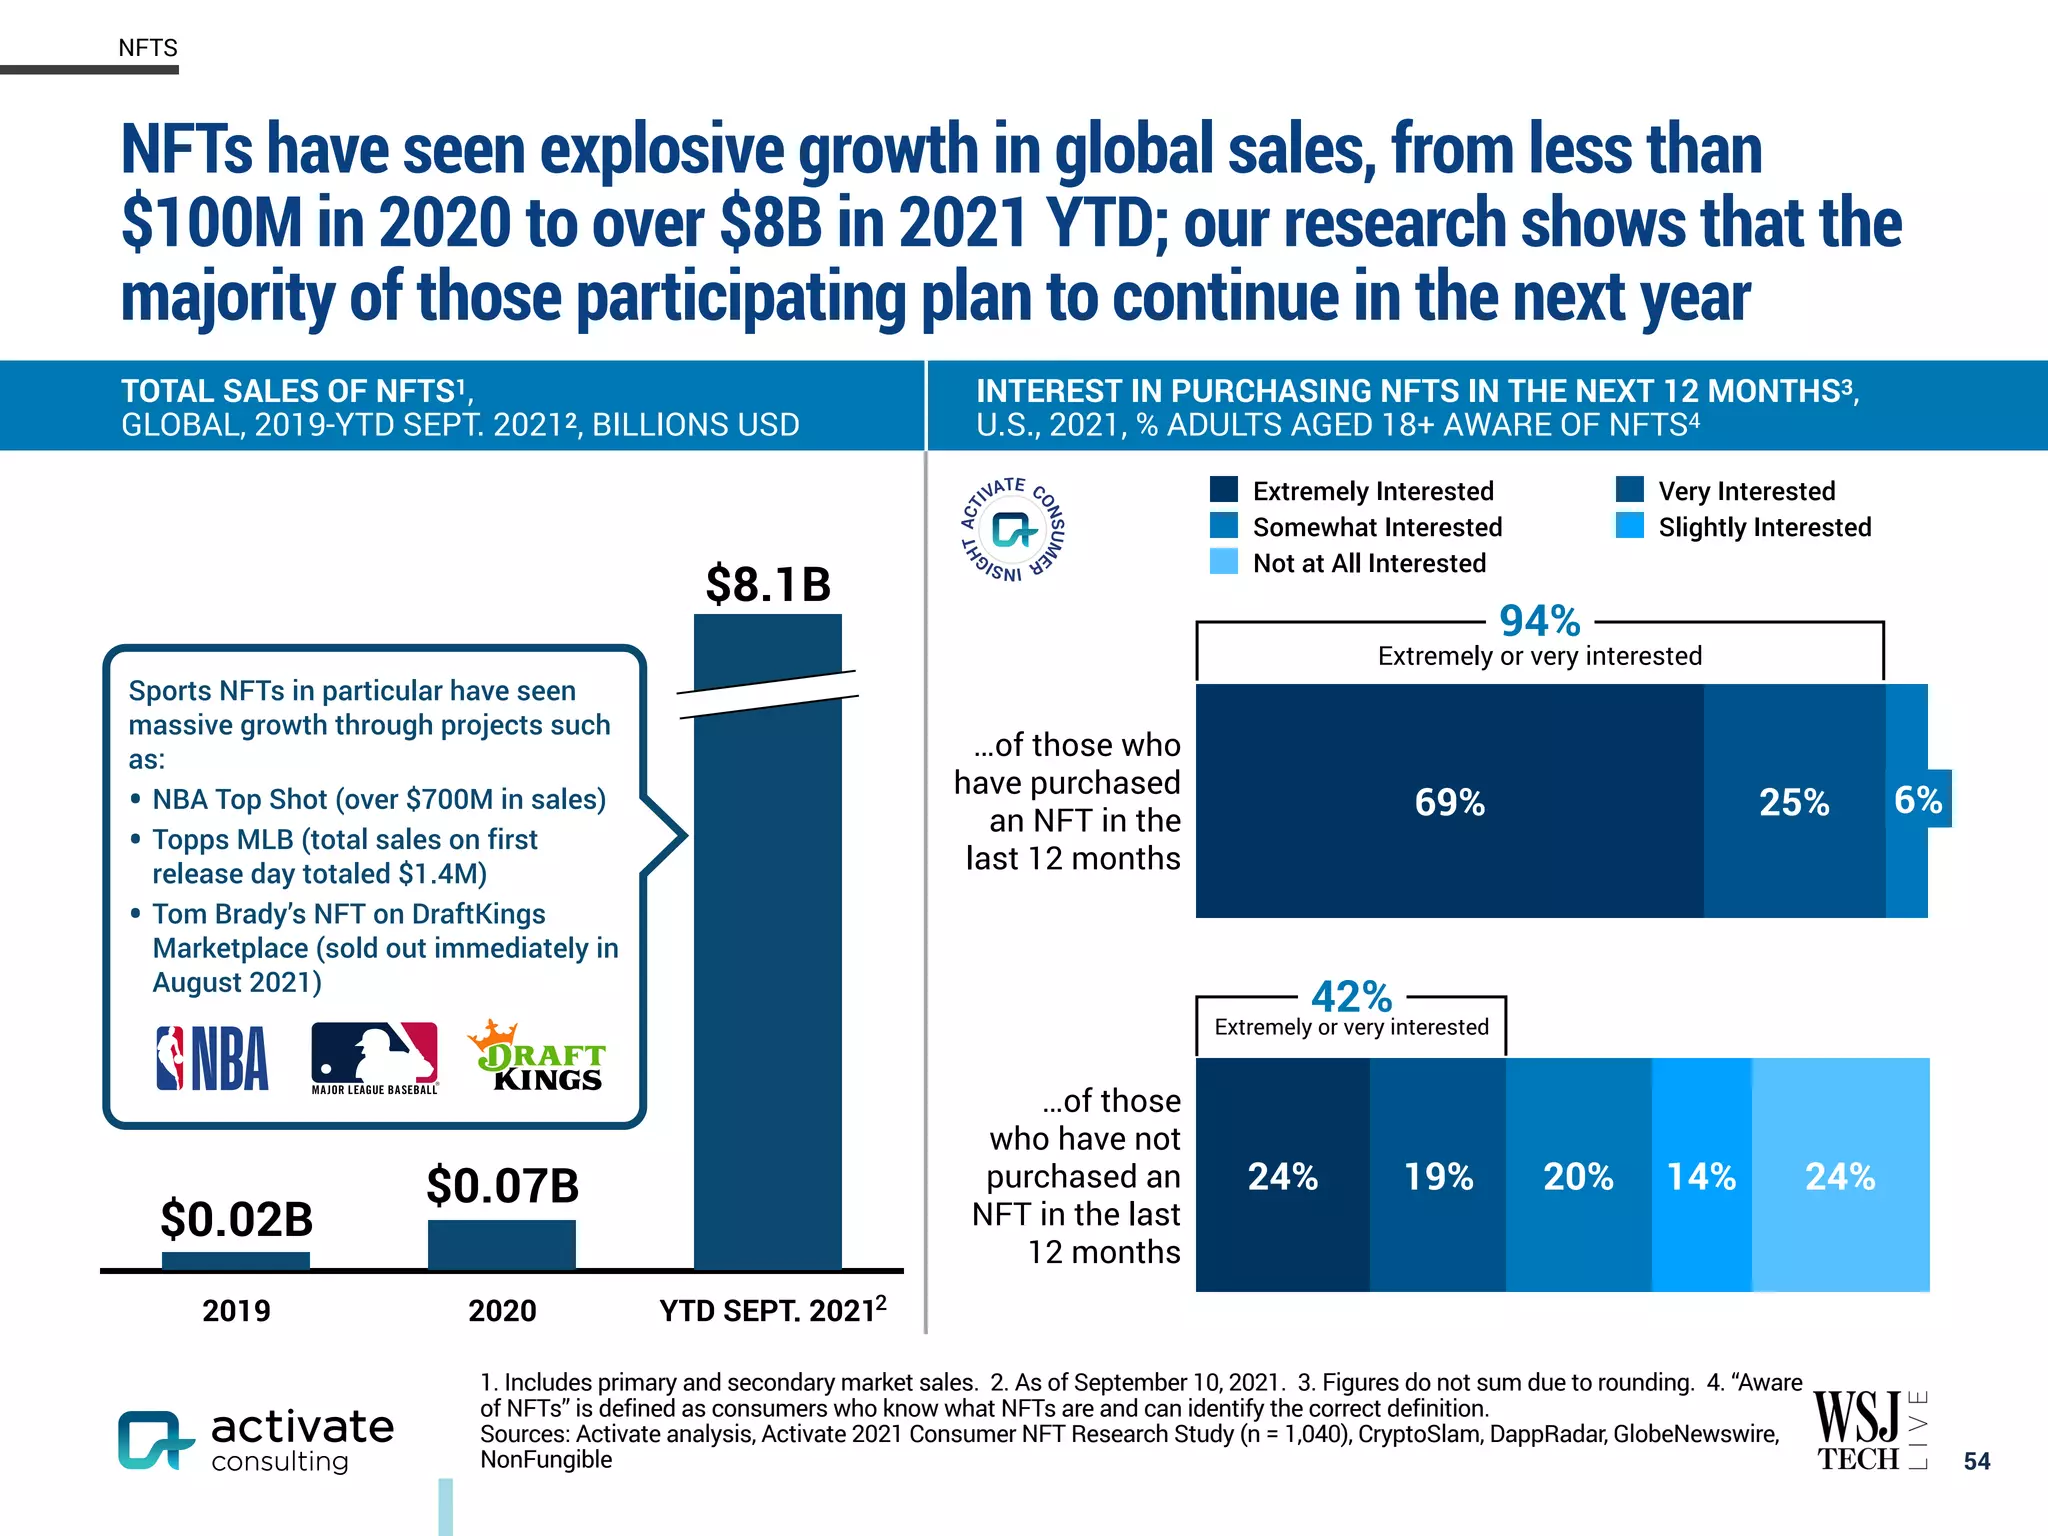
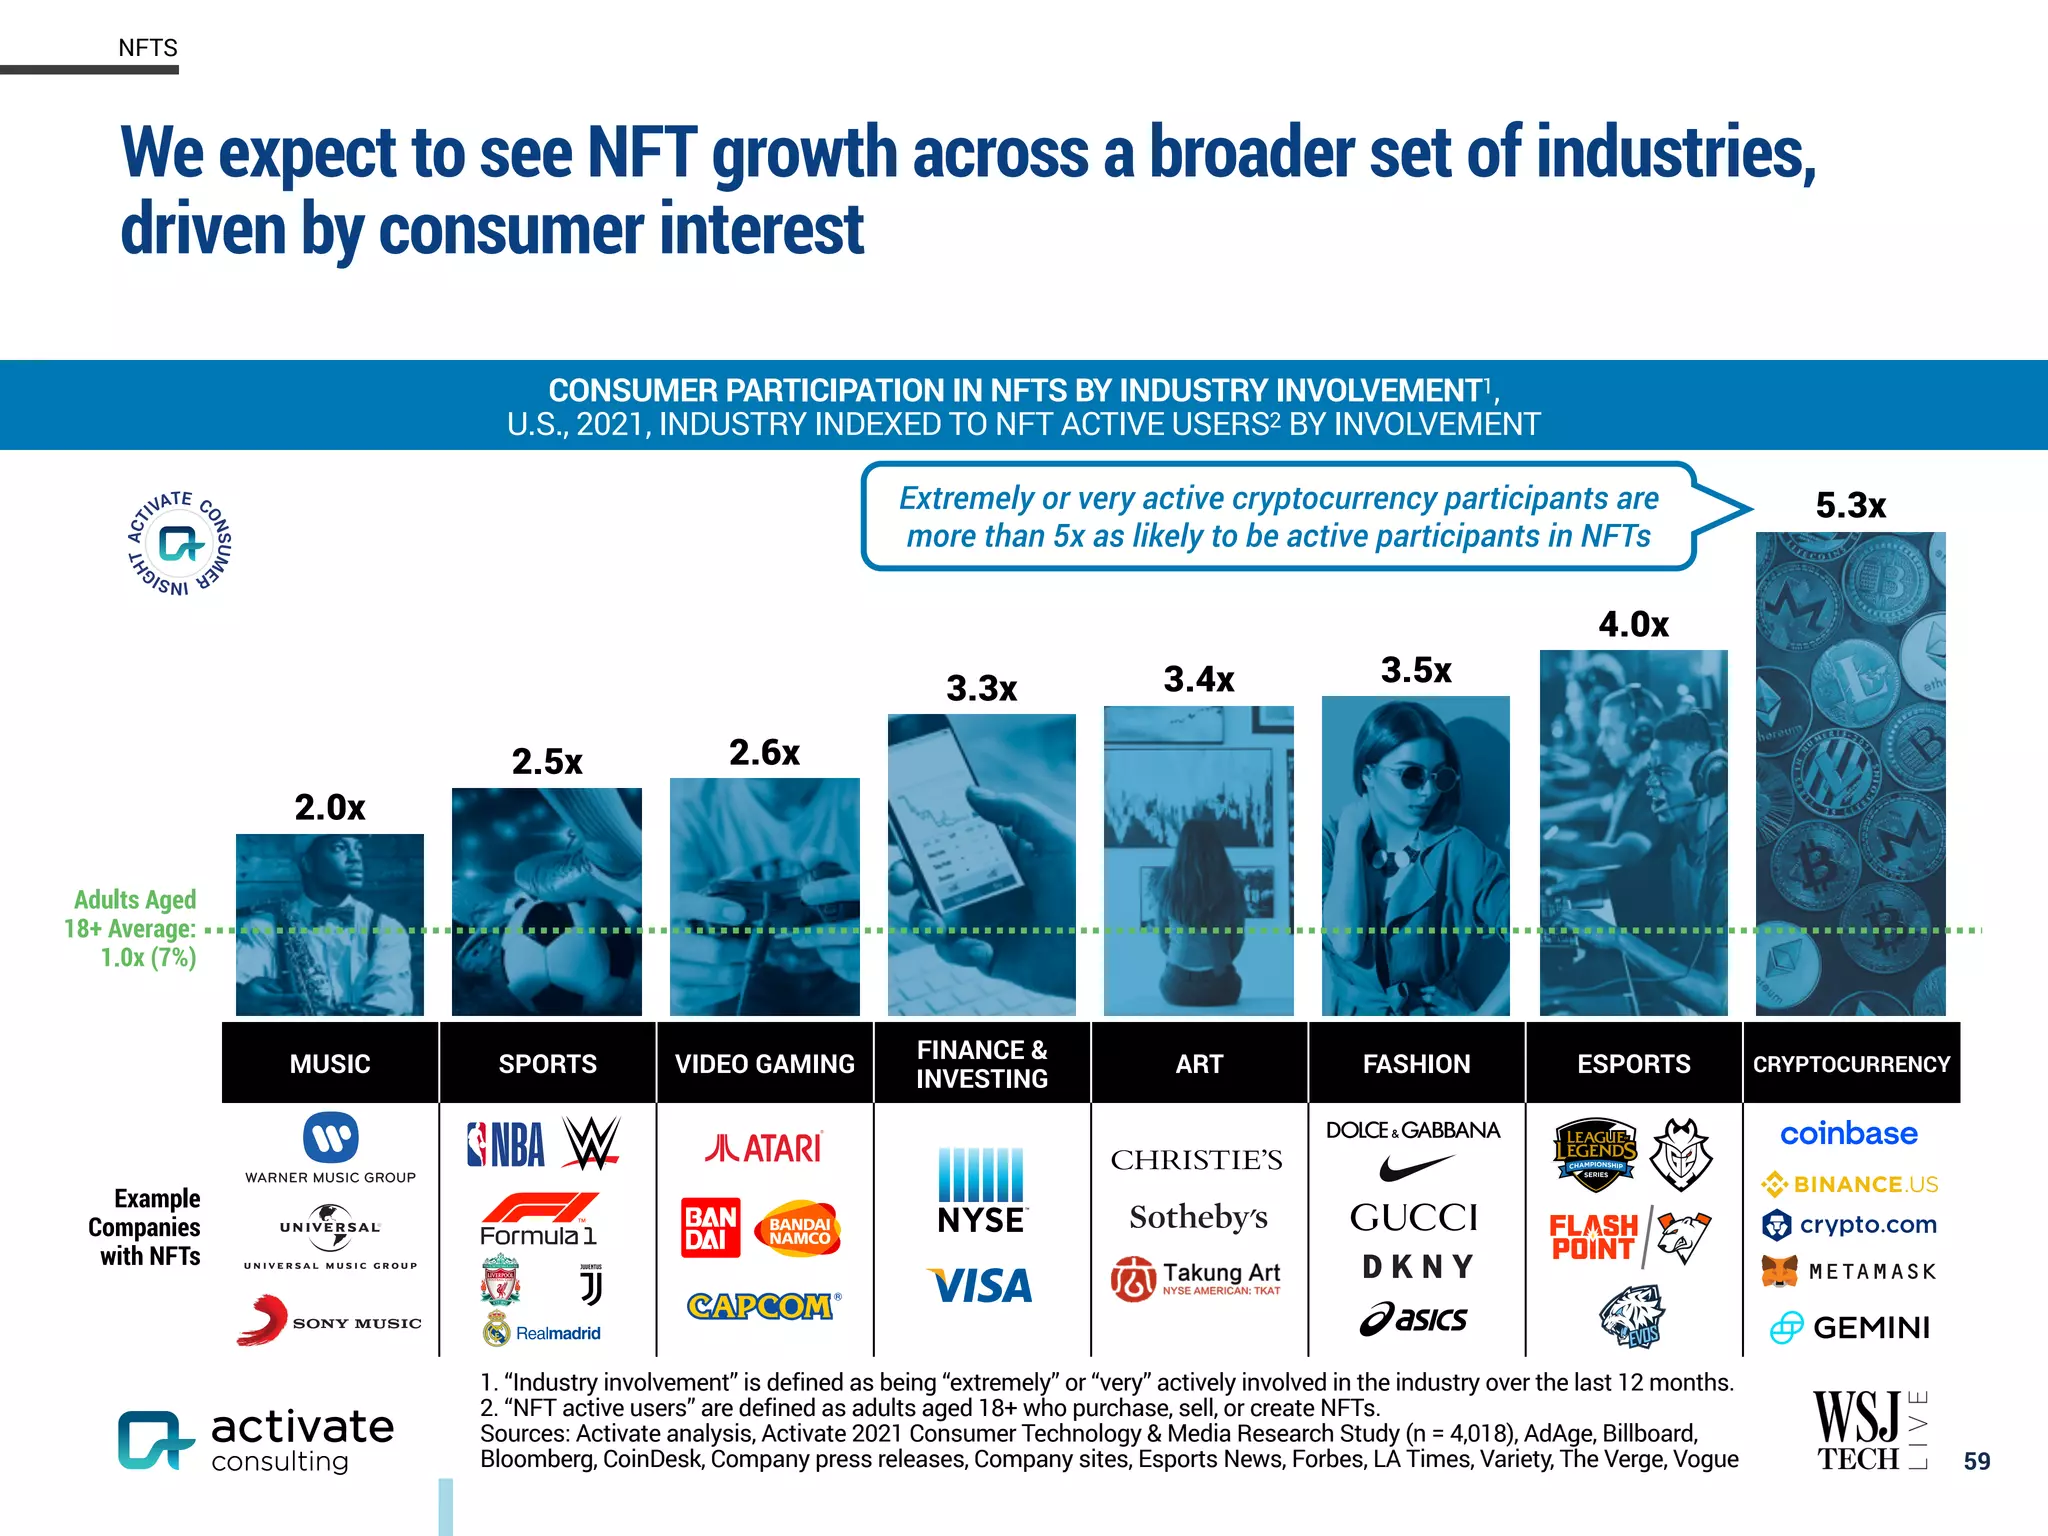
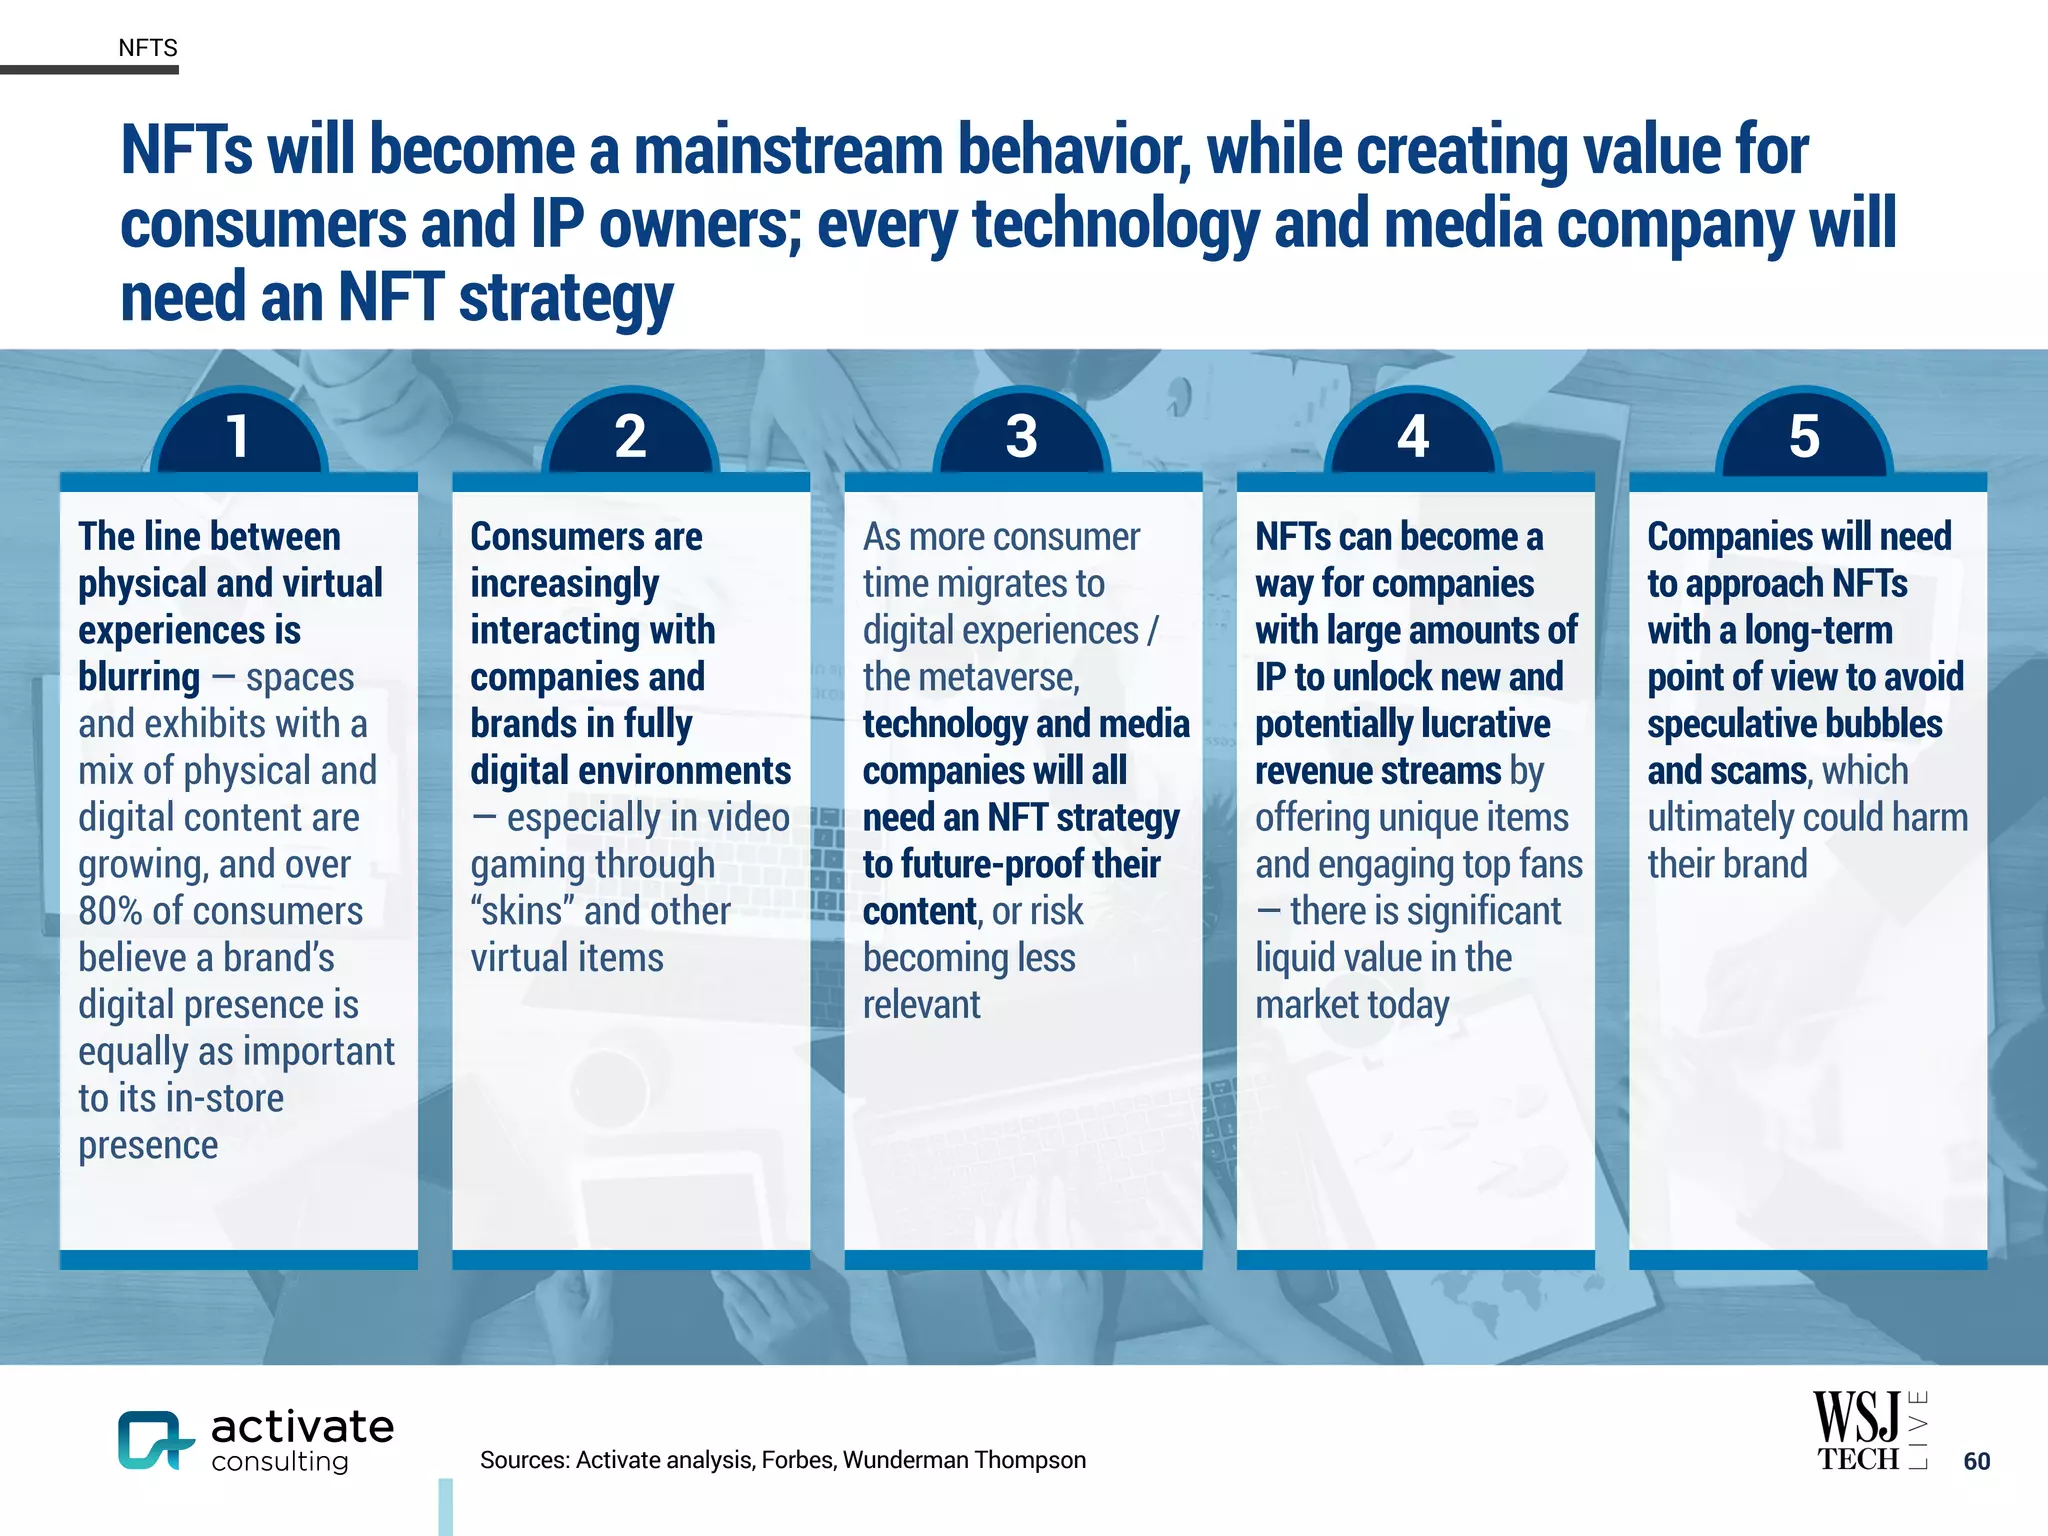
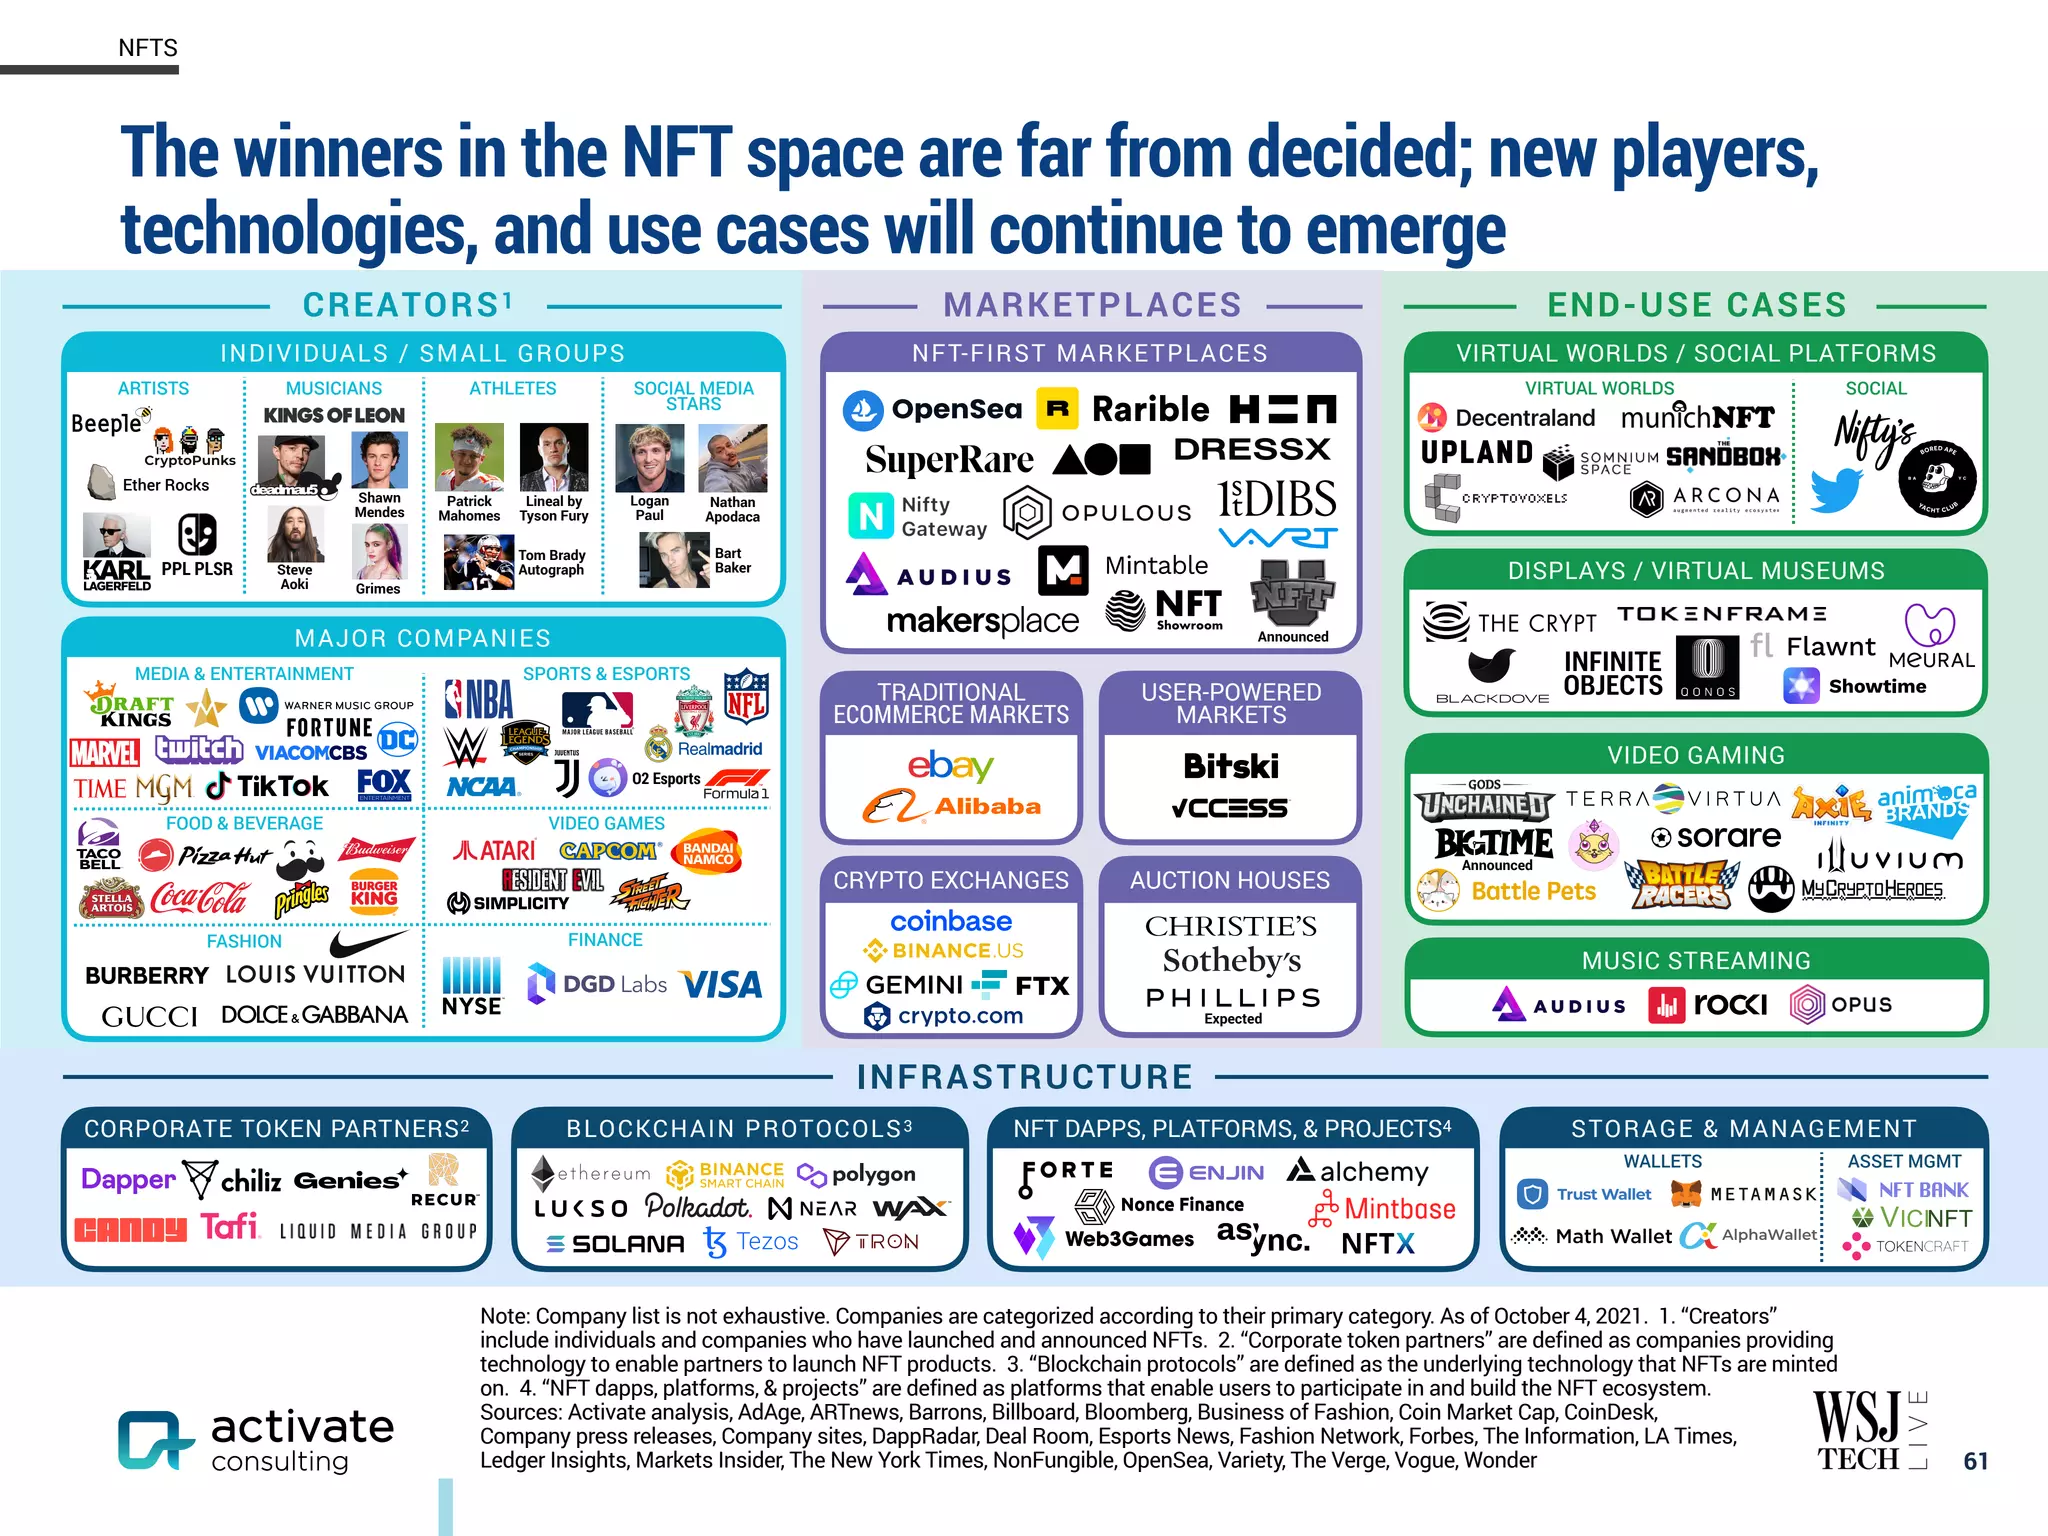
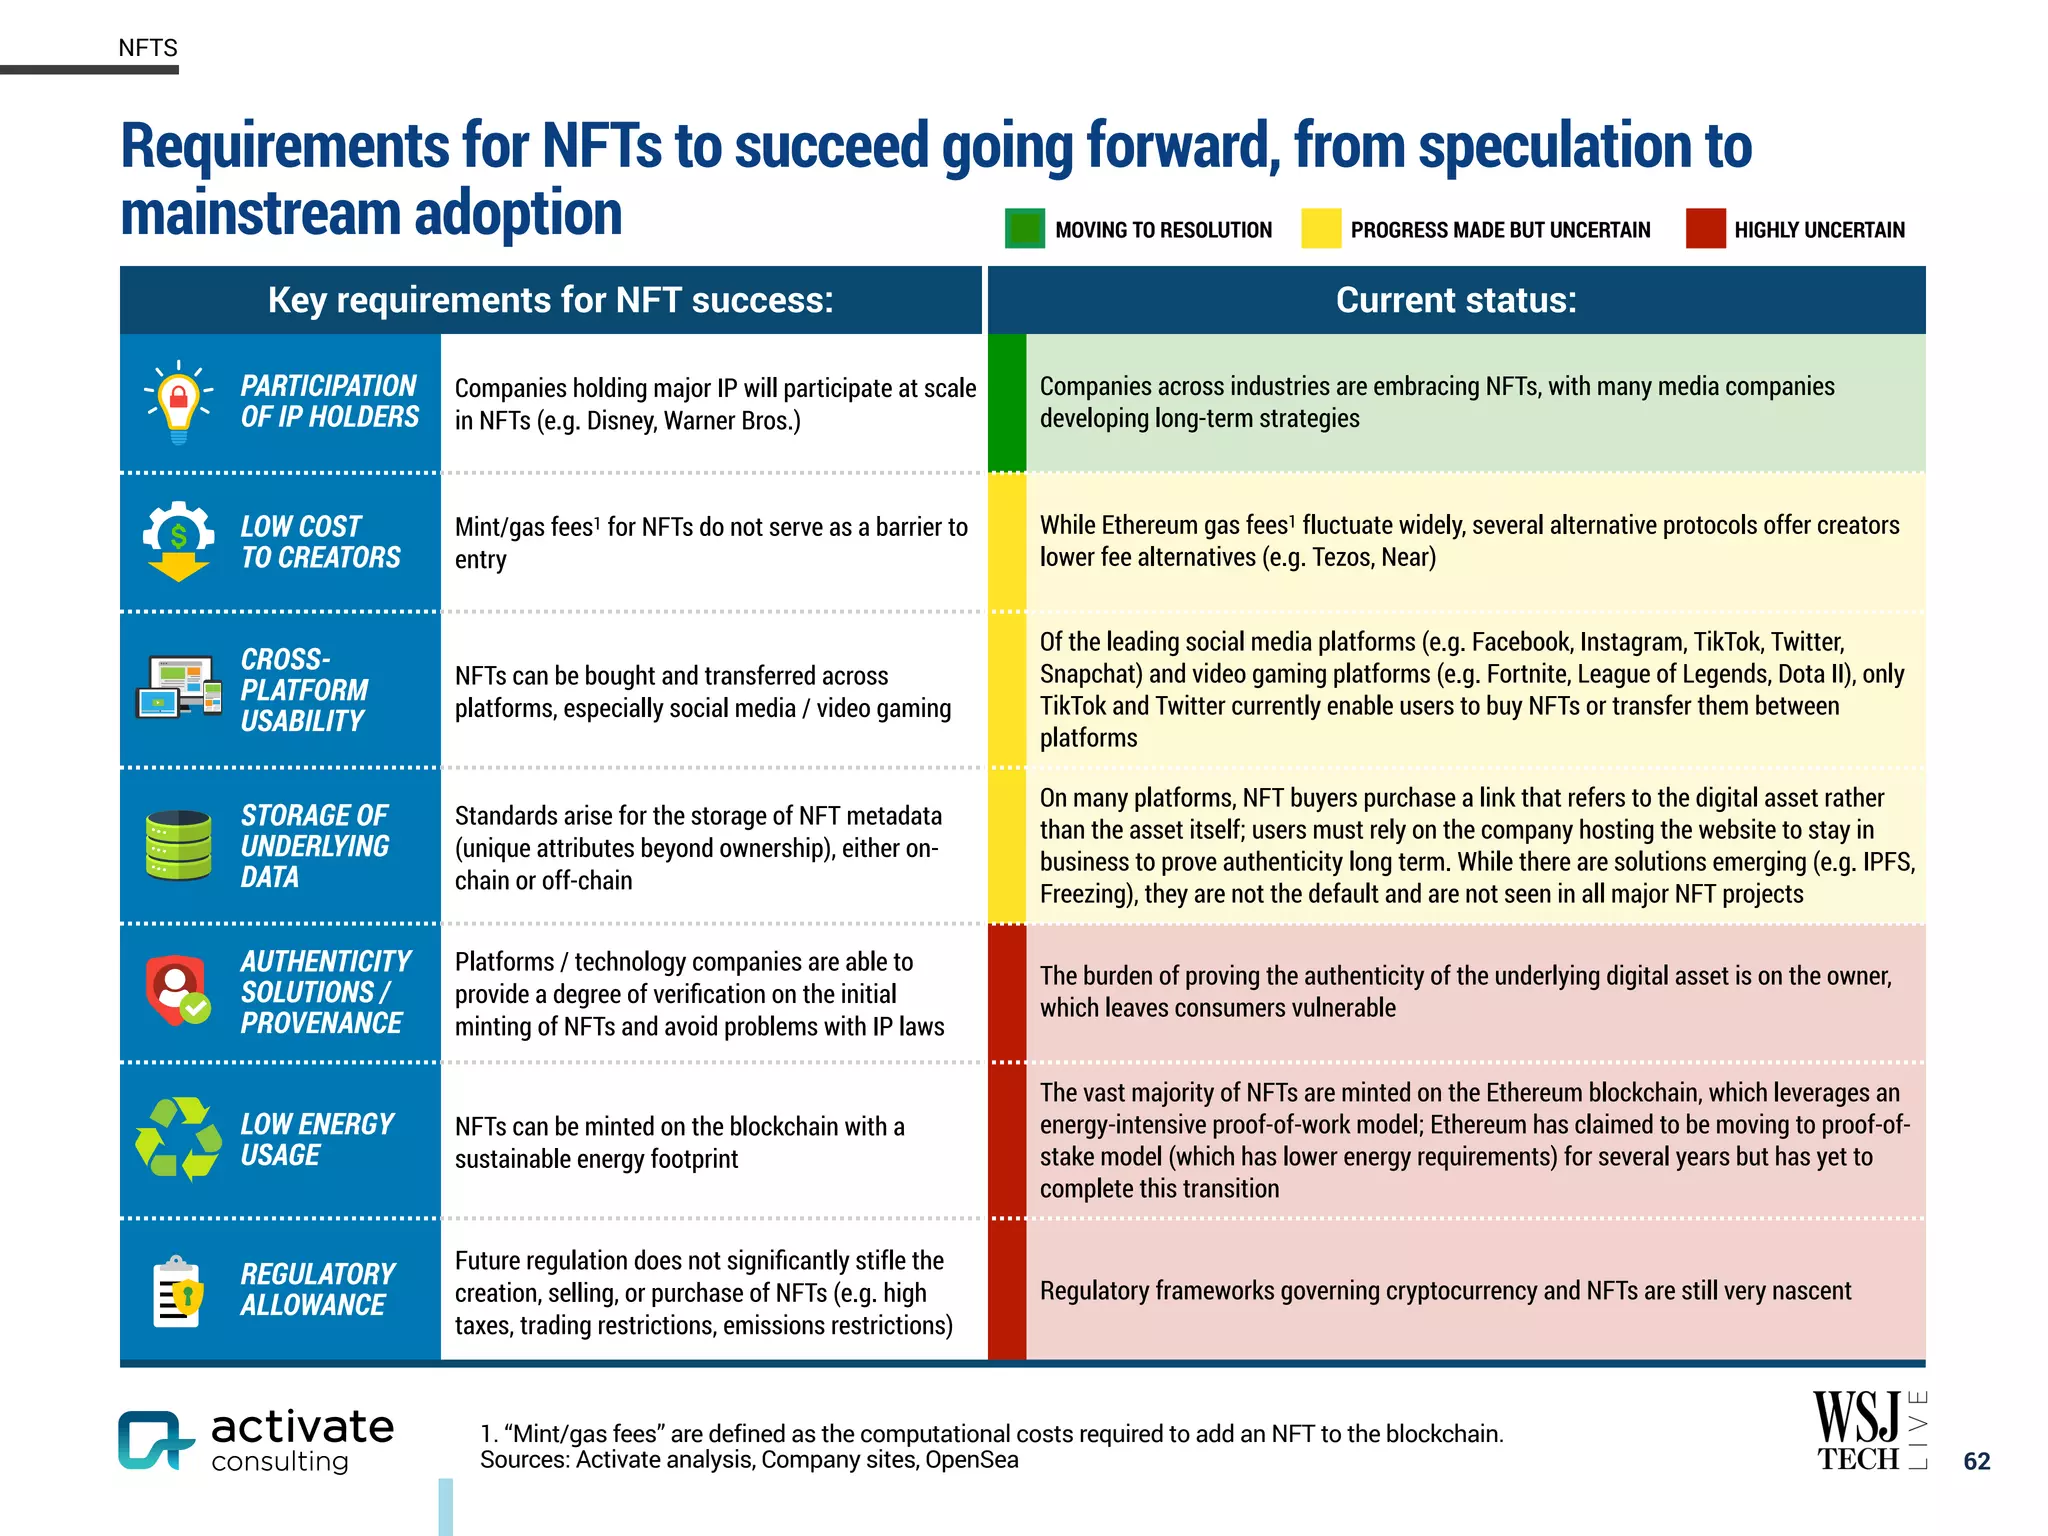
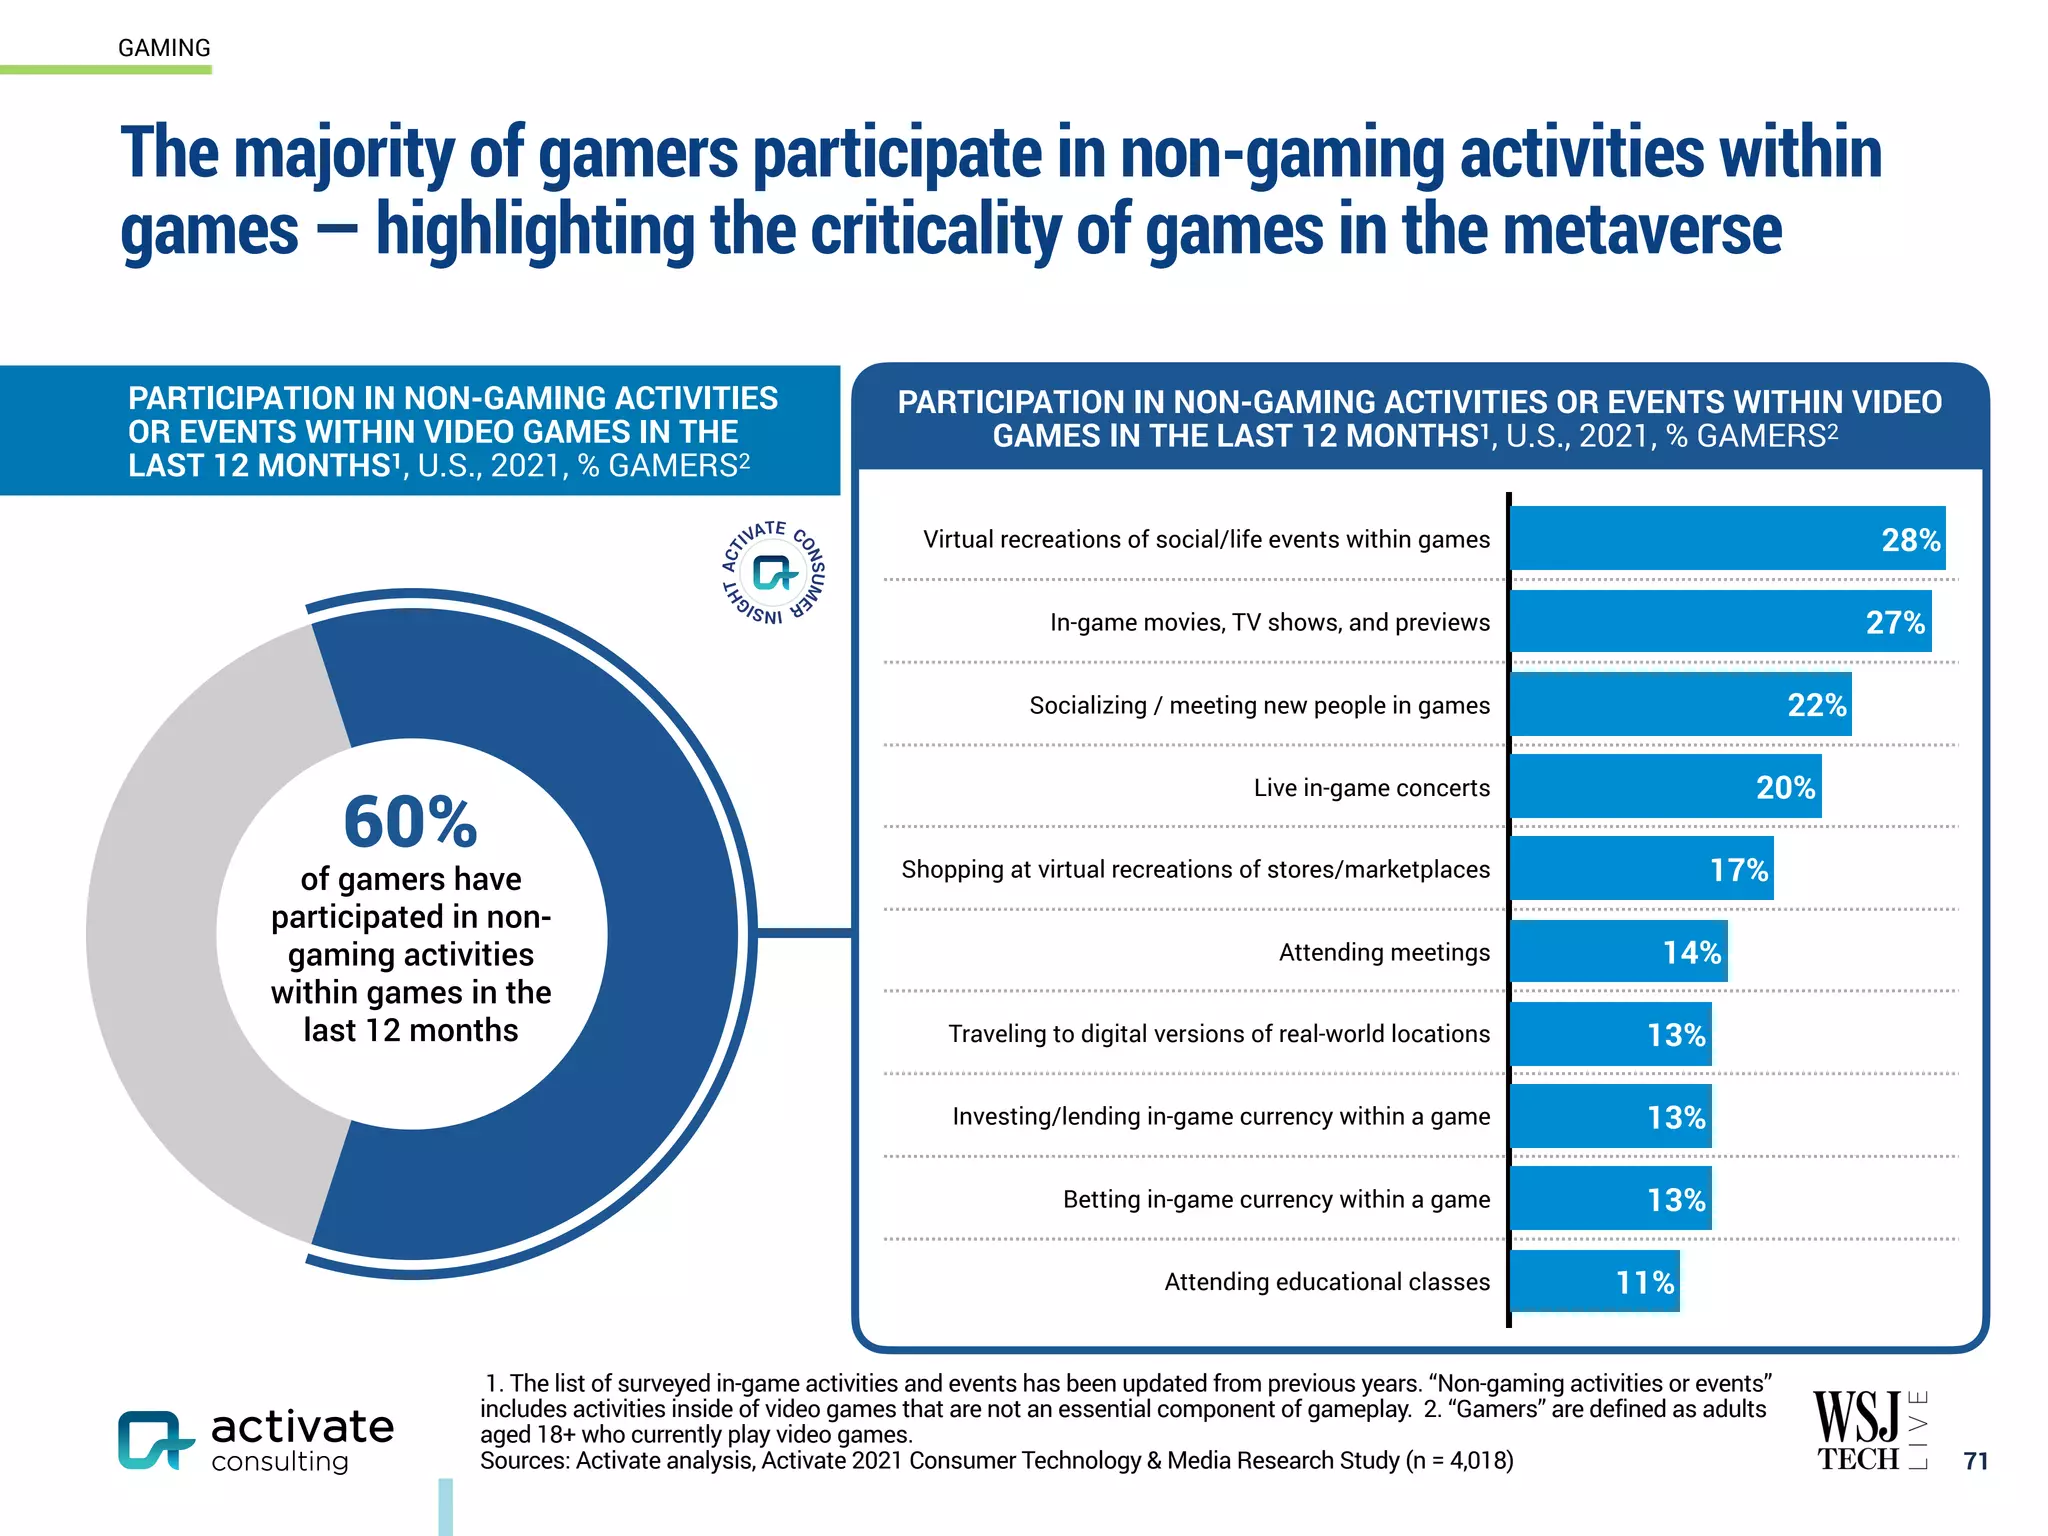
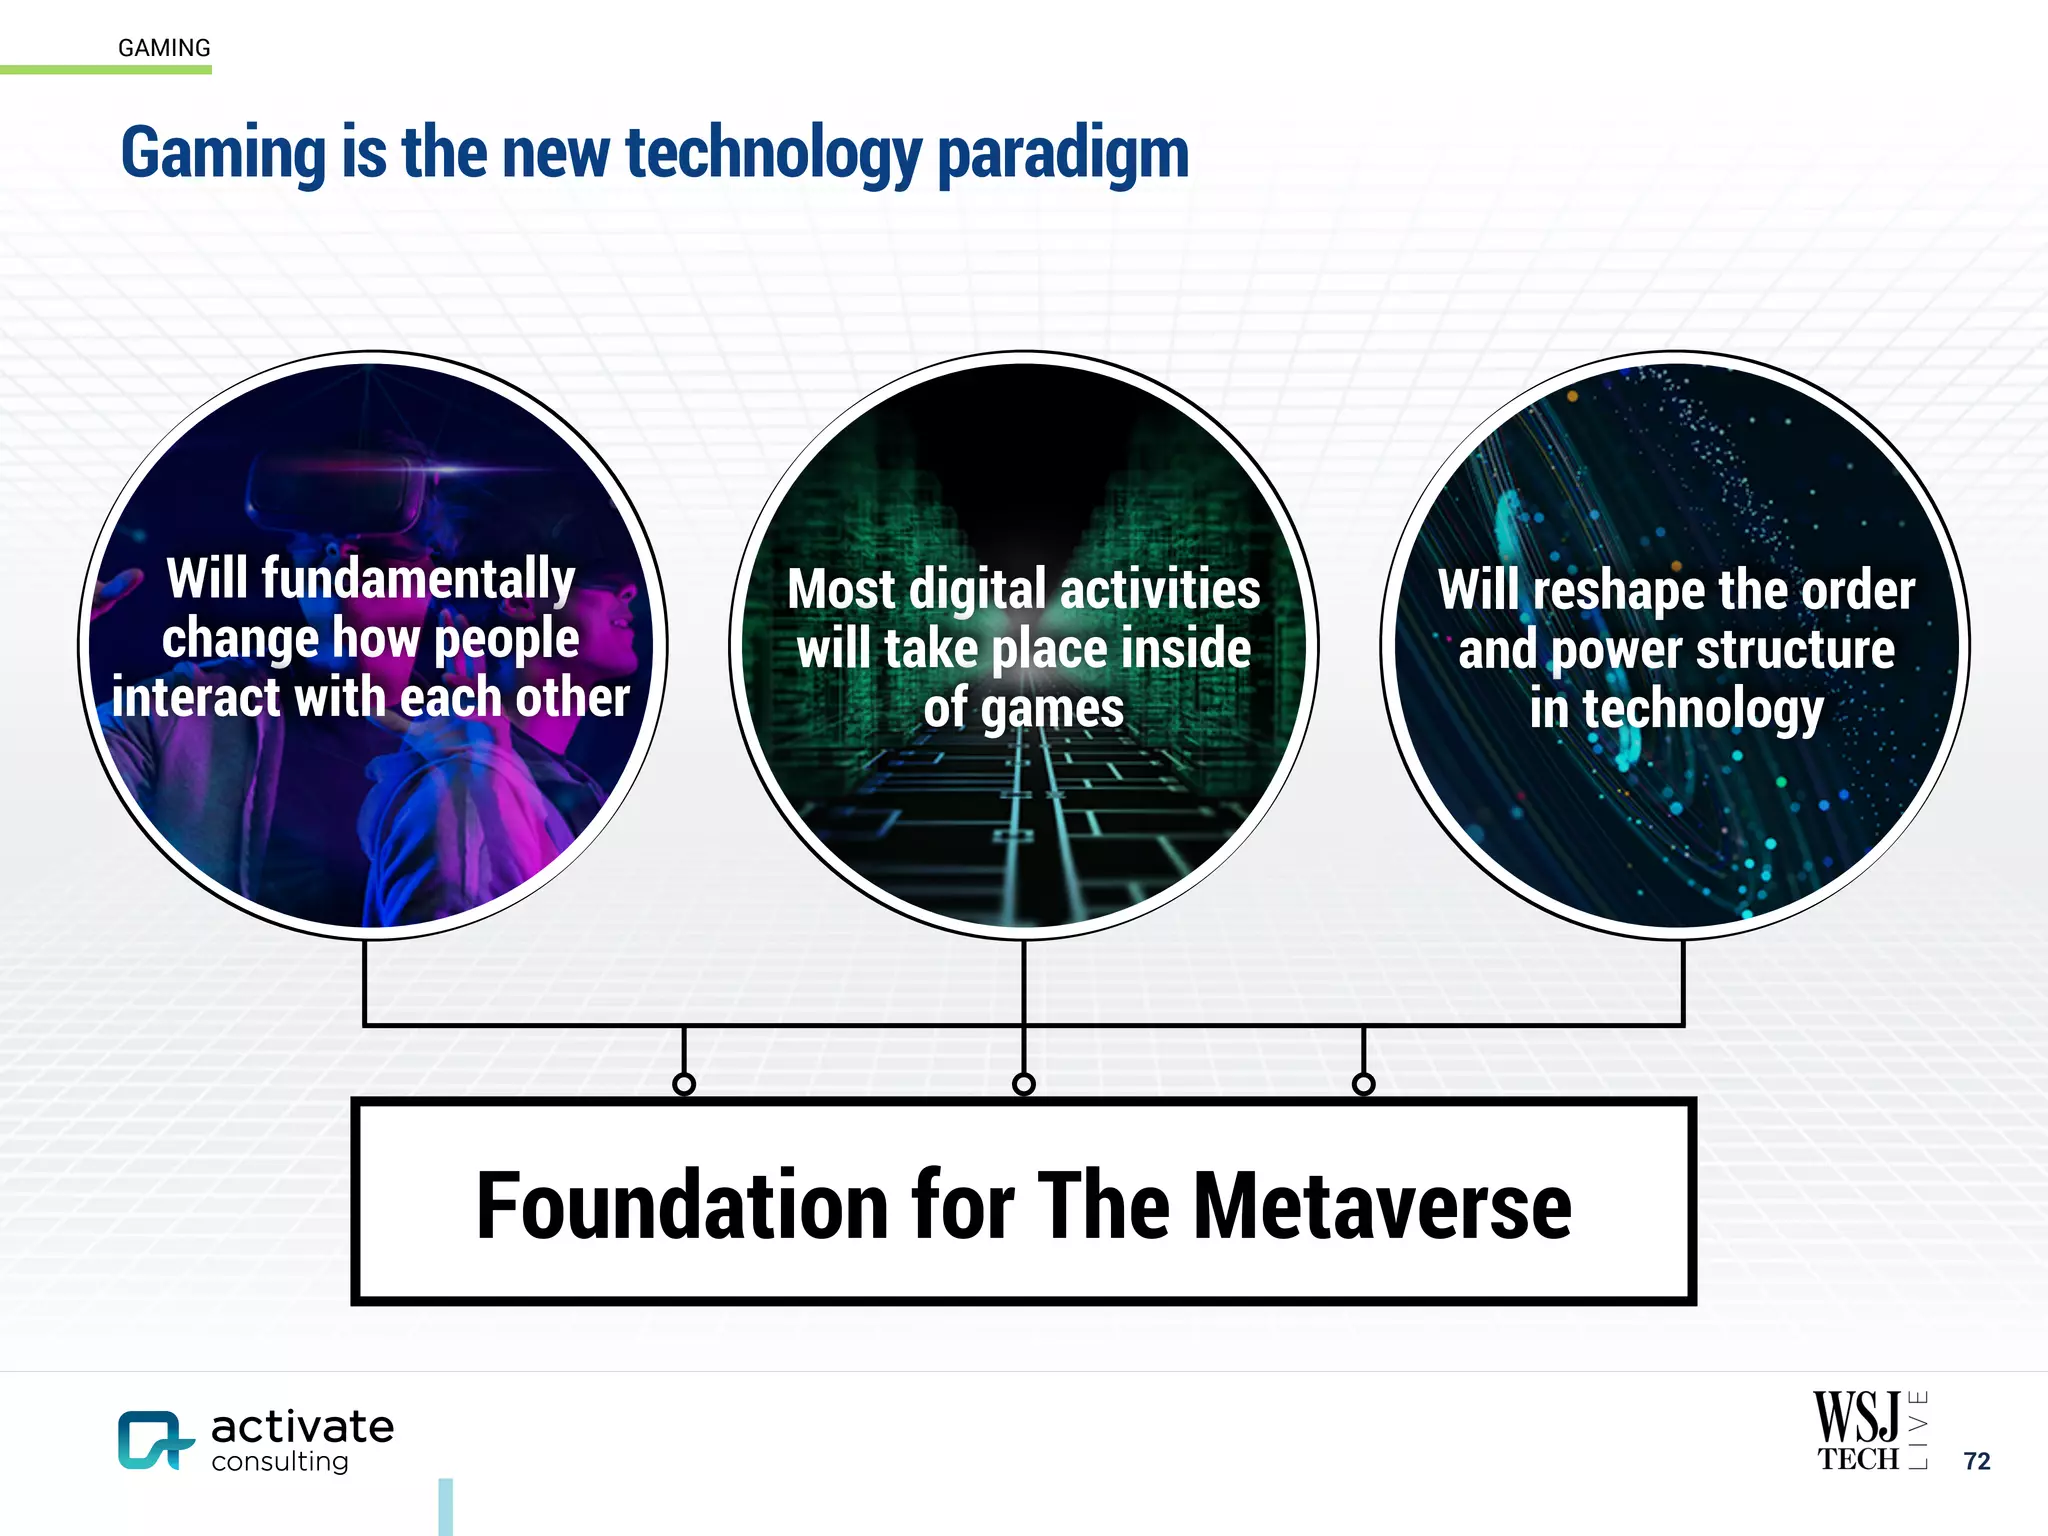
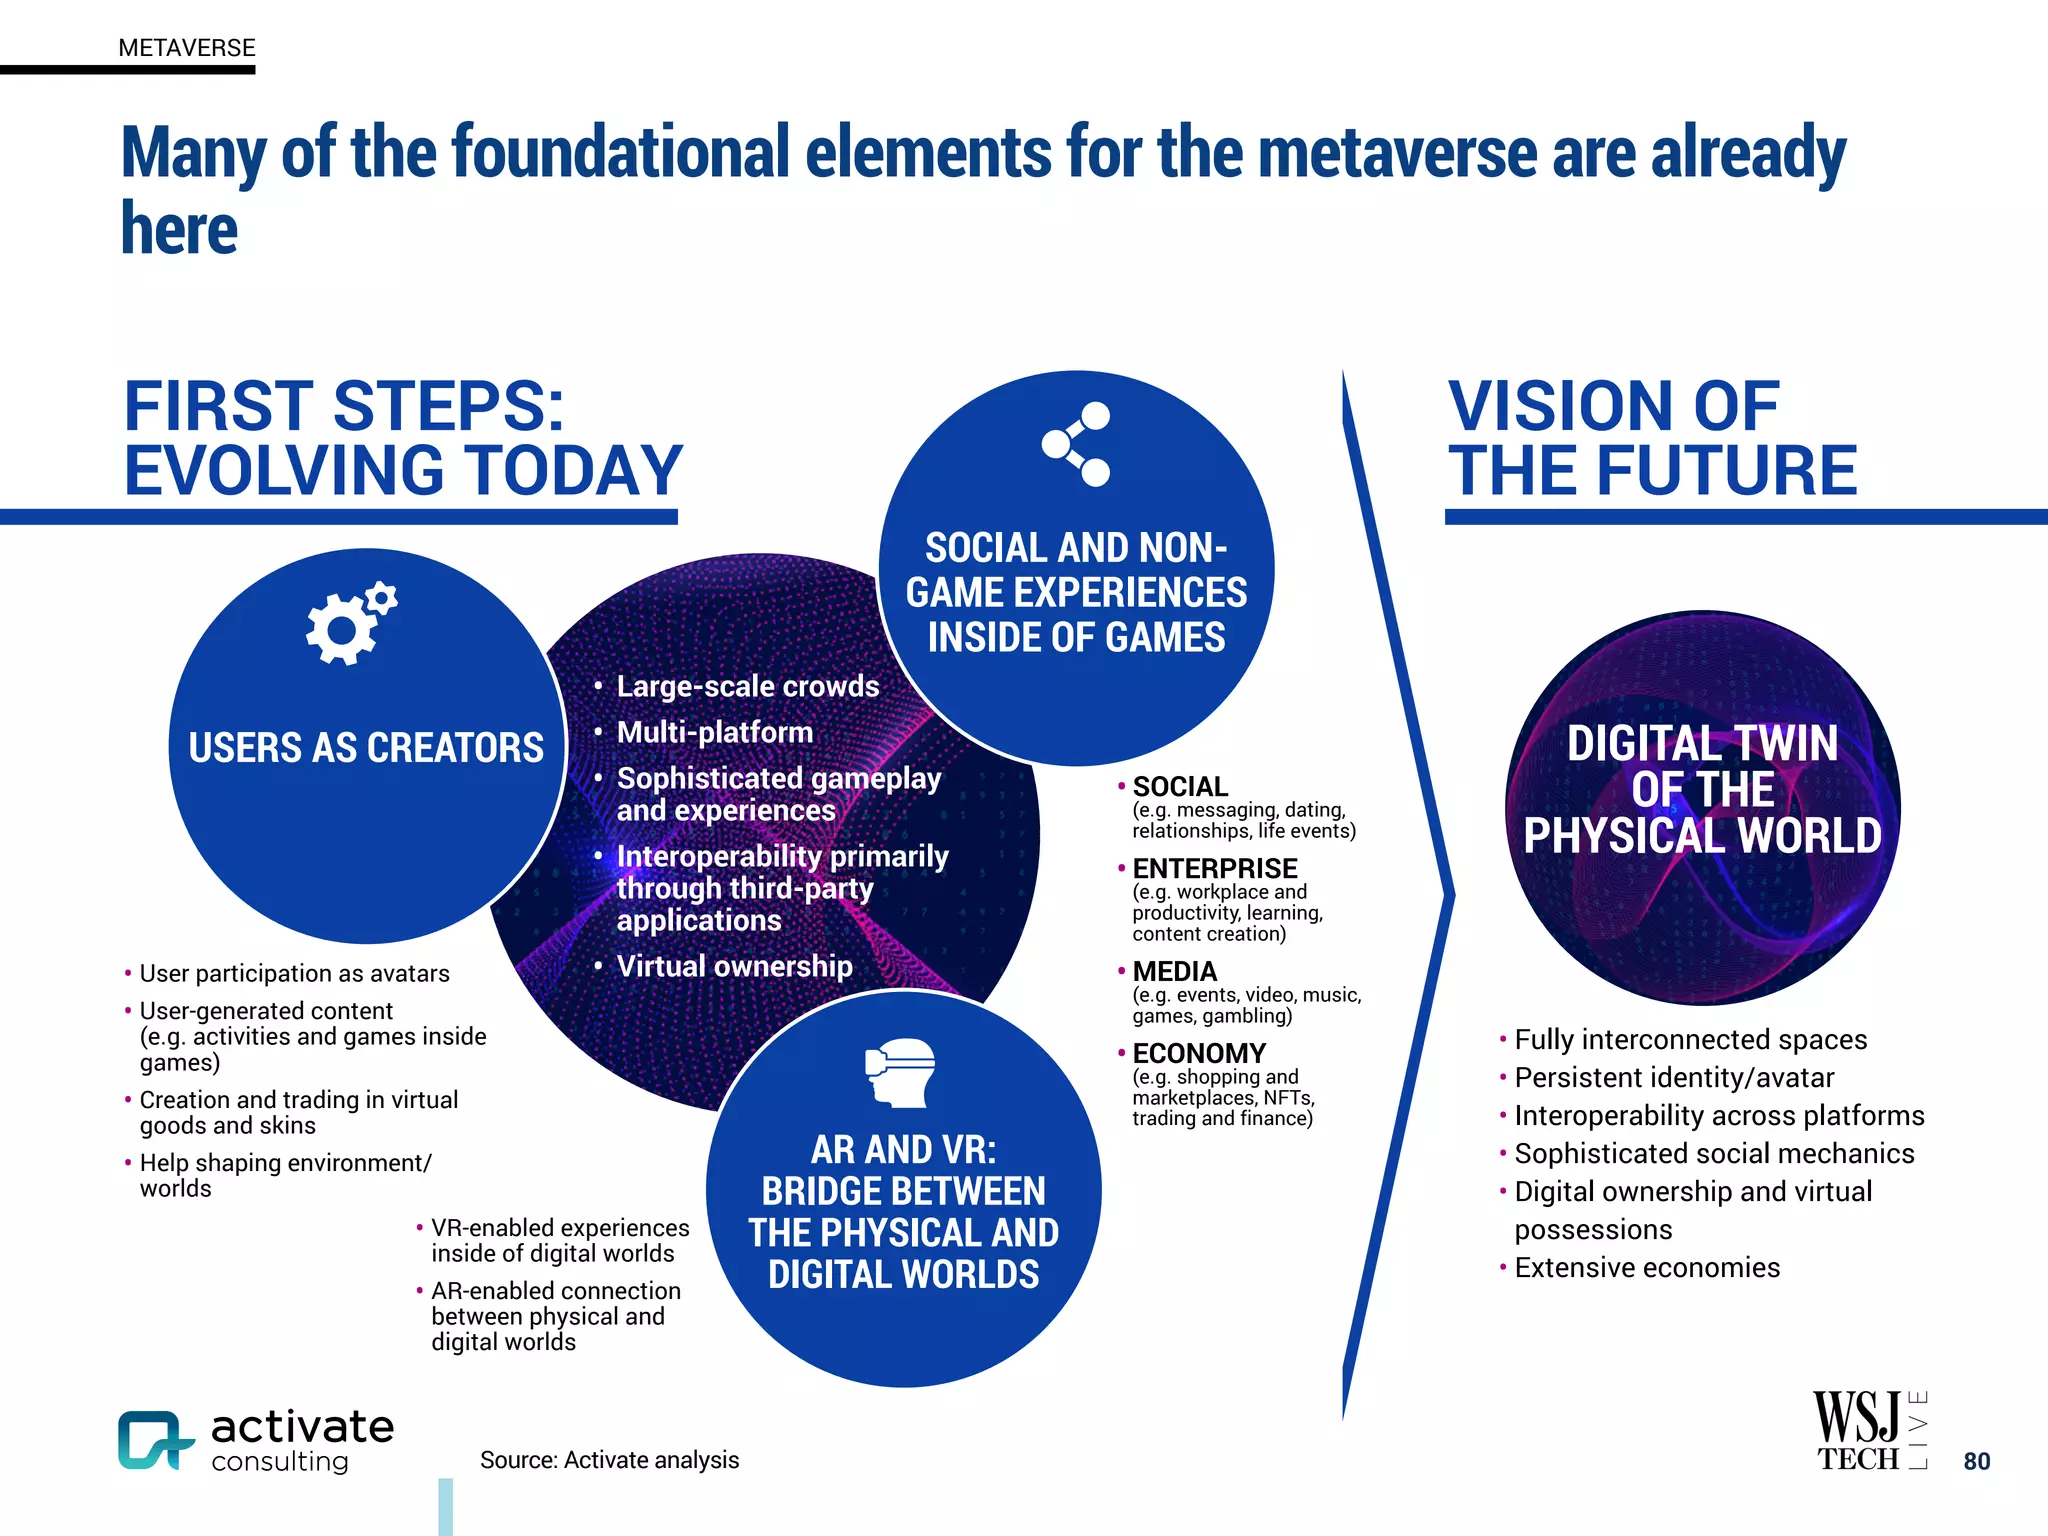
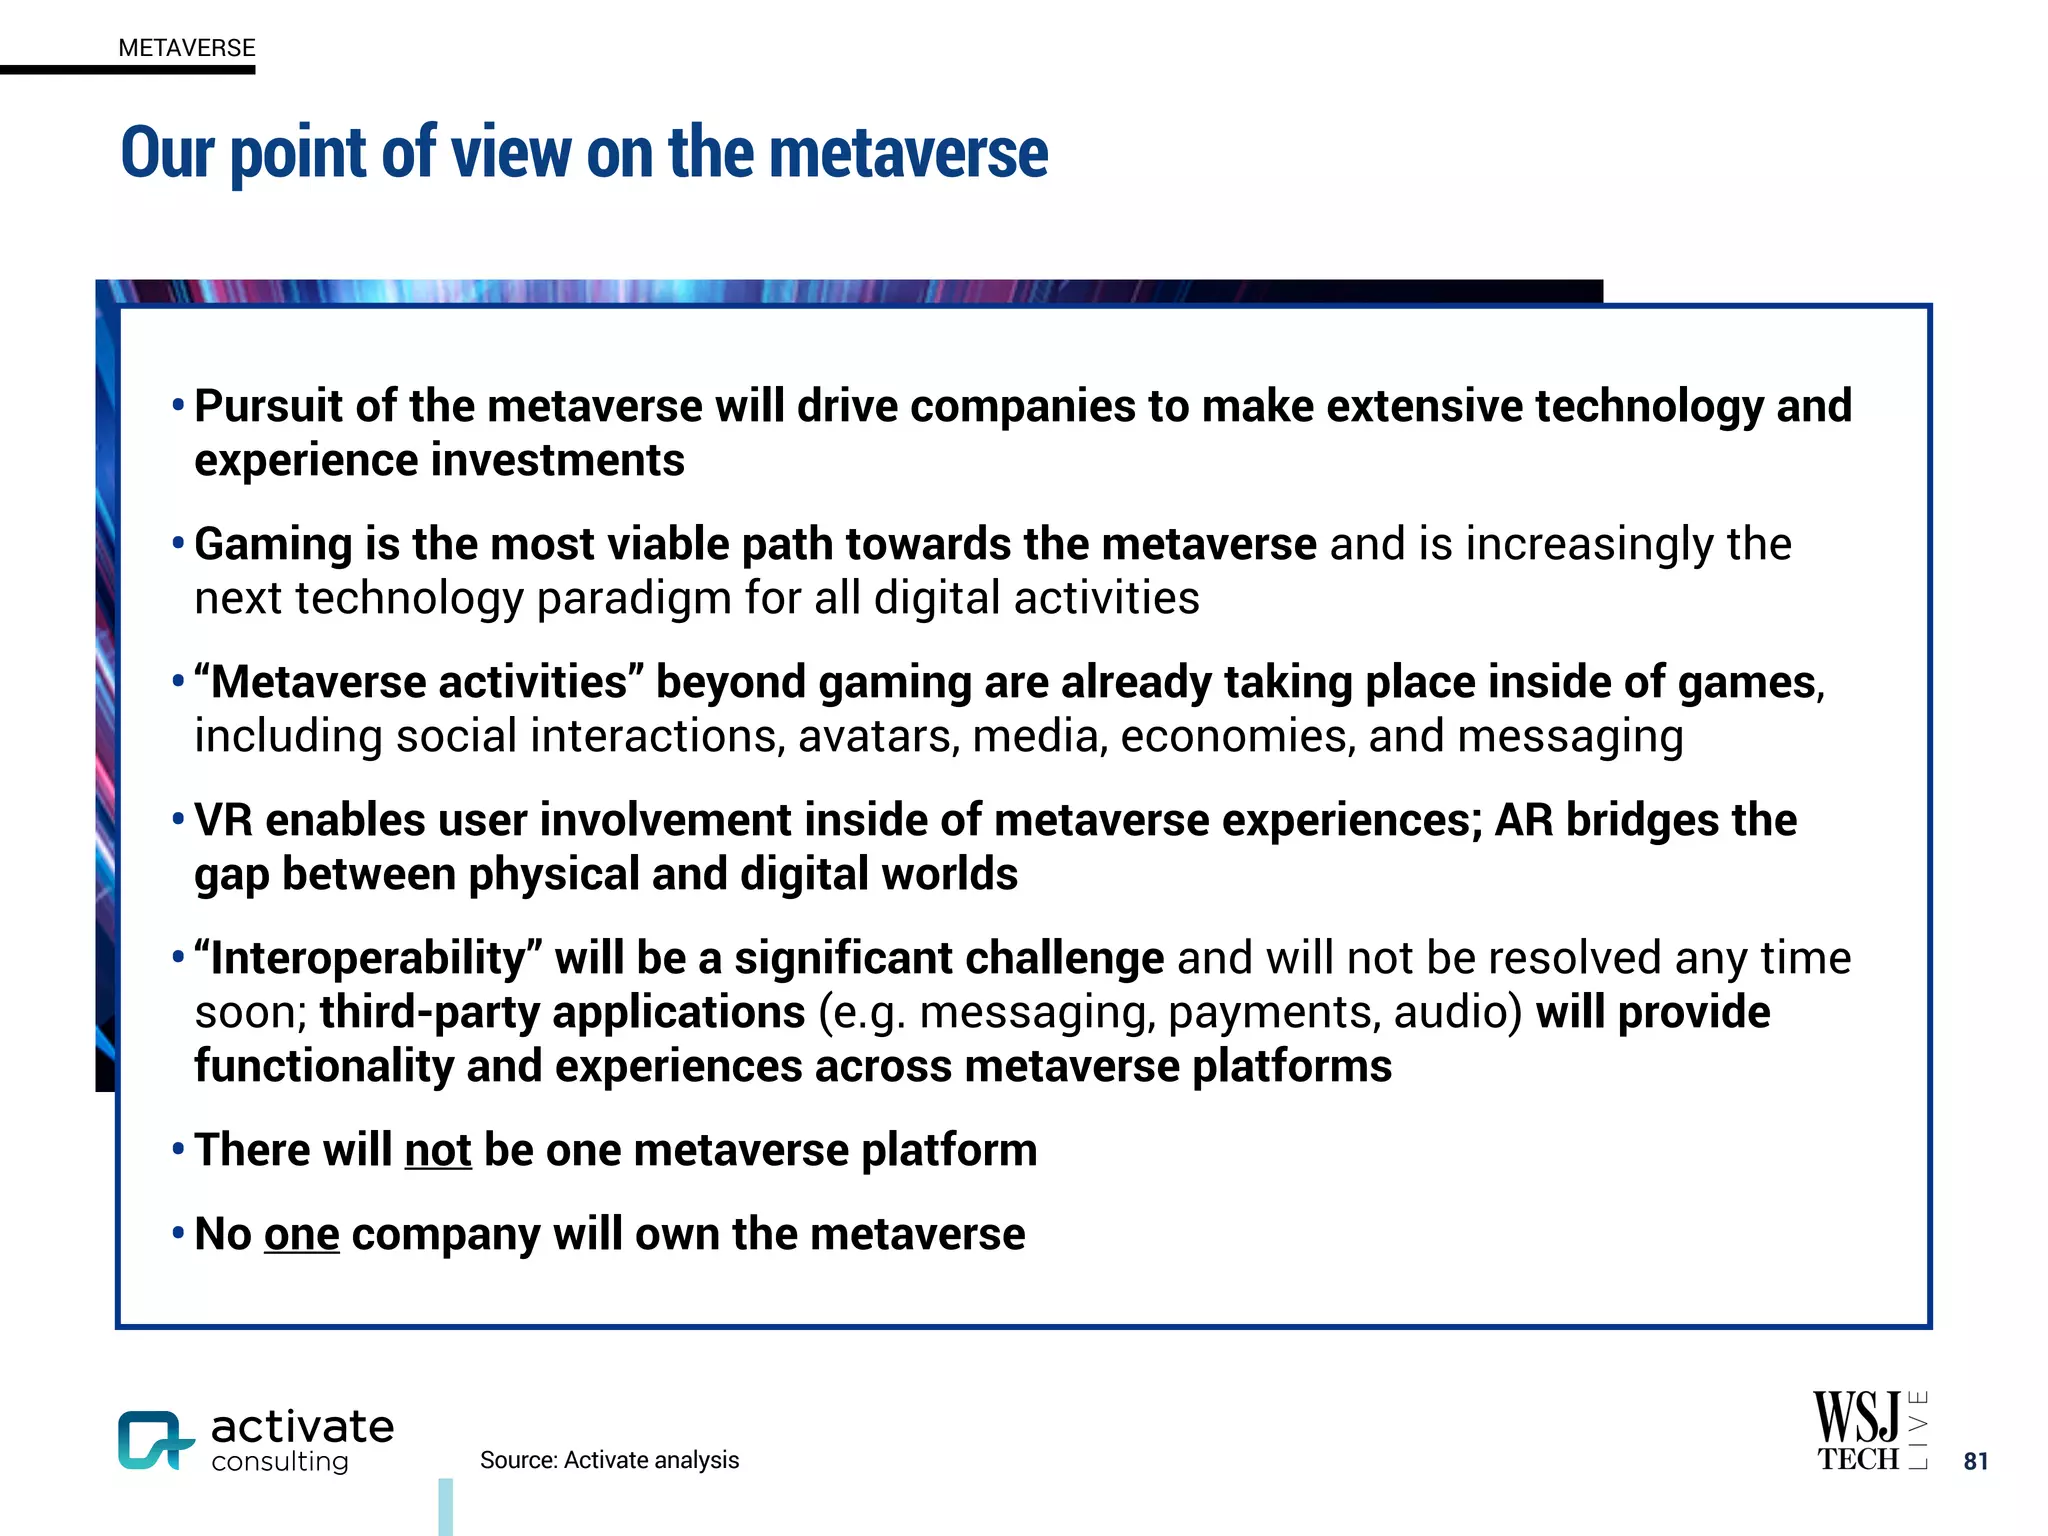
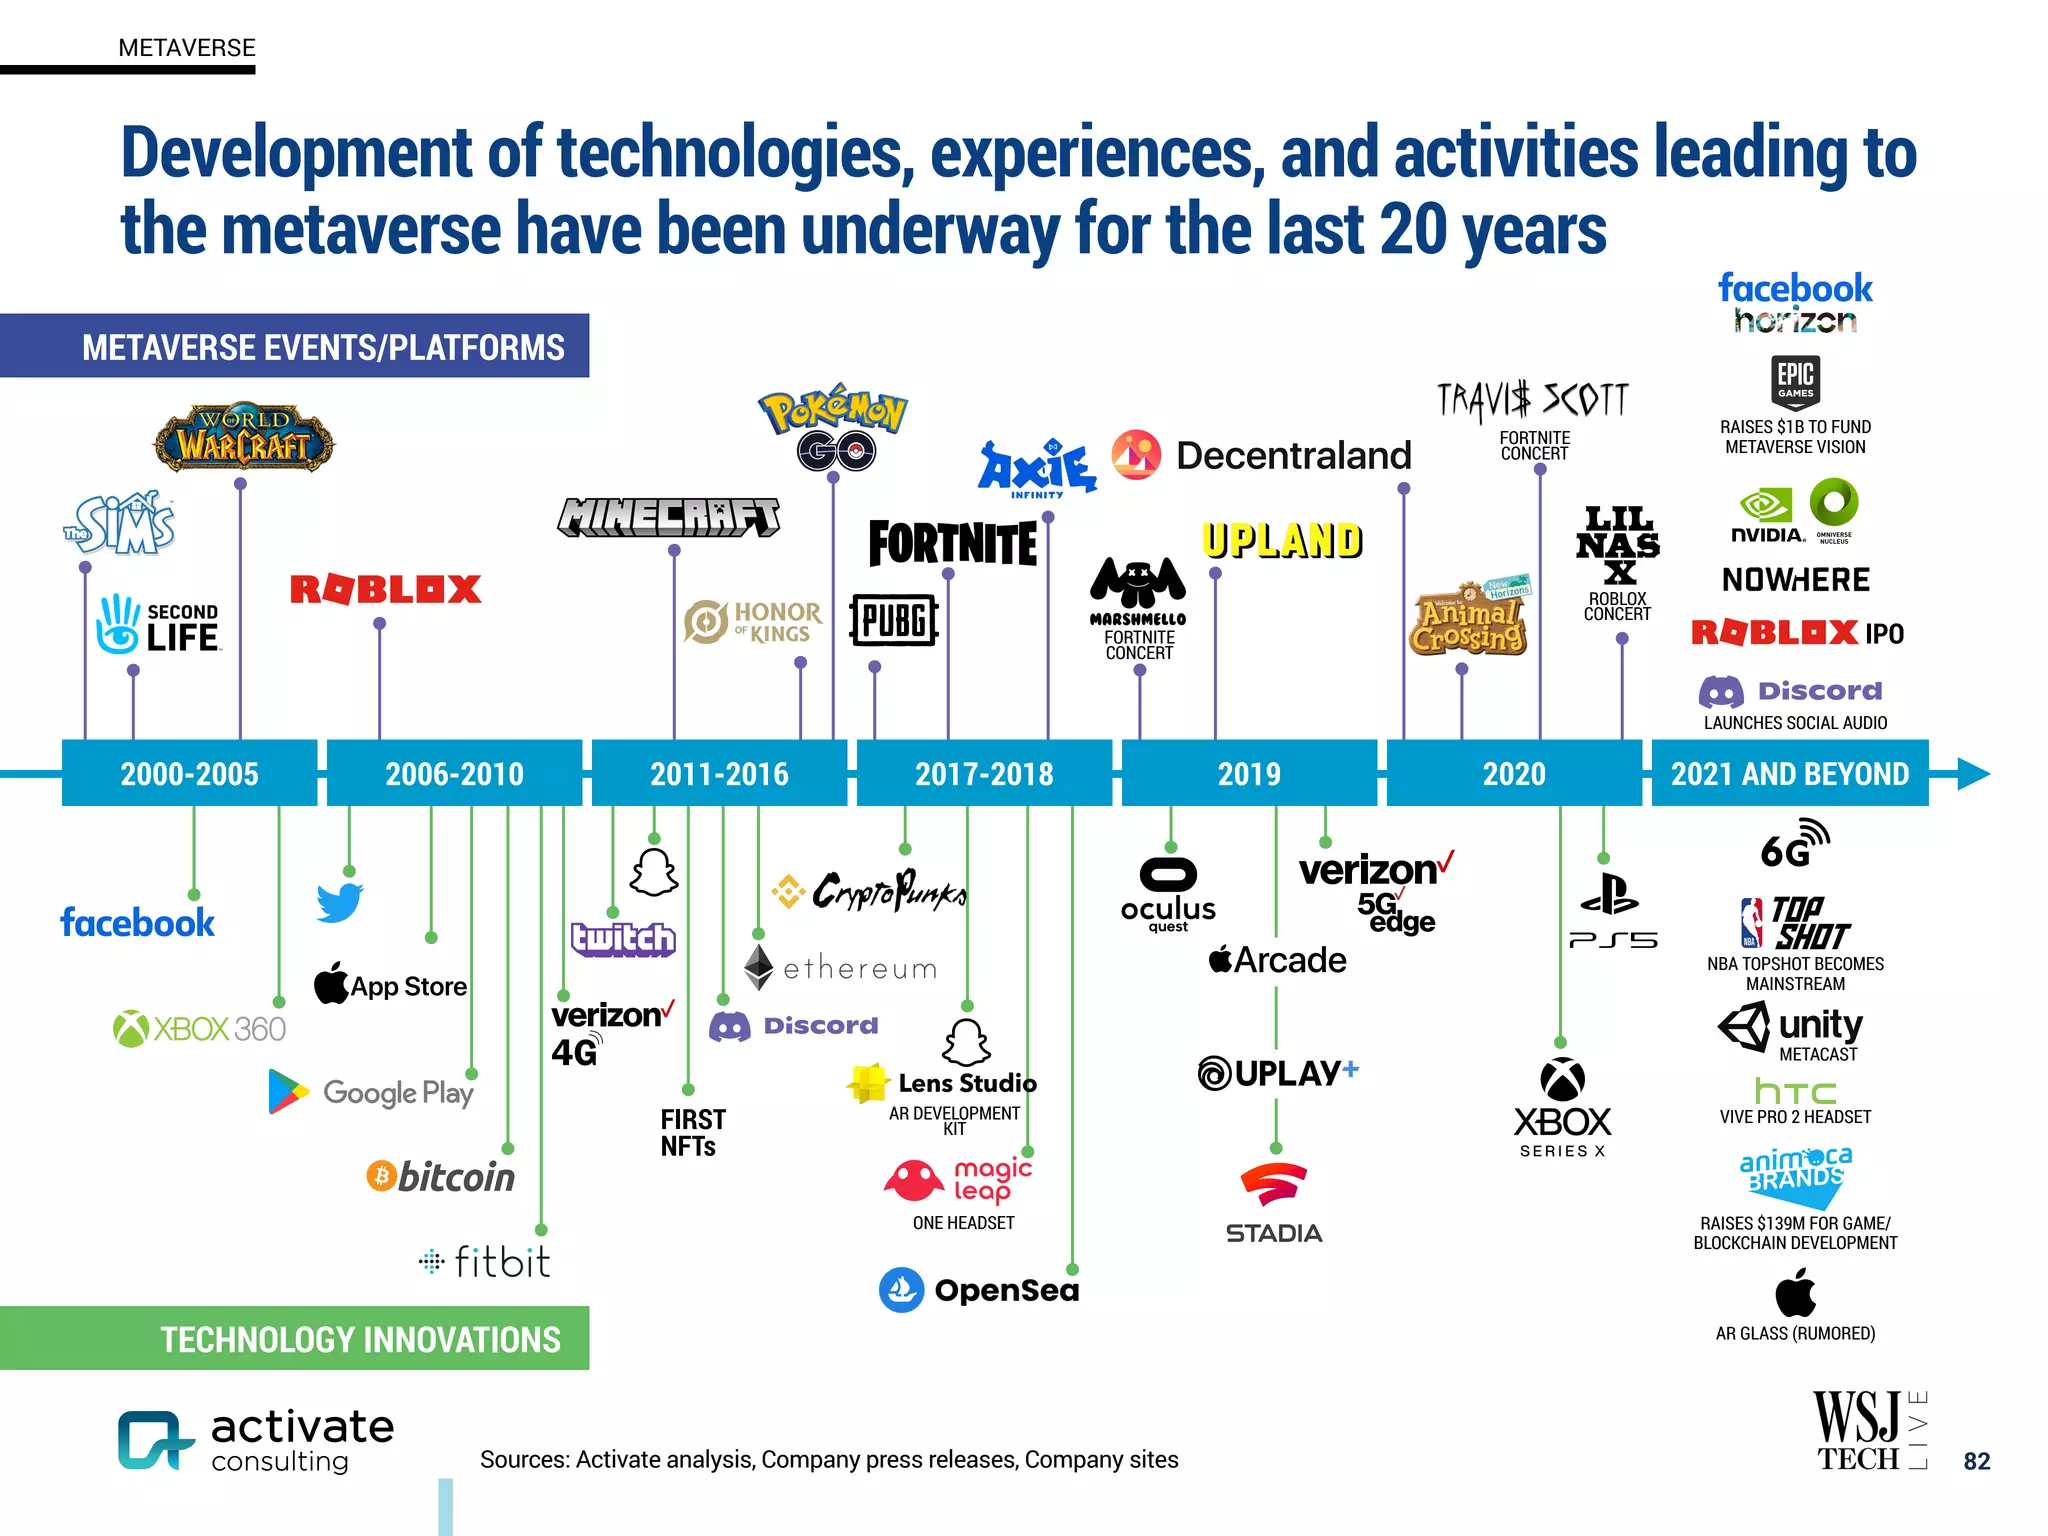
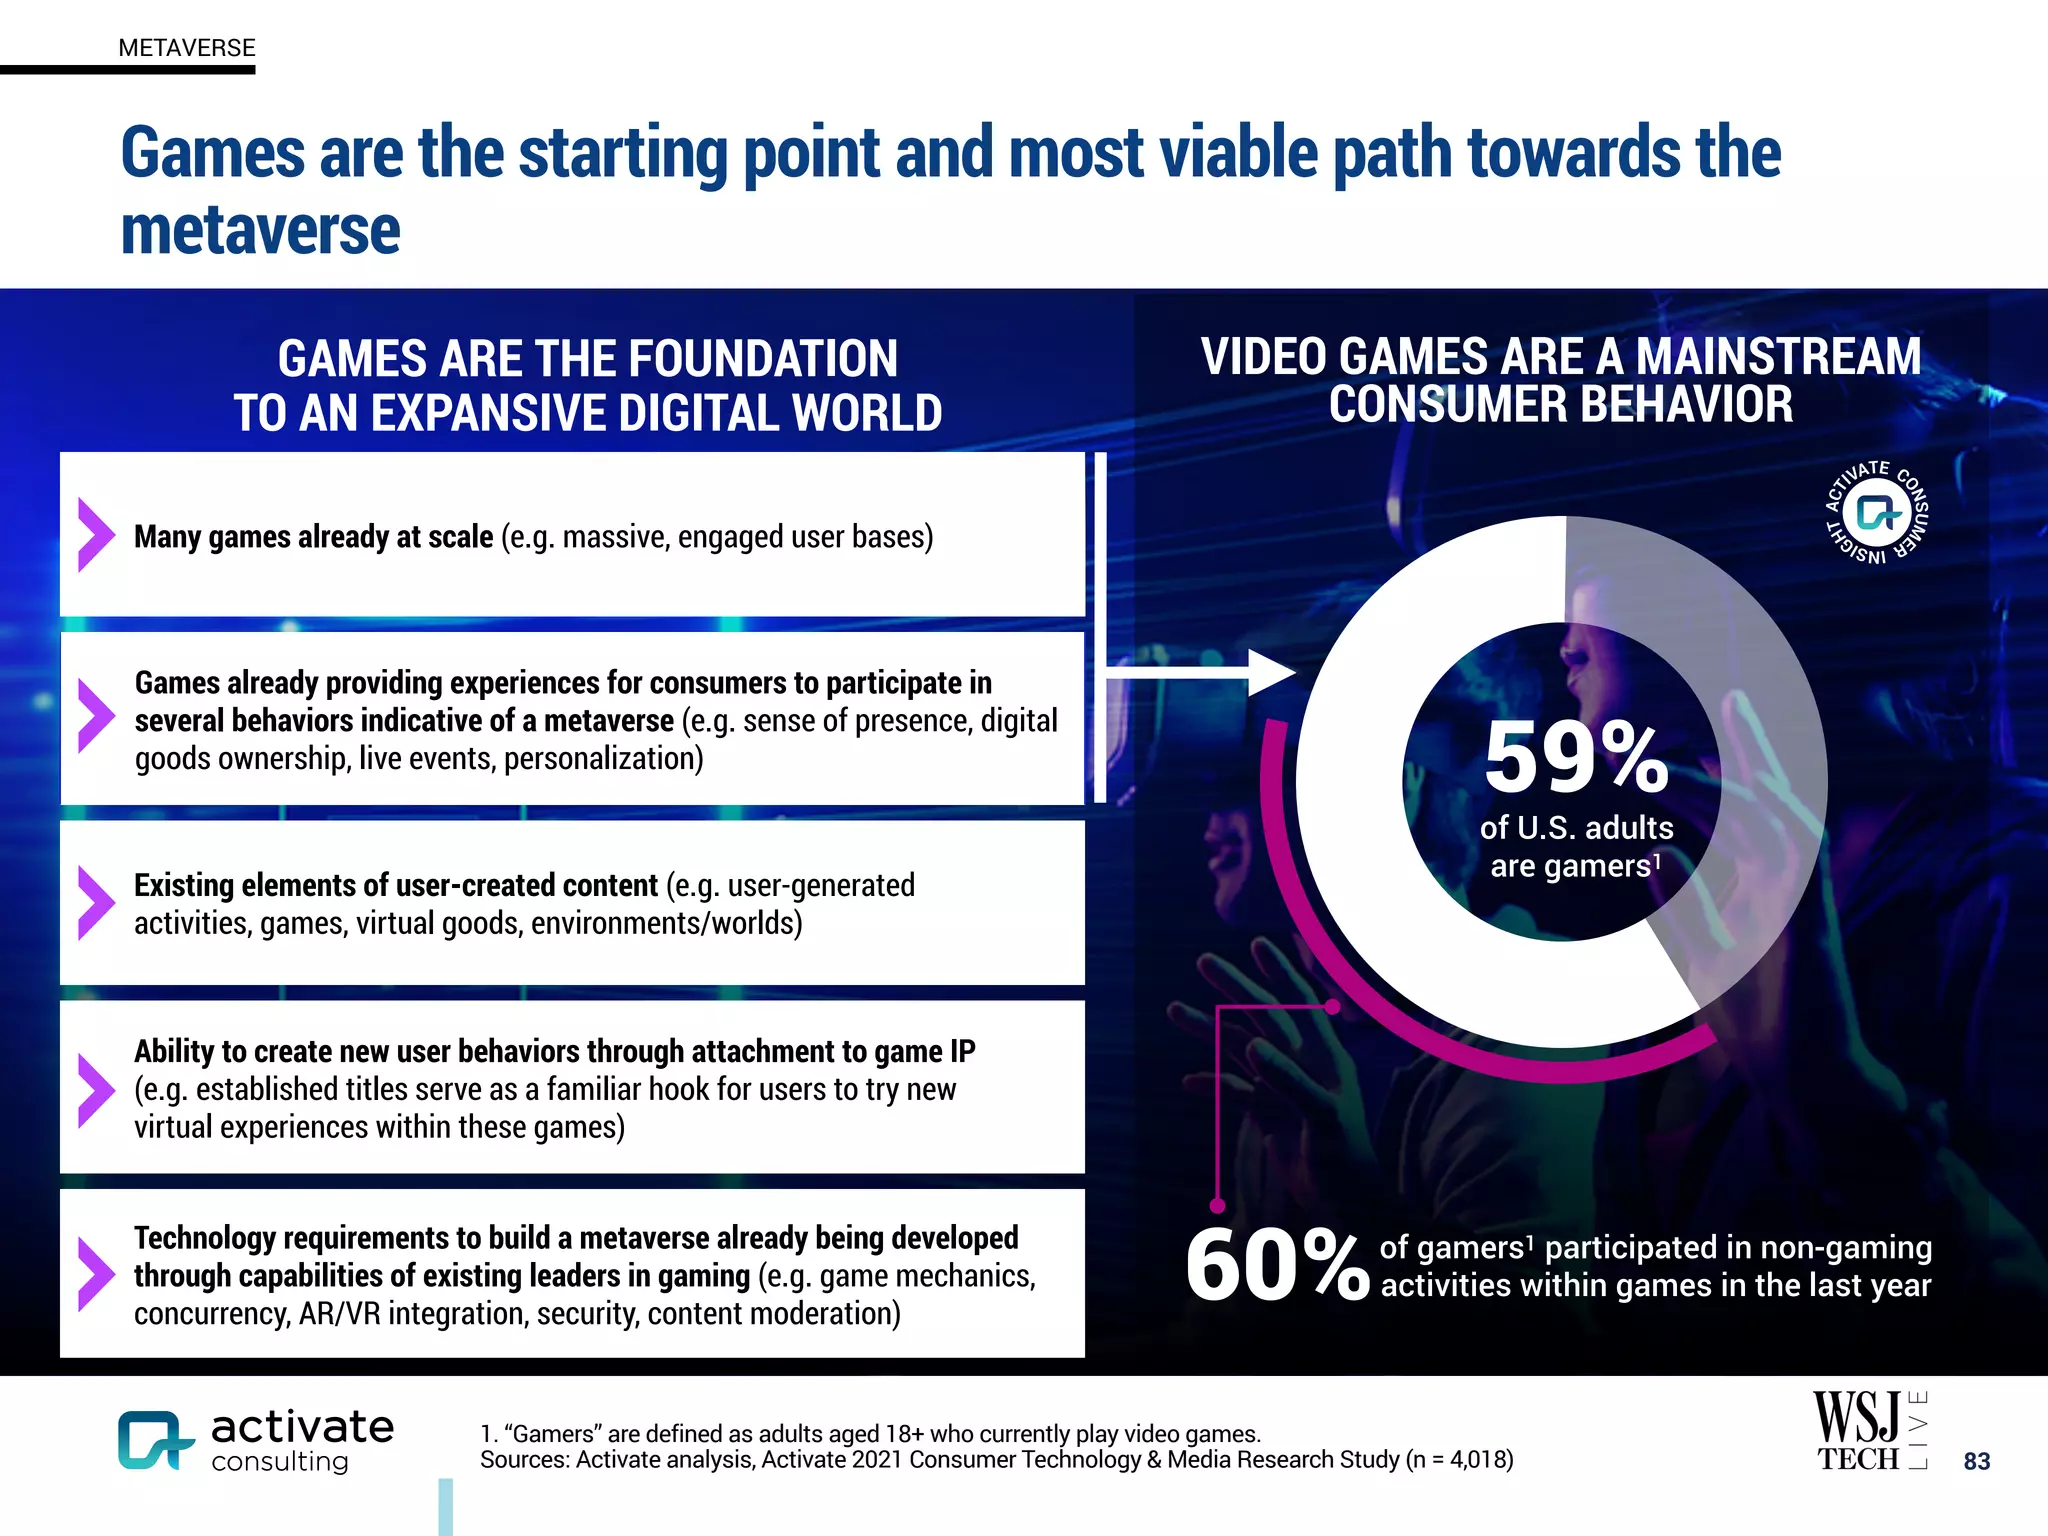
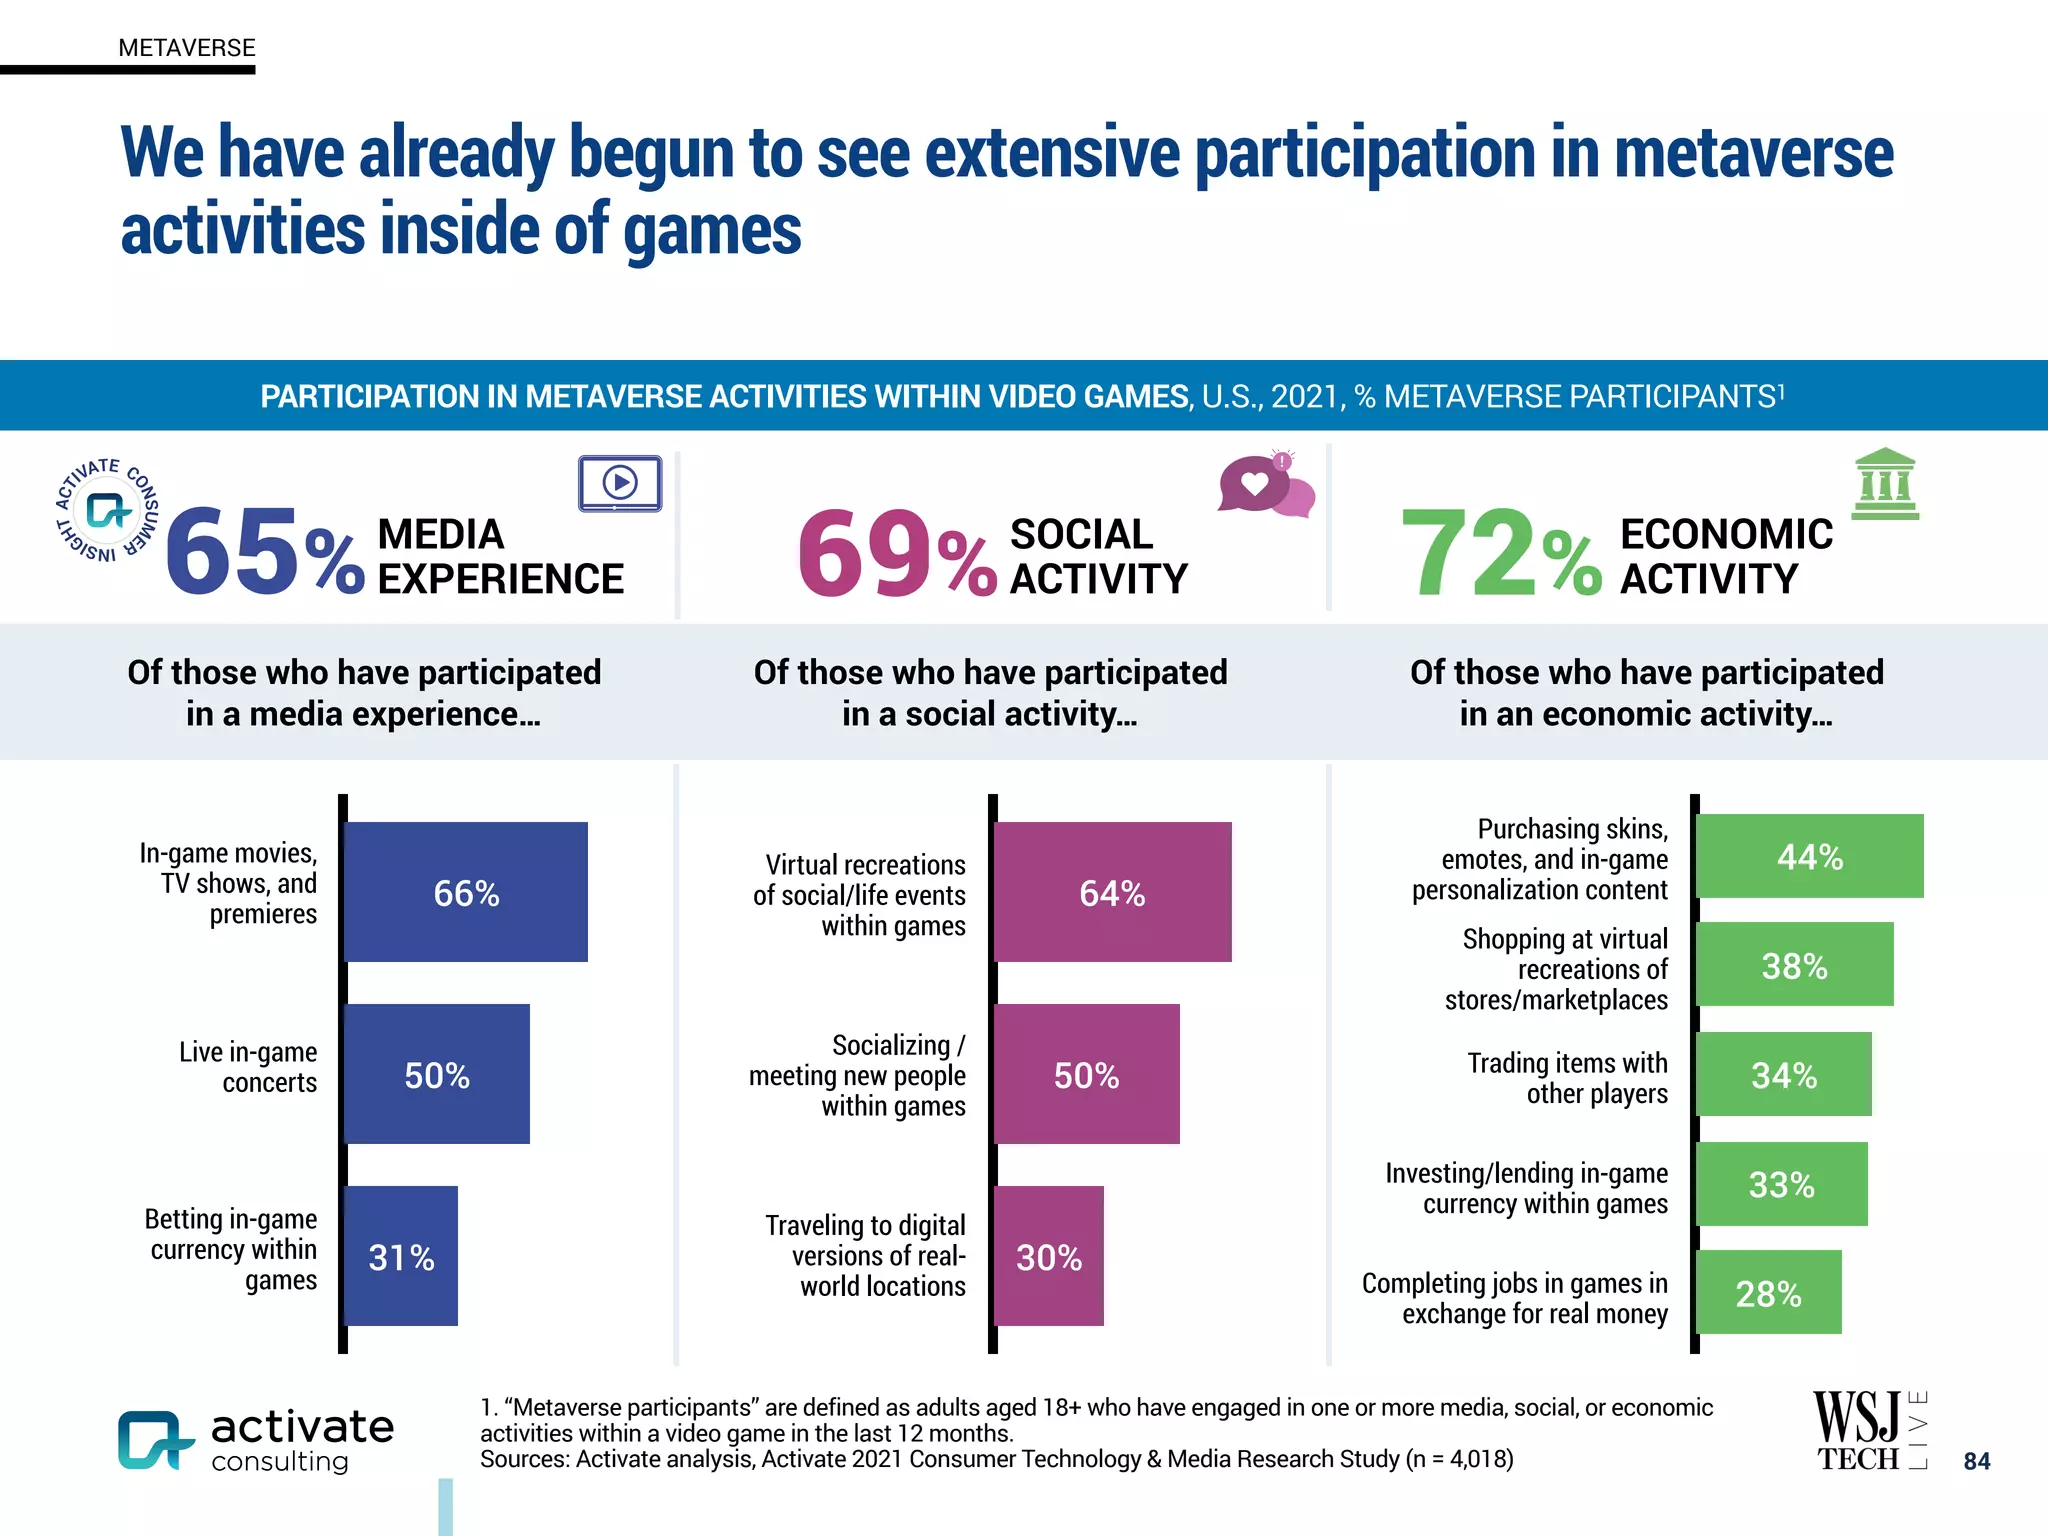
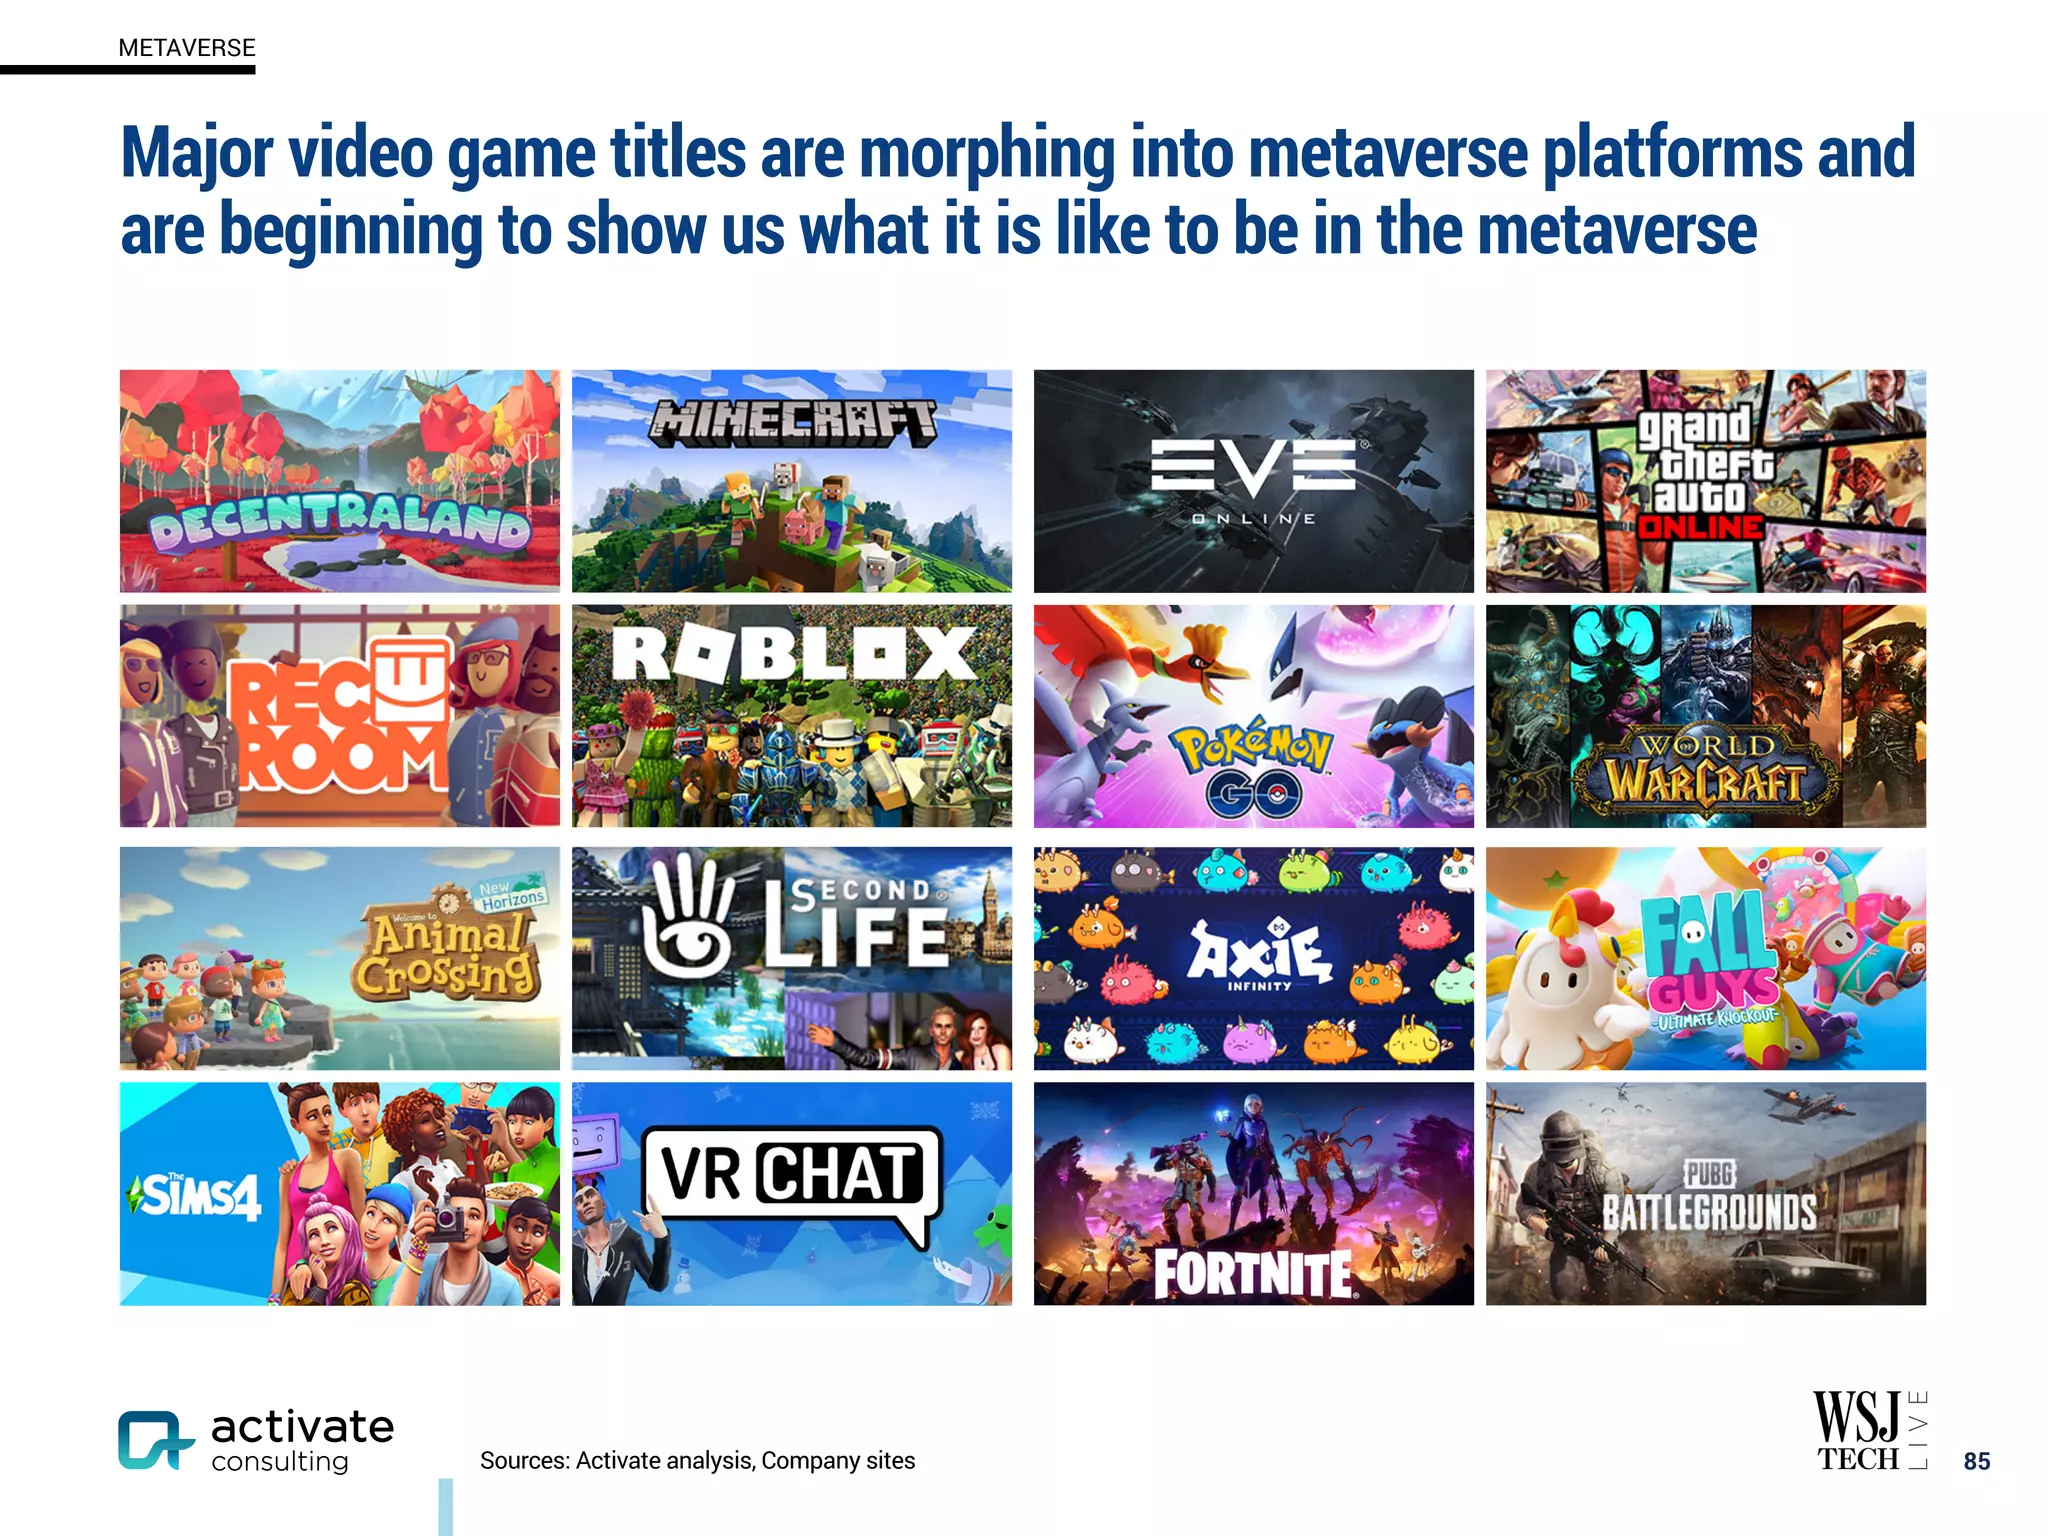
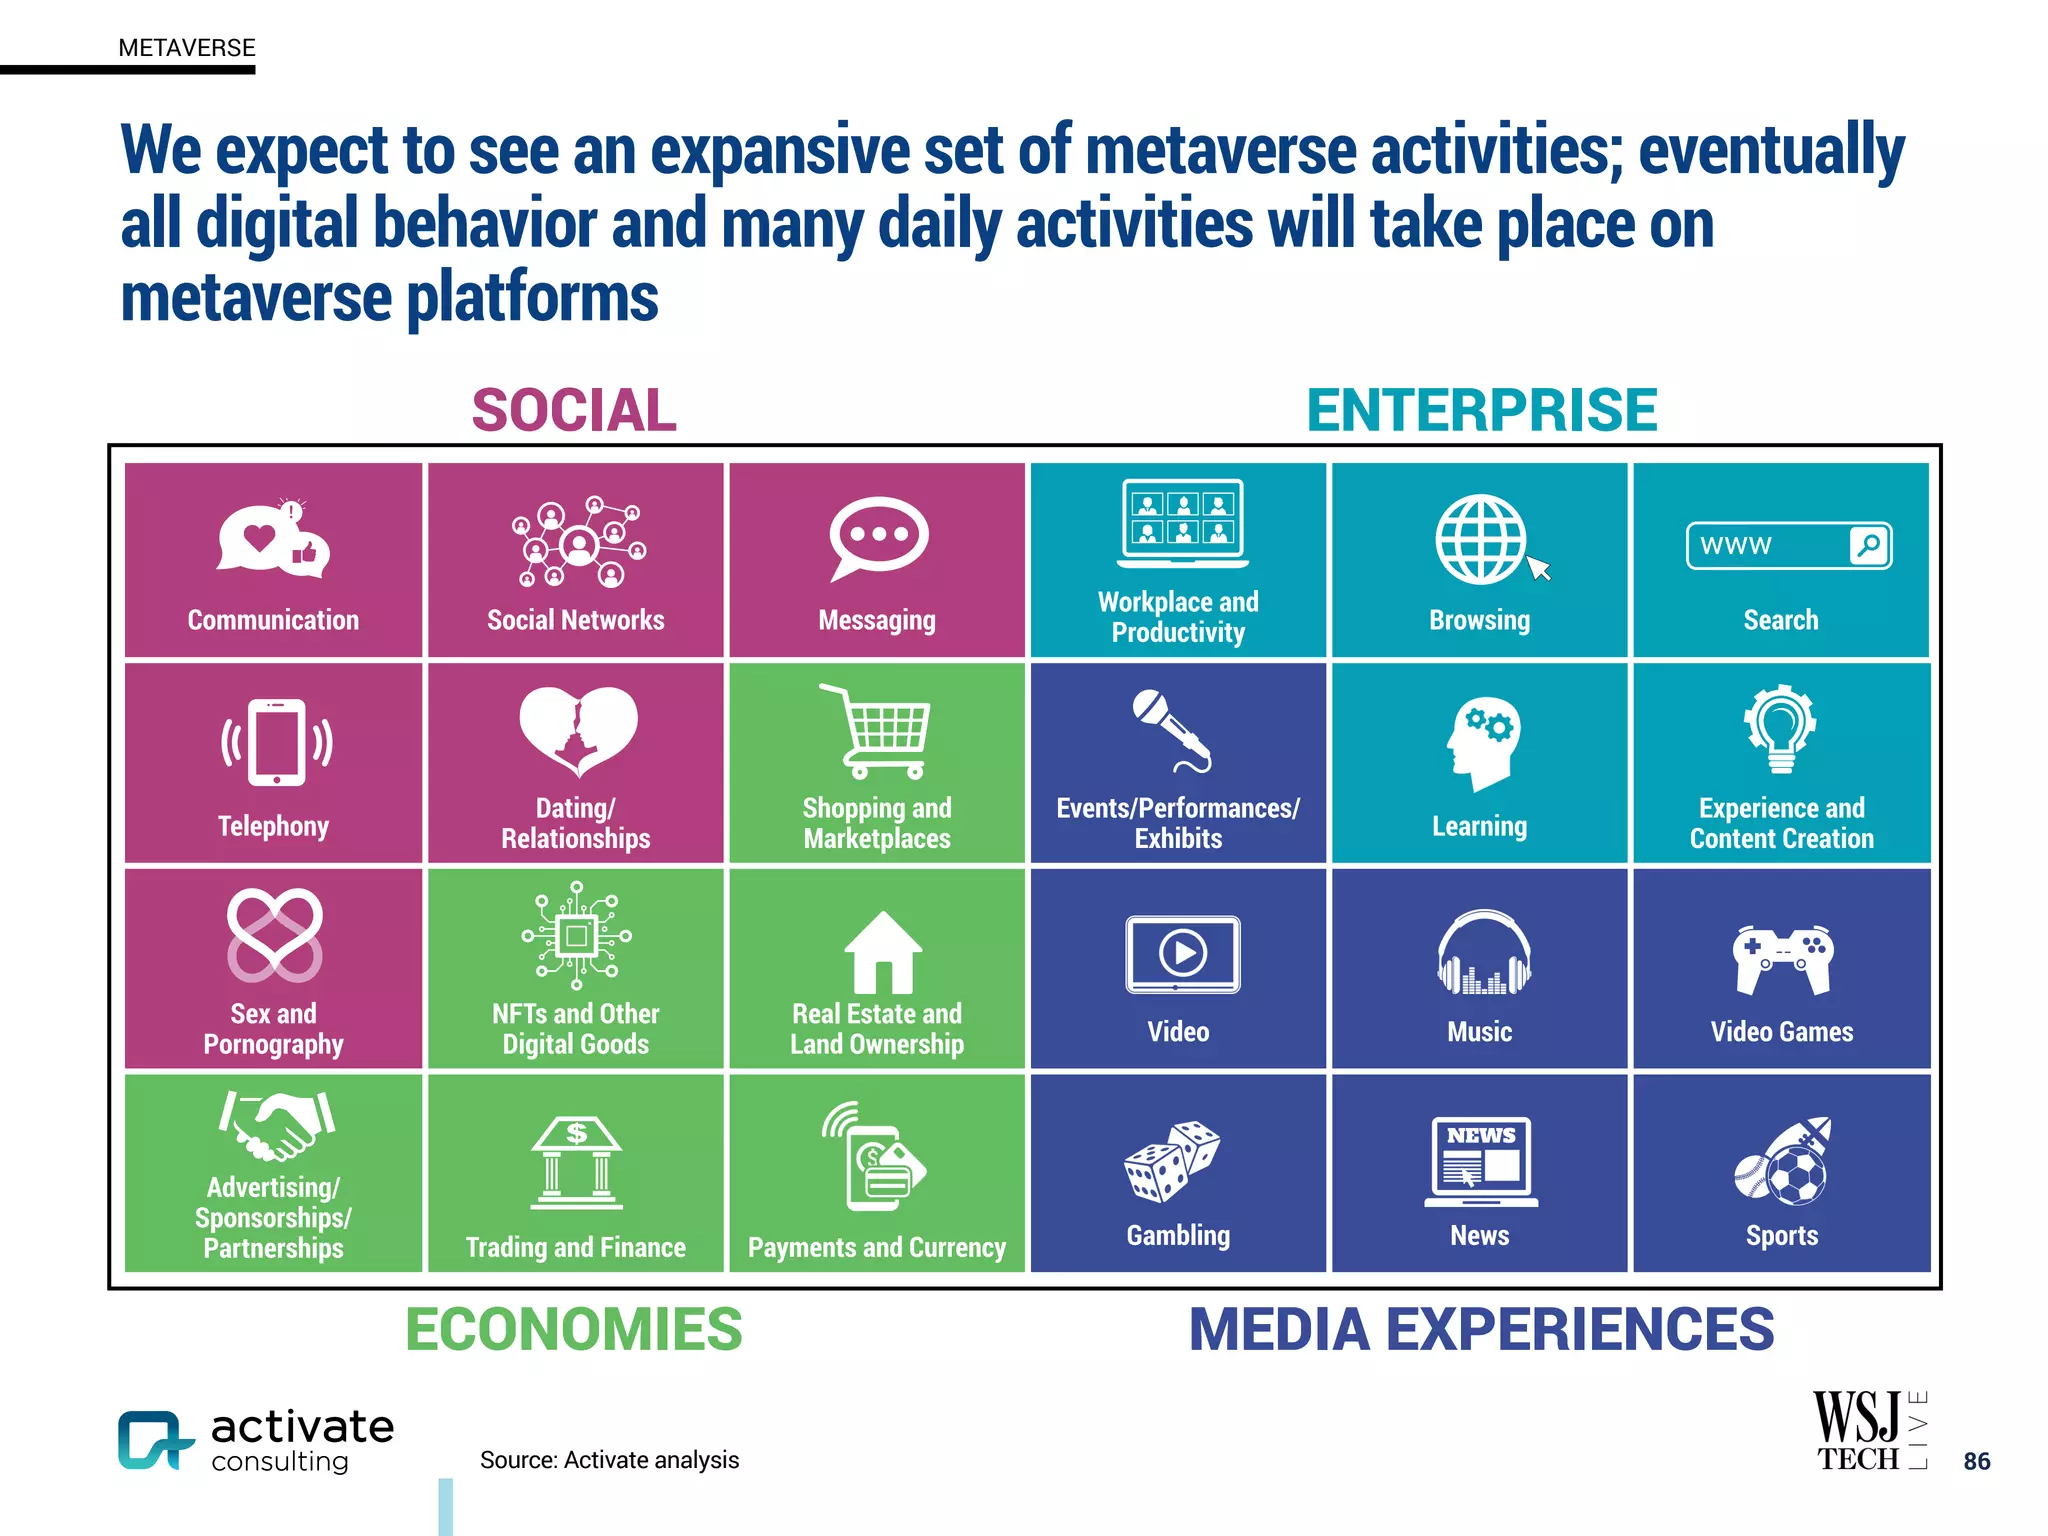
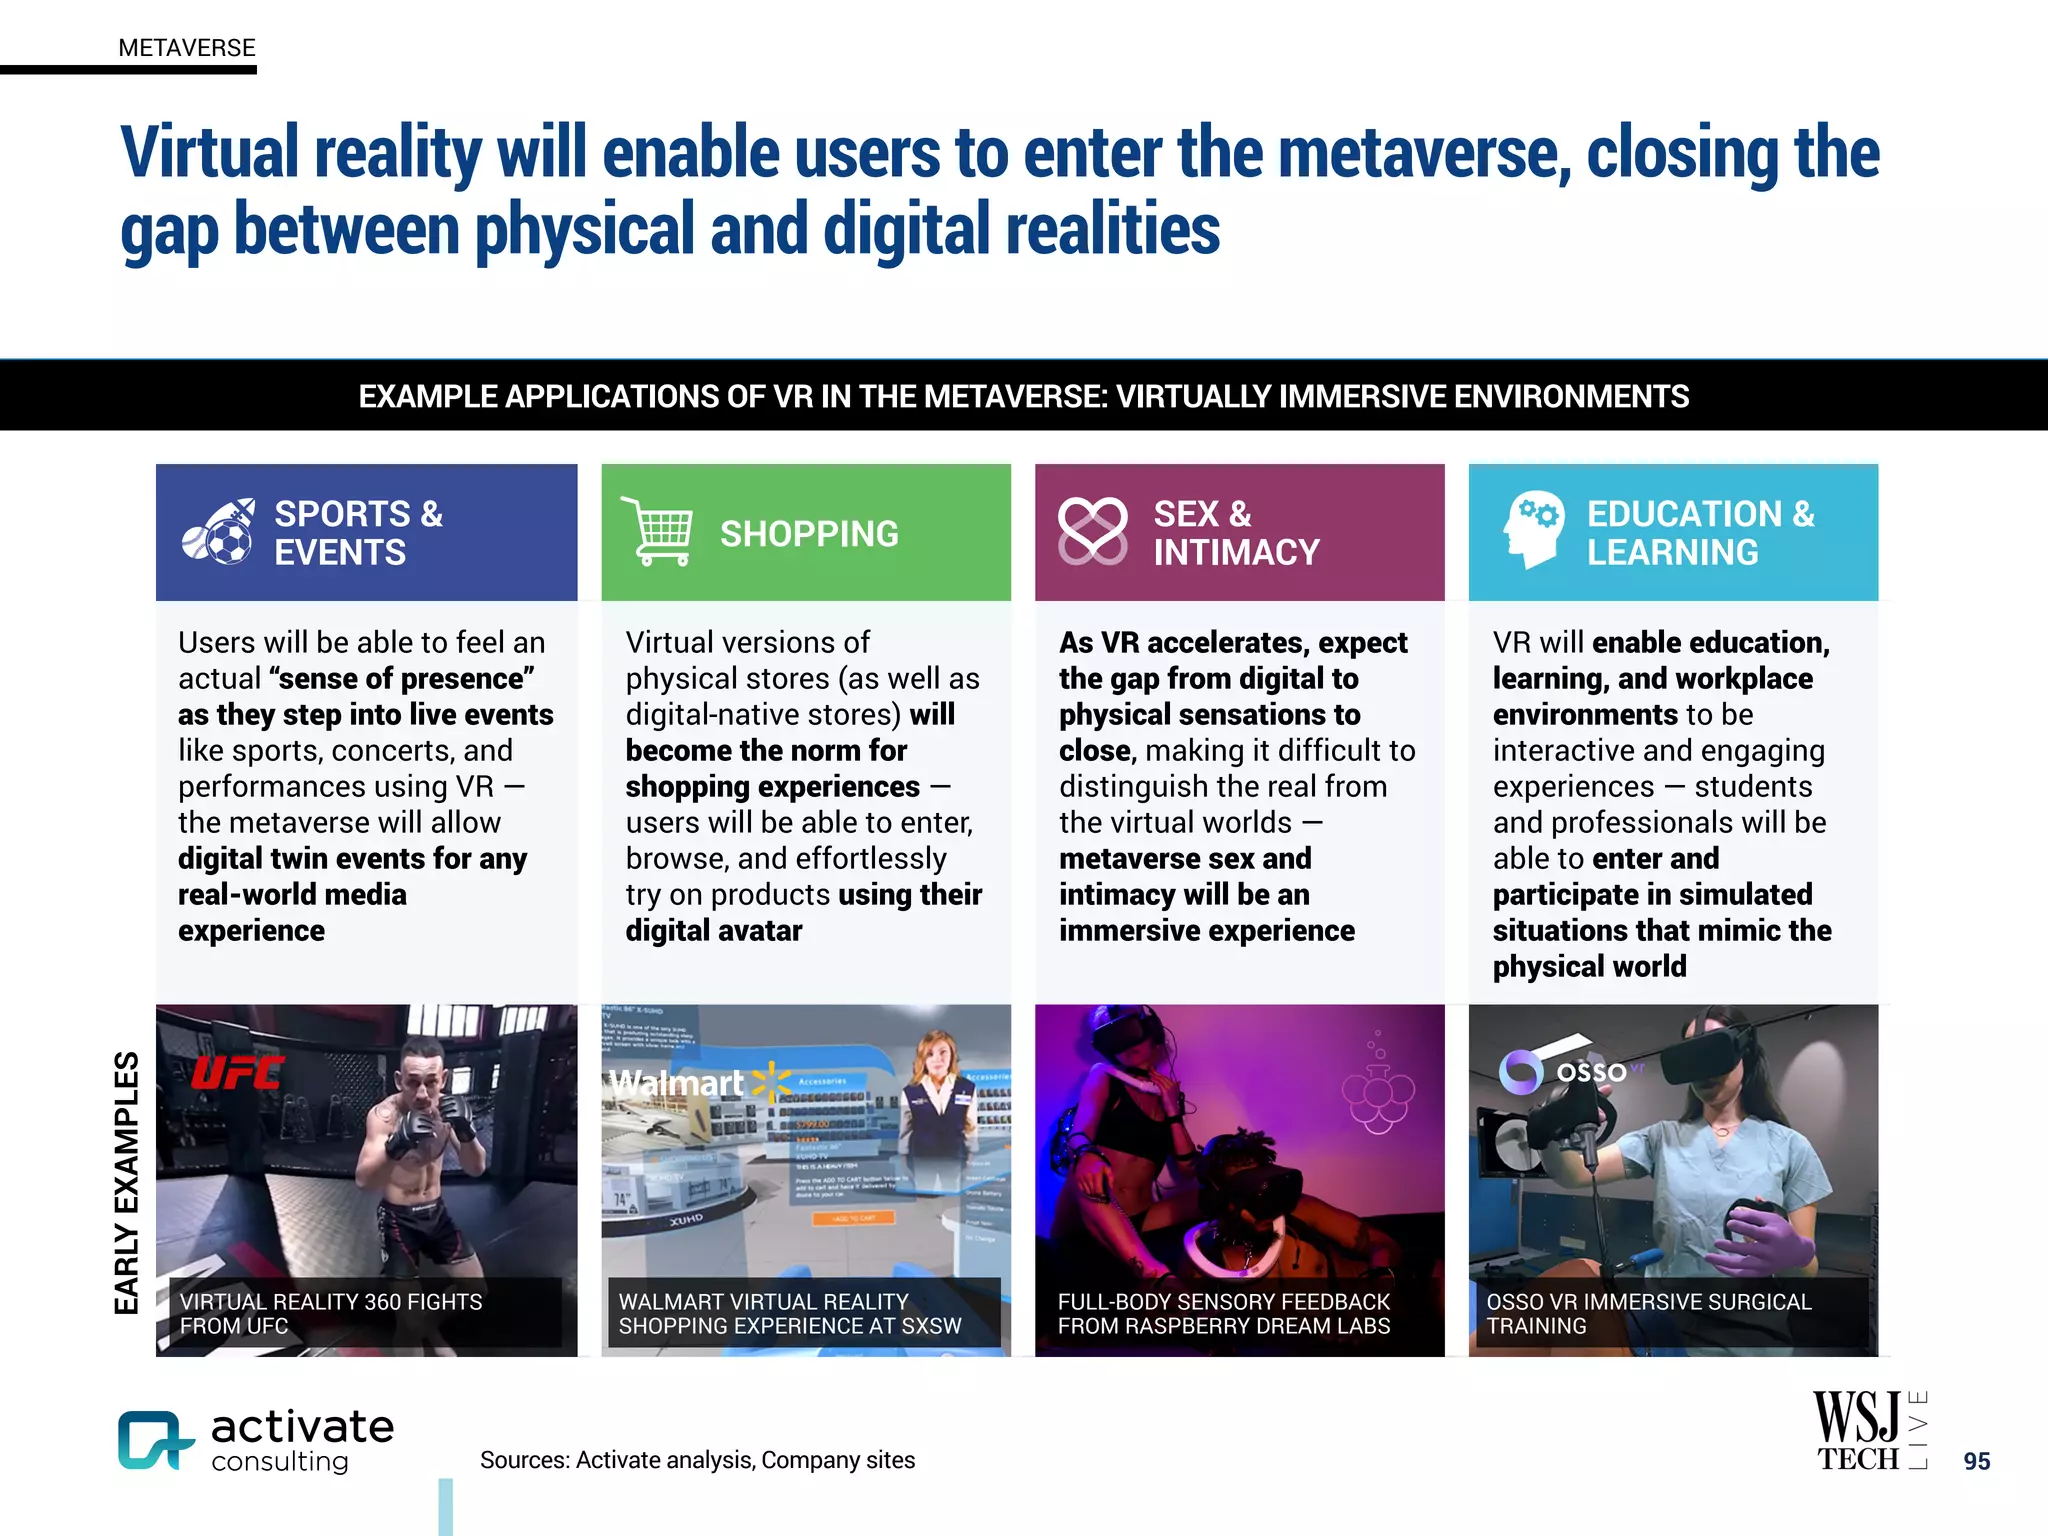
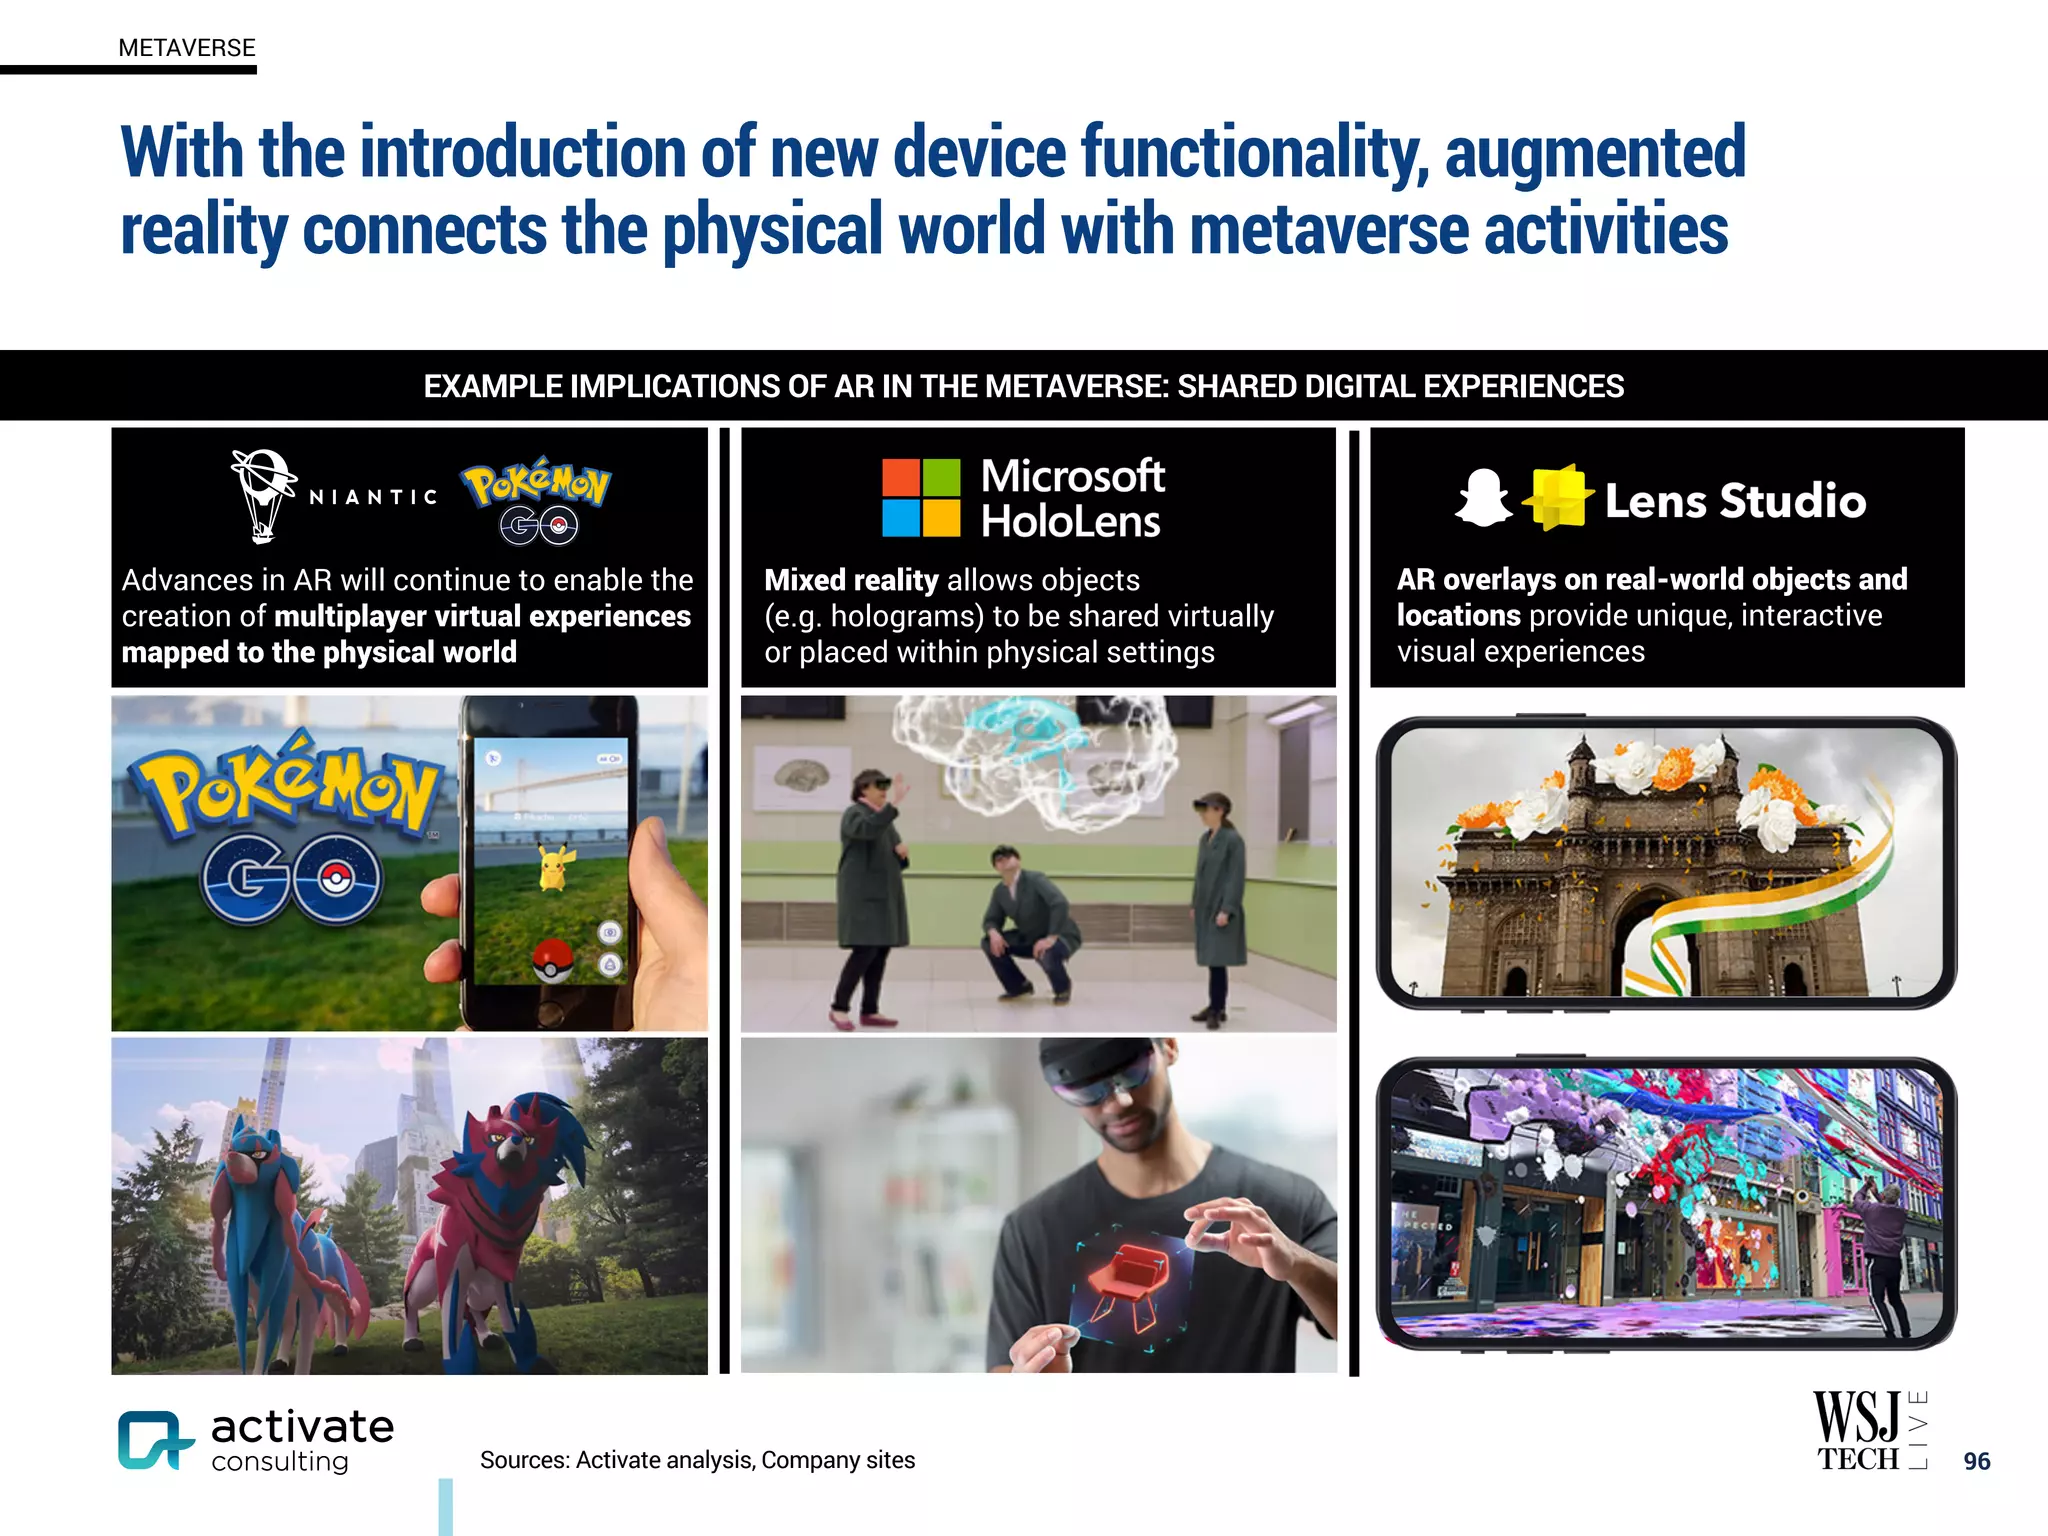
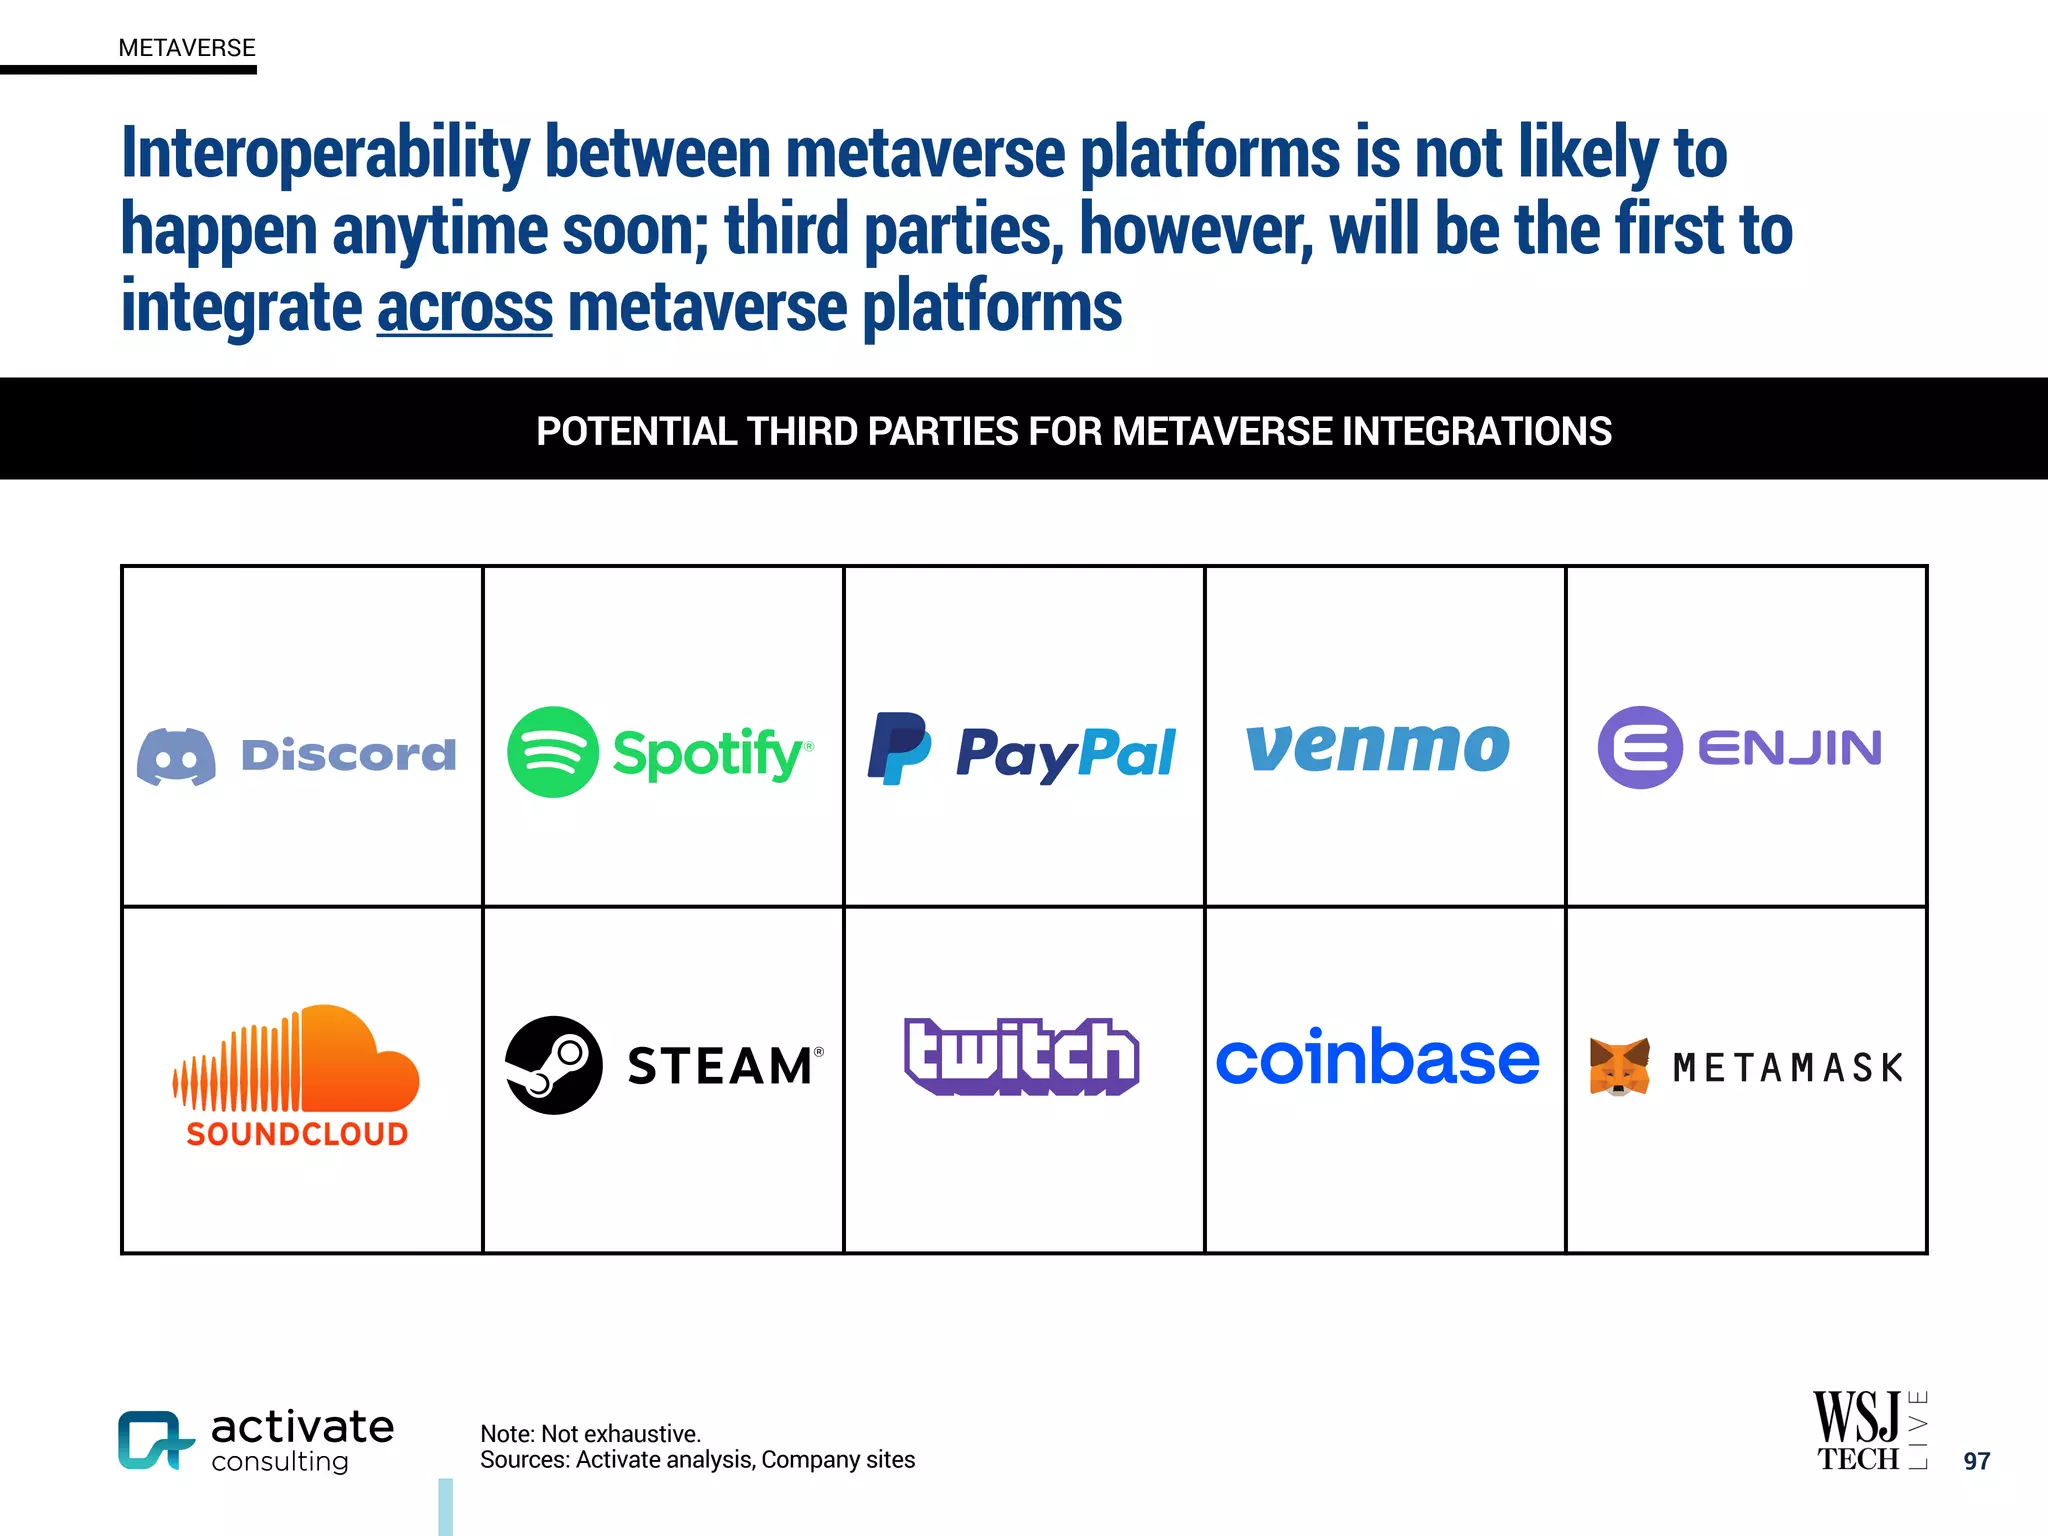
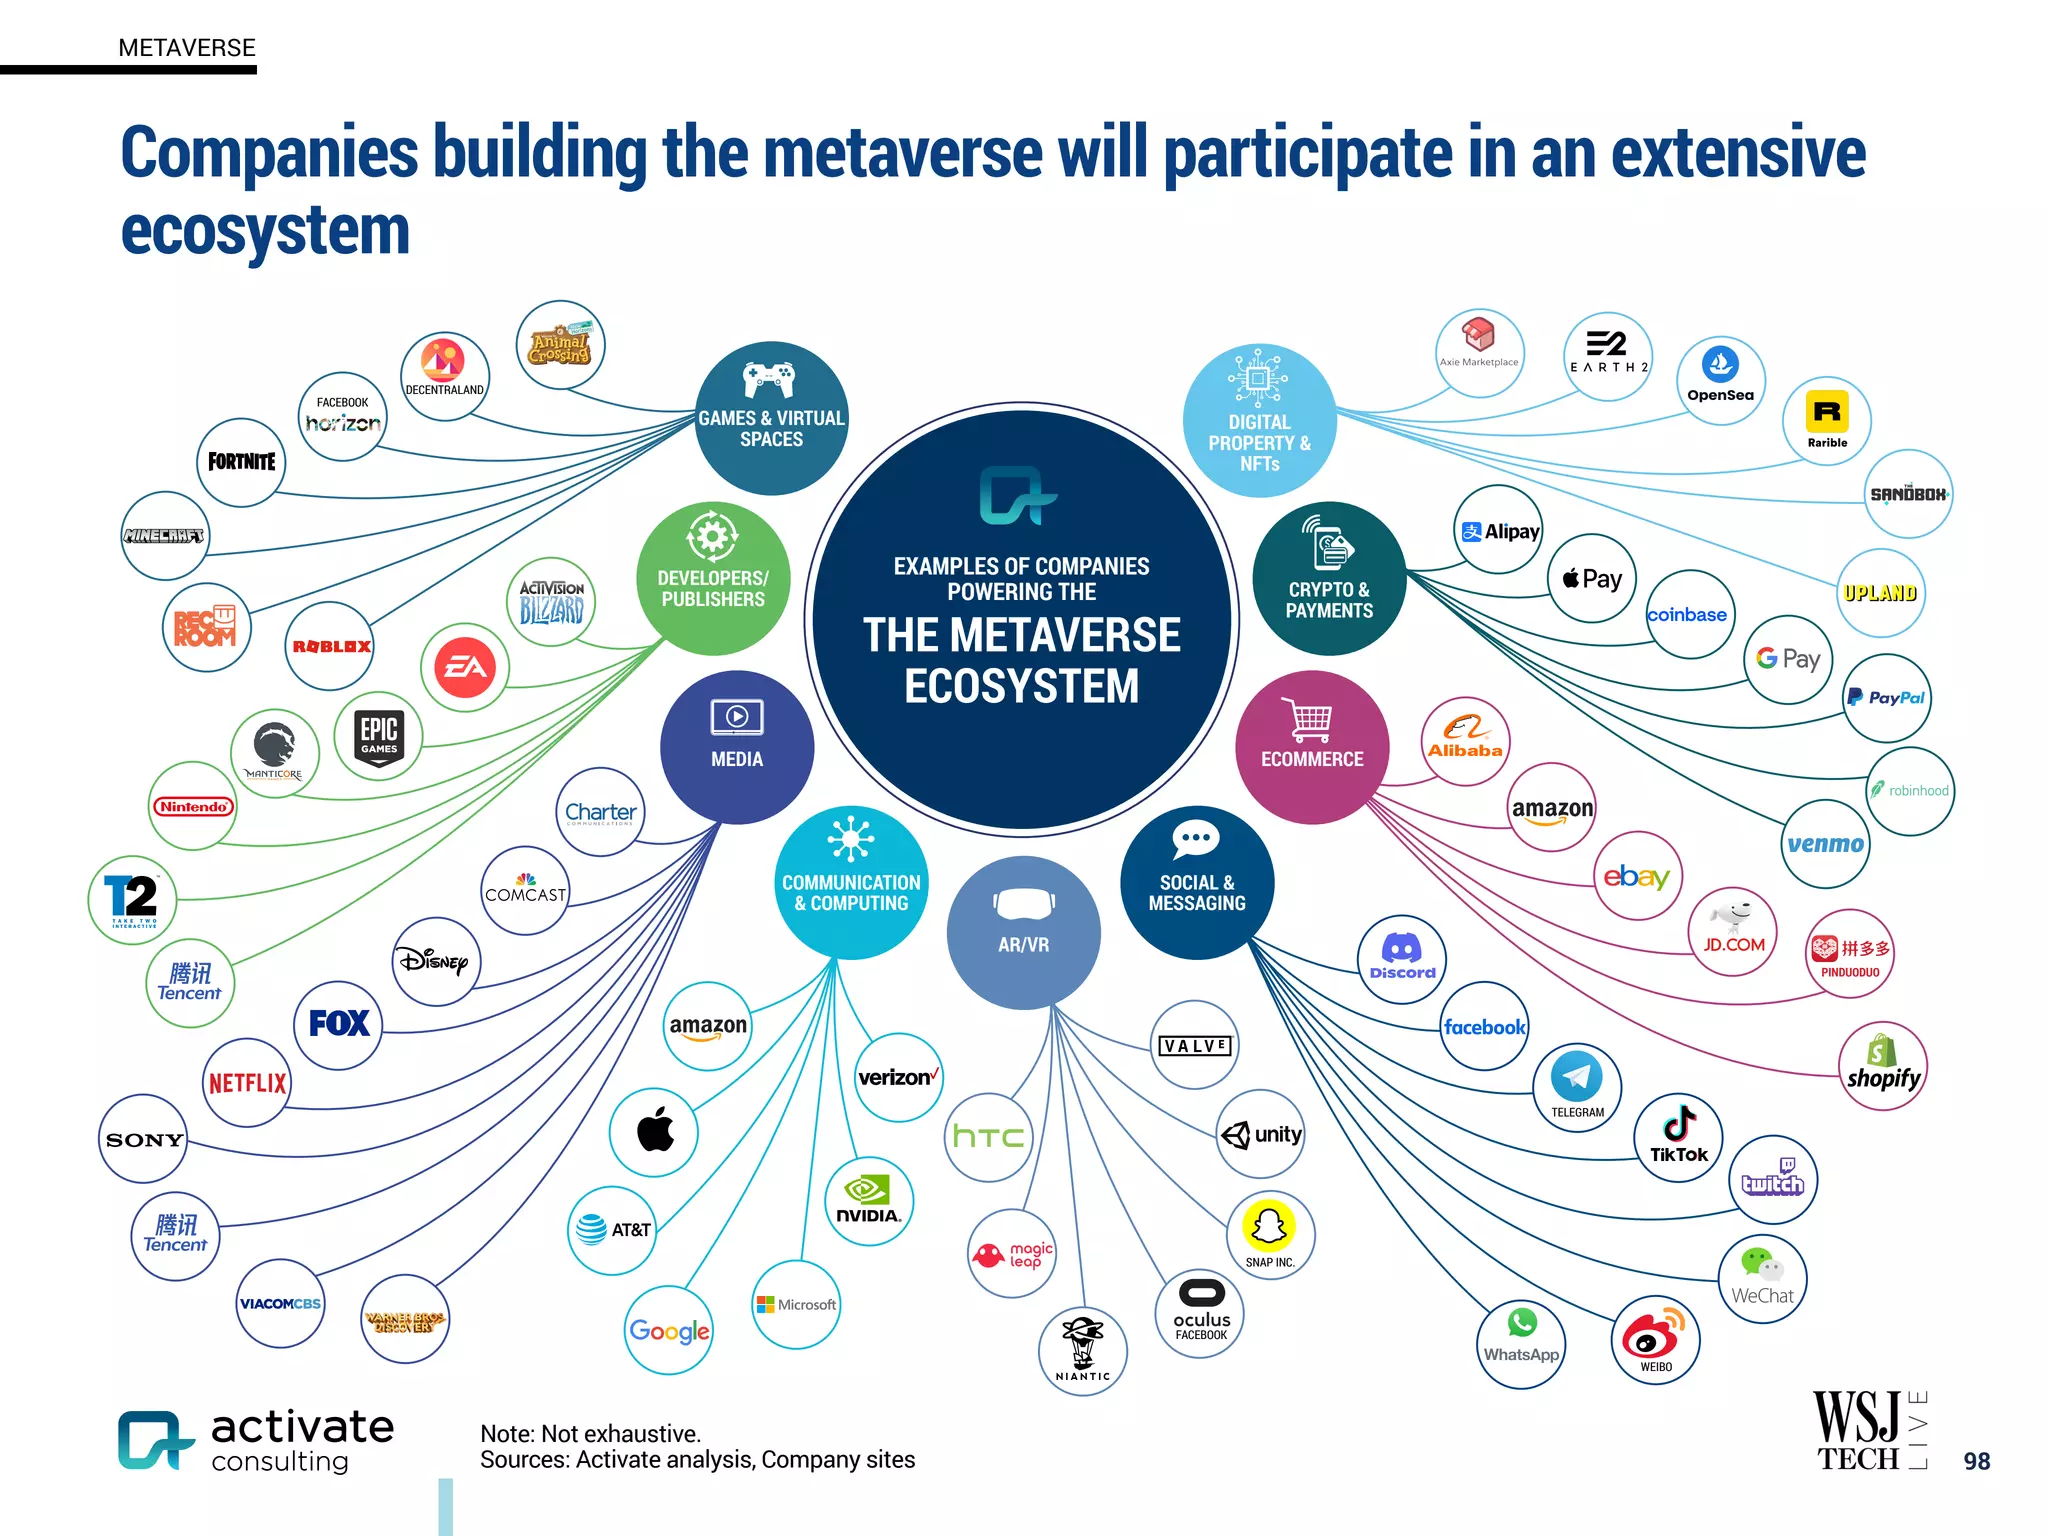
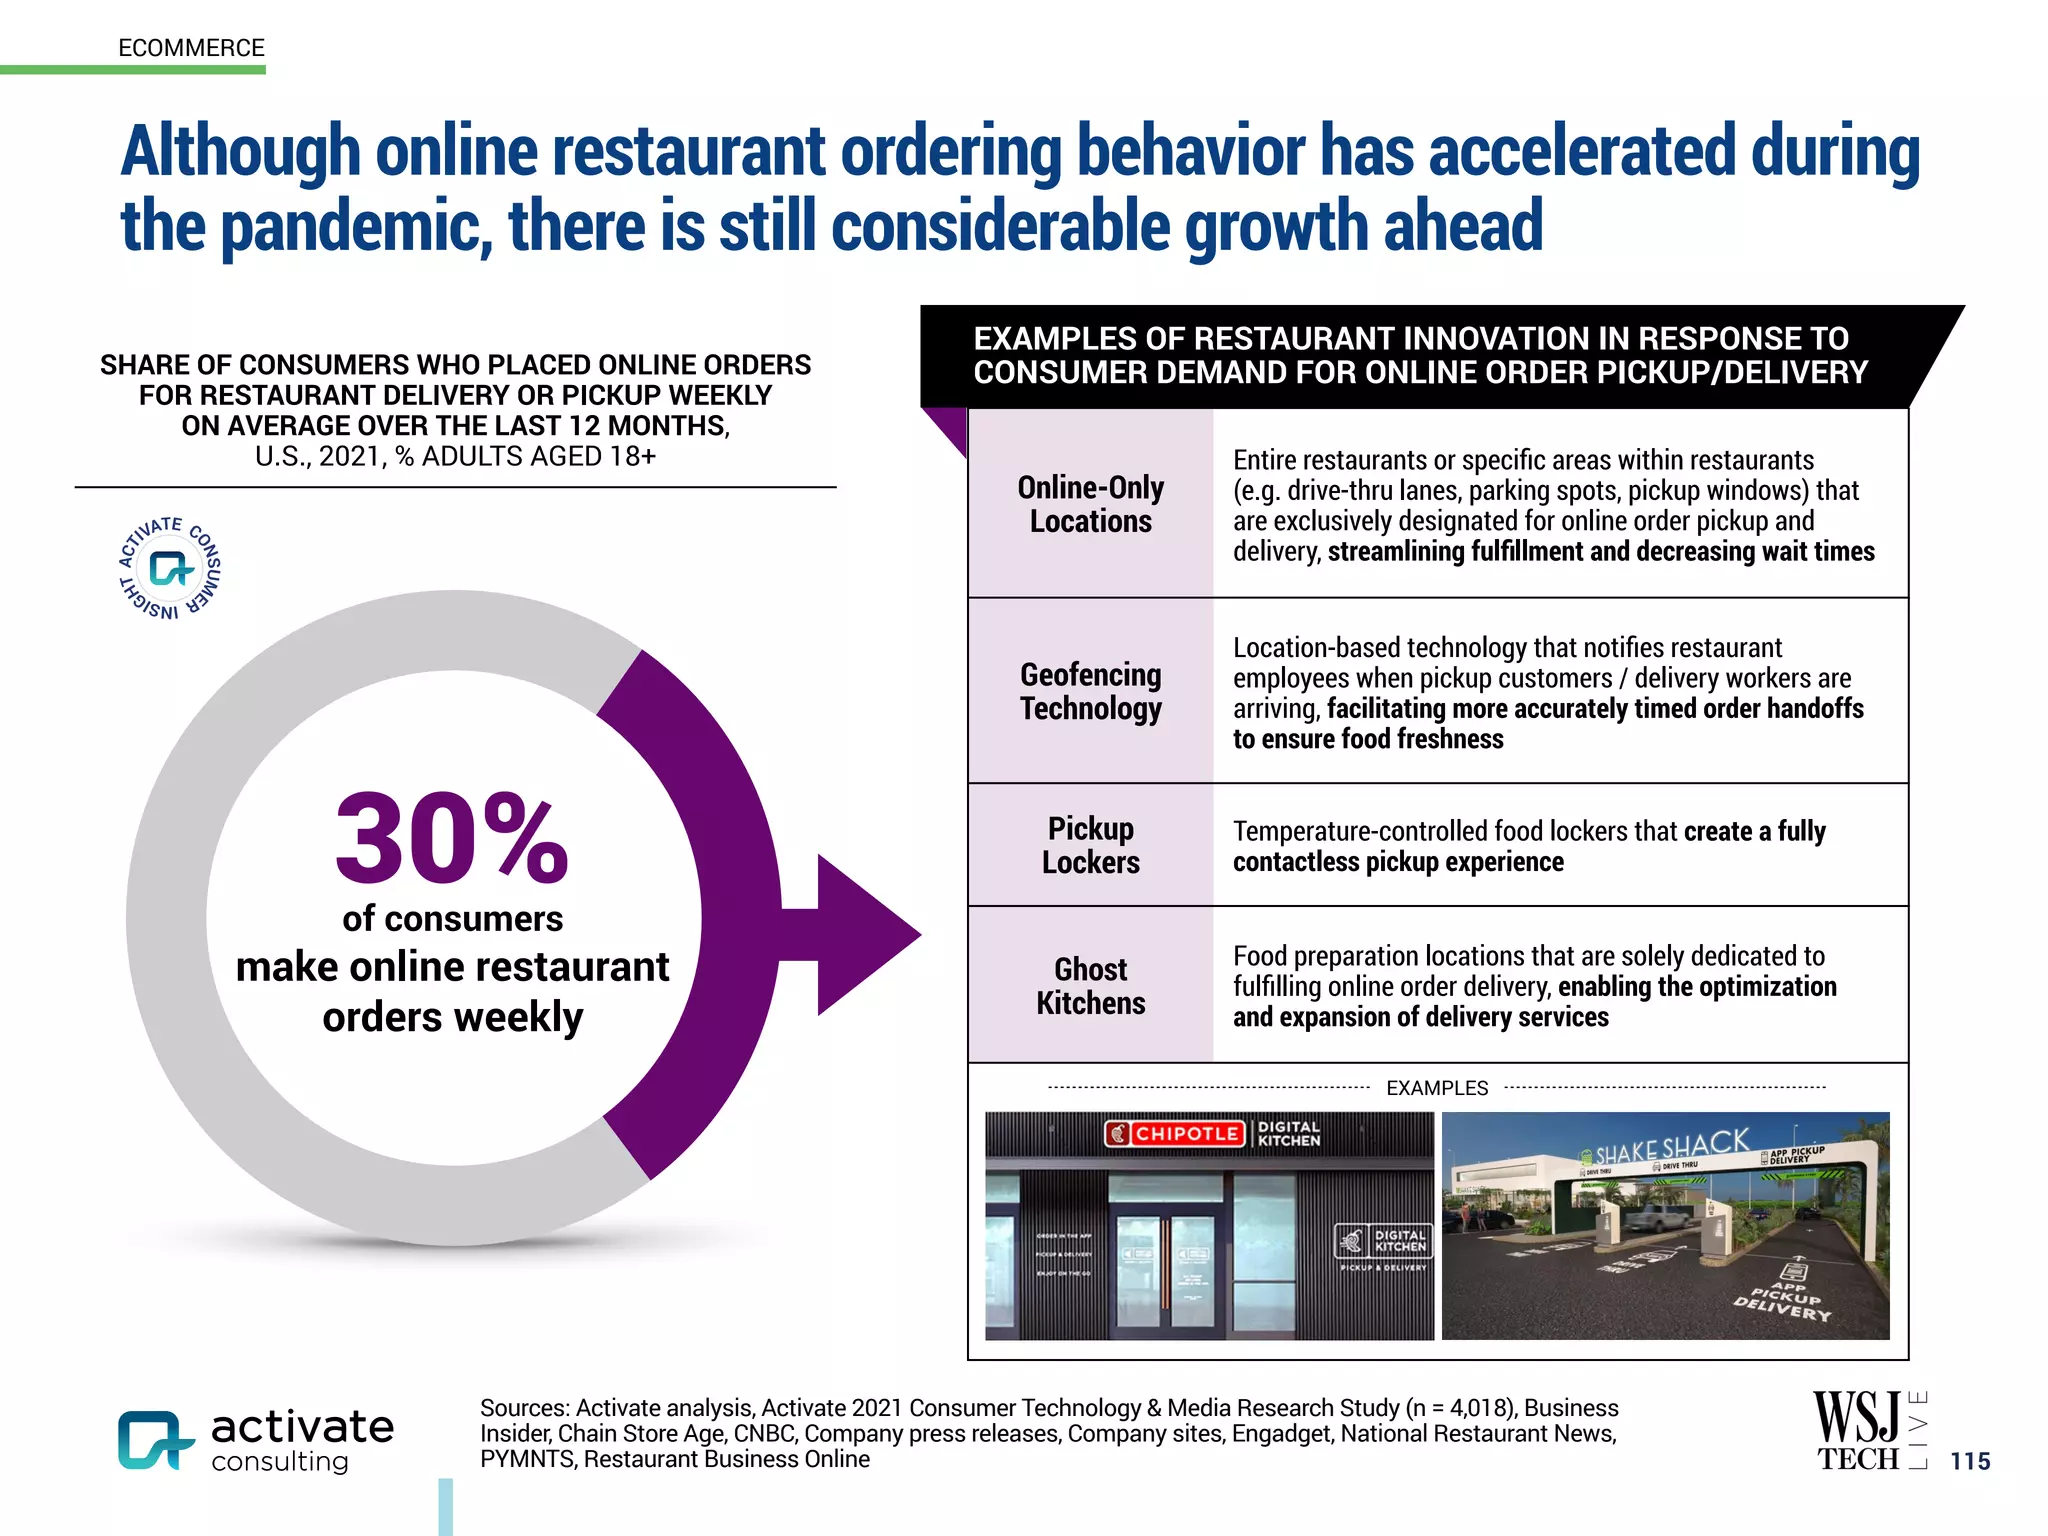
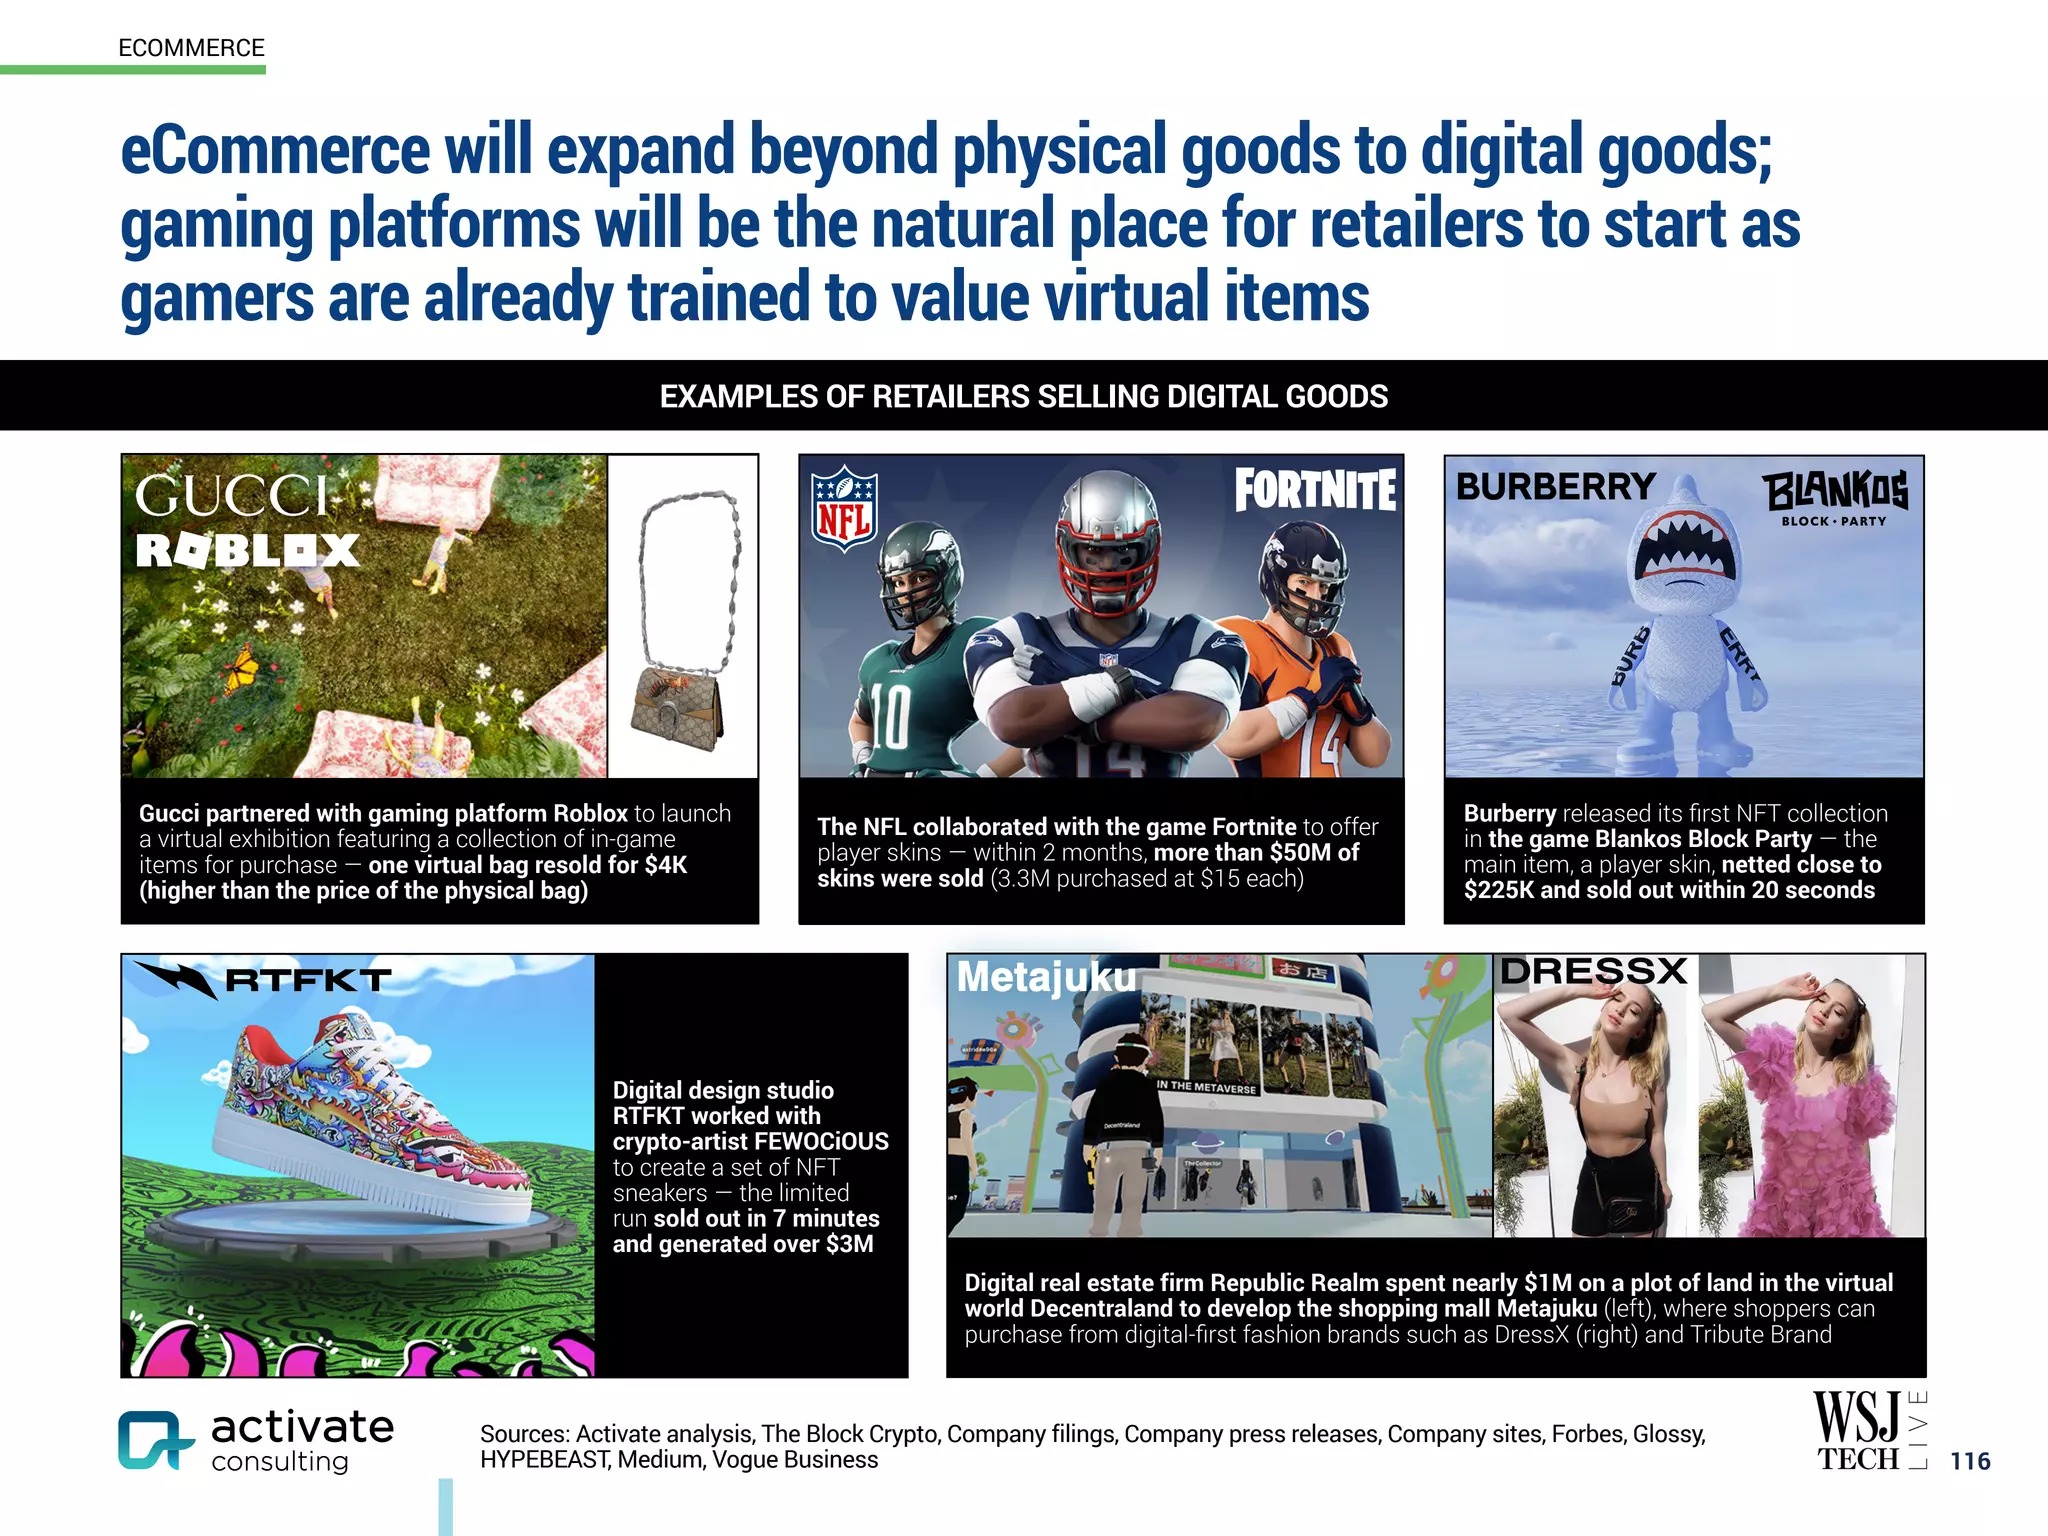
The document provides an overview and key takeaways from Activate Technology & Media Outlook 2022. Some of the main points covered in the 14 takeaways include: - Consumer spend on technology and media increased during the pandemic and more time spent will lead to new opportunities for growth. - Cryptocurrency usage will double in the next year as consumers move from investment to payments/transfers, though Bitcoin and Ethereum dominate currently. - NFTs will become a mainstream behavior as many industries create and trade them. - Video games are leading to the metaverse as most digital activities will take place within games. - The pursuit of the metaverse will drive extensive technology and experience investments by