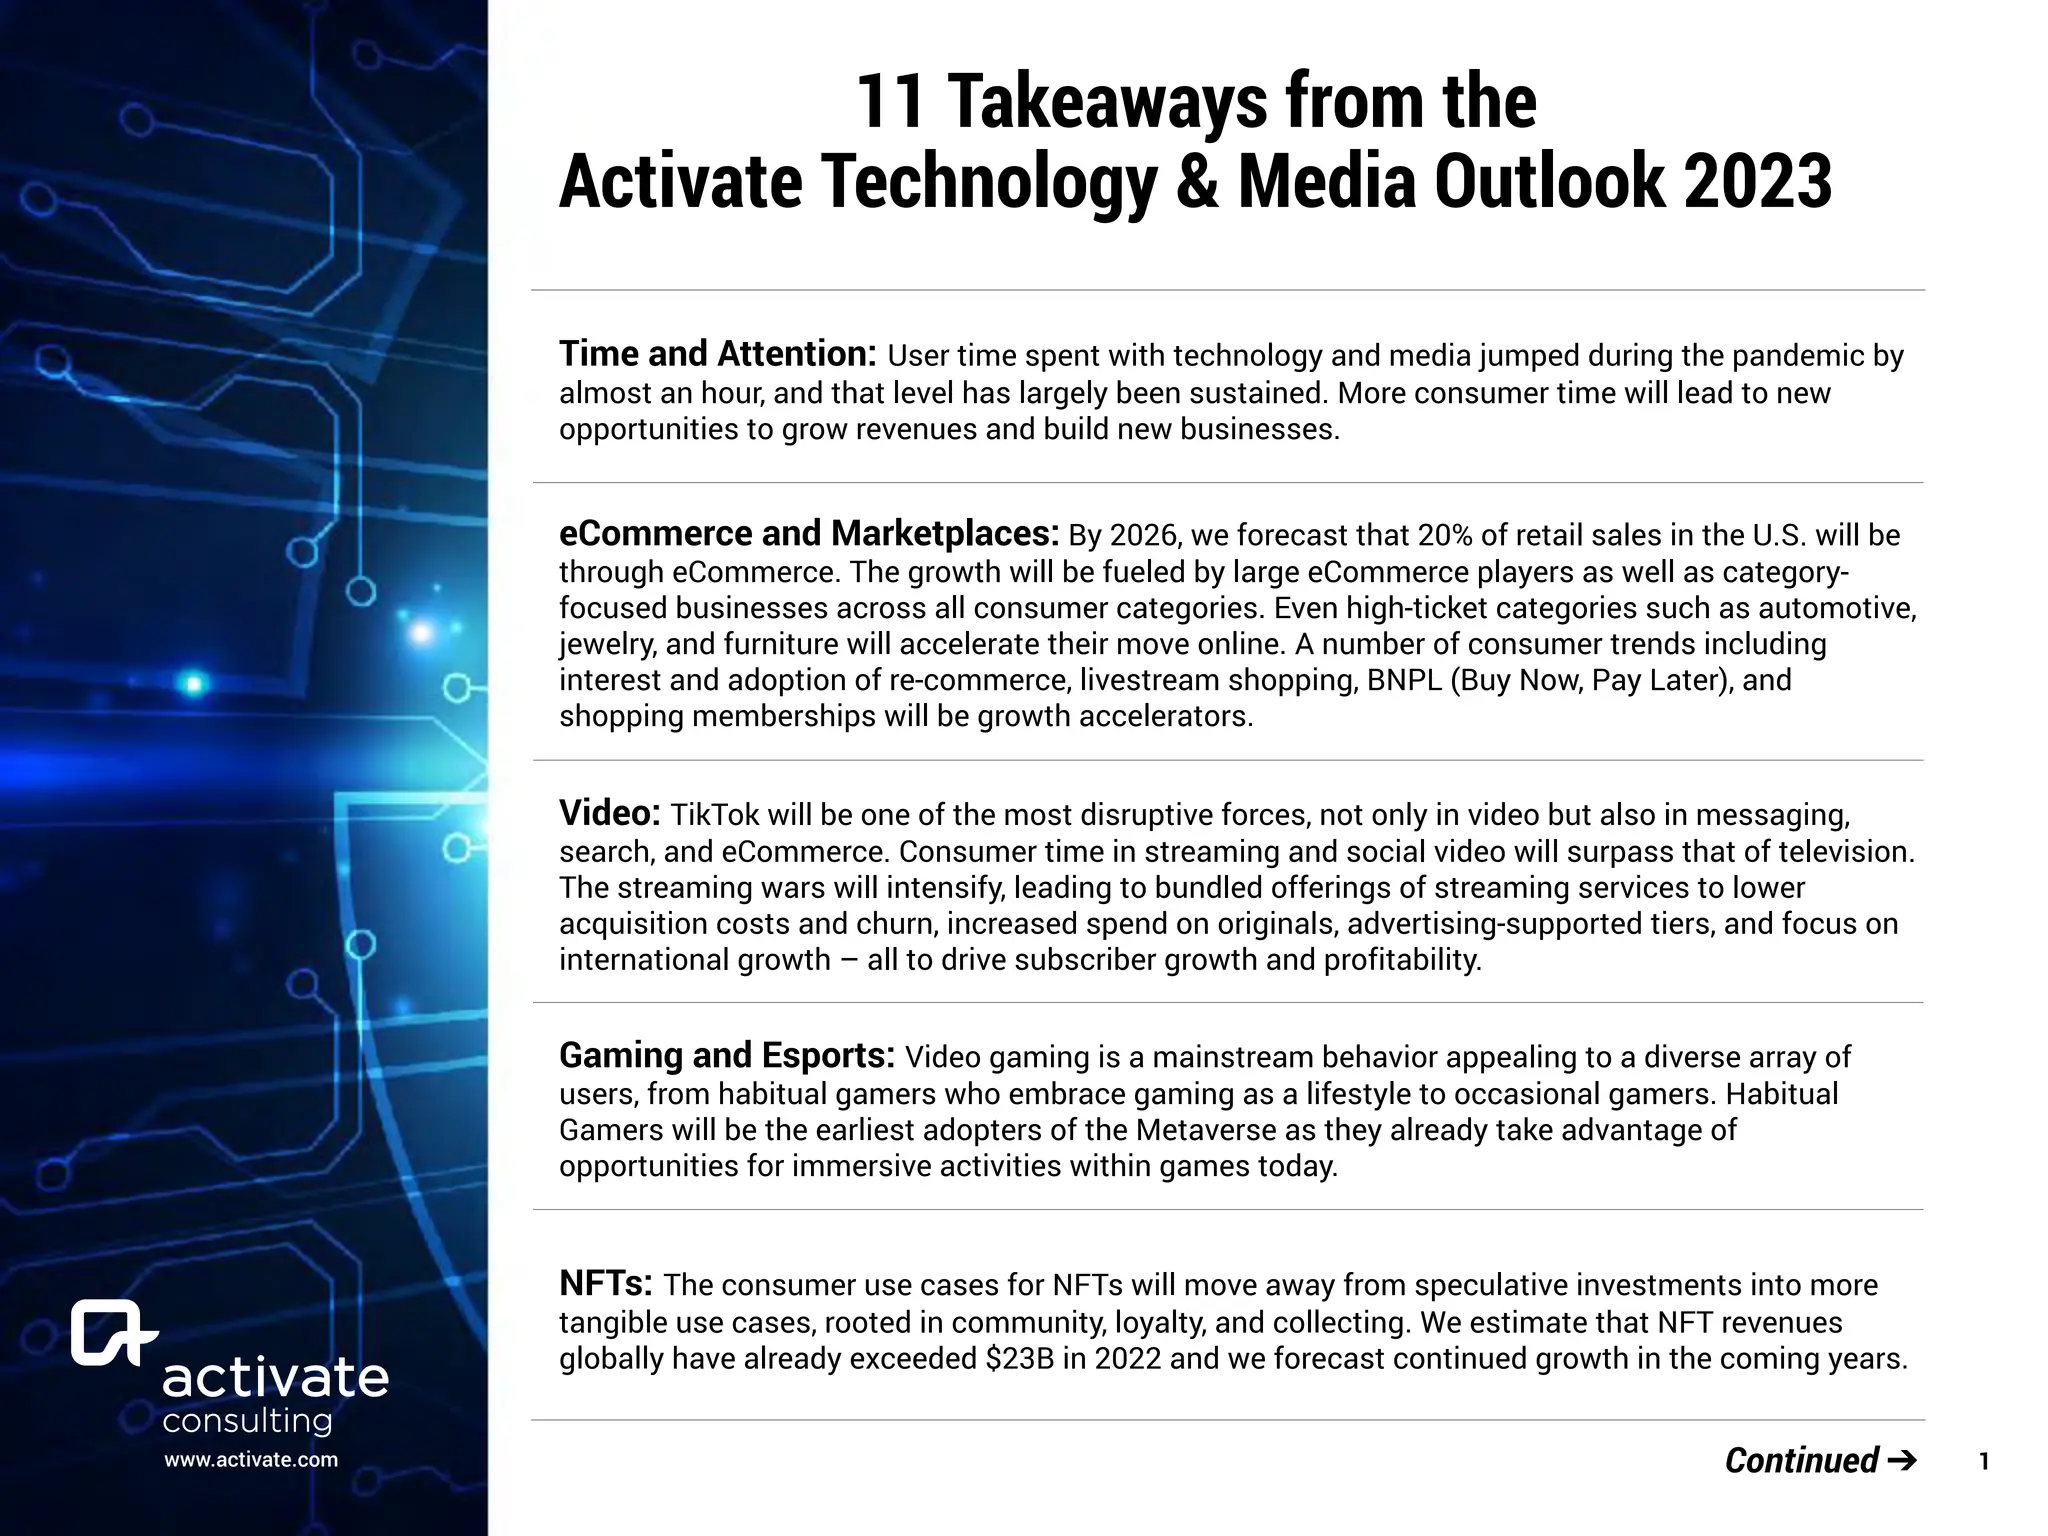
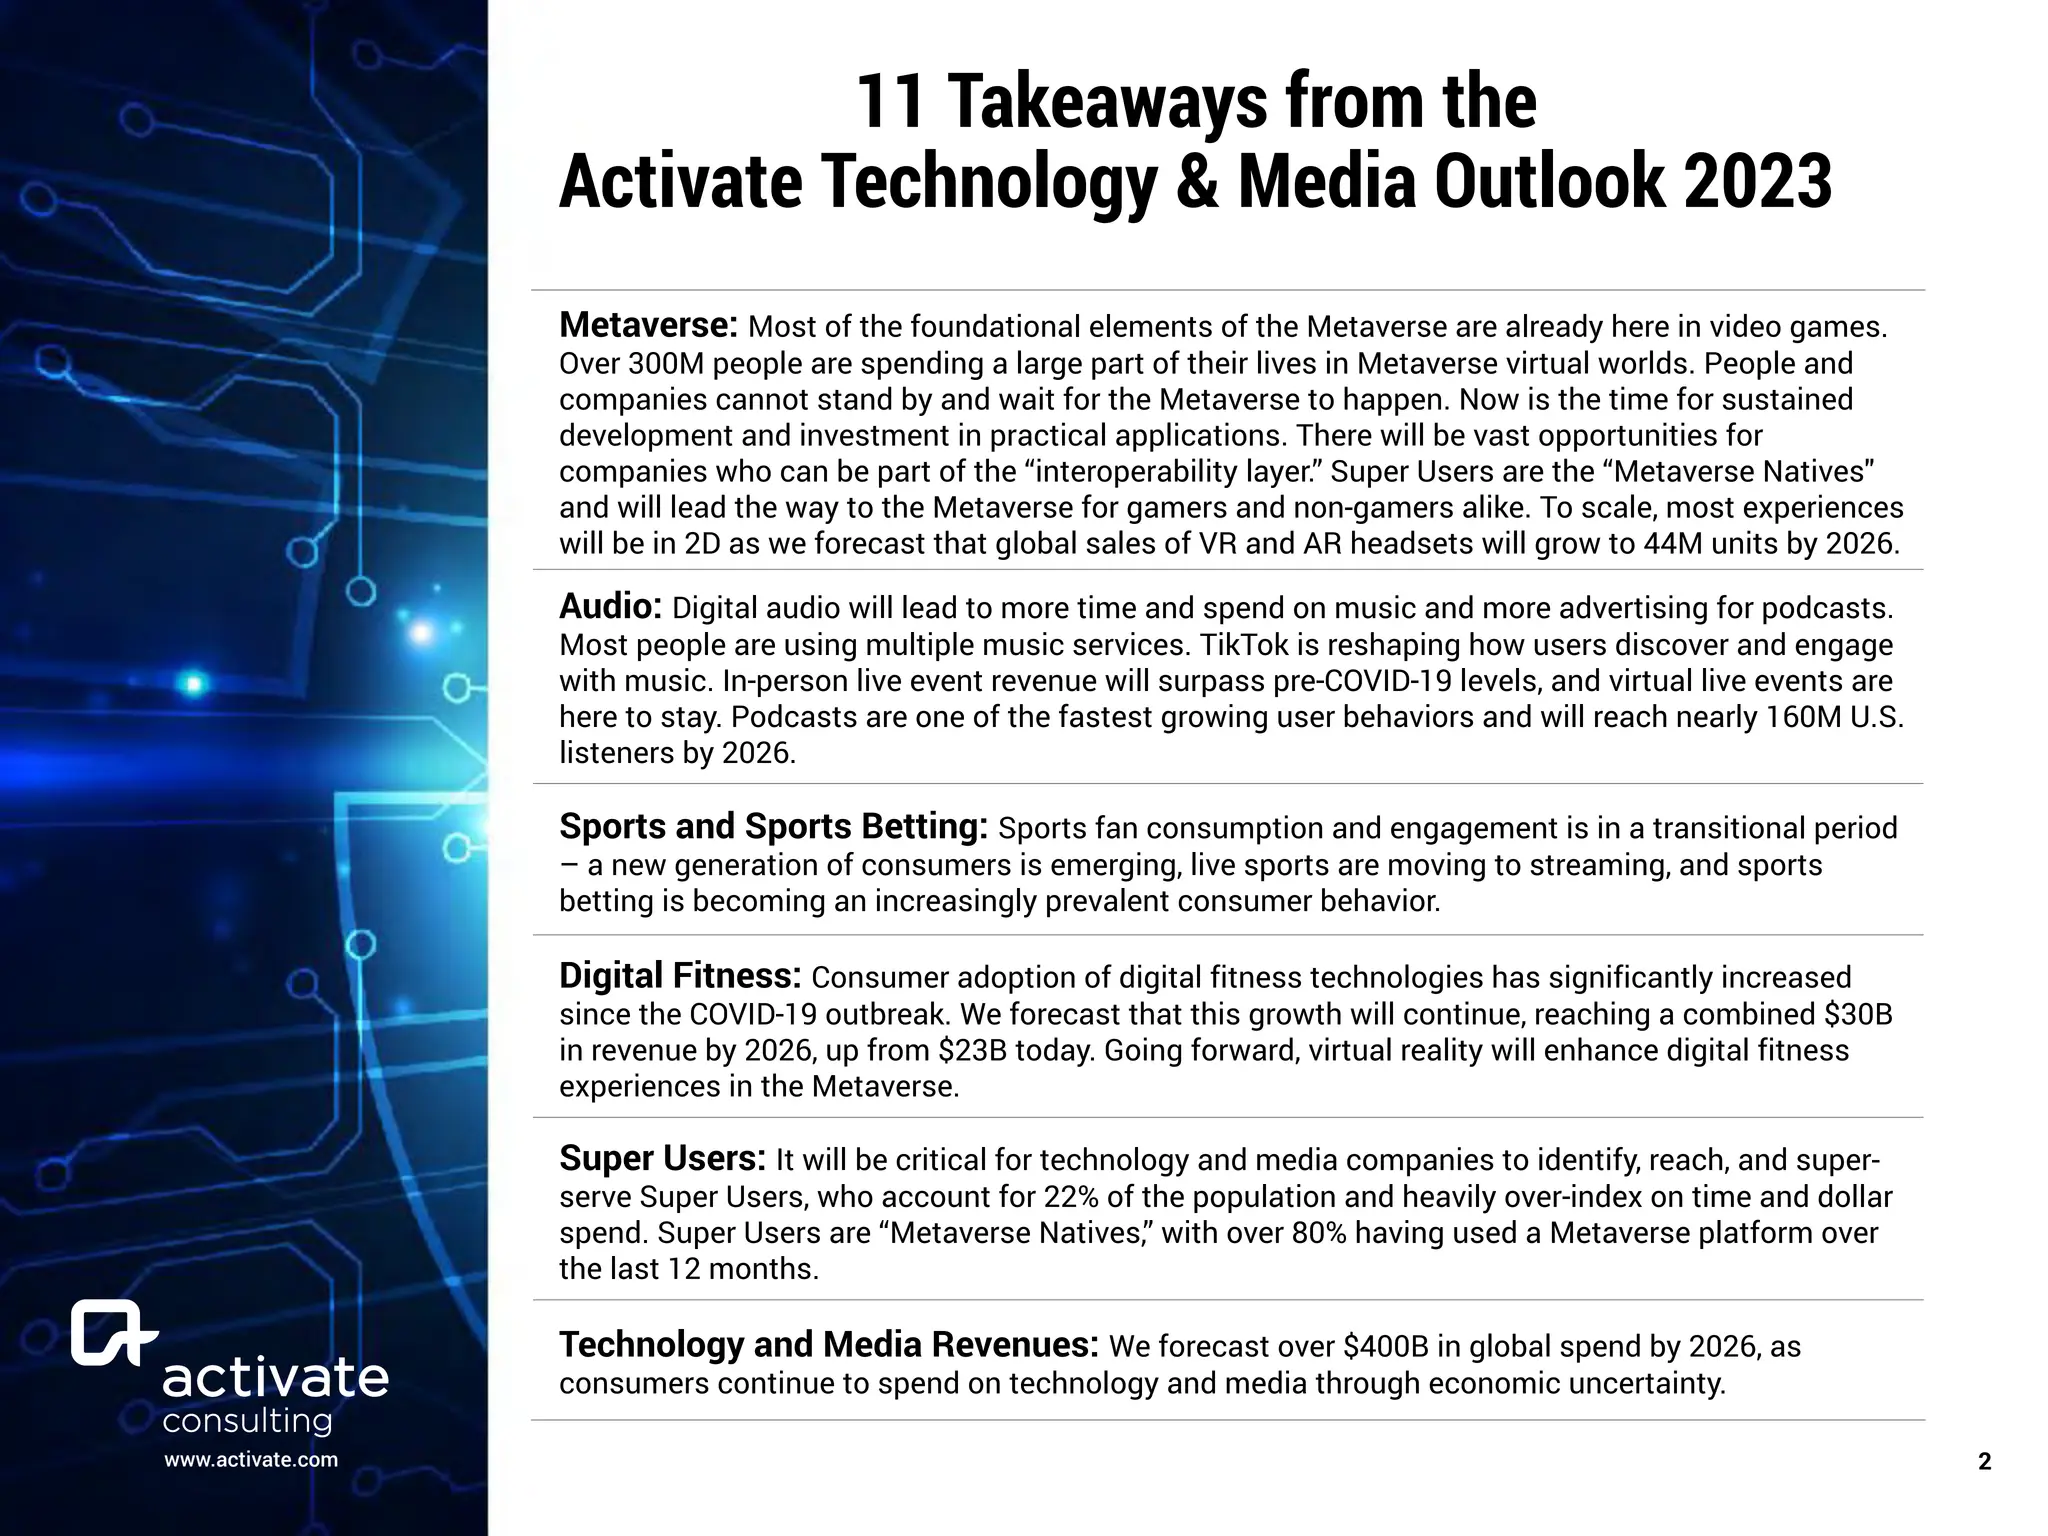
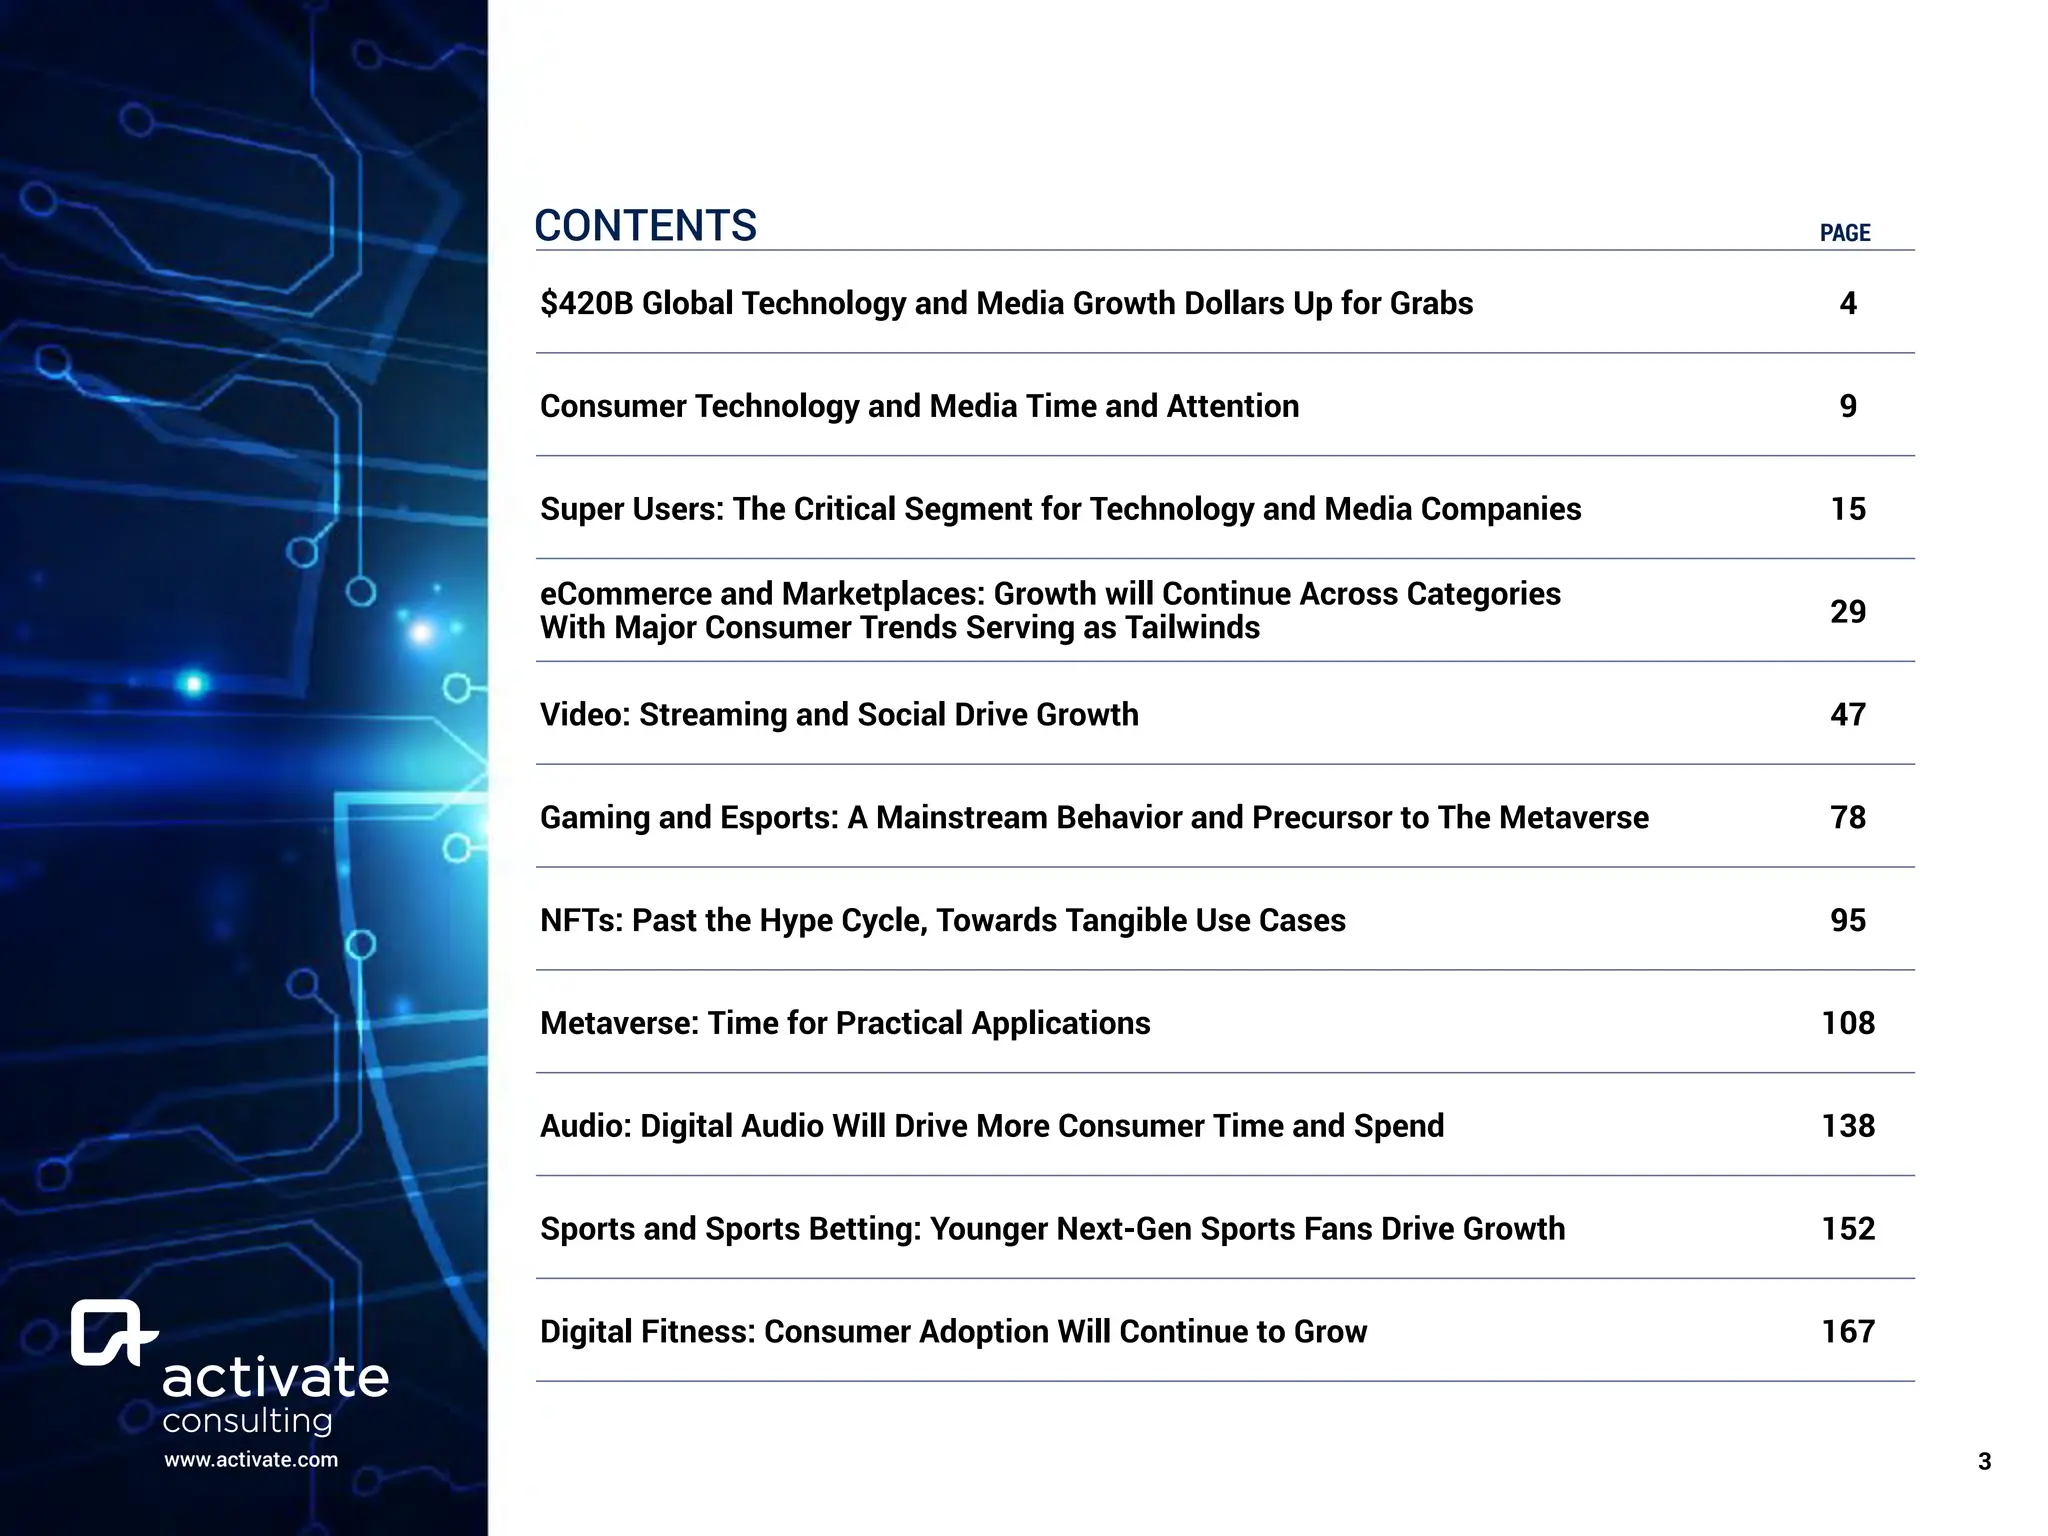
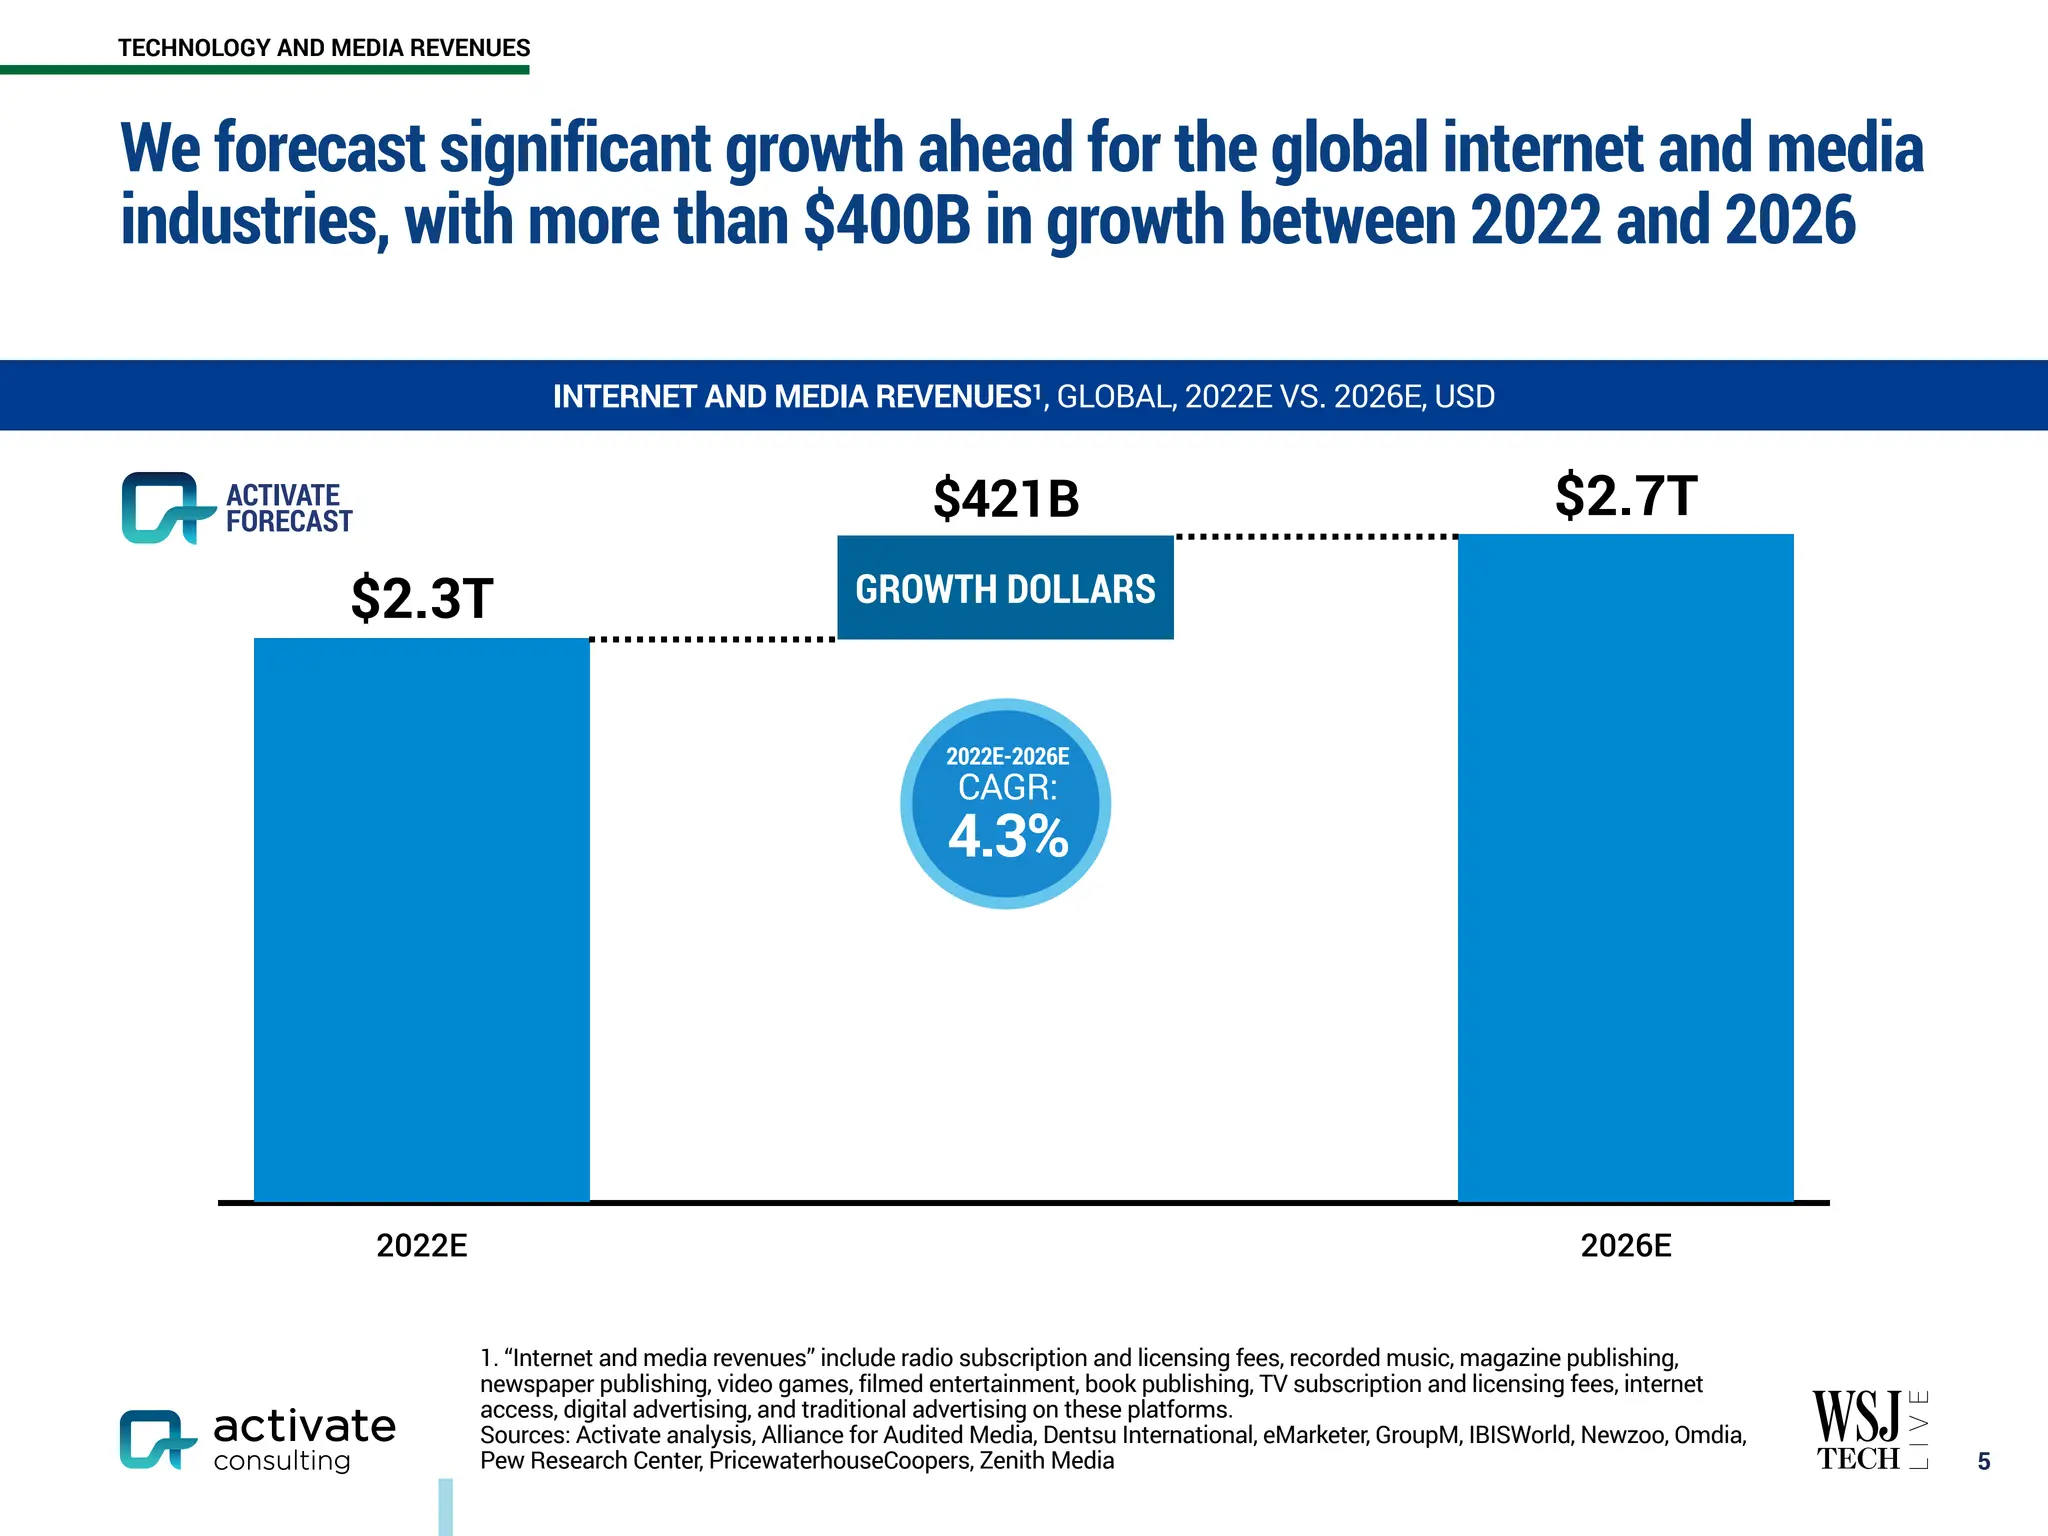
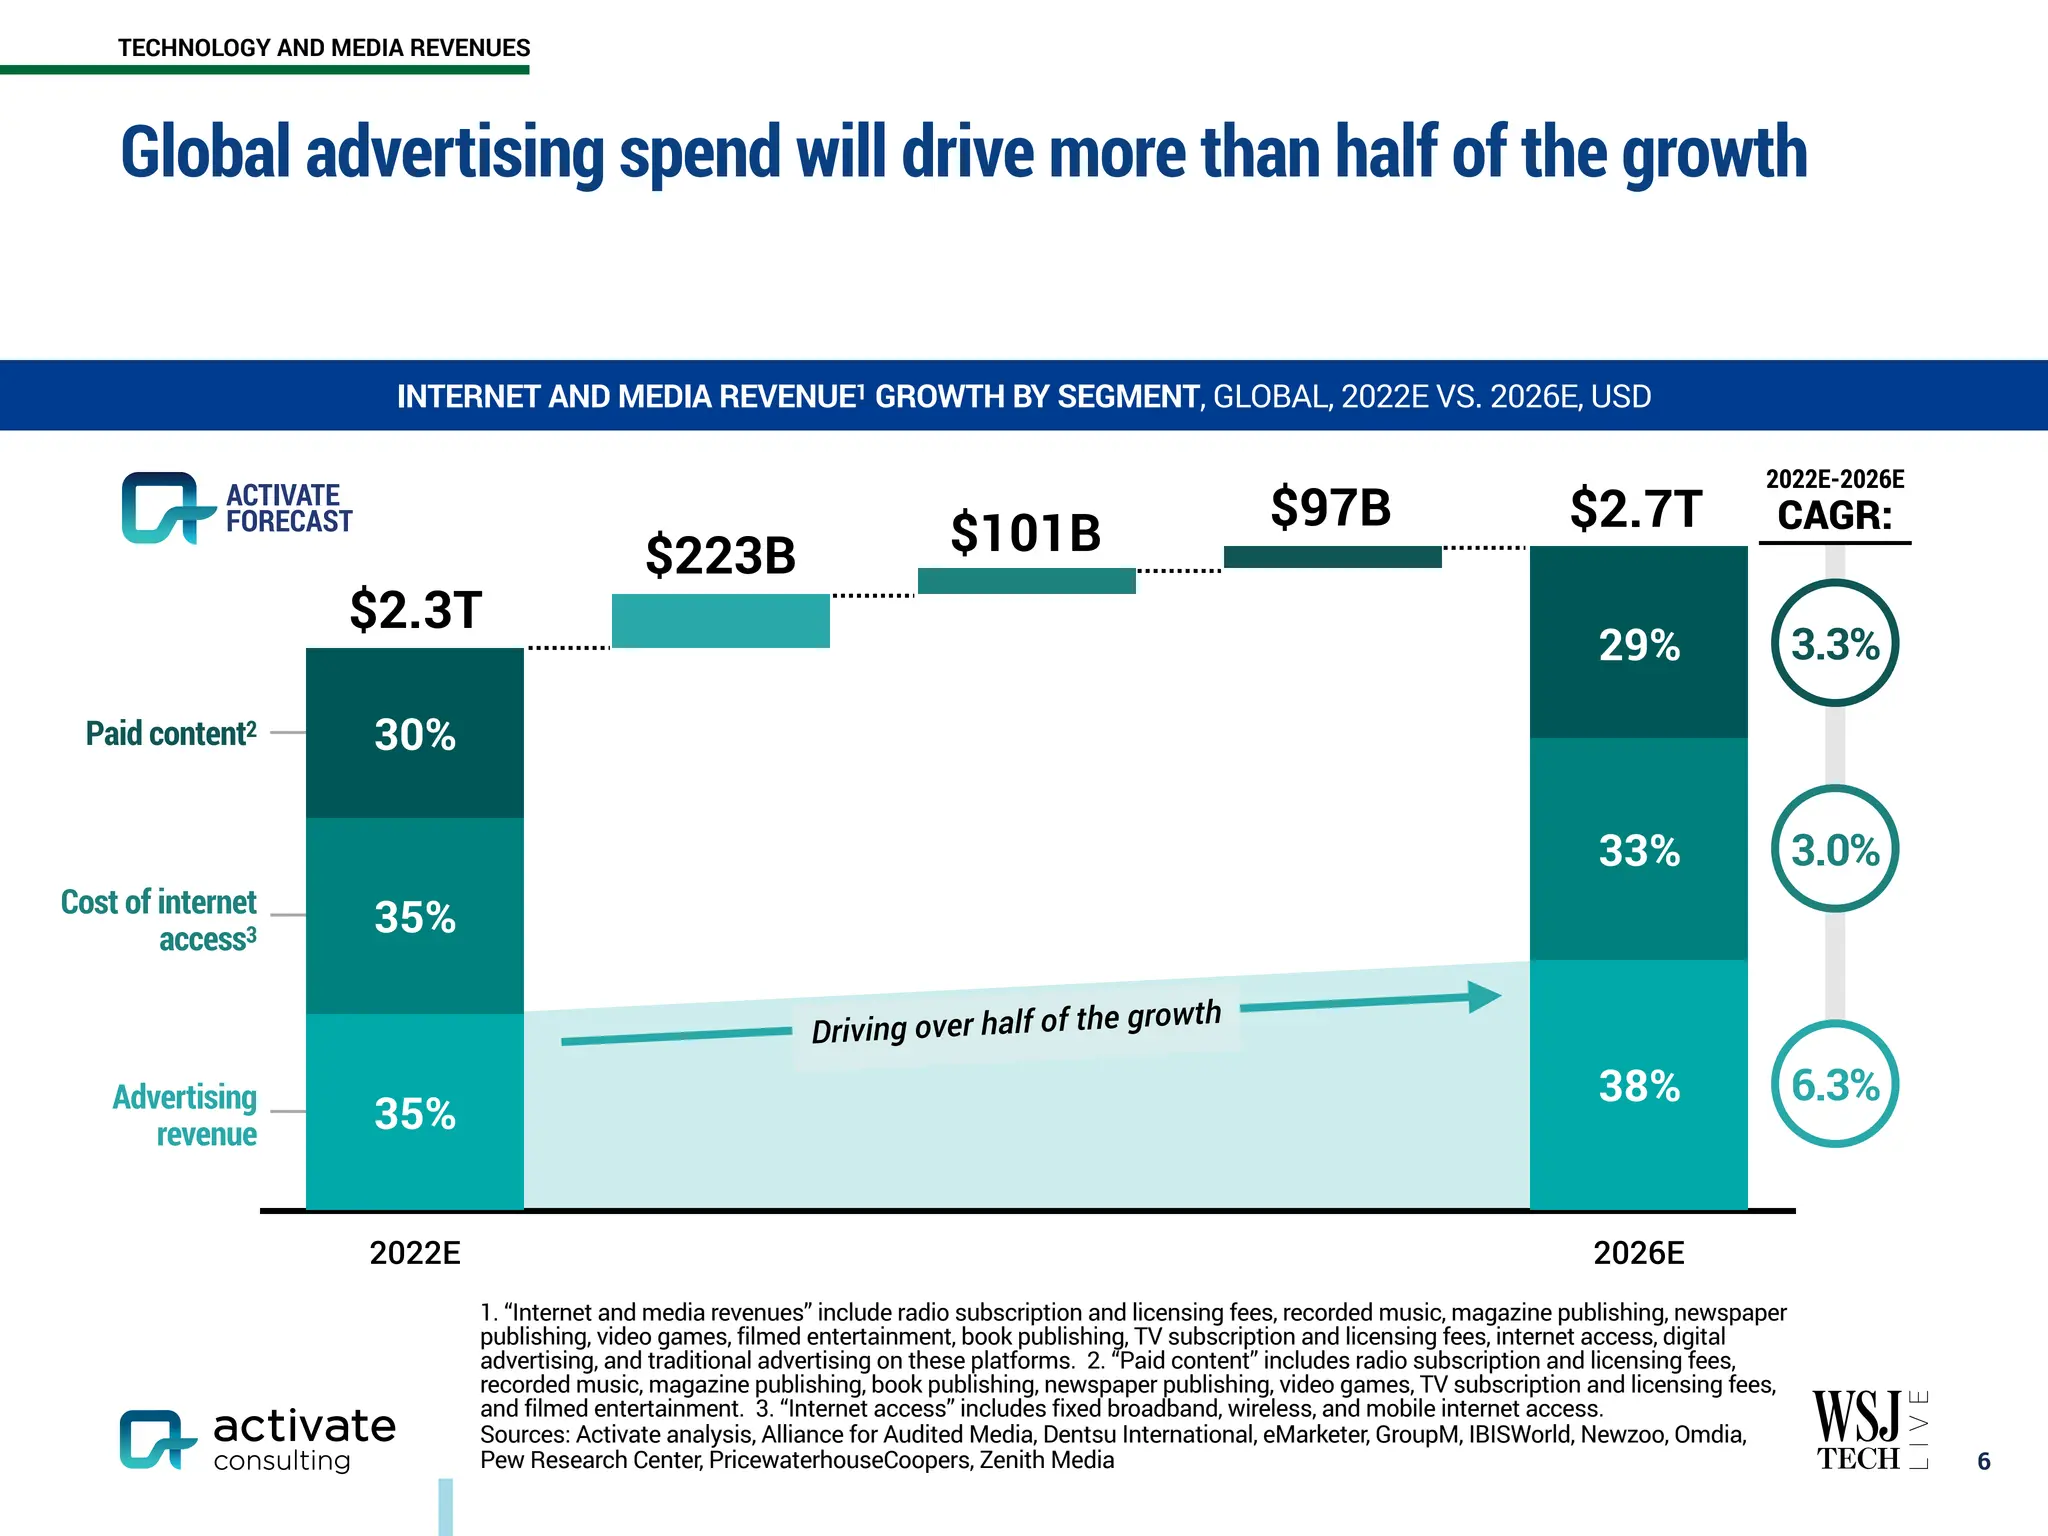
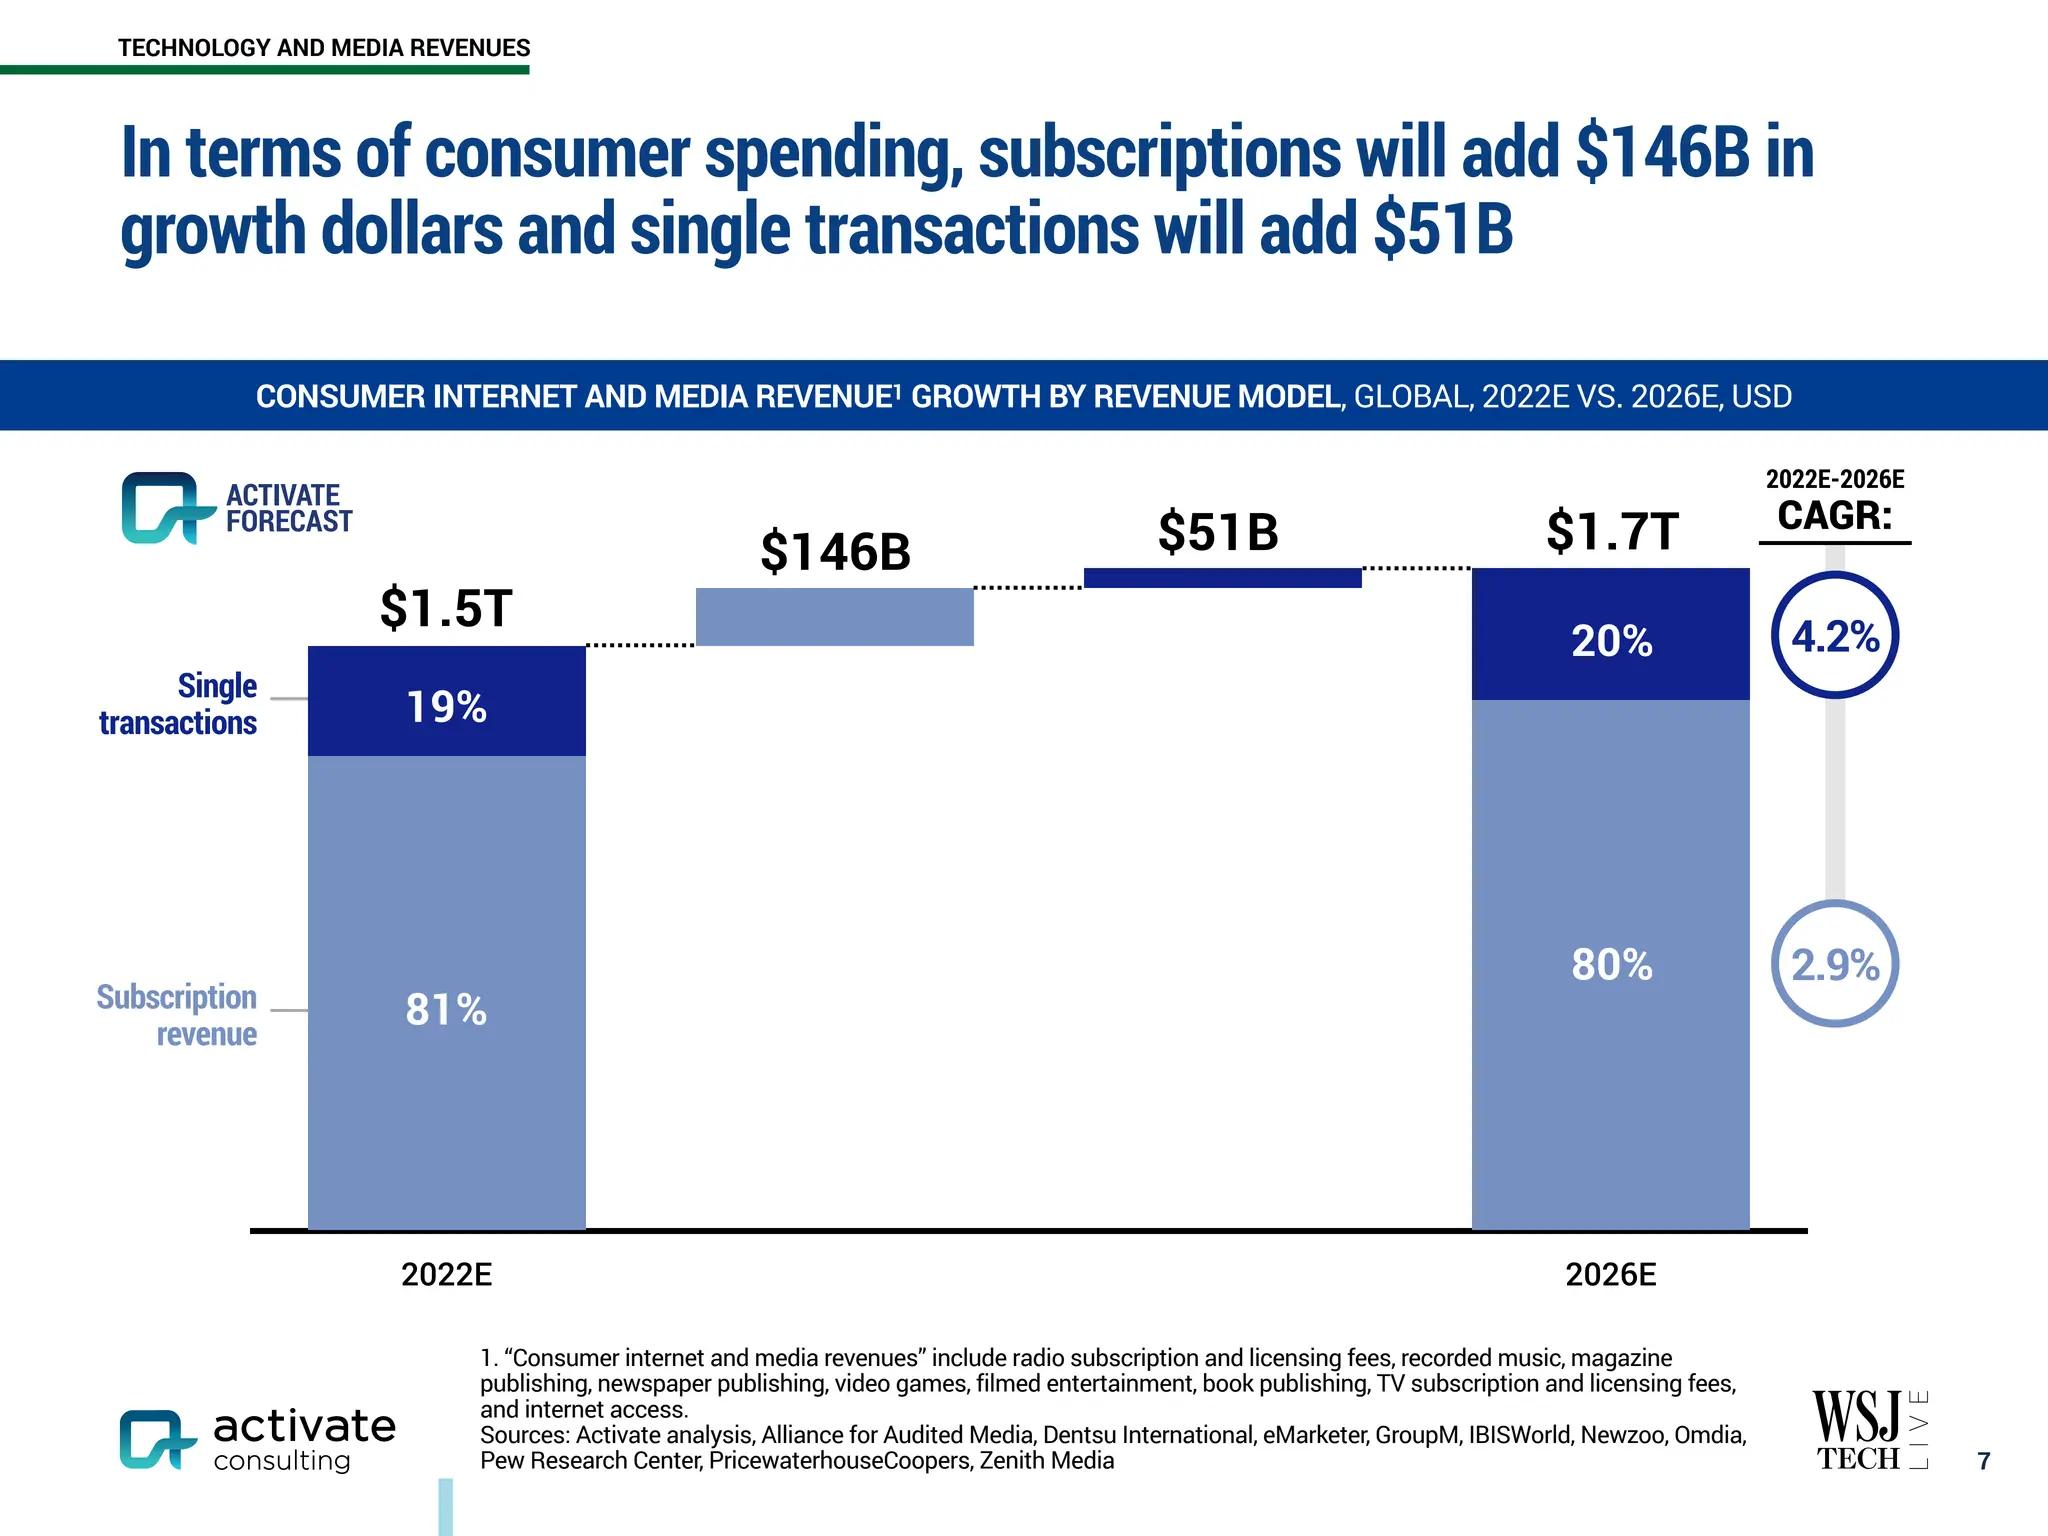
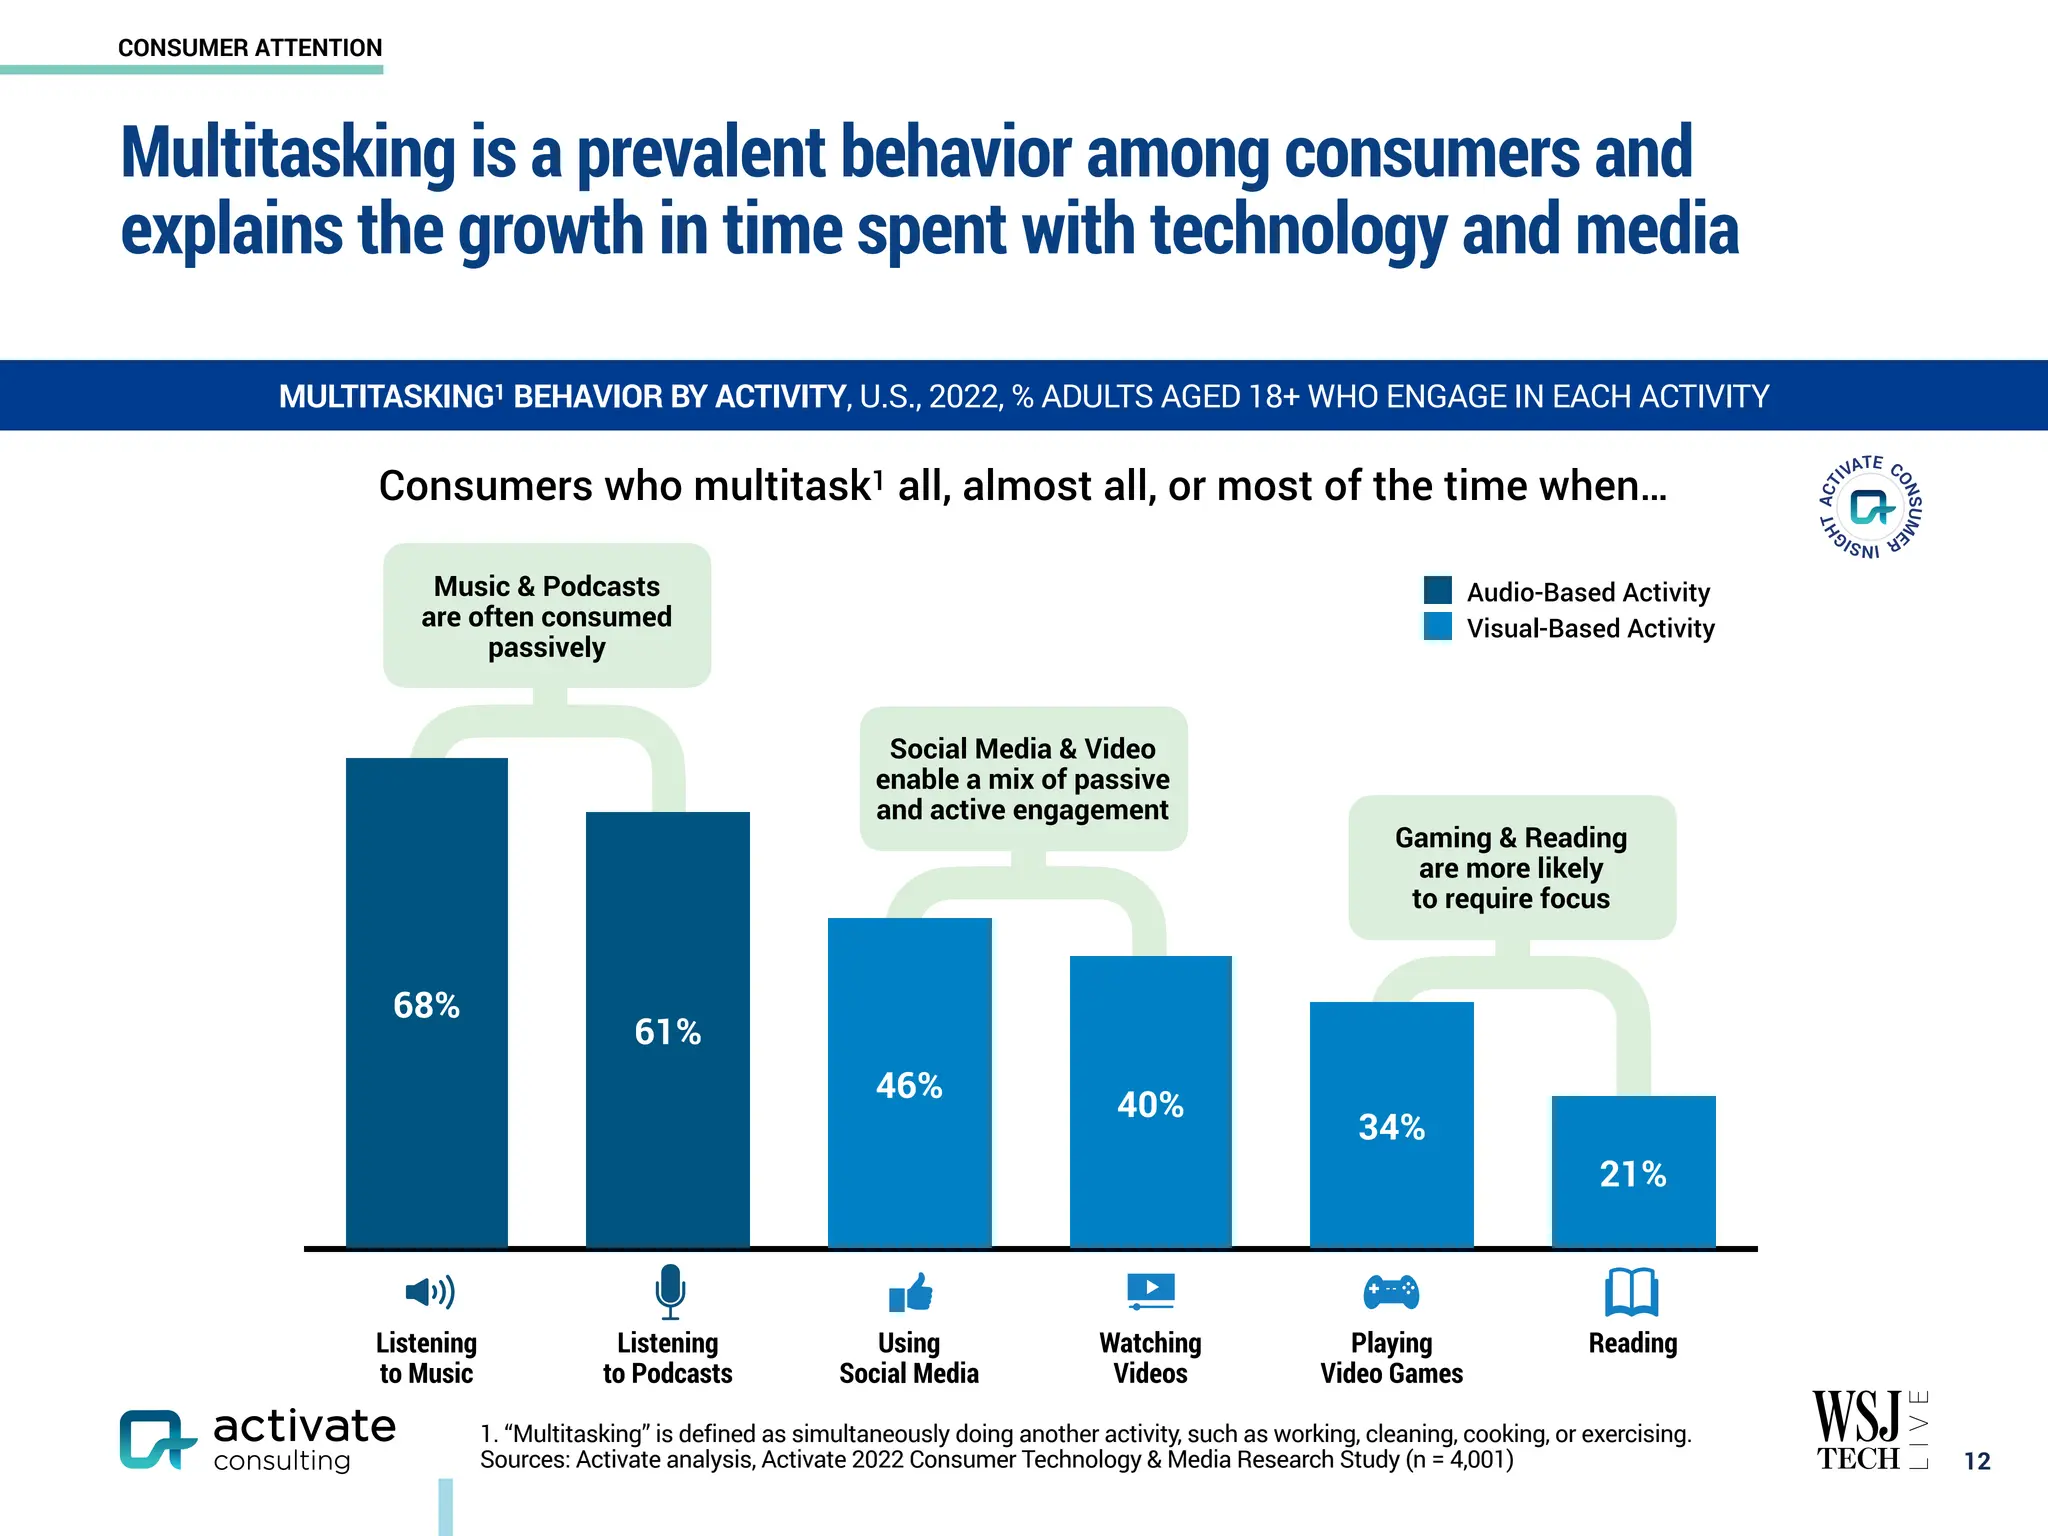
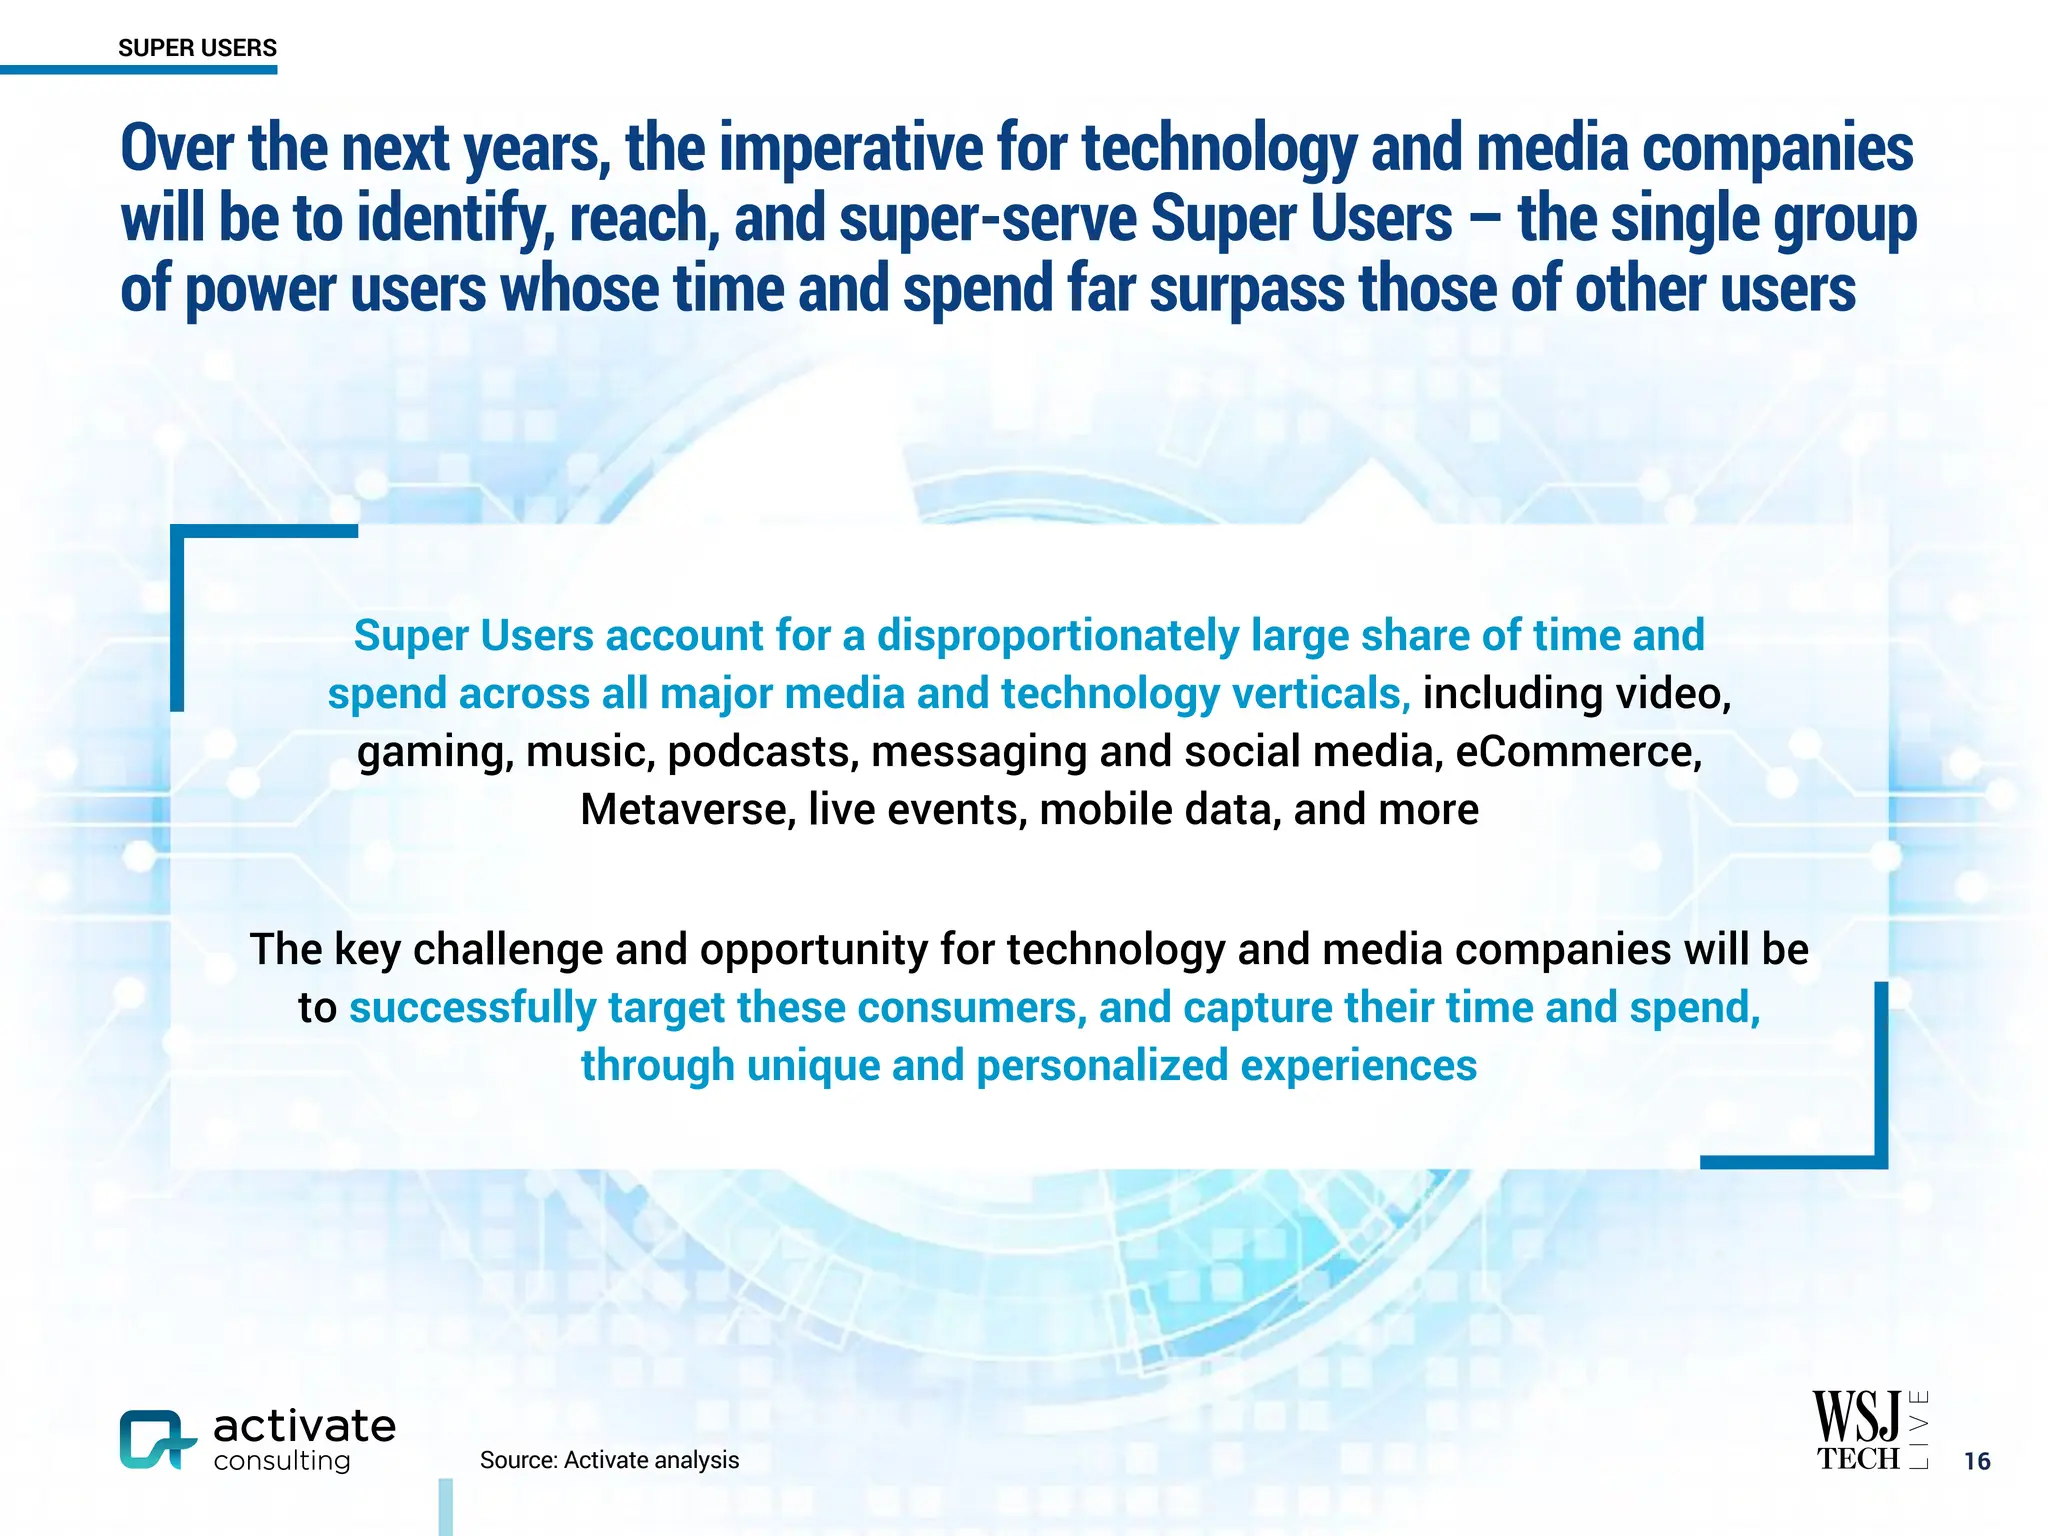
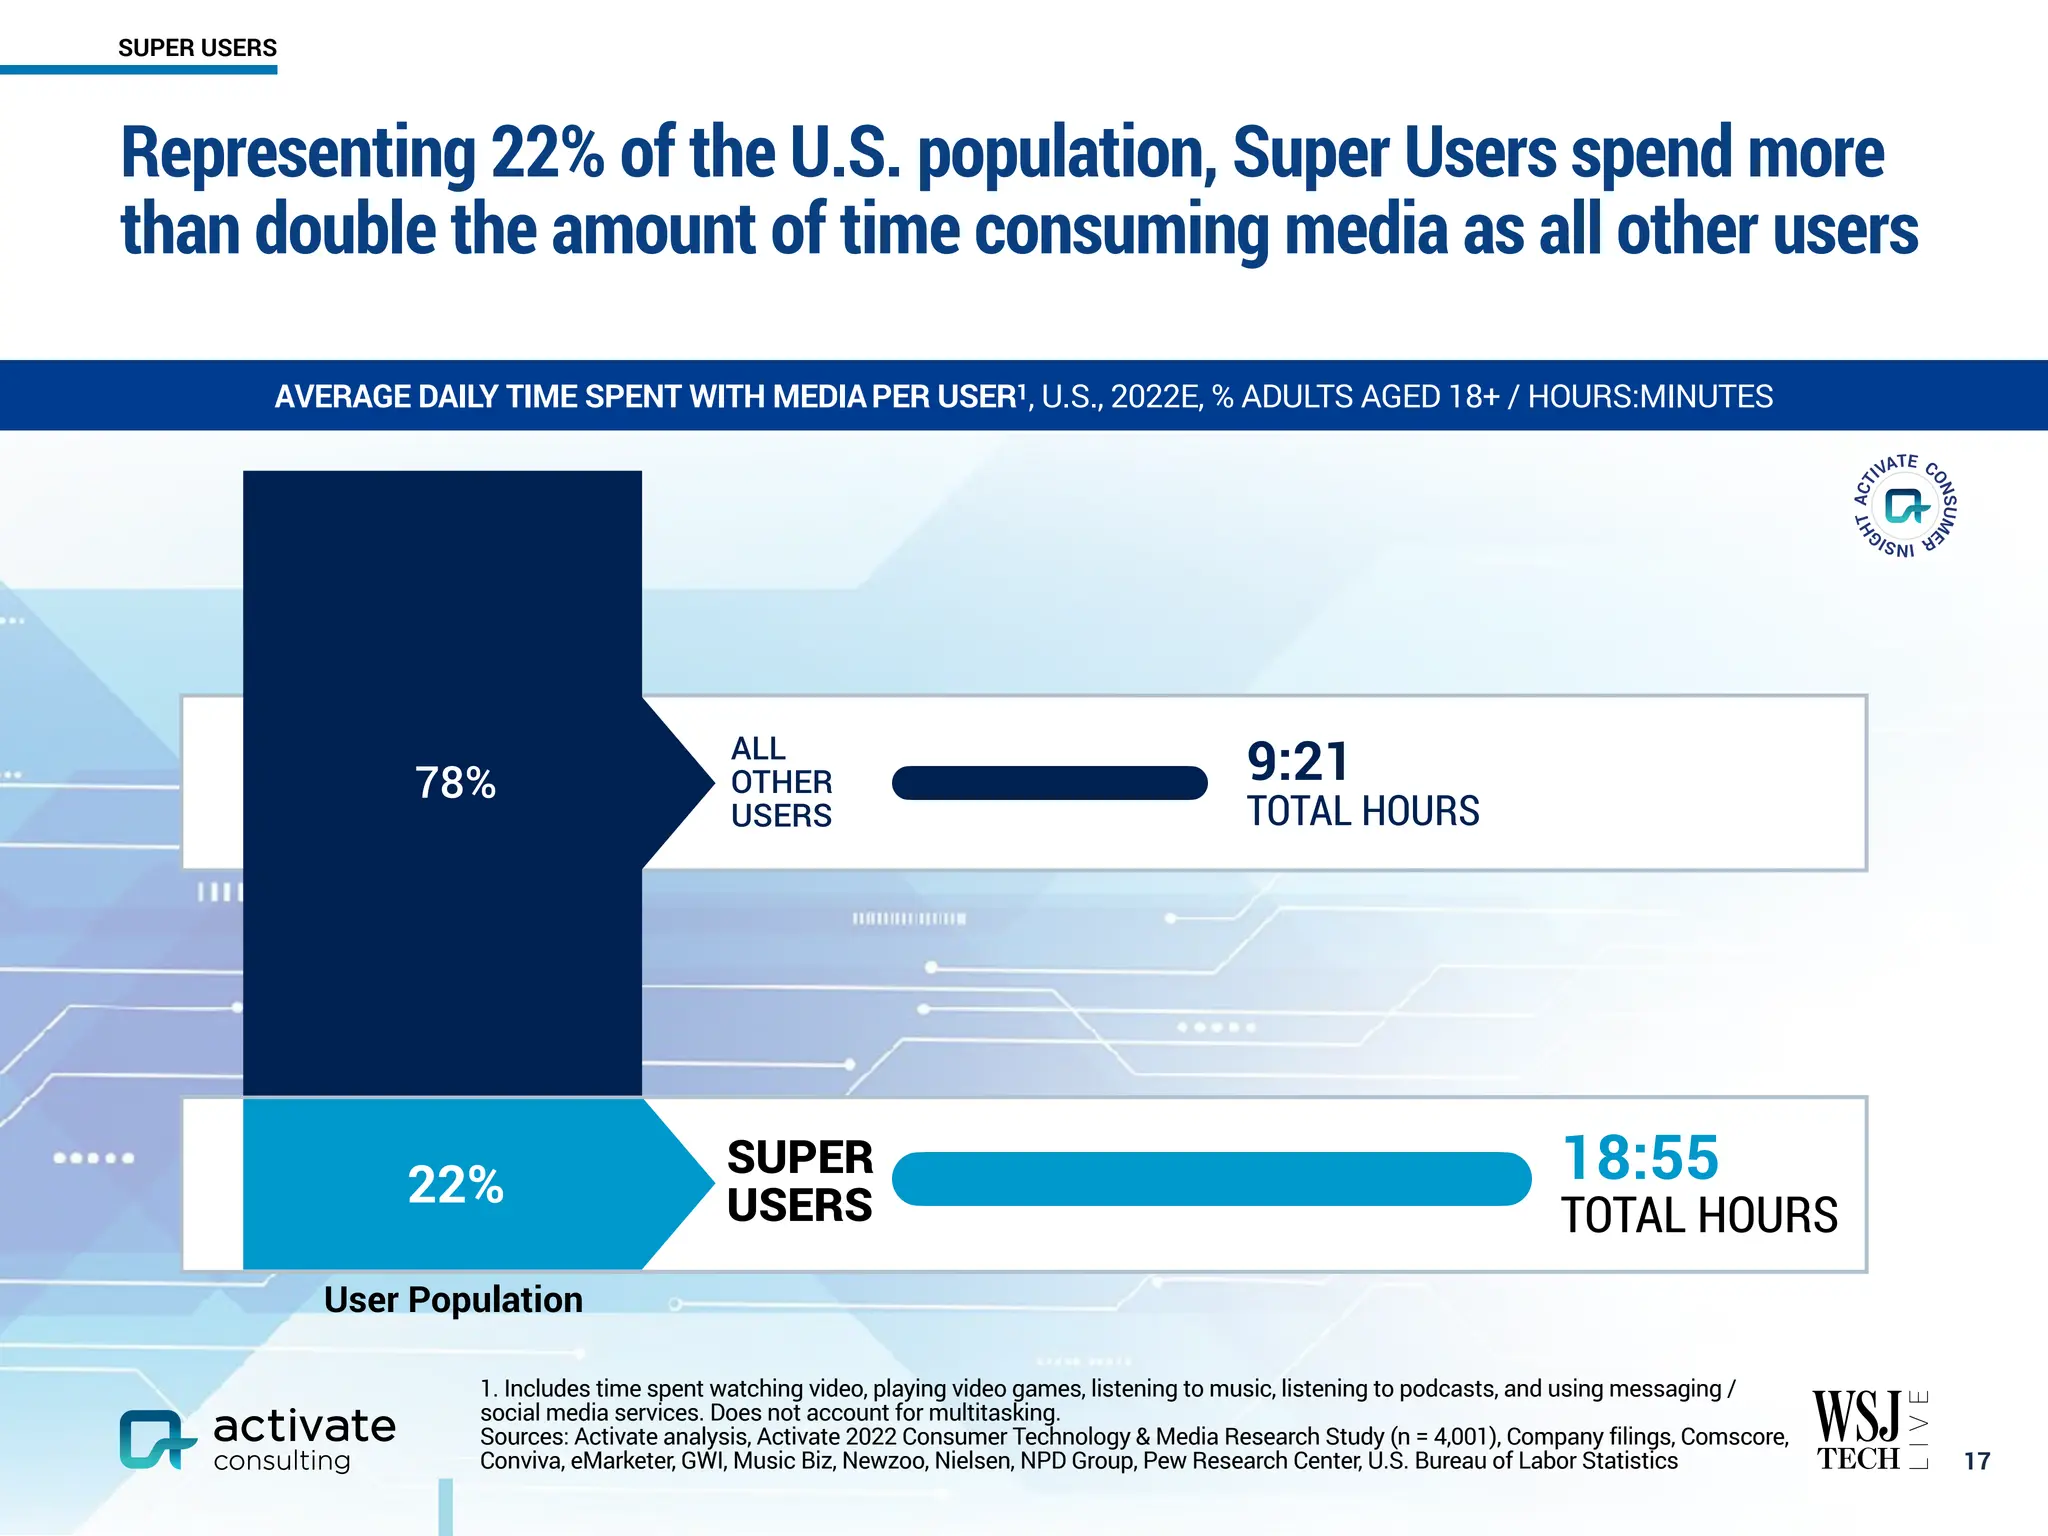
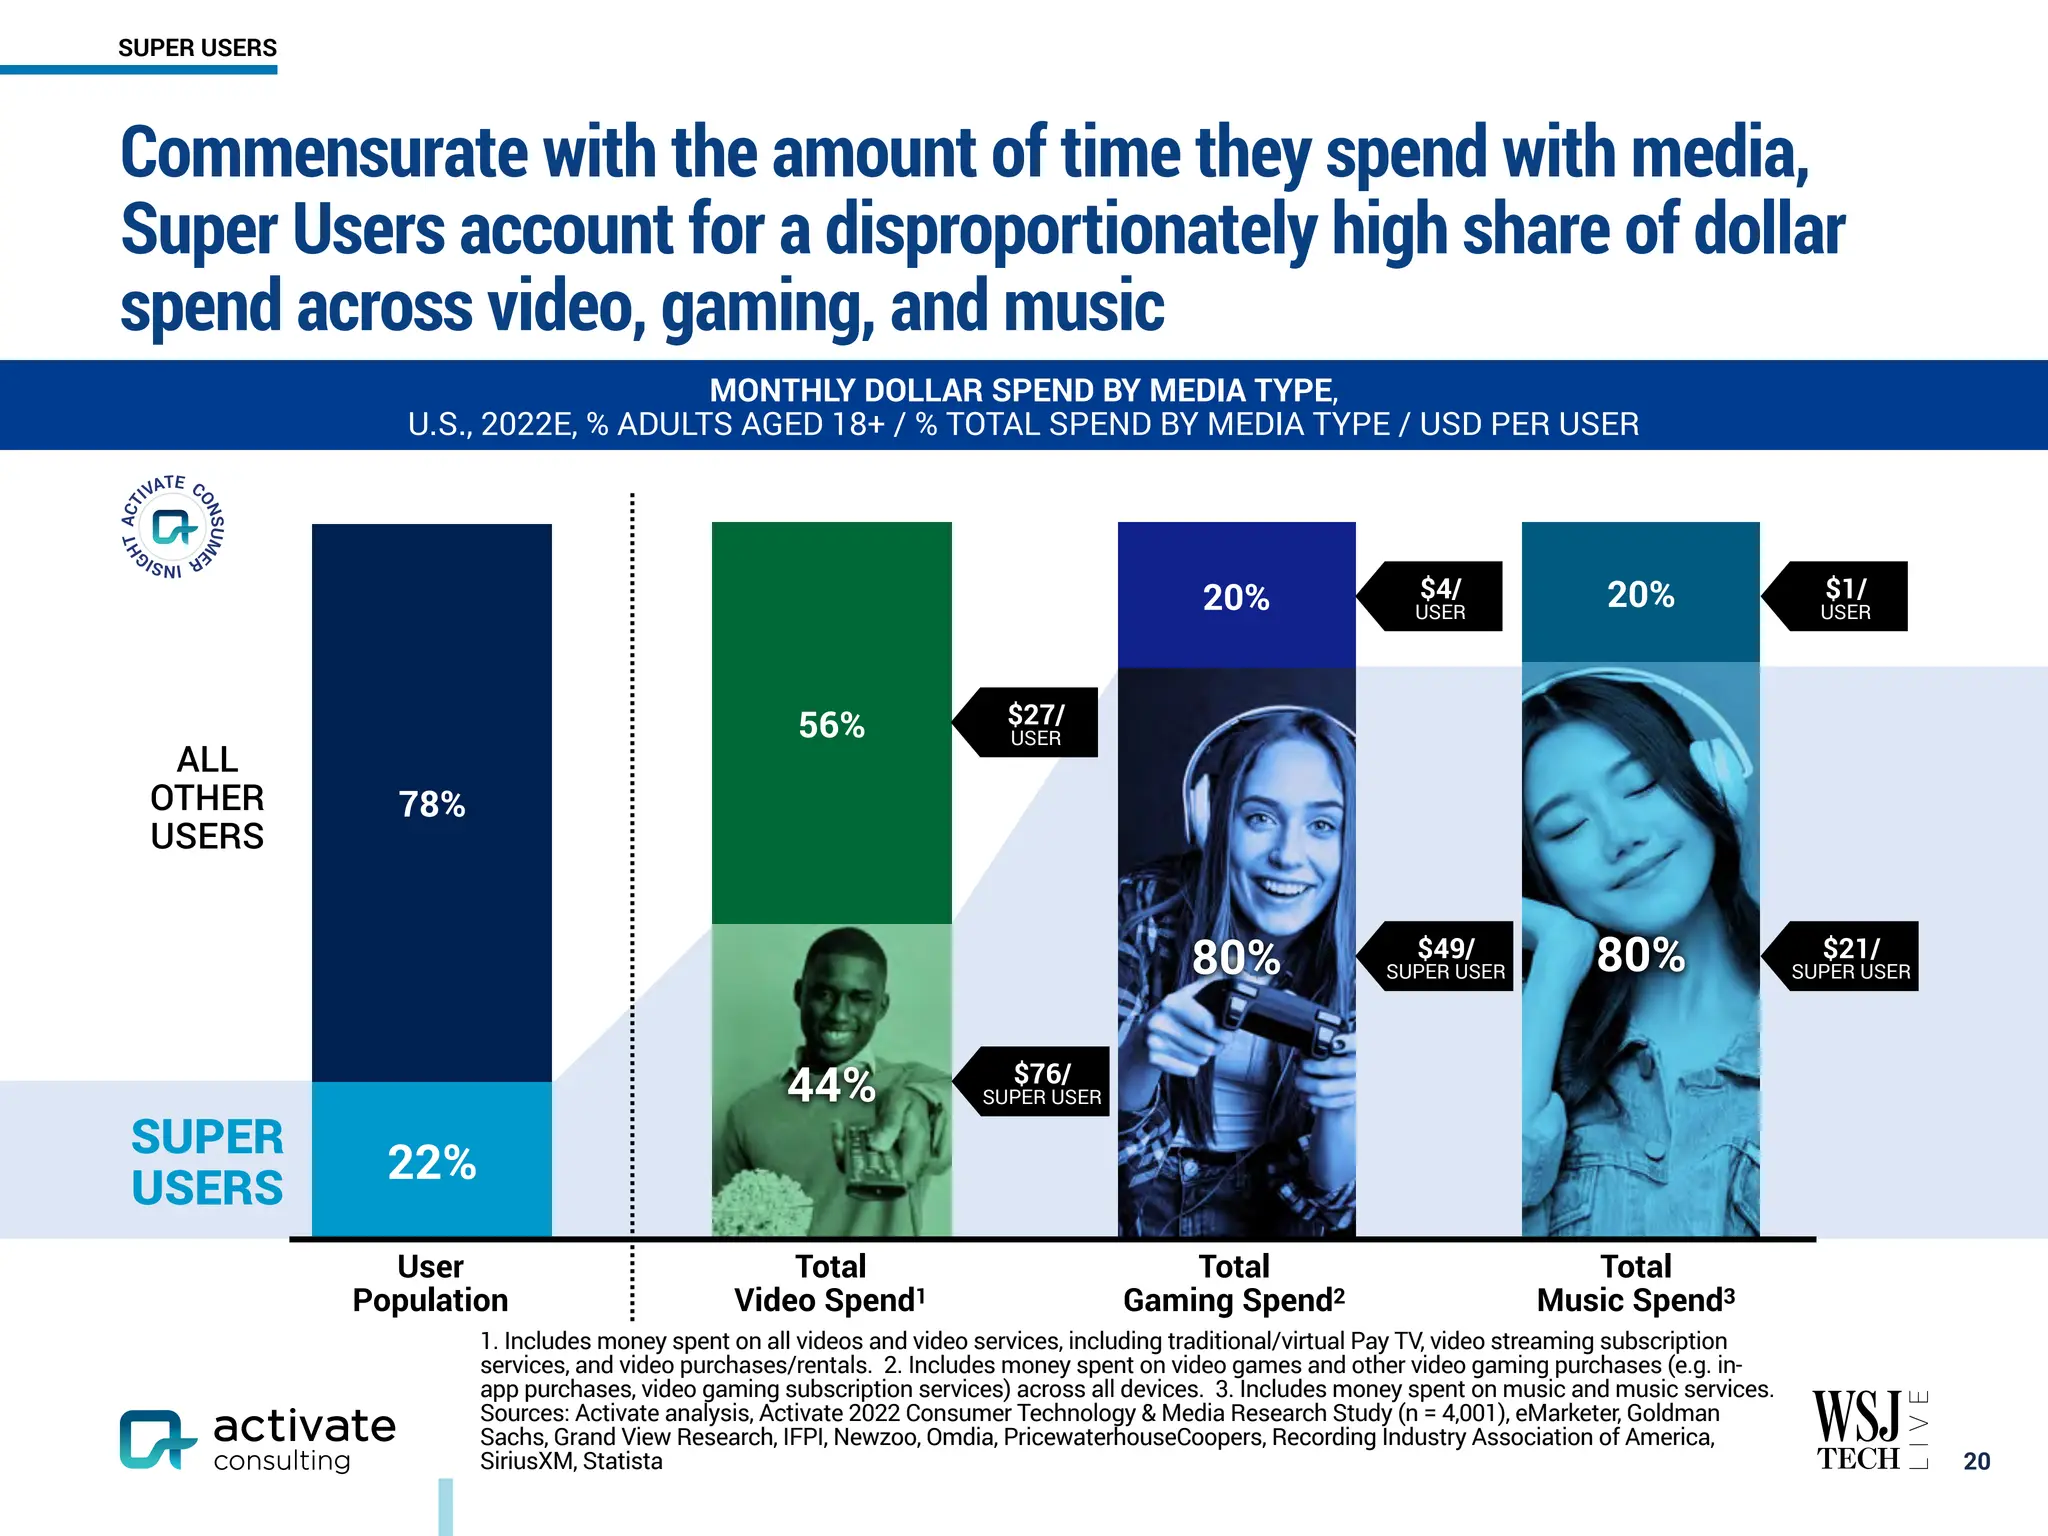
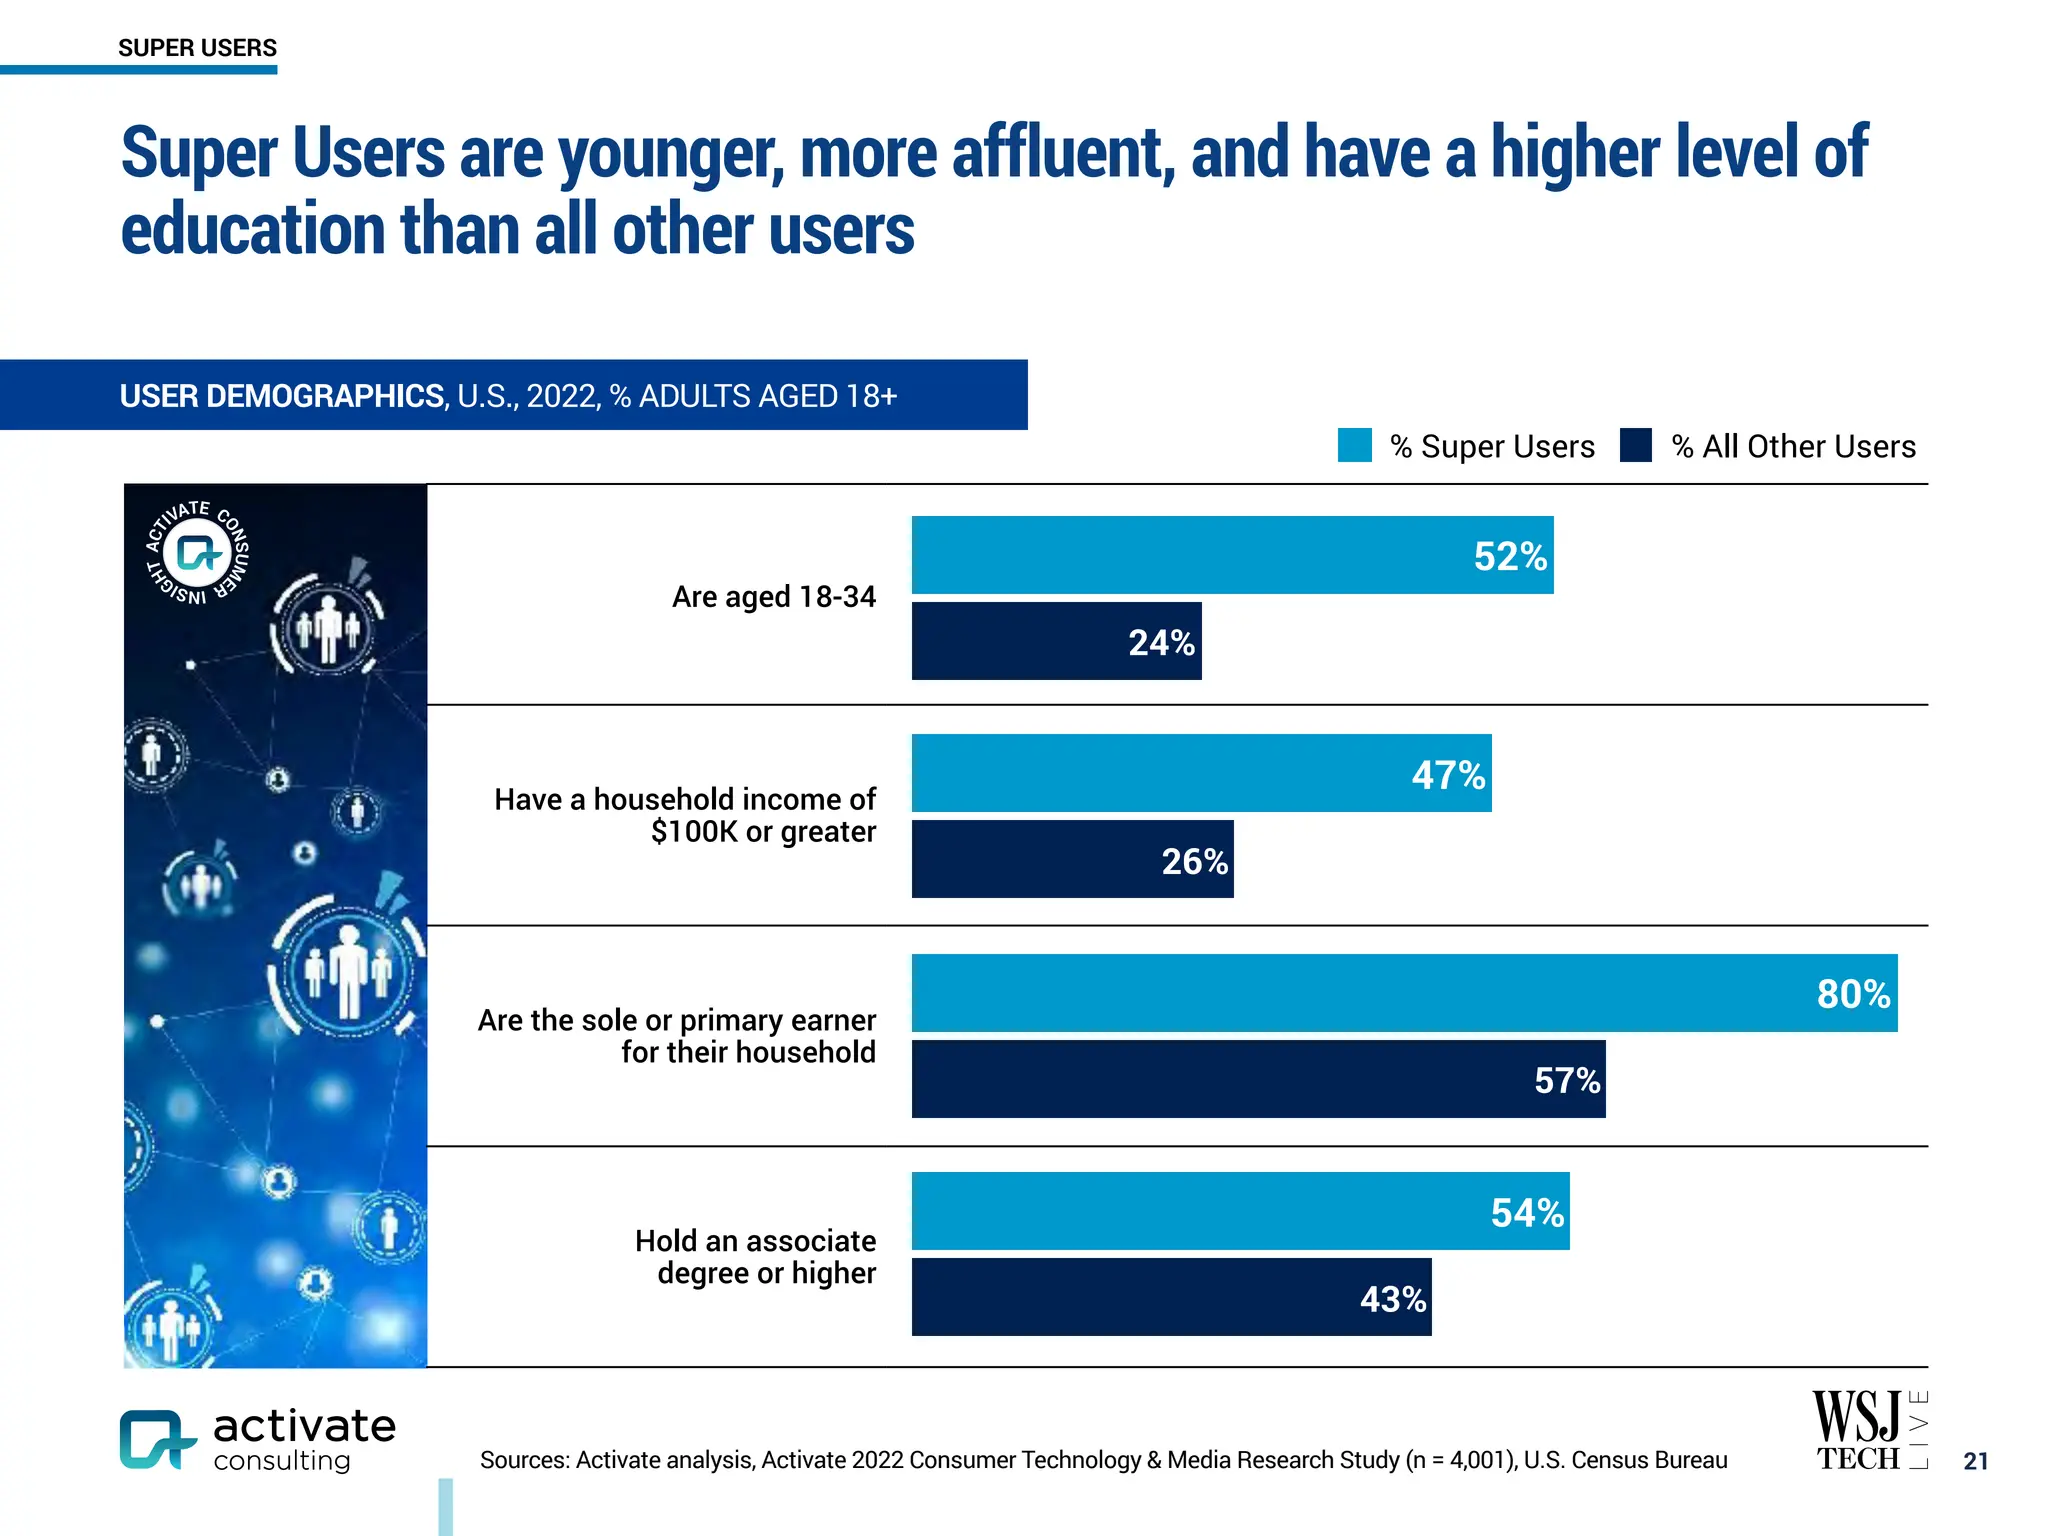
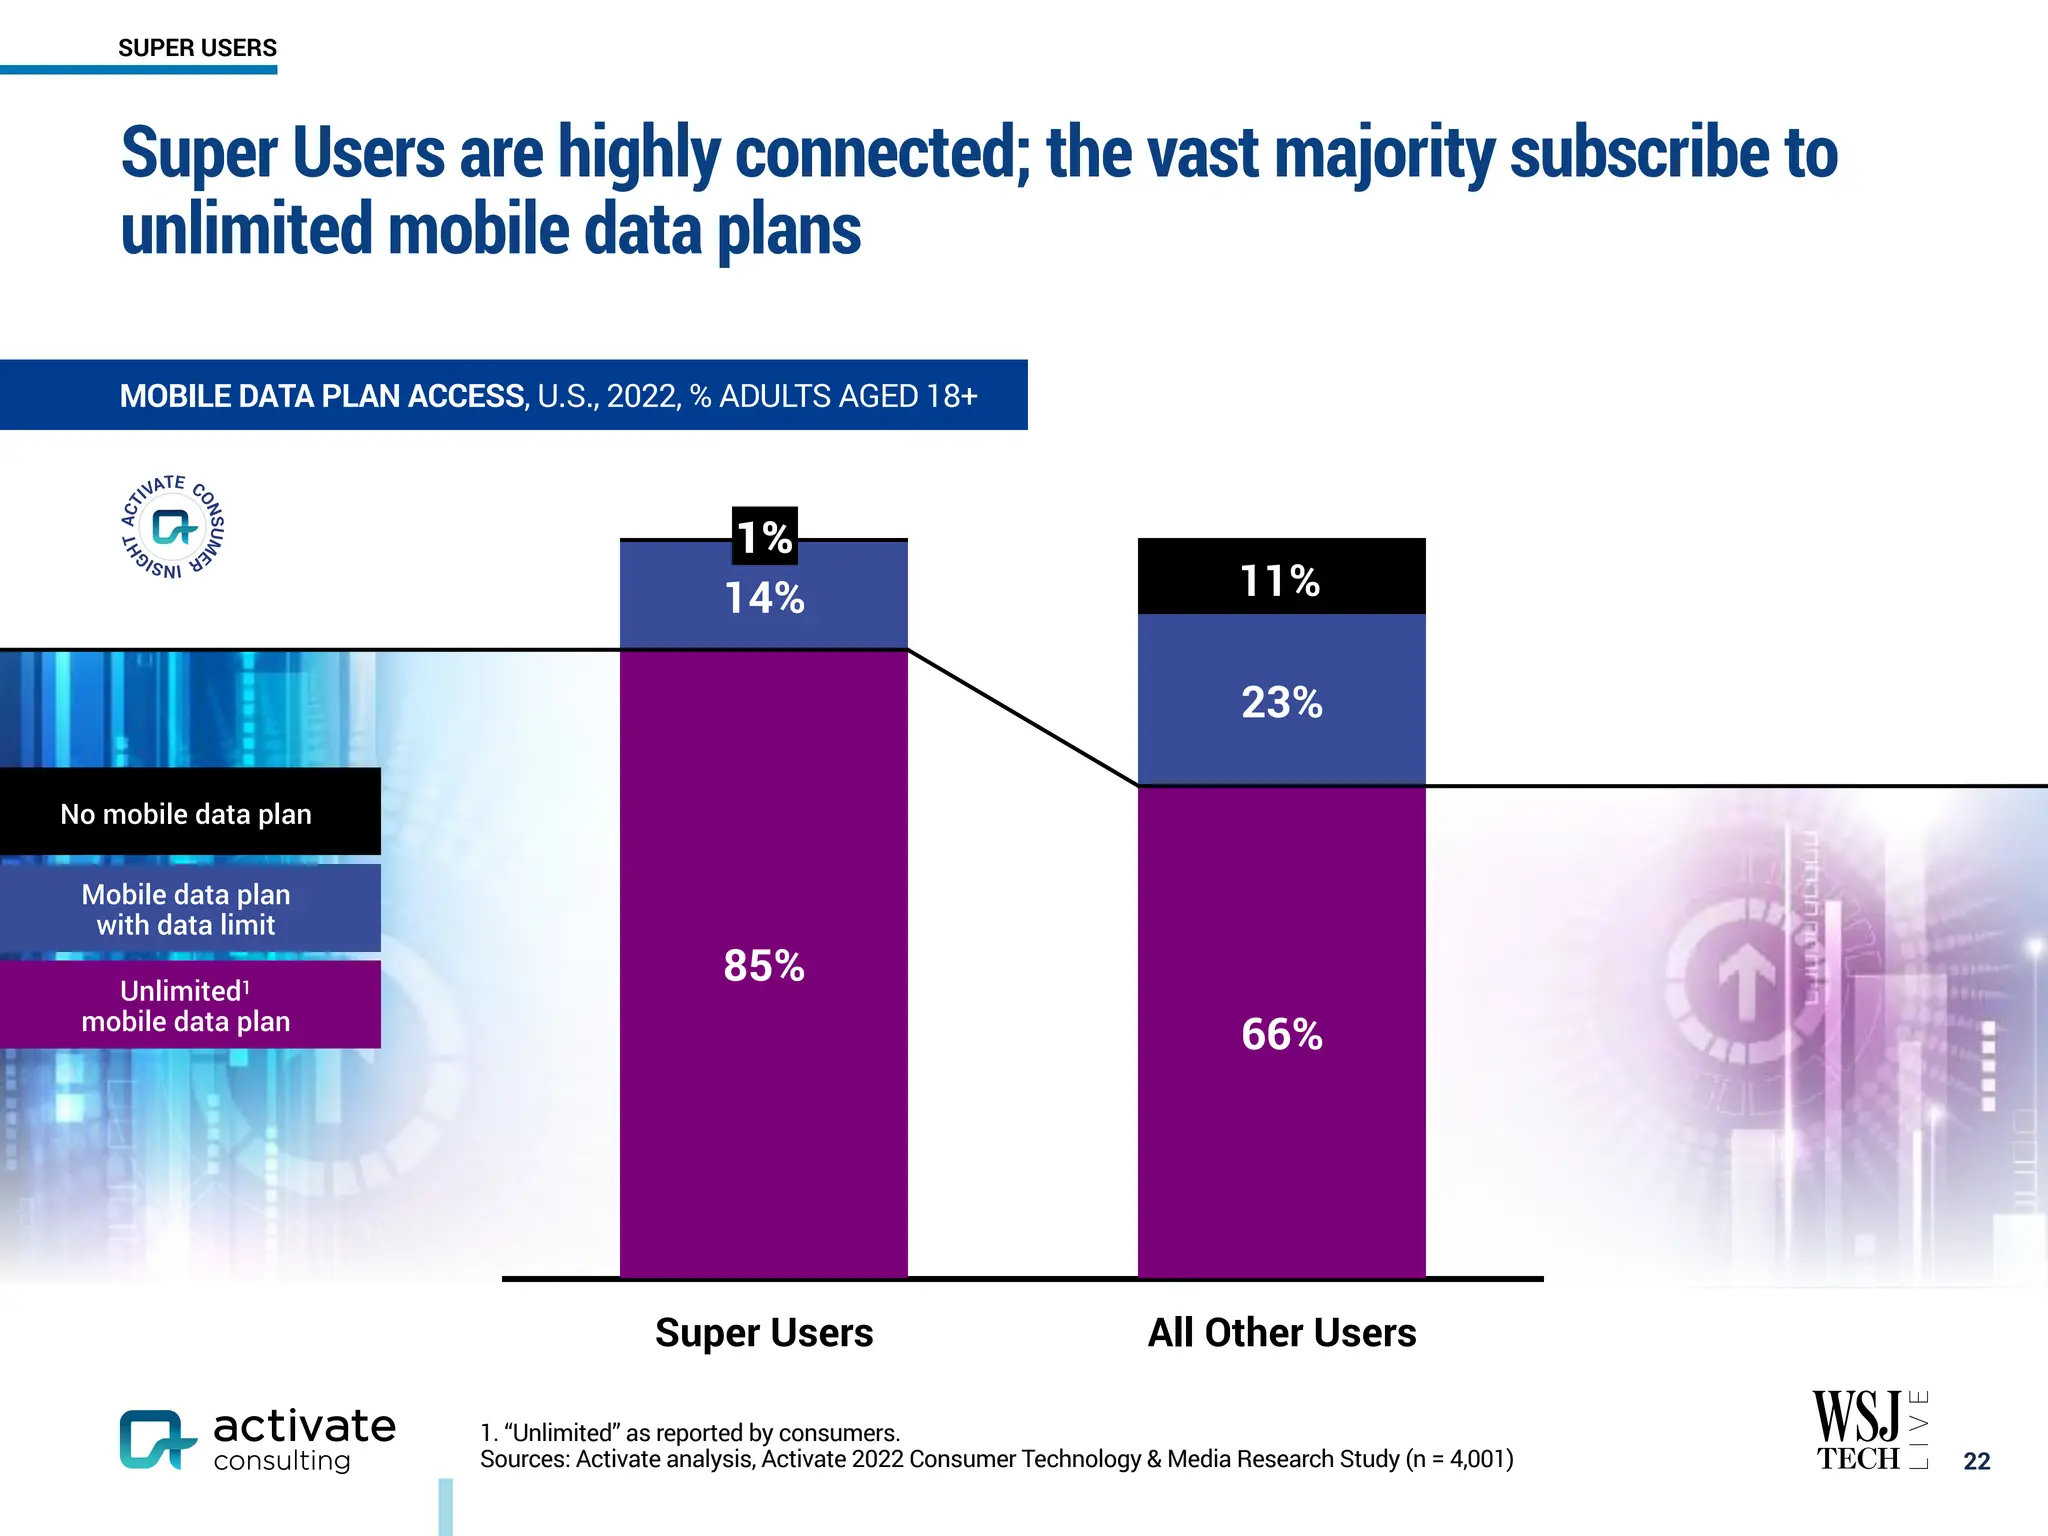
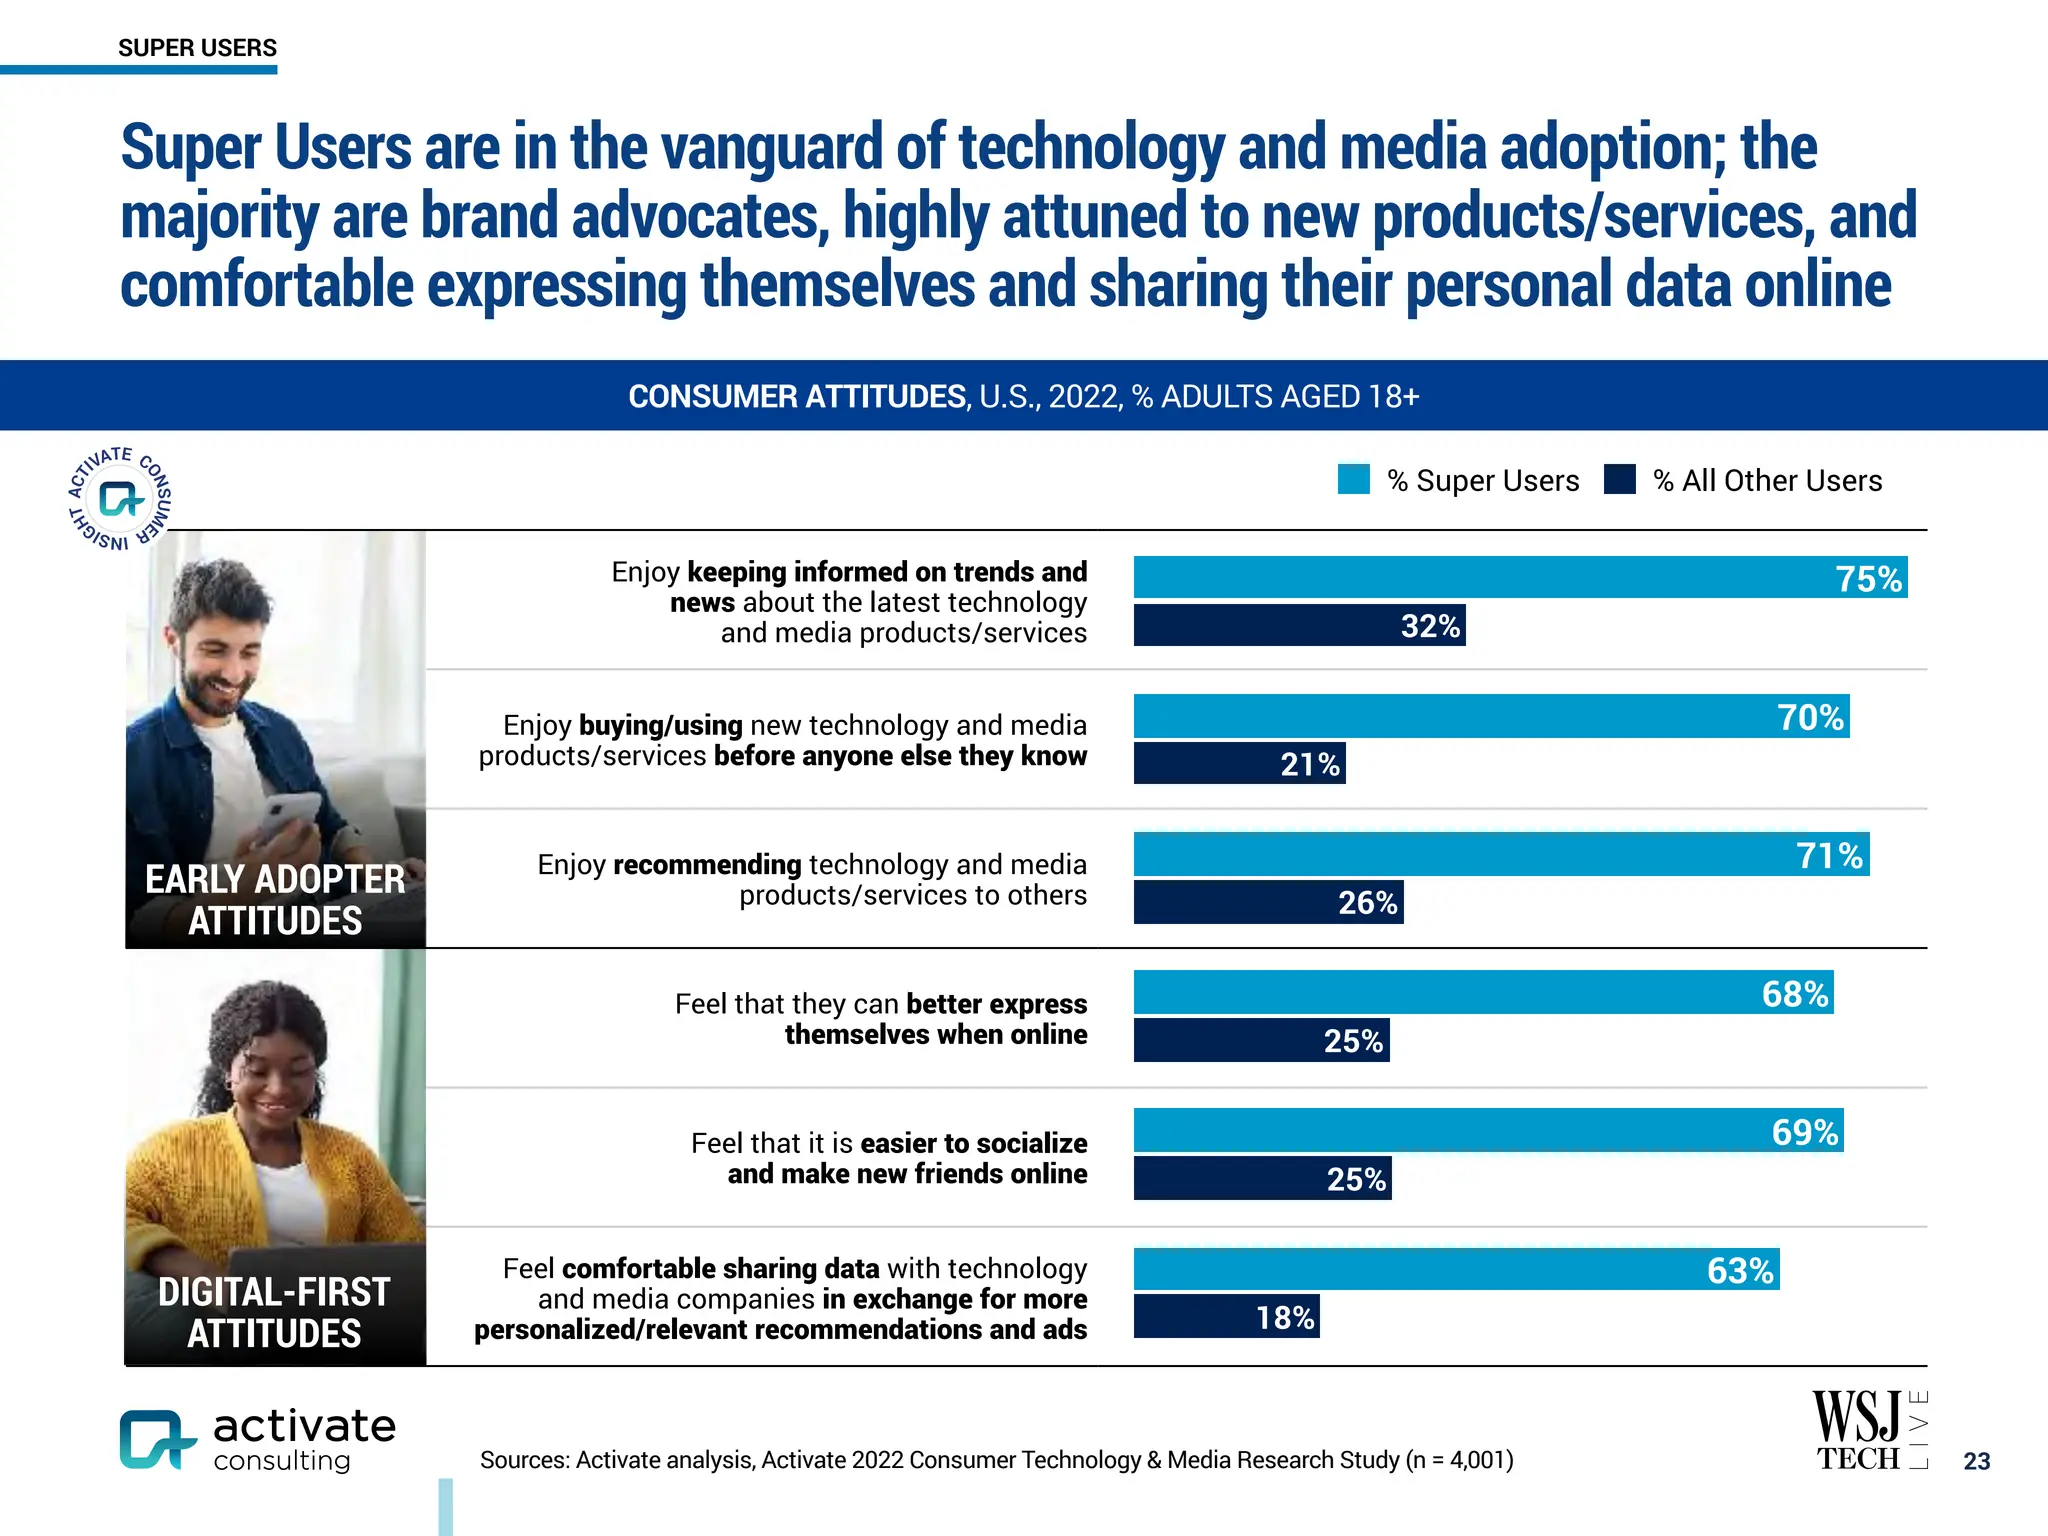
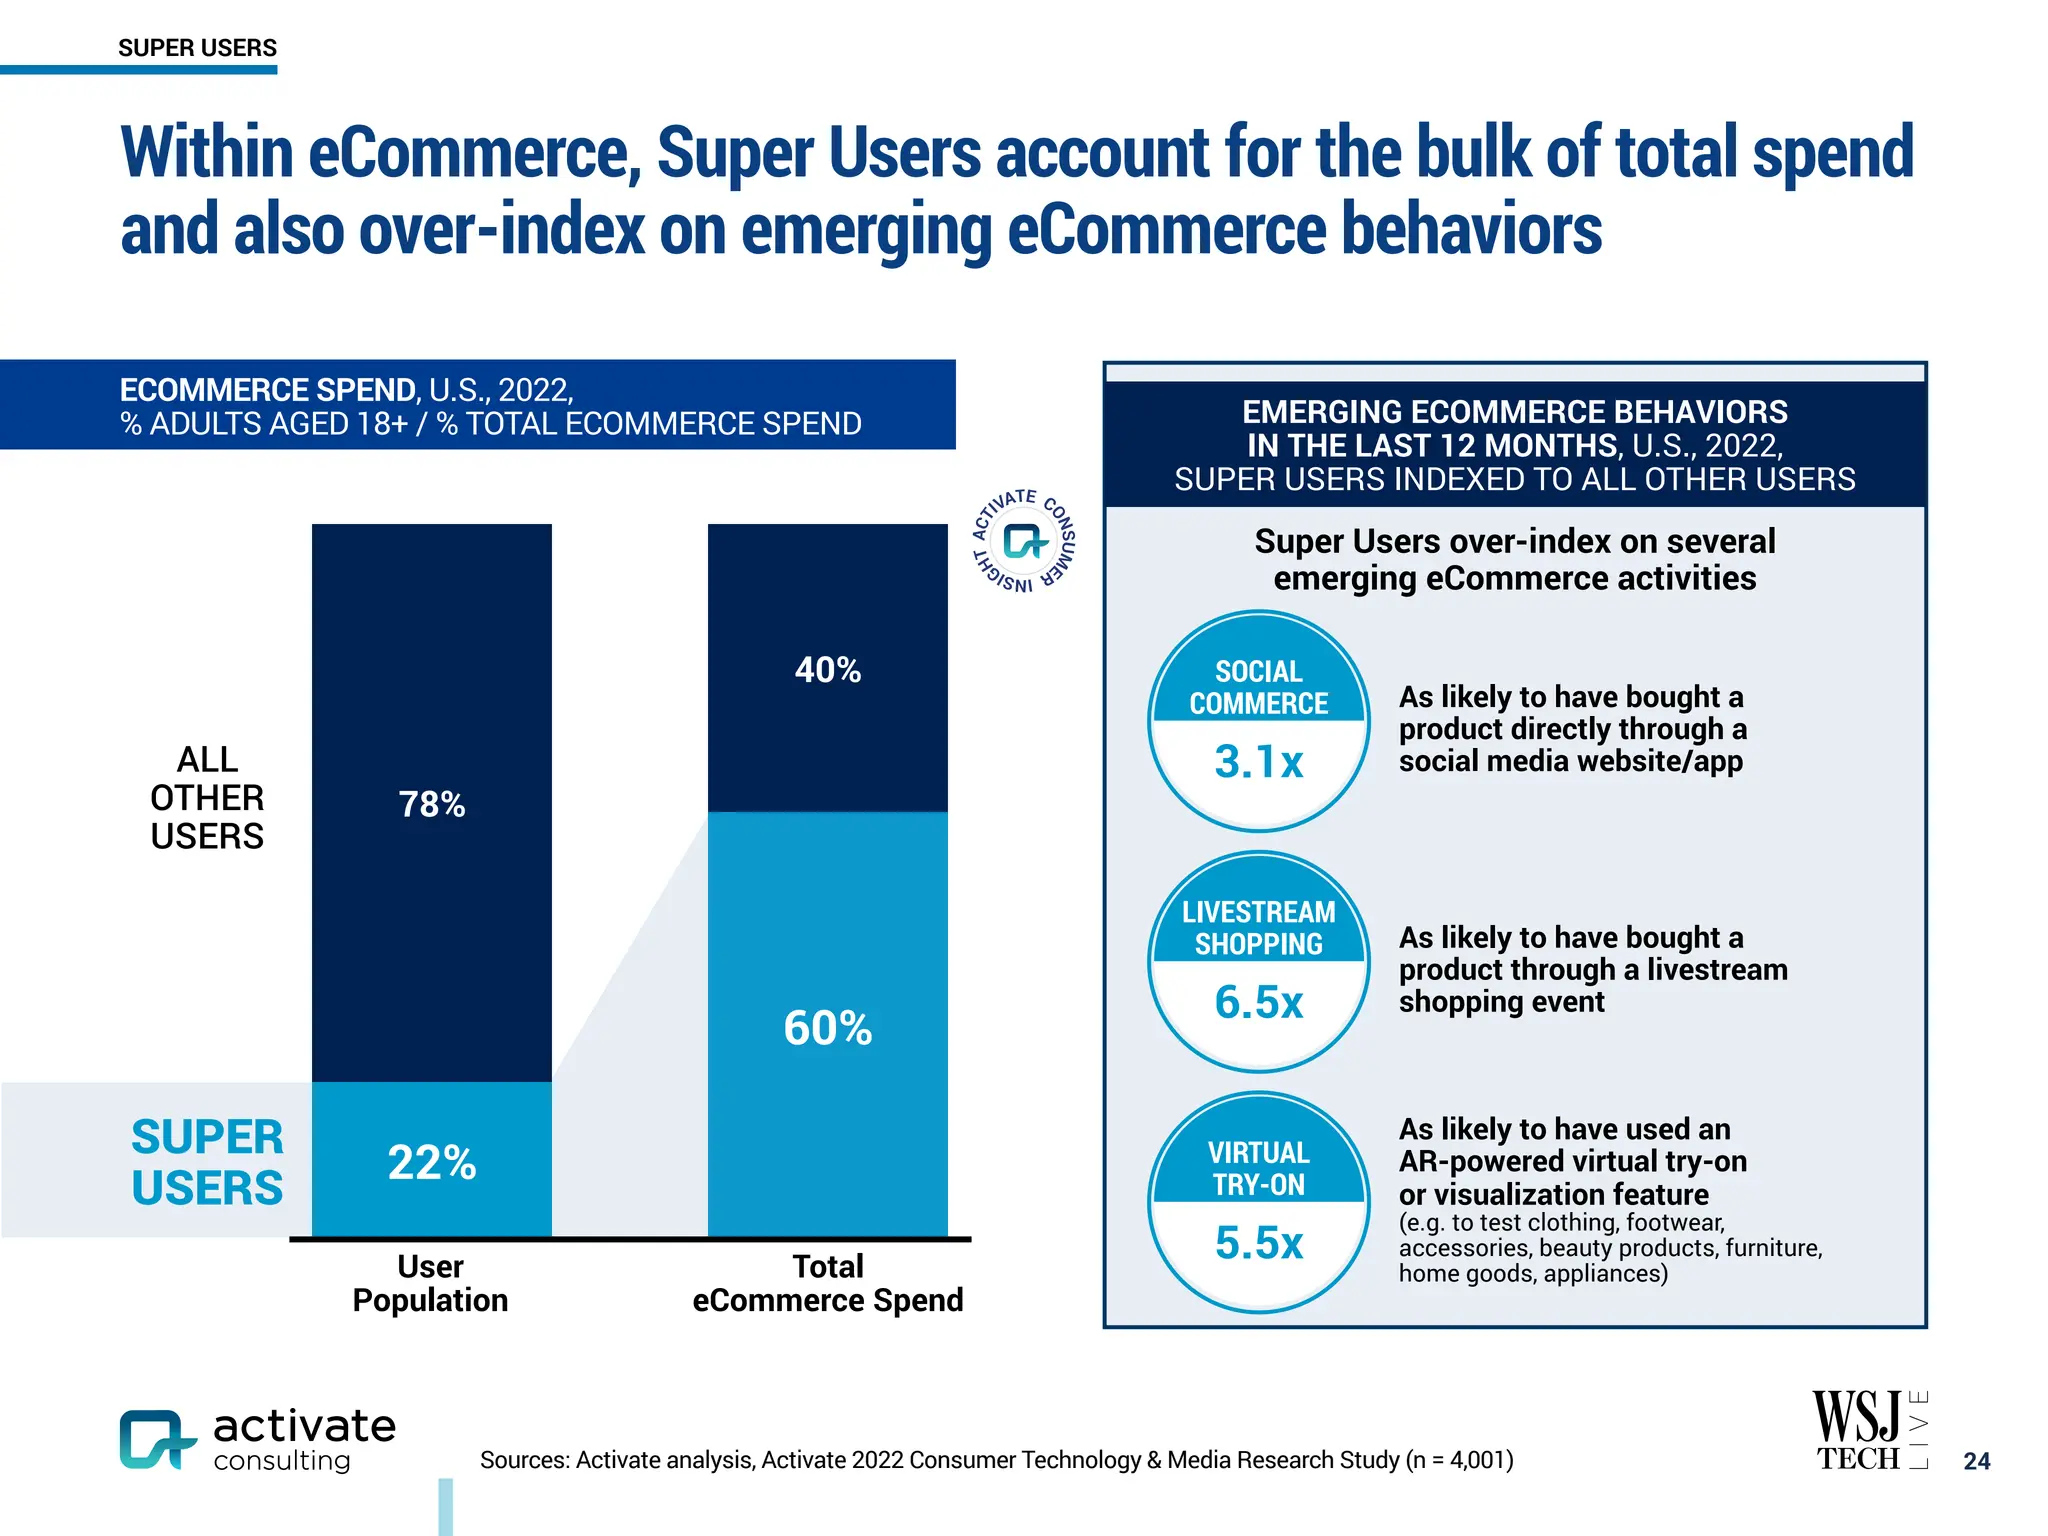
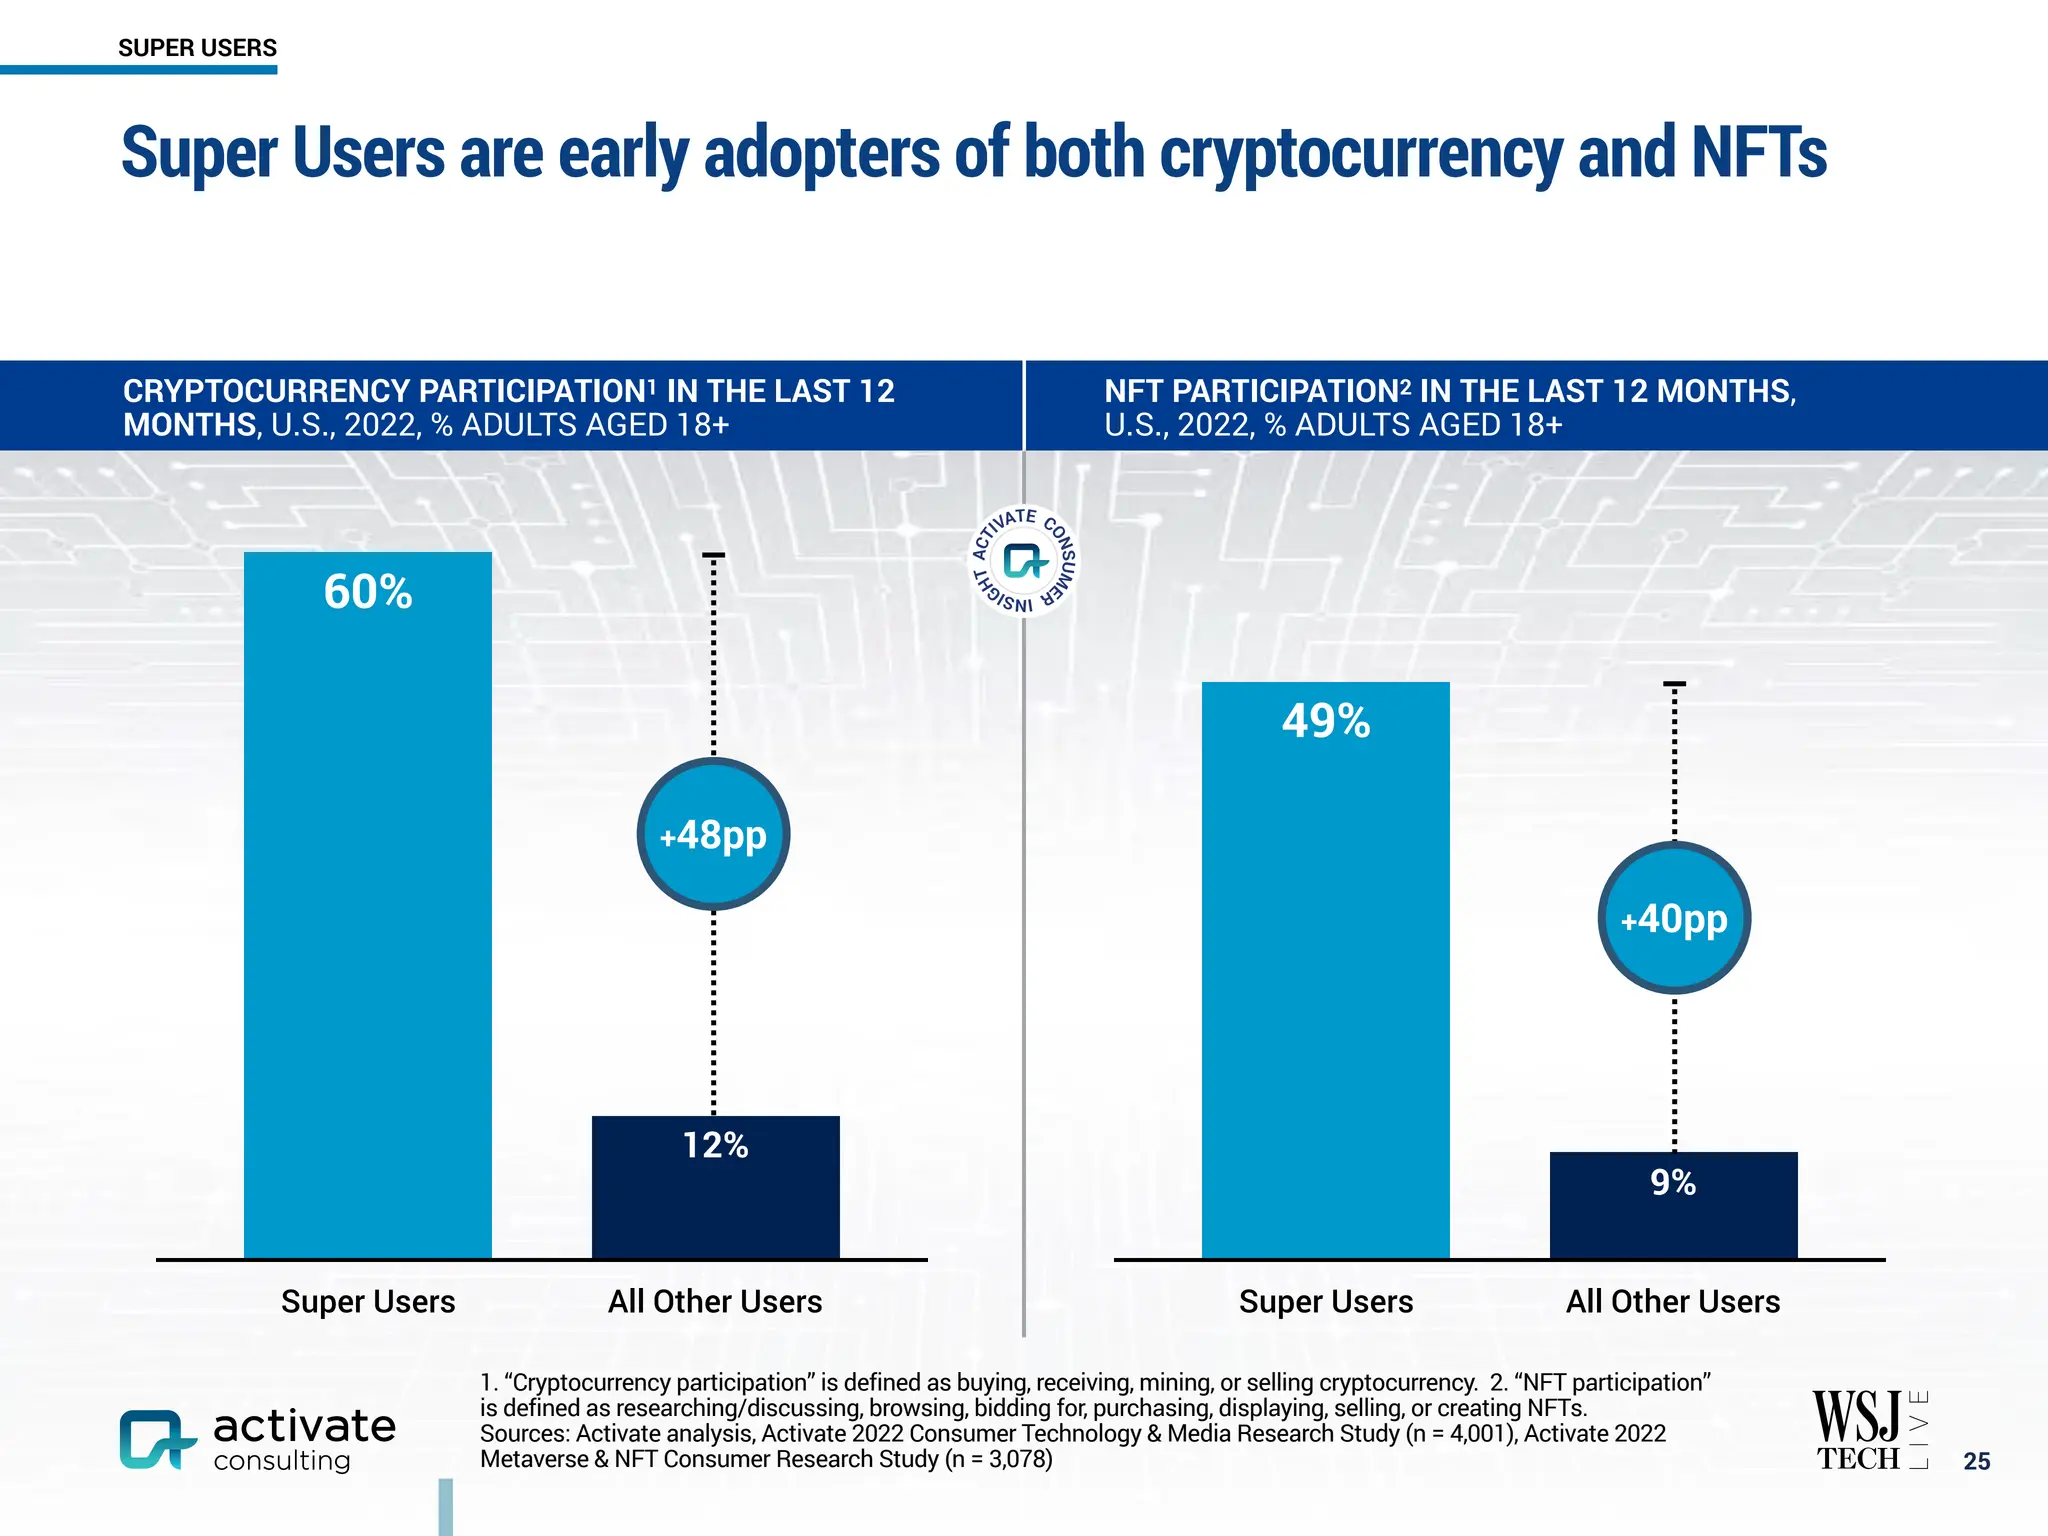
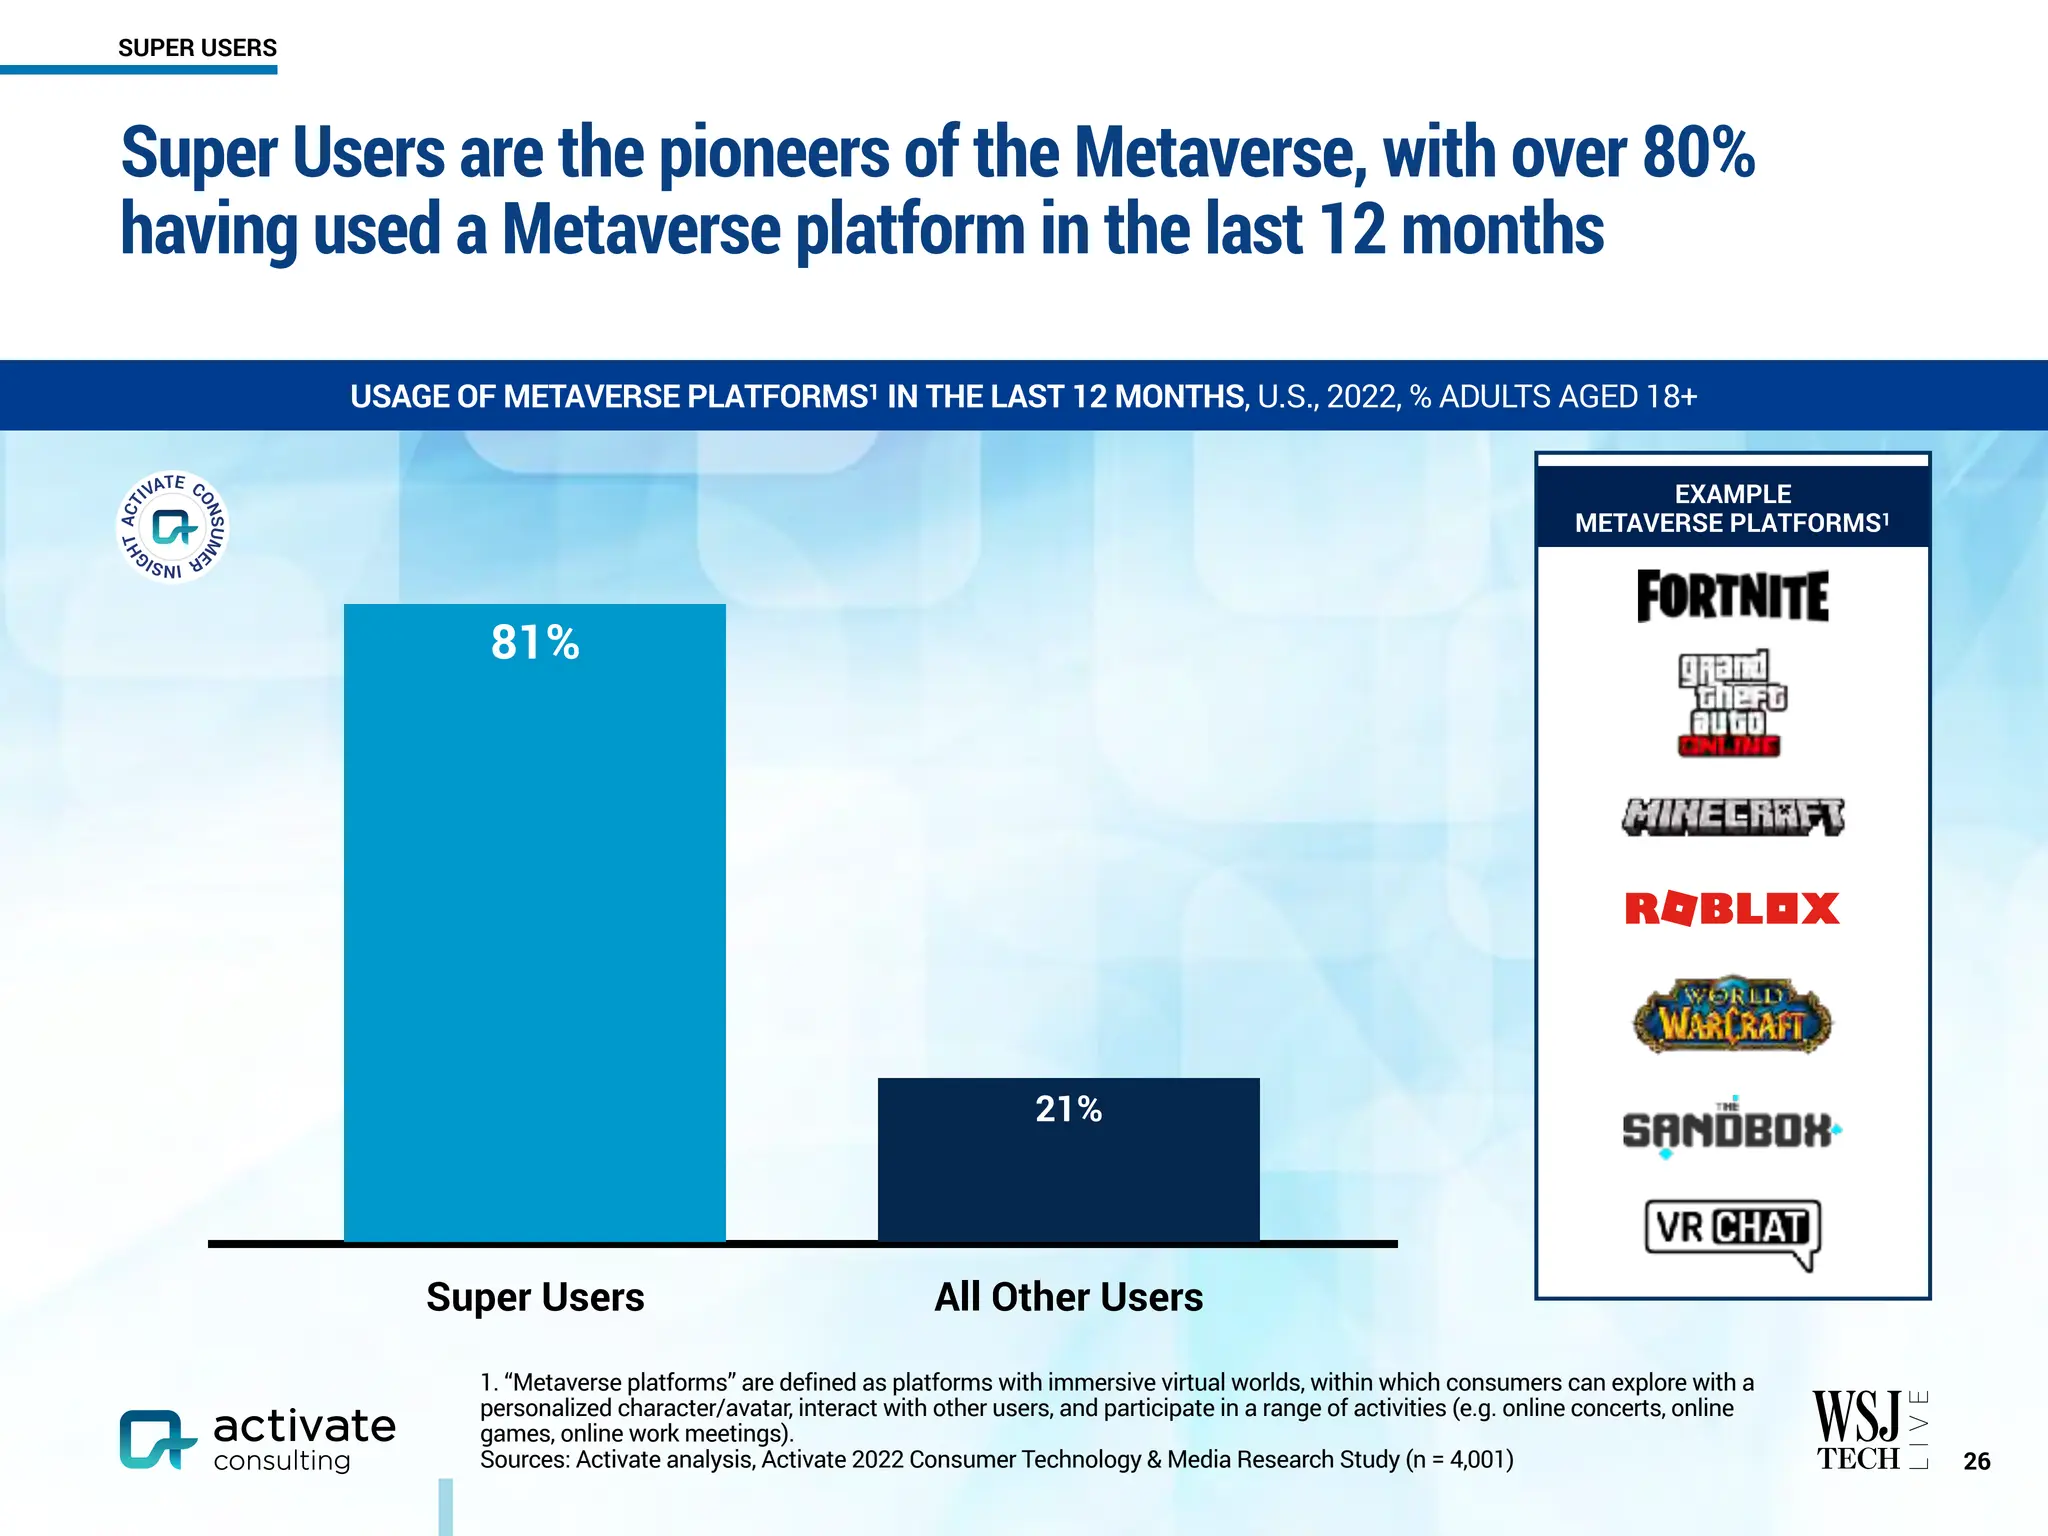
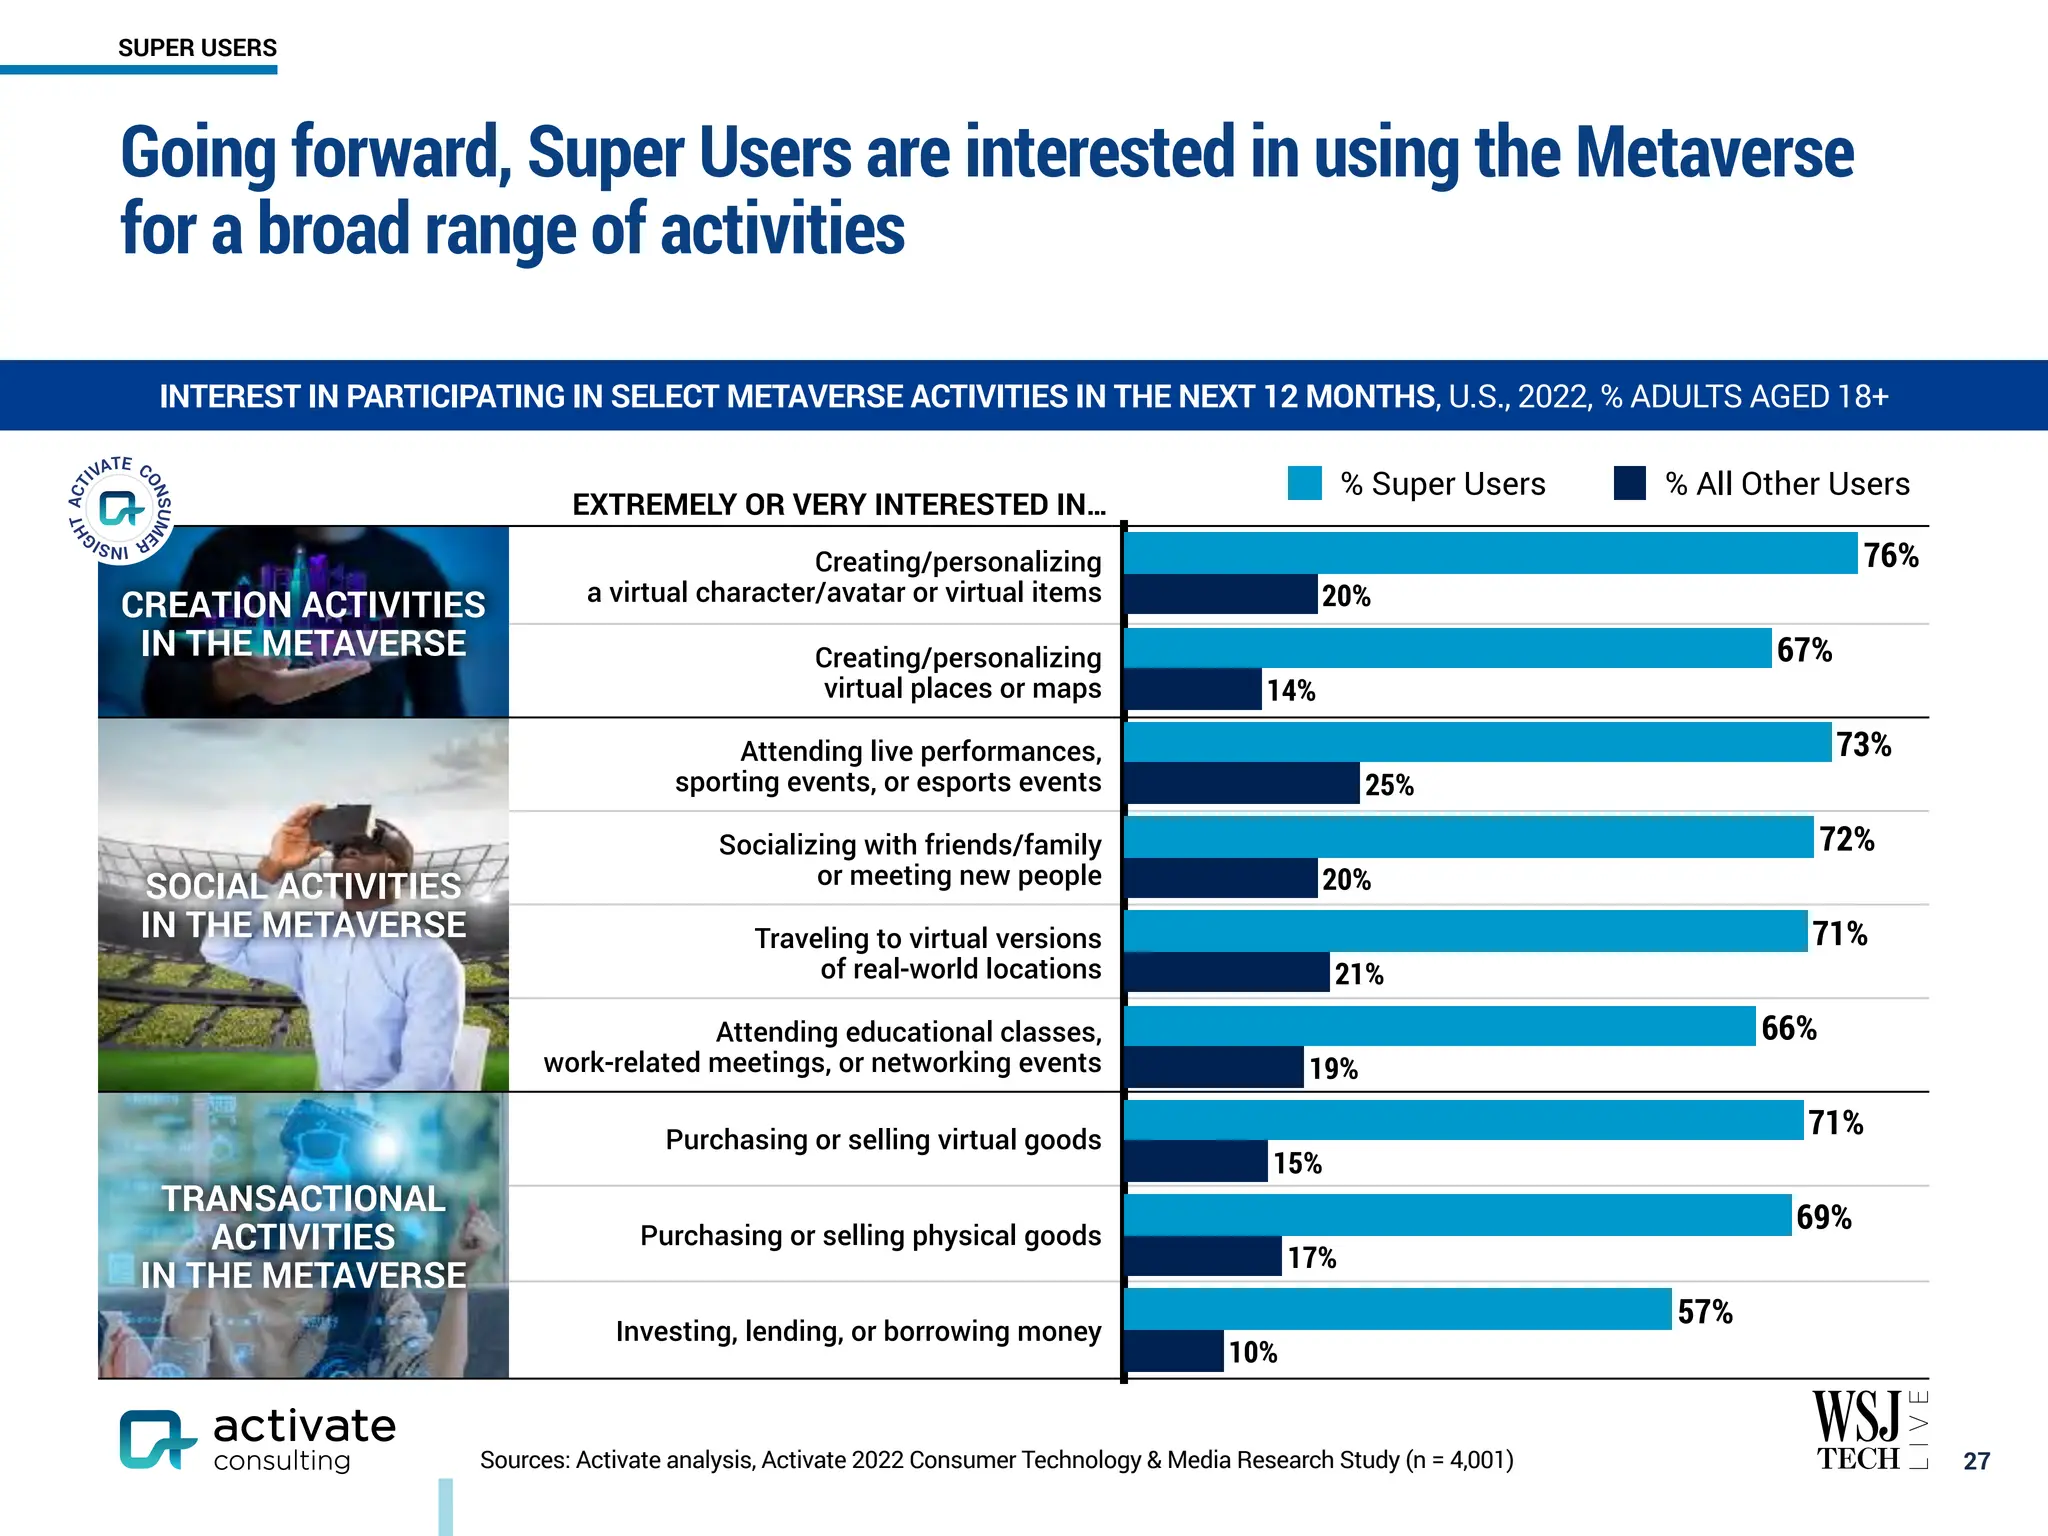
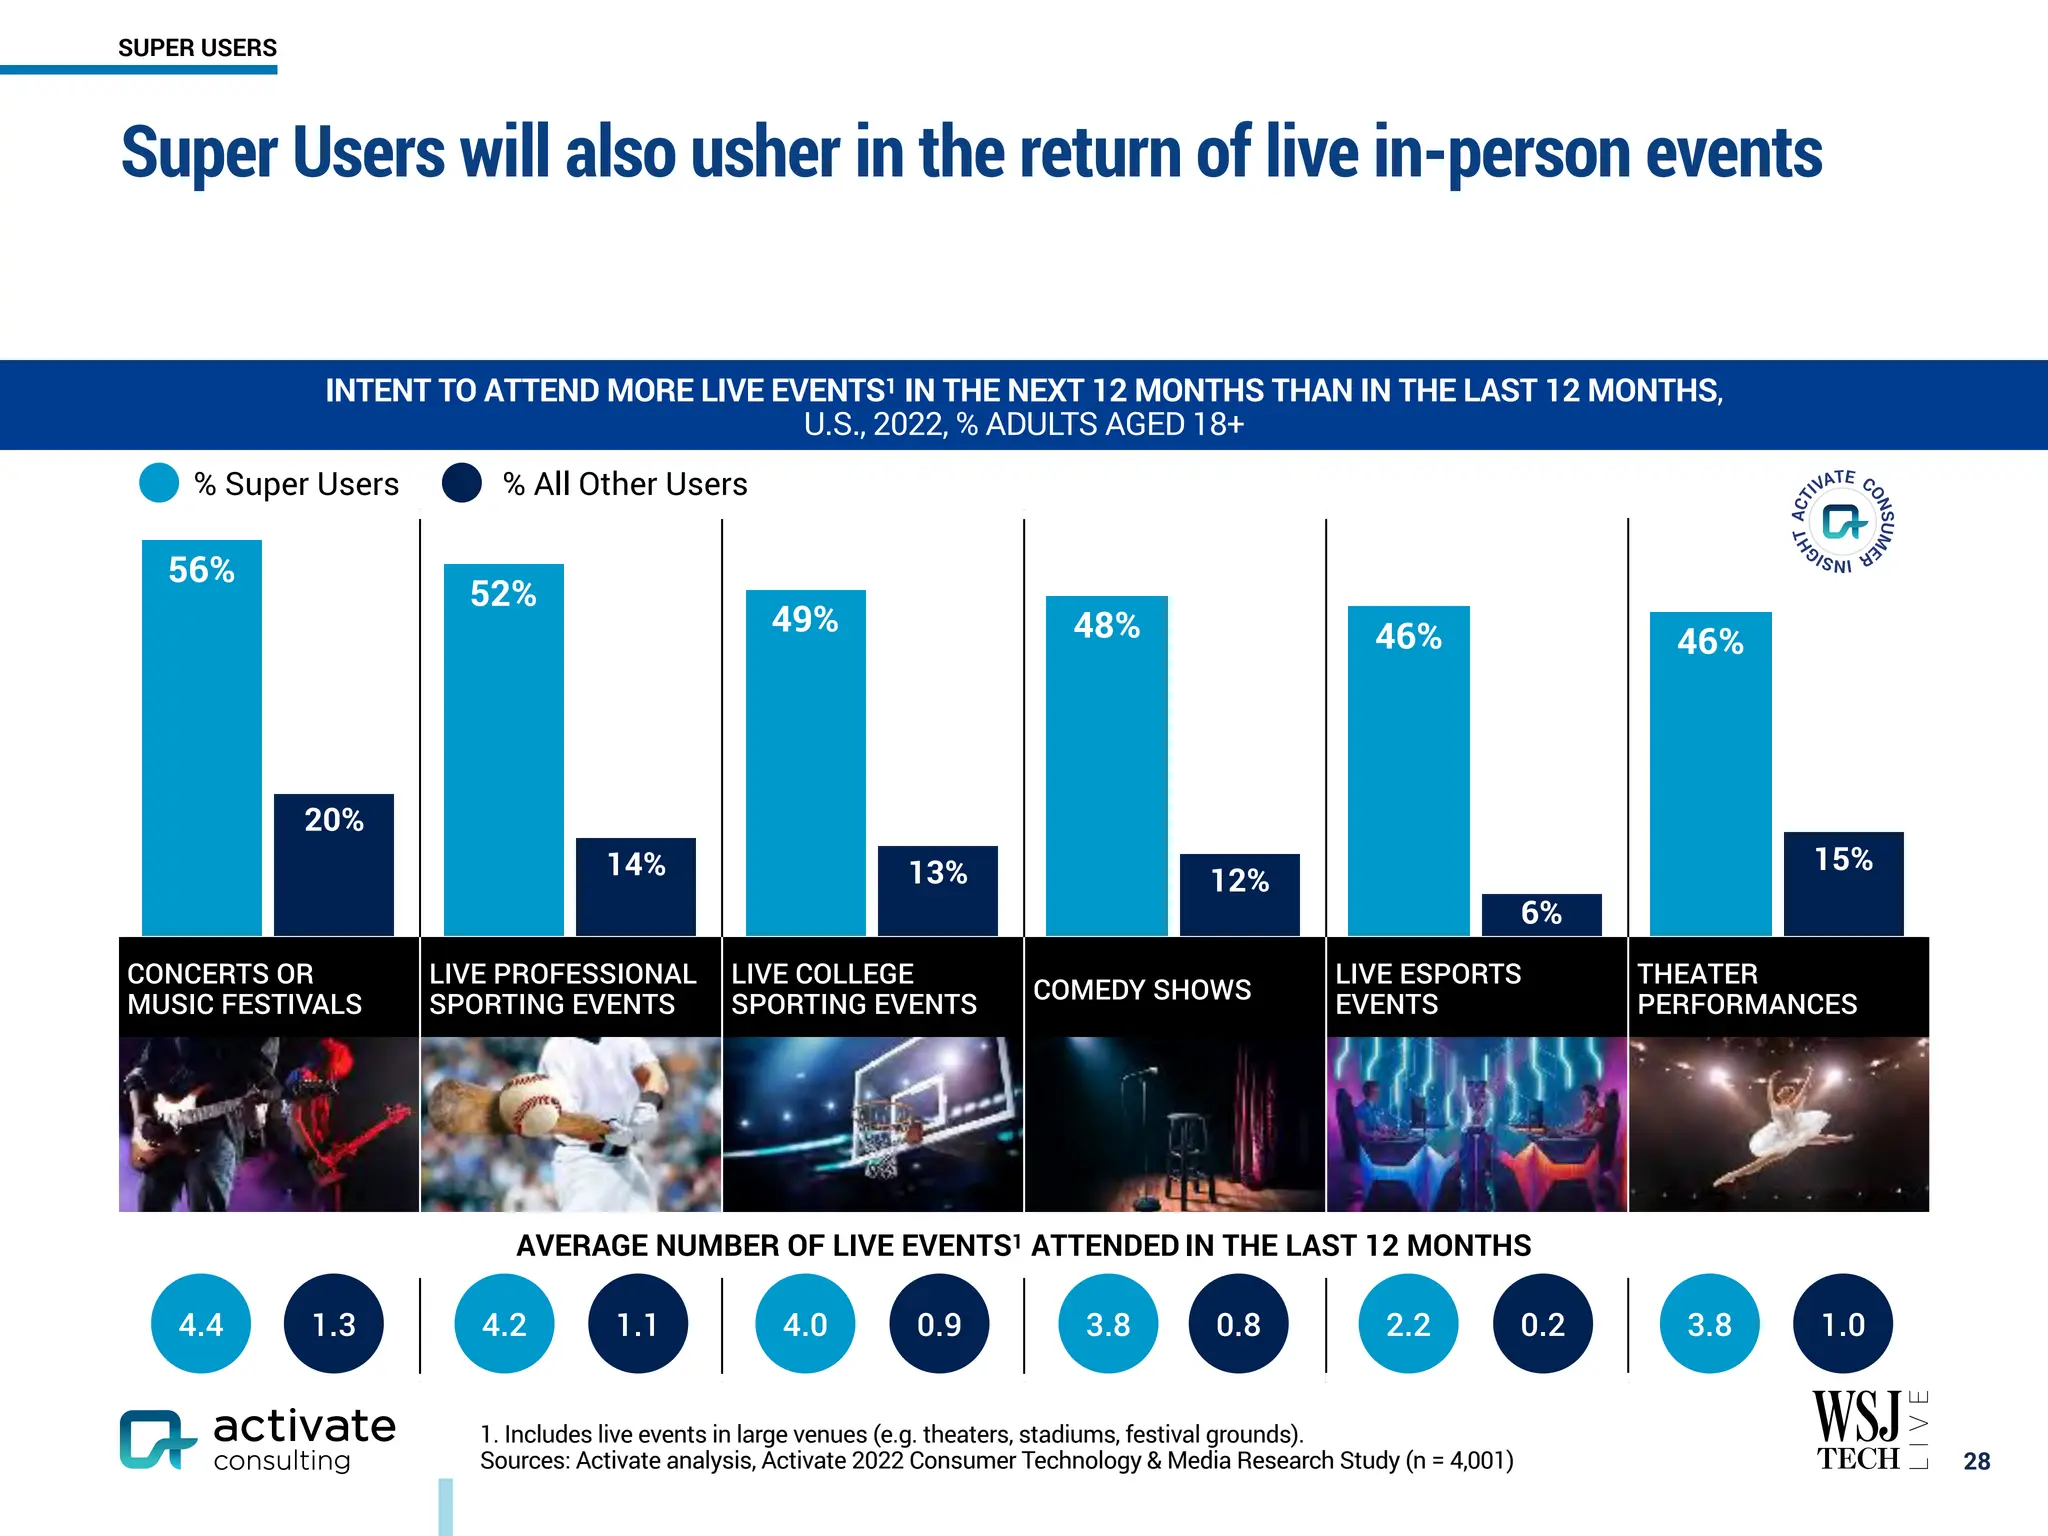
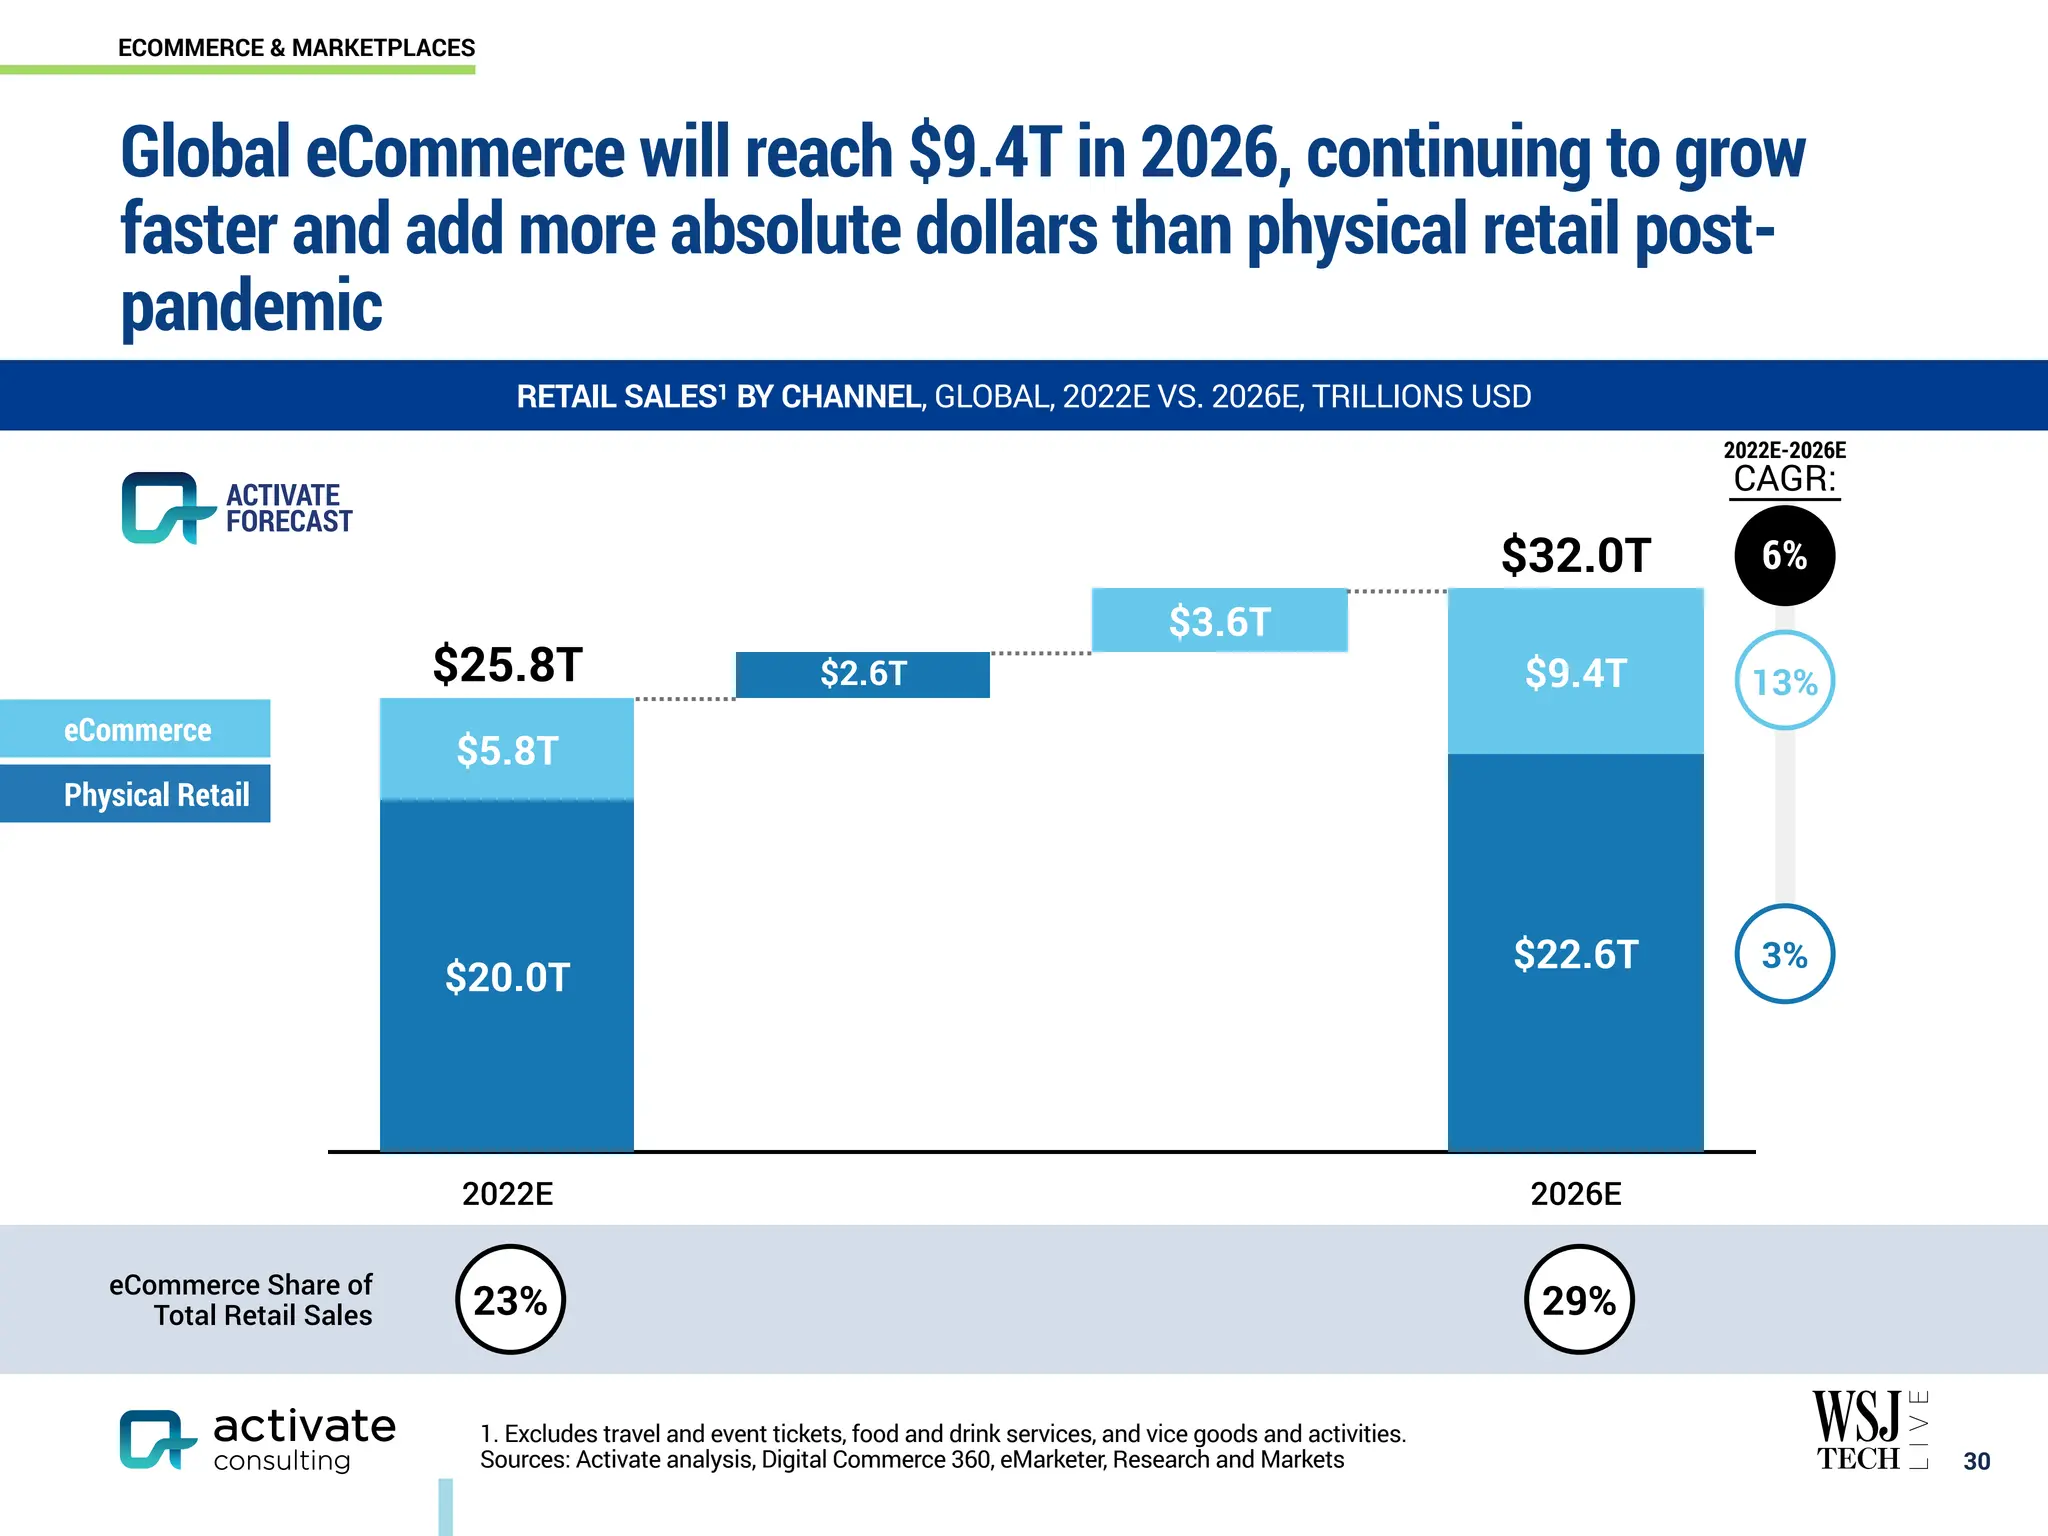
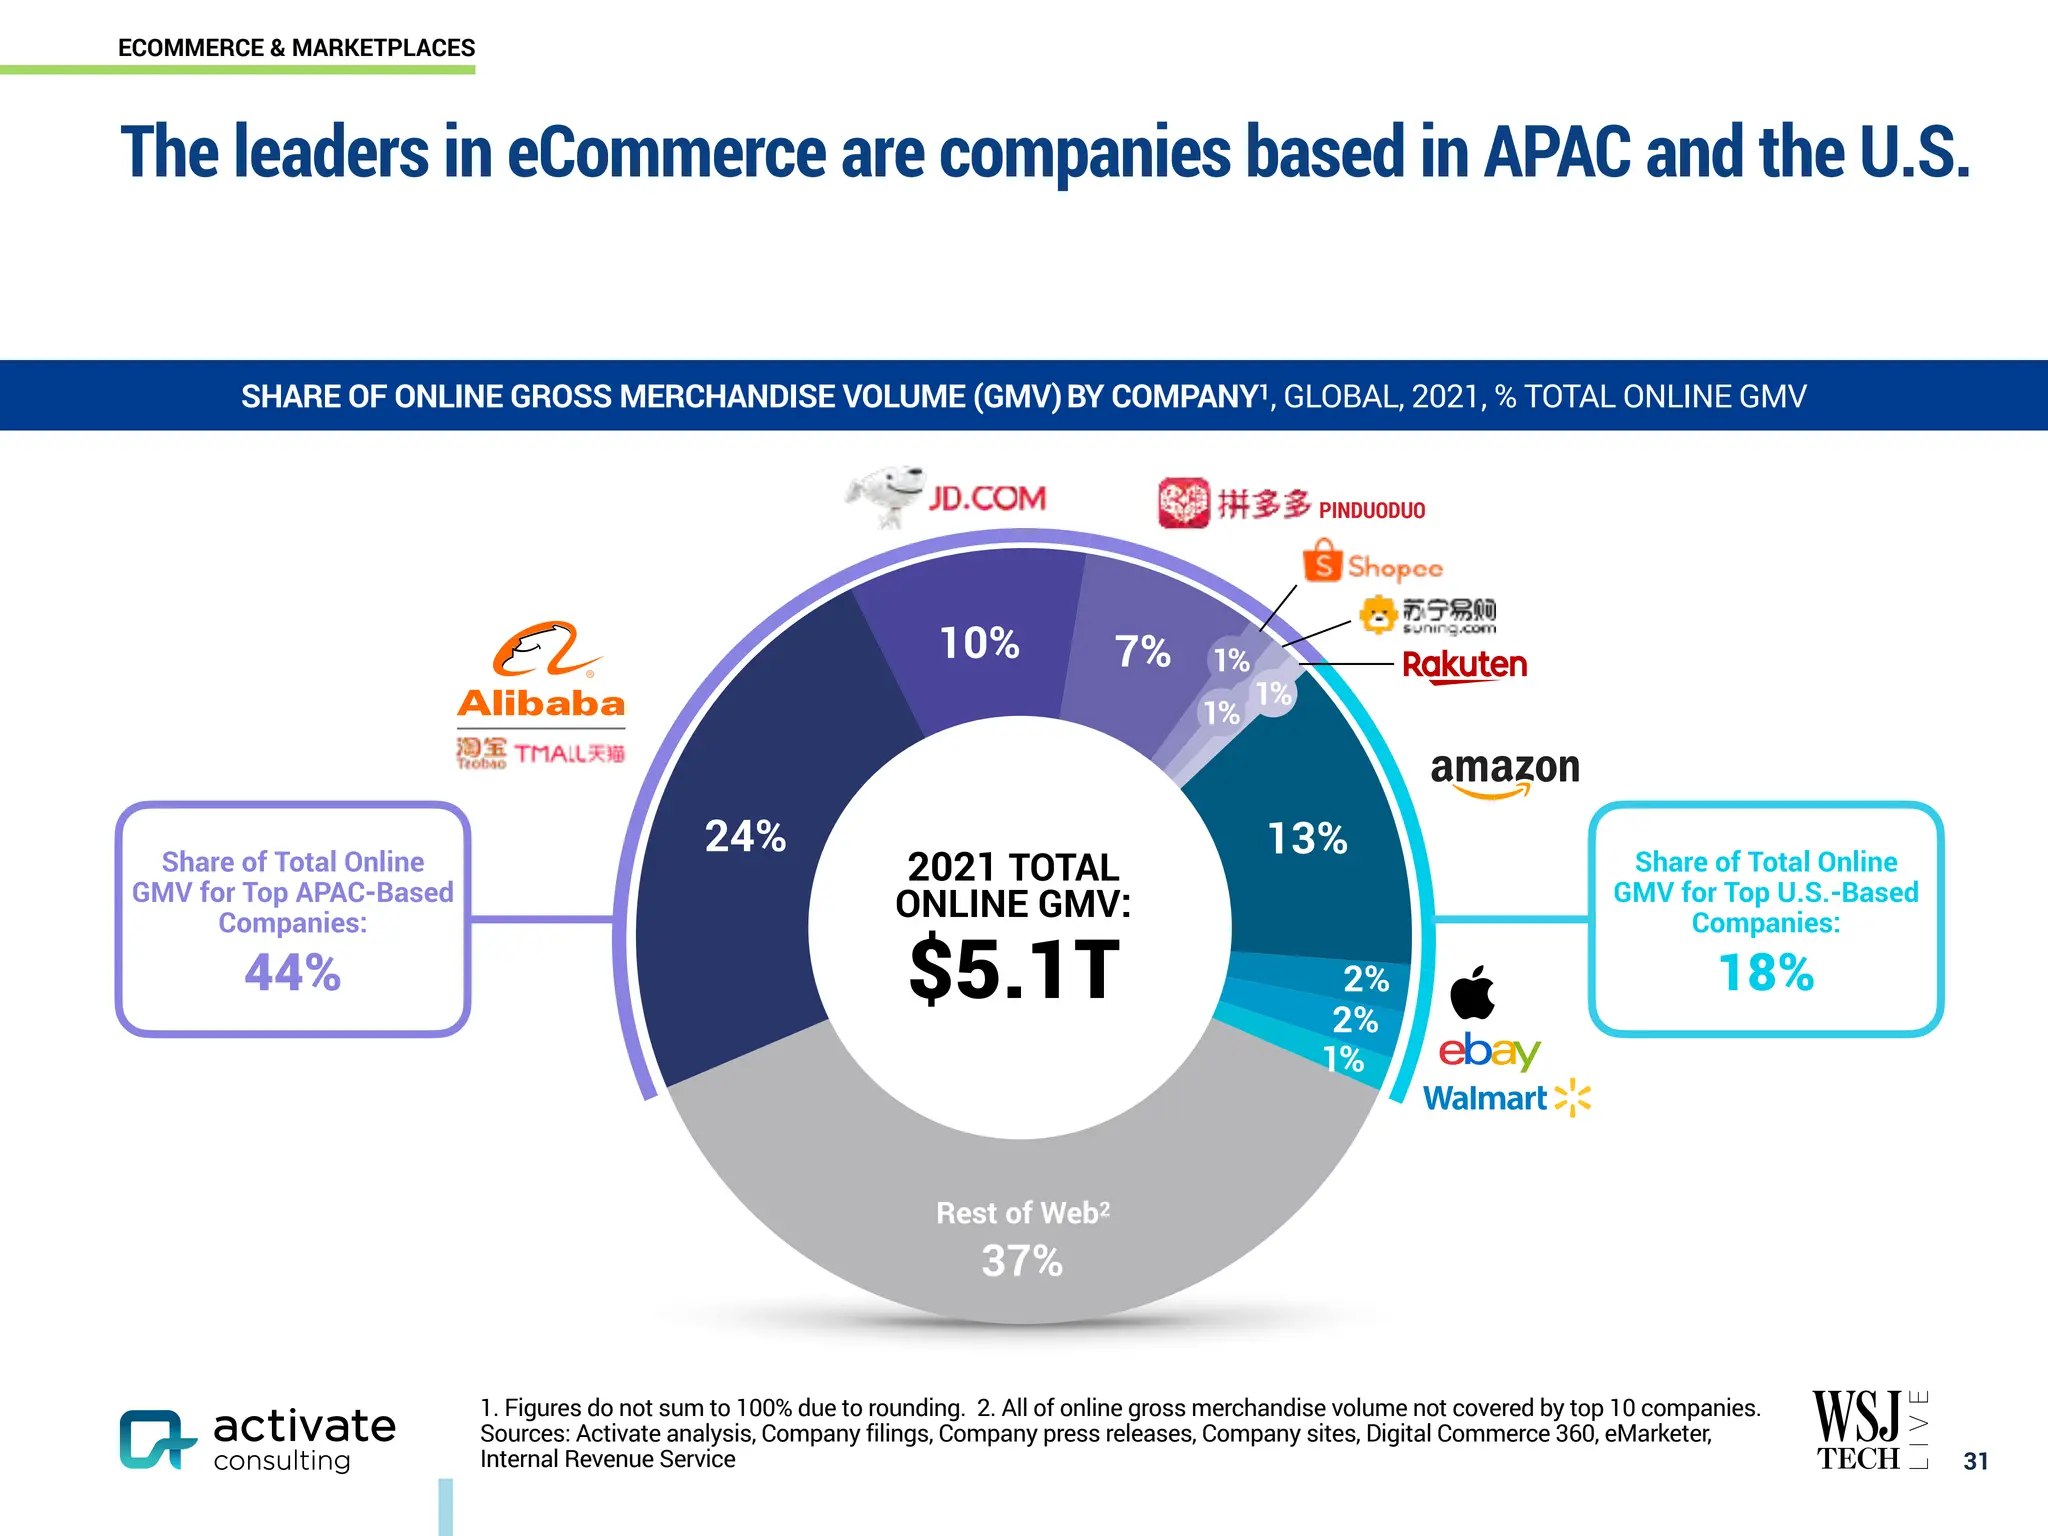
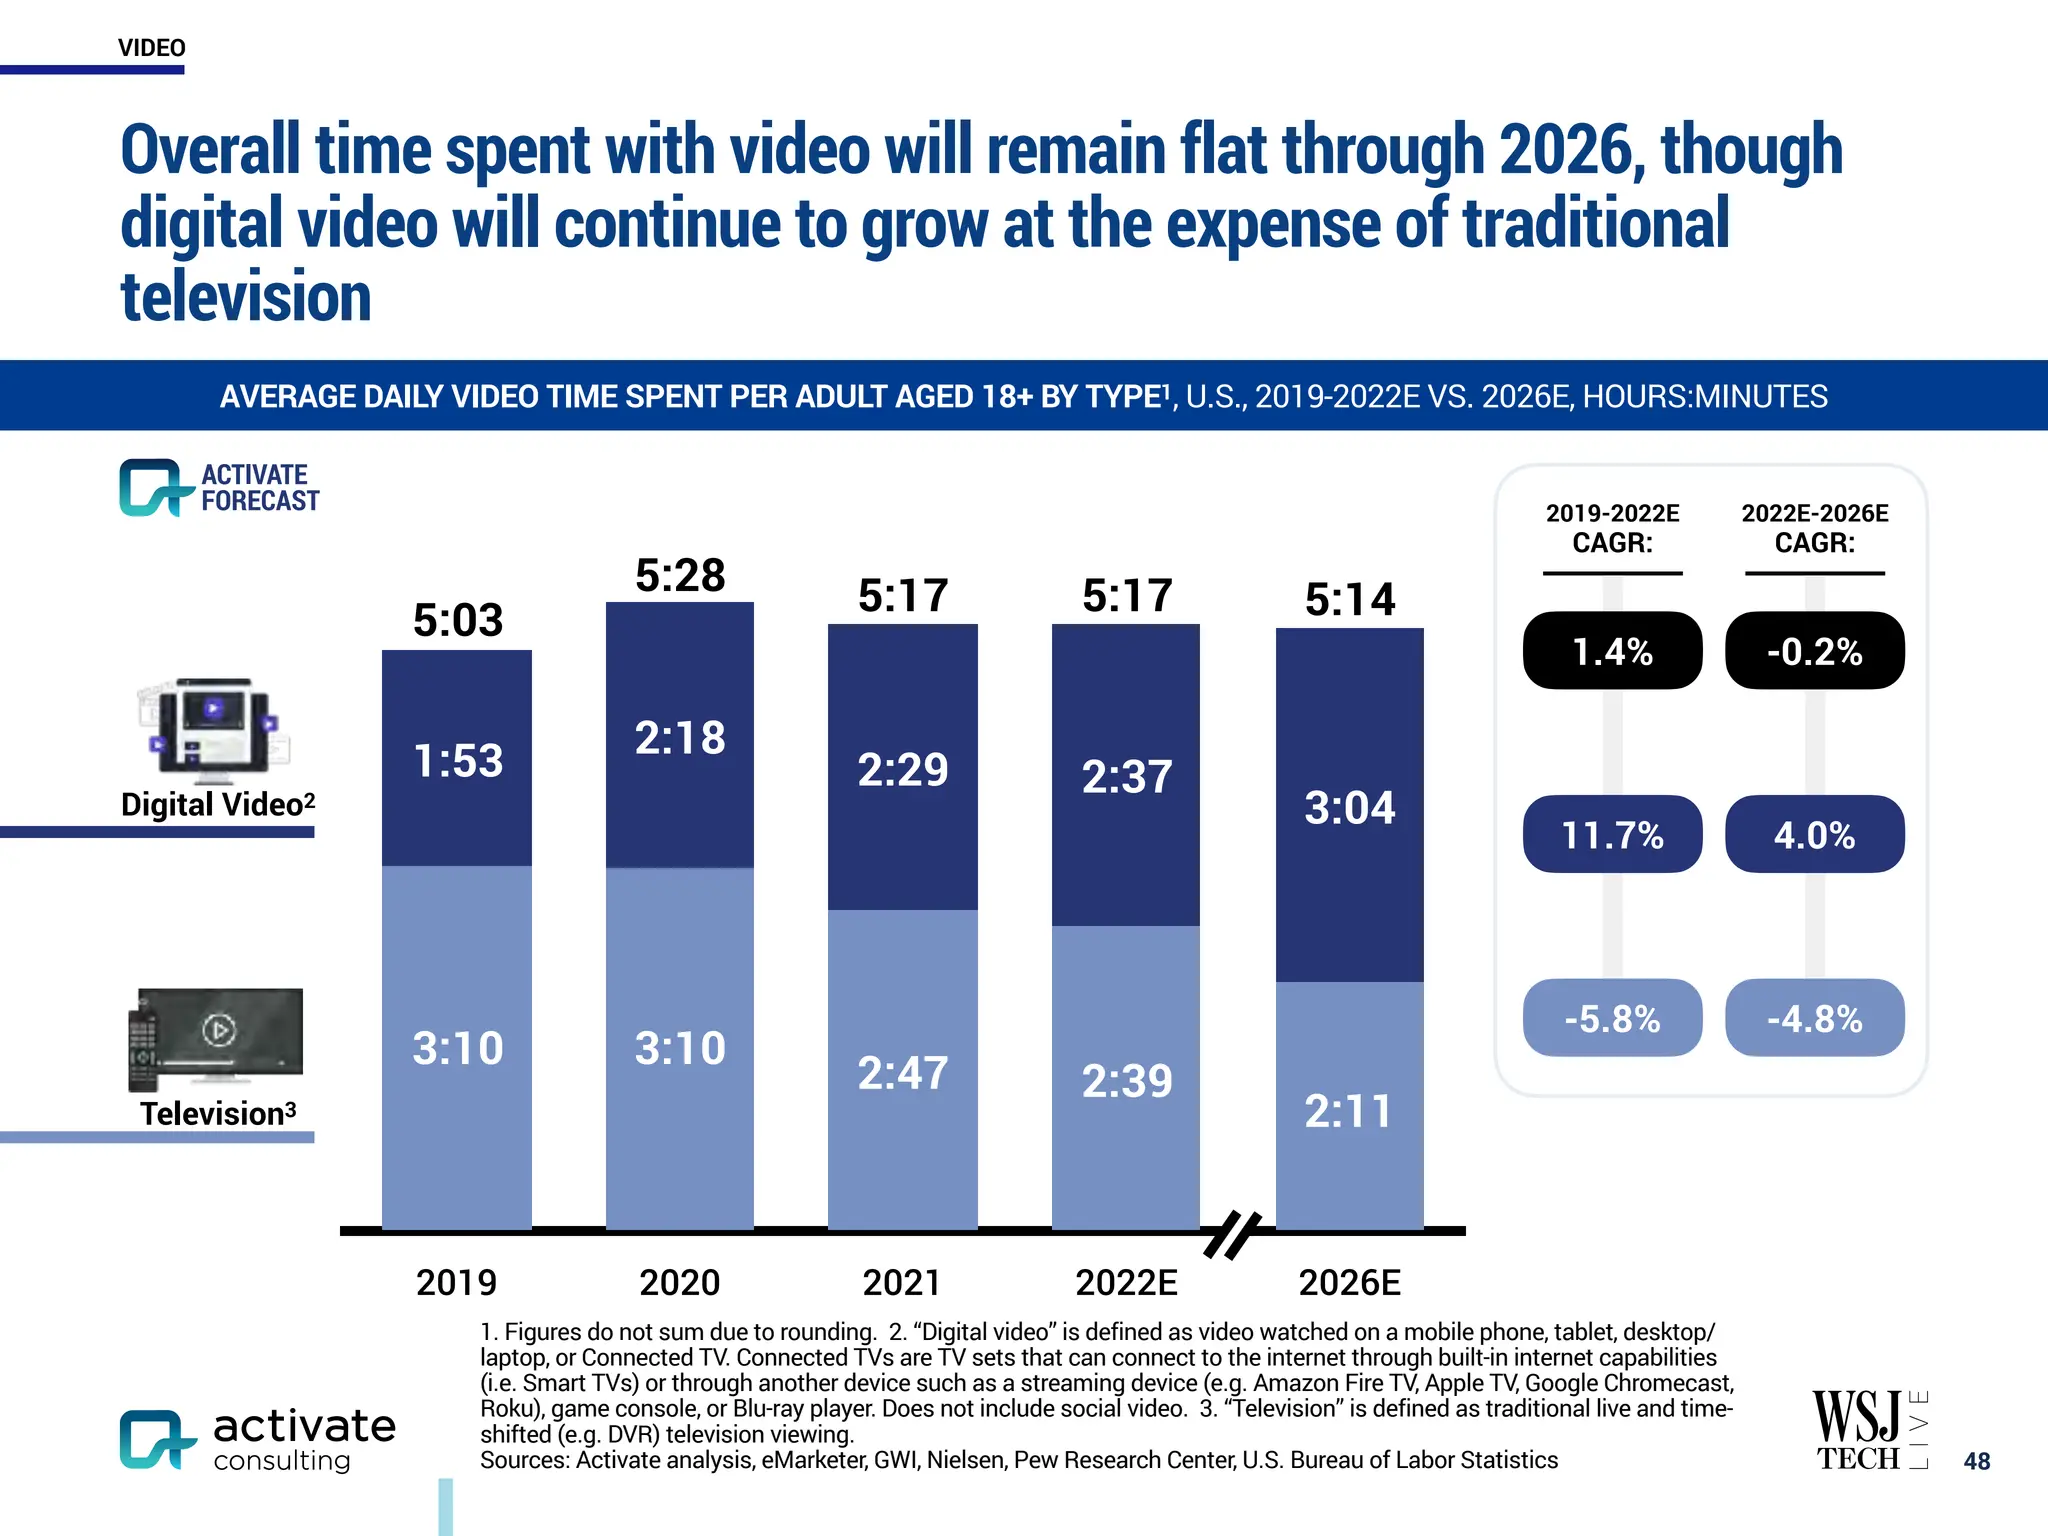
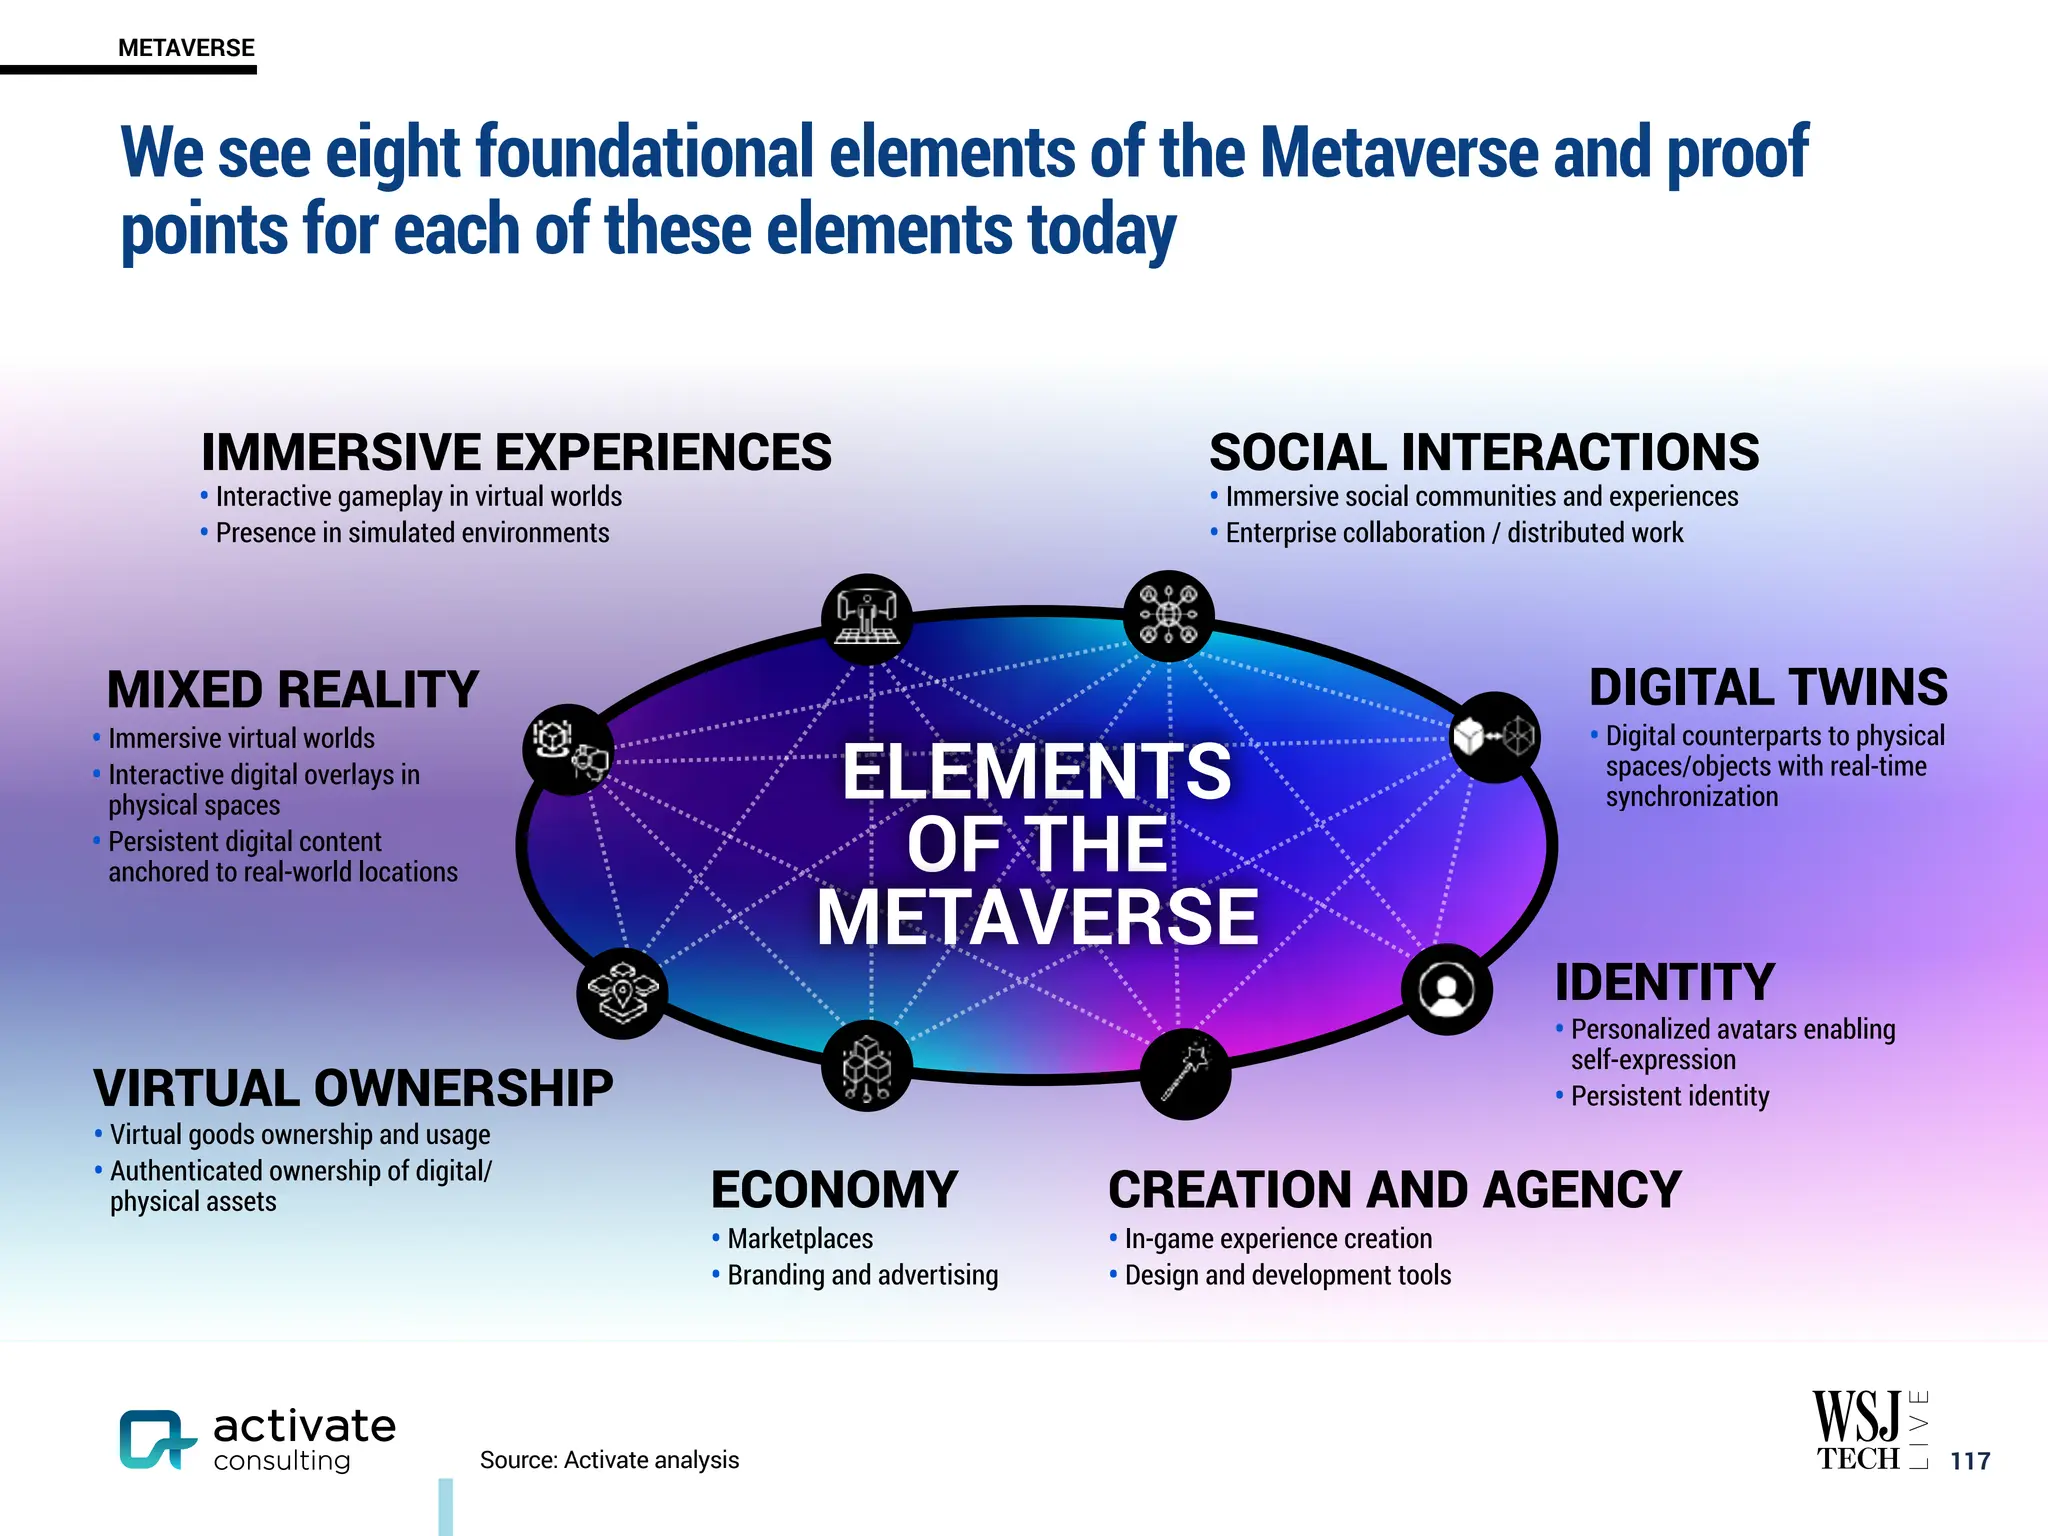
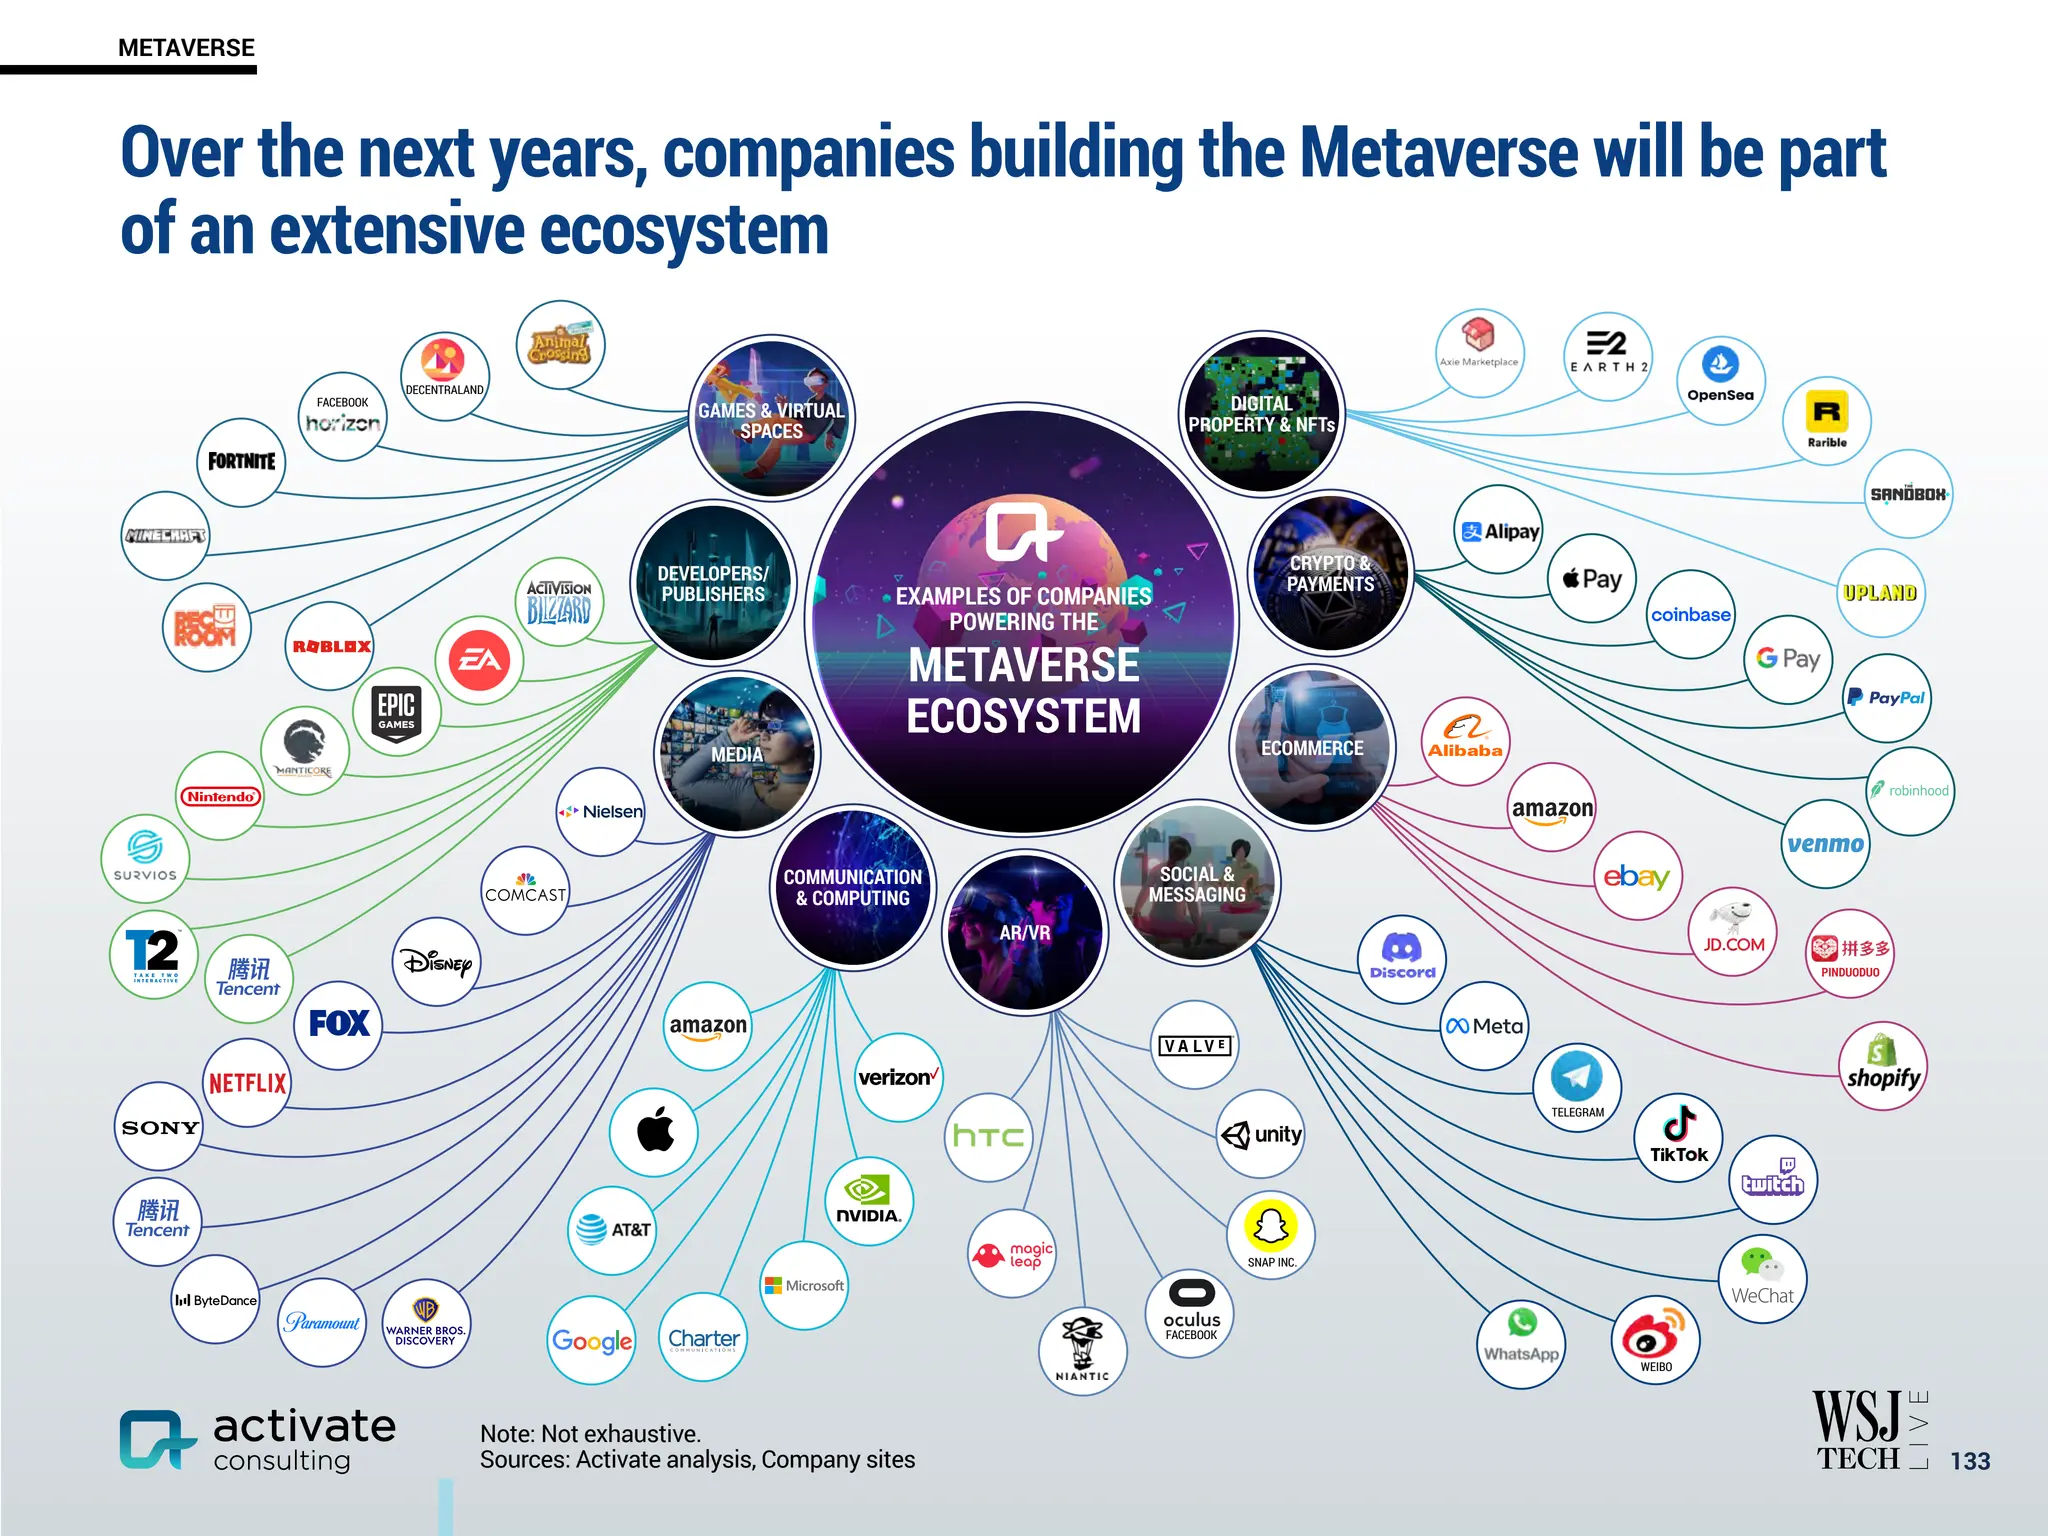
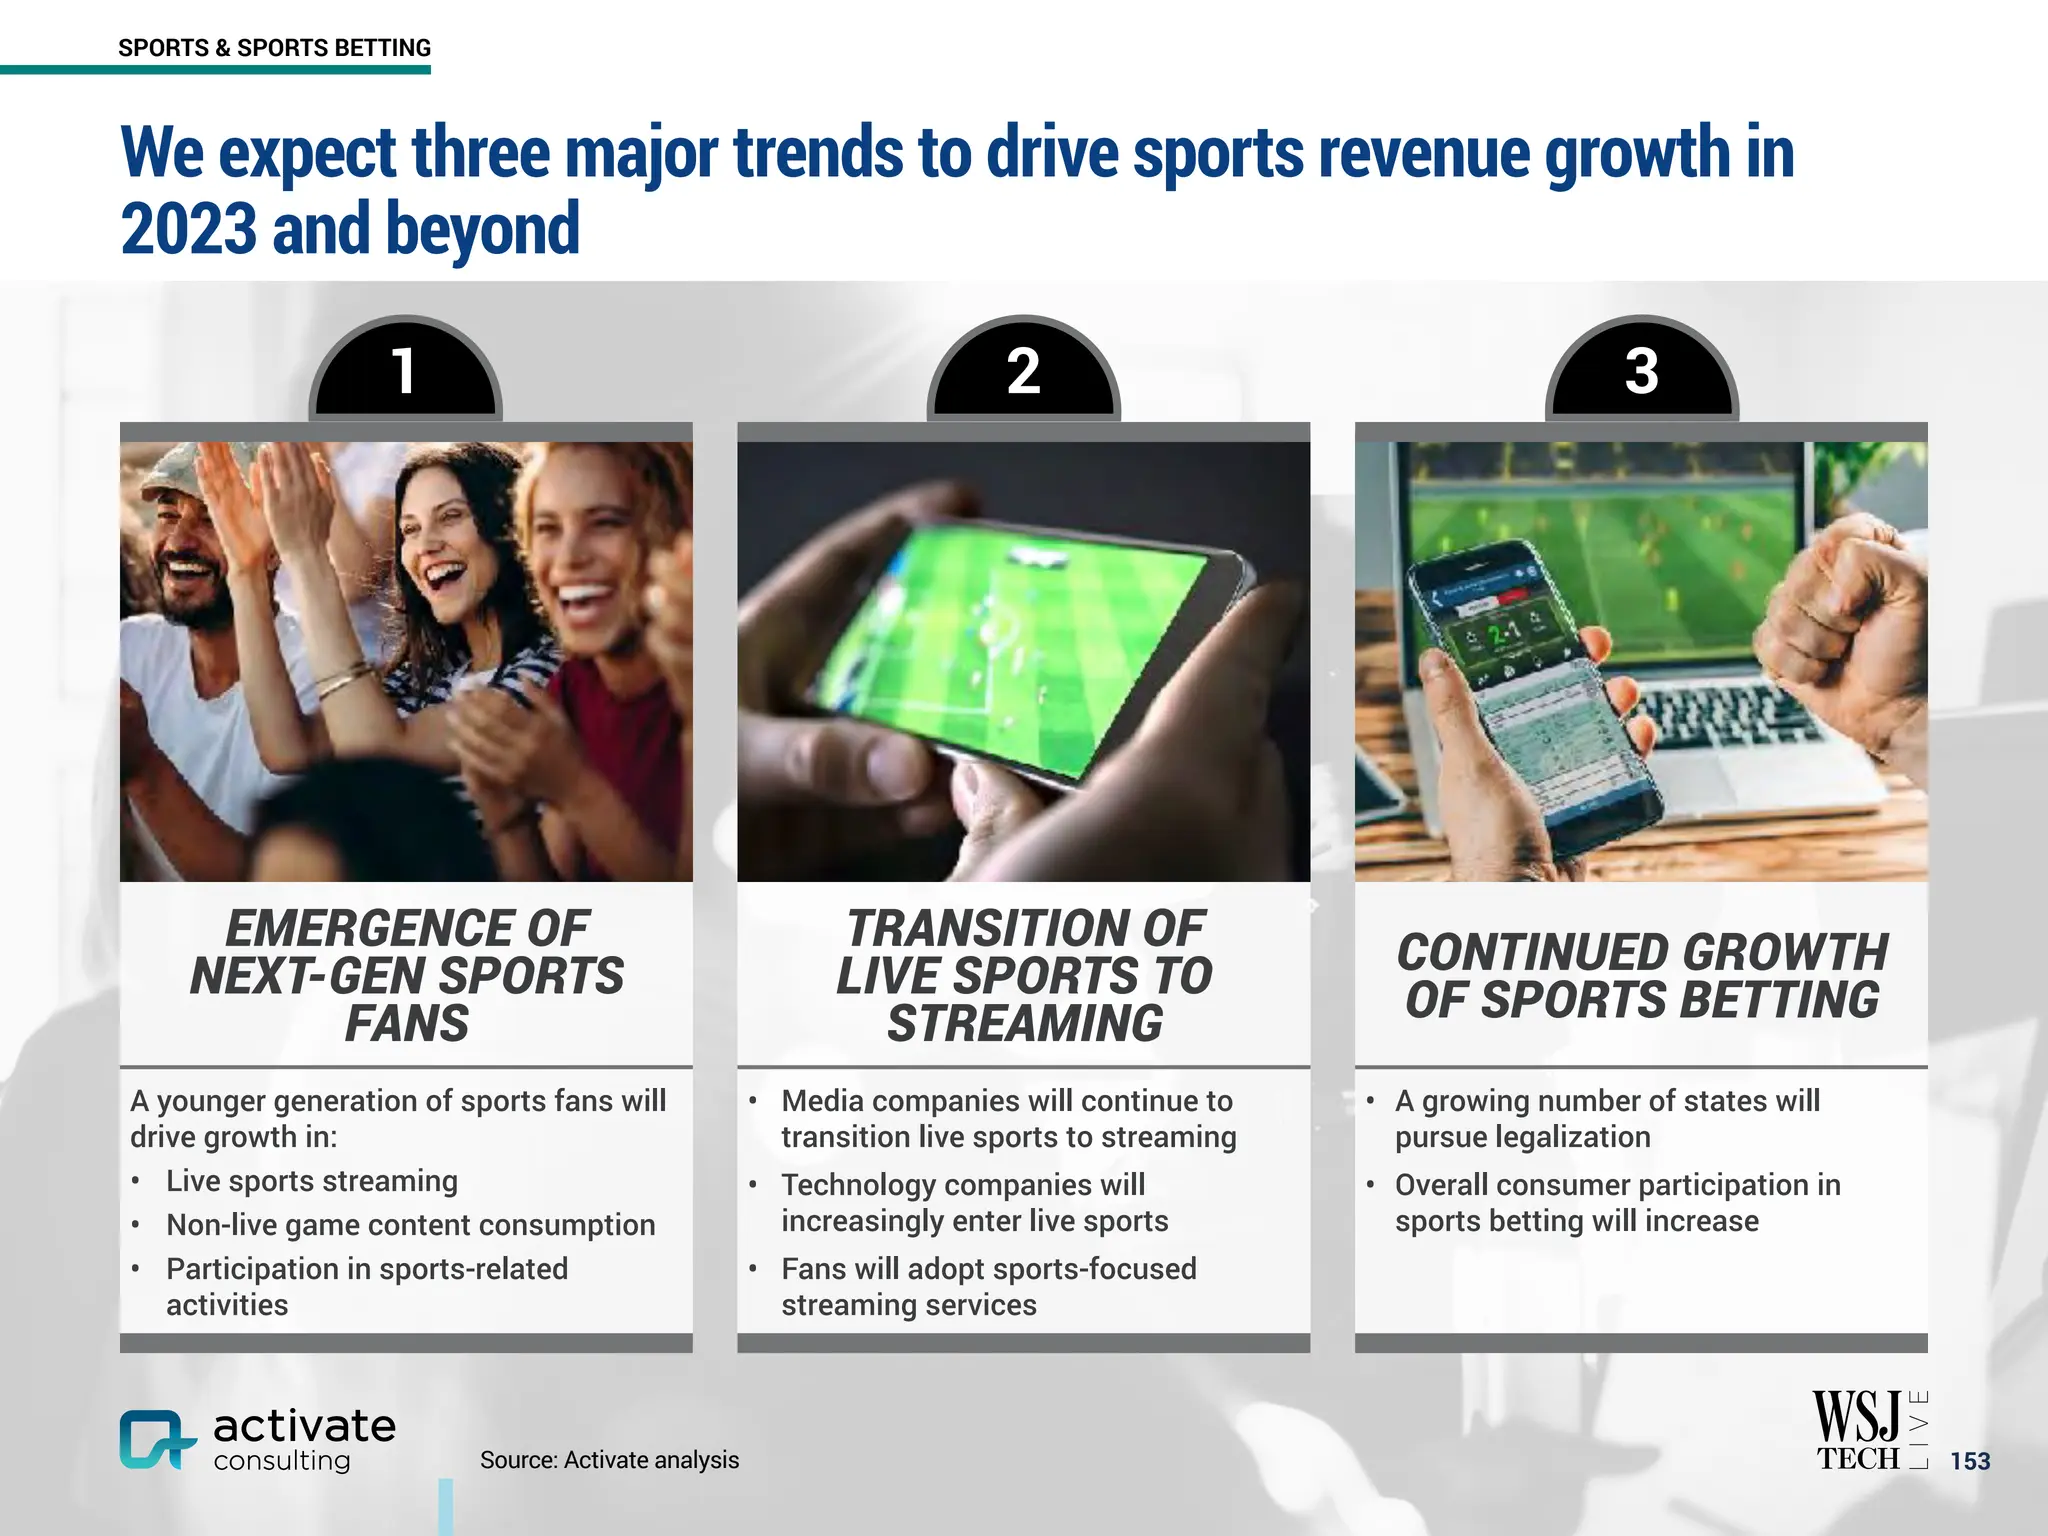
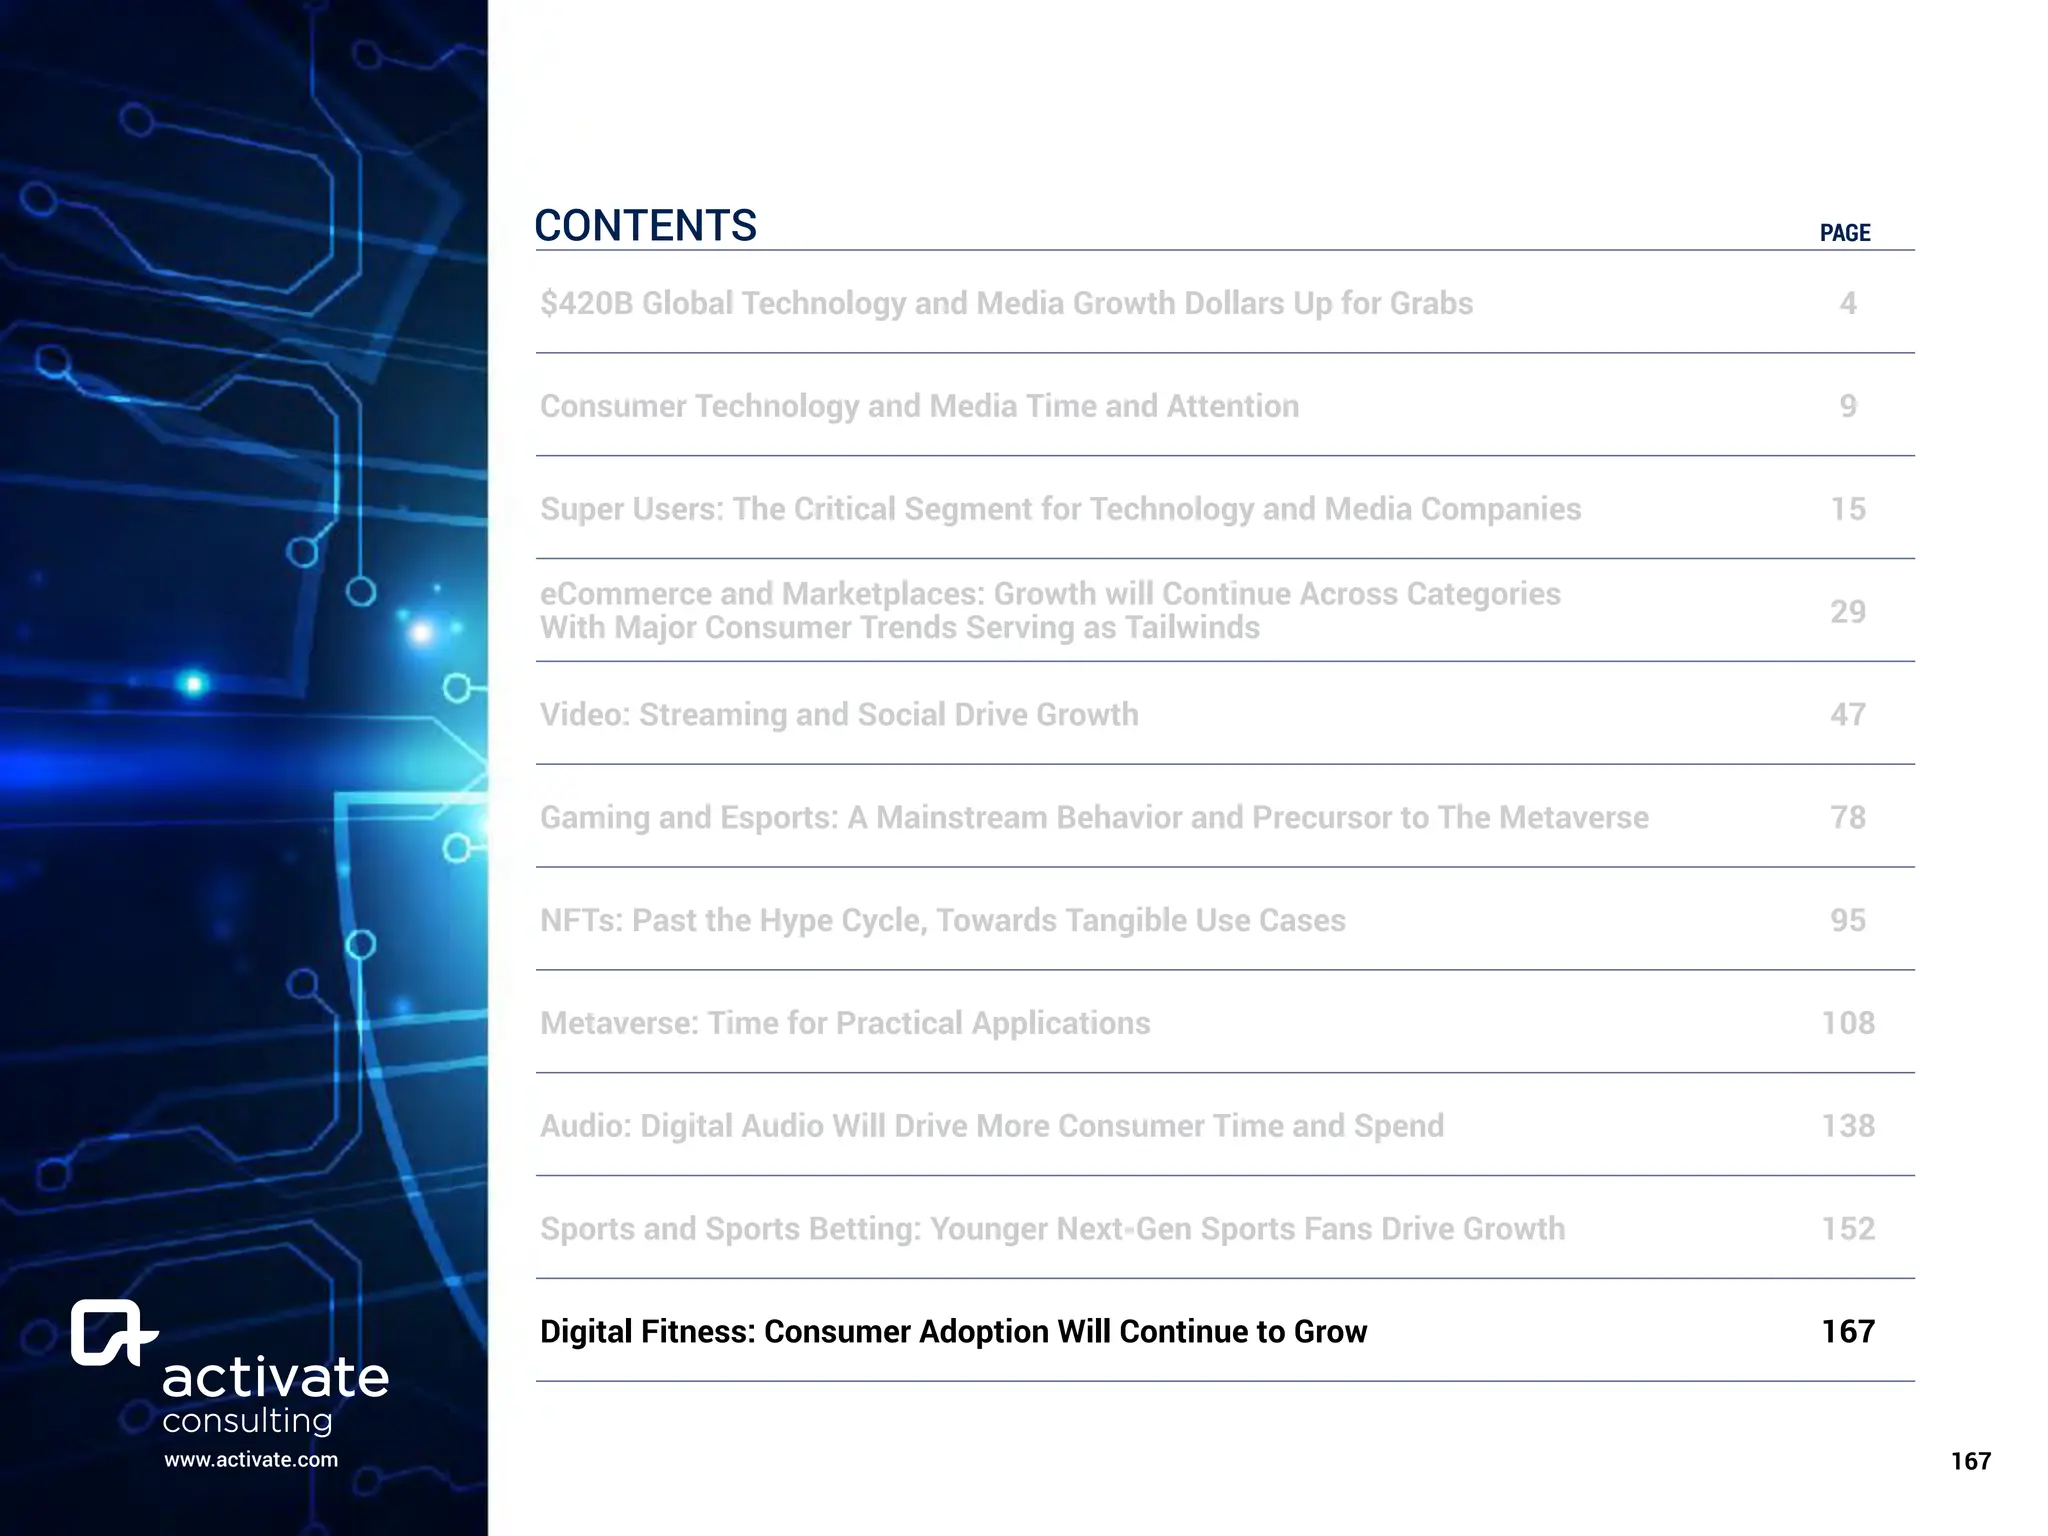
www.activate.com
ACTIVATE TECHNOLOGY & MEDIA
OUTLOOK 2023
www.activate.com 
1
Continued ➔
11 Takeaways from the
Activate Technology & Media Outlook 2023
Time and Attention: User time spent with technology and media jumped during the pandemic by
almost an hour, and that level has largely been sustained. More consumer time will lead to new
opportunities to grow revenues and build new businesses.
eCommerce and Marketplaces: By 2026, we forecast that 20% of retail sales in the U.S. will be
through eCommerce. The growth will be fueled by large eCommerce players as well as category-
focused businesses across all consumer categories. Even high-ticket categories such as automotive,
jewelry, and furniture will accelerate their move online. A number of consumer trends including
interest and adoption of re-commerce, livestream shopping, BNPL (Buy Now, Pay Later), and
shopping memberships will be growth accelerators.
Video: TikTok will be one of the most disruptive forces, not only in video but also in messaging,
search, and eCommerce. Consumer time in streaming and social video will surpass that of television.
The streaming wars will intensify, leading to bundled offerings of streaming services to lower
acquisition costs and churn, increased spend on originals, advertising-supported tiers, and focus on
international growth – all to drive subscriber growth and profitability.
Gaming and Esports: Video gaming is a mainstream behavior appealing to a diverse array of
users, from habitual gamers who embrace gaming as a lifestyle to occasional gamers. Habitual
Gamers will be the earliest adopters of the Metaverse as they already take advantage of
opportunities for immersive activities within games today.
NFTs: The consumer use cases for NFTs will move away from speculative investments into more
tangible use cases, rooted in community, loyalty, and collecting. We estimate that NFT revenues
globally have already exceeded $23B in 2022 and we forecast continued growth in the coming years.
www.activate.com 
2
11 Takeaways from the
Activate Technology & Media Outlook 2023
Metaverse: Most of the foundational elements of the Metaverse are already here in video games.
Over 300M people are spending a large part of their lives in Metaverse virtual worlds. People and
companies cannot stand by and wait for the Metaverse to happen. Now is the time for sustained
development and investment in practical applications. There will be vast opportunities for
companies who can be part of the “interoperability layer.” Super Users are the “Metaverse Natives''
and will lead the way to the Metaverse for gamers and non-gamers alike. To scale, most experiences
will be in 2D as we forecast that global sales of VR and AR headsets will grow to 44M units by 2026.
Audio: Digital audio will lead to more time and spend on music and more advertising for podcasts.
Most people are using multiple music services. TikTok is reshaping how users discover and engage
with music. In-person live event revenue will surpass pre-COVID-19 levels, and virtual live events are
here to stay. Podcasts are one of the fastest growing user behaviors and will reach nearly 160M U.S.
listeners by 2026.
Sports and Sports Betting: Sports fan consumption and engagement is in a transitional period
– a new generation of consumers is emerging, live sports are moving to streaming, and sports
betting is becoming an increasingly prevalent consumer behavior.
Digital Fitness: Consumer adoption of digital fitness technologies has significantly increased
since the COVID-19 outbreak. We forecast that this growth will continue, reaching a combined $30B
in revenue by 2026, up from $23B today. Going forward, virtual reality will enhance digital fitness
experiences in the Metaverse.
Super Users: It will be critical for technology and media companies to identify, reach, and super-
serve Super Users, who account for 22% of the population and heavily over-index on time and dollar
spend. Super Users are “Metaverse Natives,” with over 80% having used a Metaverse platform over
the last 12 months.
Technology and Media Revenues: We forecast over $400B in global spend by 2026, as
consumers continue to spend on technology and media through economic uncertainty.
www.activate.com 
3
CONTENTS PAGE
$420B Global Technology and Media Growth Dollars Up for Grabs 4
Consumer Technology and Media Time and Attention 9
Super Users: The Critical Segment for Technology and Media Companies 15
eCommerce and Marketplaces: Growth will Continue Across Categories
With Major Consumer Trends Serving as Tailwinds 29
Video: Streaming and Social Drive Growth 47
Gaming and Esports: A Mainstream Behavior and Precursor to The Metaverse 78
NFTs: Past the Hype Cycle, Towards Tangible Use Cases 95
Metaverse: Time for Practical Applications 108
Audio: Digital Audio Will Drive More Consumer Time and Spend 138
Sports and Sports Betting: Younger Next-Gen Sports Fans Drive Growth 152
Digital Fitness: Consumer Adoption Will Continue to Grow 167
www.activate.com 
4
CONTENTS PAGE
$420B Global Technology and Media Growth Dollars Up for Grabs 4
Consumer Technology and Media Time and Attention 9
Super Users: The Critical Segment for Technology and Media Companies 15
eCommerce and Marketplaces: Growth will Continue Across Categories
With Major Consumer Trends Serving as Tailwinds 29
Video: Streaming and Social Drive Growth 47
Gaming and Esports: A Mainstream Behavior and Precursor to The Metaverse 78
NFTs: Past the Hype Cycle, Towards Tangible Use Cases 95
Metaverse: Time for Practical Applications 108
Audio: Digital Audio Will Drive More Consumer Time and Spend 138
Sports and Sports Betting: Younger Next-Gen Sports Fans Drive Growth 152
Digital Fitness: Consumer Adoption Will Continue to Grow 167
We forecast significant growth ahead for the global internet and media
industries, with more than $400B in growth between 2022 and 2026

5
TECHNOLOGY AND MEDIA REVENUES
1. “Internet and media revenues” include radio subscription and licensing fees, recorded music, magazine publishing,
newspaper publishing, video games, filmed entertainment, book publishing, TV subscription and licensing fees, internet
access, digital advertising, and traditional advertising on these platforms.
Sources: Activate analysis, Alliance for Audited Media, Dentsu International, eMarketer, GroupM, IBISWorld, Newzoo, Omdia,
Pew Research Center, PricewaterhouseCoopers, Zenith Media
2022E 2026E
$2.7T
$2.3T
$421B
GROWTH DOLLARS
2022E-2026E
CAGR:
4.3%
ACTIVATE
FORECAST
INTERNET AND MEDIA REVENUES1, GLOBAL, 2022E VS. 2026E, USD
Paid content2
Advertising
revenue
Cost of internet
access3
Global advertising spend will drive more than half of the growth

6
INTERNET AND MEDIA REVENUE1 GROWTH BY SEGMENT, GLOBAL, 2022E VS. 2026E, USD
1. “Internet and media revenues” include radio subscription and licensing fees, recorded music, magazine publishing, newspaper
publishing, video games, filmed entertainment, book publishing, TV subscription and licensing fees, internet access, digital
advertising, and traditional advertising on these platforms. 2. “Paid content” includes radio subscription and licensing fees,
recorded music, magazine publishing, book publishing, newspaper publishing, video games, TV subscription and licensing fees,
and filmed entertainment. 3. “Internet access” includes fixed broadband, wireless, and mobile internet access.
Sources: Activate analysis, Alliance for Audited Media, Dentsu International, eMarketer, GroupM, IBISWorld, Newzoo, Omdia,
Pew Research Center, PricewaterhouseCoopers, Zenith Media
2022E 2026E
$223B $101B $97B
$2.3T
$2.7T
30%
35%
35%
29%
33%
38%
ACTIVATE
FORECAST
3.3%
3.0%
6.3%
2022E-2026E
CAGR:
Driving over half of the growth
TECHNOLOGY AND MEDIA REVENUES
Subscription
revenue
Single
transactions
In terms of consumer spending, subscriptions will add $146B in
growth dollars and single transactions will add $51B

7
CONSUMER INTERNET AND MEDIA REVENUE1 GROWTH BY REVENUE MODEL, GLOBAL, 2022E VS. 2026E, USD
1. “Consumer internet and media revenues” include radio subscription and licensing fees, recorded music, magazine
publishing, newspaper publishing, video games, filmed entertainment, book publishing, TV subscription and licensing fees,
and internet access.
Sources: Activate analysis, Alliance for Audited Media, Dentsu International, eMarketer, GroupM, IBISWorld, Newzoo, Omdia,
Pew Research Center, PricewaterhouseCoopers, Zenith Media
2022E 2026E
81%
19%
80%
20%
$1.5T
$1.7T
$146B $51B
ACTIVATE
FORECAST
2022E-2026E
CAGR:
4.2%
2.9%
TECHNOLOGY AND MEDIA REVENUES
1. “Video gaming” excludes spend on hardware and devices.
Sources: Activate analysis, Activate 2022 Consumer Technology & Media Research Study (n = 4,001)
Groceries Household
Products
Cable /
Satellite TV
Music
Services
Video
Gaming1
Video
Streaming
Clothing and
Shoes
Travel/
Vacation
Dining Out

8
31%
35%
37%
59%
52%
64%
62%
65%
76%
48%
49%
52%
68%
69%
70%
73%
78%
85%
% with household income at or above $100K
% with household income less than $100K
TECHNOLOGY & MEDIA SPEND CATEGORIES
Adults expect they would maintain/increase their spend on technology
and media at higher rates than other discretionary spend categories
In response to economic uncertainty, most consumers anticipate they
would maintain their spend on technology and media; adults with household
incomes above $100K are more likely to maintain/increase their spend
EXPECTATION TO MAINTAIN OR INCREASE SPEND IN RESPONSE TO ECONOMIC UNCERTAINTY BY CATEGORY,
U.S., 2022, % ADULTS AGED 18+ WHO CURRENTLY SPEND IN EACH CATEGORY
TECHNOLOGY AND MEDIA REVENUES
www.activate.com 
9
CONTENTS PAGE
$420B Global Technology and Media Growth Dollars Up for Grabs 4
Consumer Technology and Media Time and Attention 9
Super Users: The Critical Segment for Technology and Media Companies 15
eCommerce and Marketplaces: Growth will Continue Across Categories
With Major Consumer Trends Serving as Tailwinds 29
Video: Streaming and Social Drive Growth 47
Gaming and Esports: A Mainstream Behavior and Precursor to The Metaverse 78
NFTs: Past the Hype Cycle, Towards Tangible Use Cases 95
Metaverse: Time for Practical Applications 108
Audio: Digital Audio Will Drive More Consumer Time and Spend 138
Sports and Sports Betting: Younger Next-Gen Sports Fans Drive Growth 152
Digital Fitness: Consumer Adoption Will Continue to Grow 167
Activate’s Attention Clock: Our analysis of consumer technology and
media activity shows that multitasking leads to a 32-hour day for the
average American, with over 13 hours spent using technology and media

10
1. Behaviors averaged over 7 days. Figures do not sum due to rounding. 2 “Other” includes media activities outside of the
listed categories, such as browsing websites, reading, and attending live events.
Sources: Activate analysis, Activate 2022 Consumer Technology & Media Research Study (n = 4,001), Company filings,
Comscore, Conviva, Edison Research, eMarketer, Gallup, GWI, Interactive Advertising Bureau, Music Biz, National Sleep
Foundation, Newzoo, Nielsen, NPD Group, Pew Research Center, U.S. Bureau of Labor Statistics, YouGov
7:00
Other Non-Work
Activities
Cooking & housework, personal
& household care, leisure,
fitness, eating & drinking,
community & other activities
5:20
Work &
Work-Related
Activities
6:35
13:09
Consumer
Technology
& Media
Activity
7:00
5:20
1:53
2:48
5:17
1:33
1:39
32:04
Average Day Length
per Adult
Other2
Messaging &
Social Media
(includes social video)
AVERAGE DAY BY ACTIVITY PER ADULT AGED 18+1, U.S., 2021, HOURS:MINUTES
6:35
Sleep
Video
Audio
Gaming
CONSUMER ATTENTION
Video captures the largest share of consumers’ daily time spent
with technology and media

11
1. Behaviors averaged over 7 days. Values rounded to the nearest whole 15-minute increment. 2. “Other” includes media
activities outside of the listed categories, such as browsing websites, reading, and attending live events.
Sources: Activate analysis, Activate 2022 Consumer Technology & Media Research Study (n = 4,001), Company filings,
Comscore, Conviva, eMarketer, GWI, Music Biz, Newzoo, Nielsen, NPD Group, Pew Research Center, U.S. Bureau of
Labor Statistics
Audio
Gaming
Video
Other2
An average 13-hour technology and media day in 15-minute intervals
Messaging &
Social Media
(includes social video)
AVERAGE DAILY TECHNOLOGY AND MEDIA ATTENTION PER ADULT AGED 18+1, U.S., 2021, 15-MINUTE INTERVALS
CONSUMER ATTENTION
Gaming & Reading
are more likely
to require focus
Social Media & Video
enable a mix of passive
and active engagement
Music & Podcasts
are often consumed
passively
Multitasking is a prevalent behavior among consumers and
explains the growth in time spent with technology and media

12
MULTITASKING1 BEHAVIOR BY ACTIVITY, U.S., 2022, % ADULTS AGED 18+ WHO ENGAGE IN EACH ACTIVITY
1. “Multitasking” is defined as simultaneously doing another activity, such as working, cleaning, cooking, or exercising.
Sources: Activate analysis, Activate 2022 Consumer Technology & Media Research Study (n = 4,001)
Listening
to Music
Listening
to Podcasts
Using
Social Media
Watching
Videos
Playing
Video Games
Reading
Consumers who multitask1 all, almost all, or most of the time when…
61%
68%
21%
34%
40%
46%
Visual-Based Activity
Audio-Based Activity
CONSUMER ATTENTION
The growth in daily time spent with technology and media since the
COVID-19 spike has largely been sustained

13
AVERAGE DAILY TECHNOLOGY AND MEDIA ATTENTION PER ADULT AGED 18+1, U.S., 2019-2022E, HOURS:MINUTES
1. Behaviors averaged over 7 days.
Sources: Activate analysis, Activate 2022 Consumer Technology & Media Research Study (n = 4,001), Company filings,
Comscore, Conviva, eMarketer, GWI, Music Biz, Newzoo, Nielsen, NPD Group, Pew Research Center, U.S. Bureau of
Labor Statistics
2019 2020 2021 2022E
13:05
1.9% 1.2% -0.5%
YOY
CHANGE:
12:24
13:11 13:09
6.3% -0.3%
Growth in time spent with technology and media has been
sustained since the COVID-19 outbreak
ACTIVATE
FORECAST
CONSUMER ATTENTION
We forecast that gaming will lead the growth in consumer daily
time spent with technology and media over the next four years

14
AVERAGE DAILY TECHNOLOGY AND MEDIA ATTENTION PER ADULT AGED 18+1, U.S., 2022E VS. 2026E, HOURS:MINUTES
CONSUMER ATTENTION
1. Behaviors averaged over 7 days. Figures do not sum due to rounding. 2. “Other” includes media activities outside of listed
categories, such as browsing websites, reading, and attending live events.
Sources: Activate analysis, Activate 2022 Consumer Technology & Media Research Study (n = 4,001), Company filings,
Comscore, Conviva, eMarketer, GWI, Music Biz, Newzoo, Nielsen, NPD Group, Pew Research Center, U.S. Bureau of
Labor Statistics
2022E 2026E
13:05 13:15
5:17
2:51
1:47
1:33
1:37
5:14
2:55
1:59
1:33
1:33
Audio
Gaming
Messaging &
Social Media
(includes social video)
Other2
Video
TOTAL TIME:
-1.2%
-0.1%
2.7%
0.6%
-0.2%
0.3%
2022E-2026E
CAGR:
ACTIVATE
FORECAST
www.activate.com 
15
CONTENTS PAGE
$420B Global Technology and Media Growth Dollars Up for Grabs 4
Consumer Technology and Media Time and Attention 9
Super Users: The Critical Segment for Technology and Media Companies 15
eCommerce and Marketplaces: Growth will Continue Across Categories
With Major Consumer Trends Serving as Tailwinds 29
Video: Streaming and Social Drive Growth 47
Gaming and Esports: A Mainstream Behavior and Precursor to The Metaverse 78
NFTs: Past the Hype Cycle, Towards Tangible Use Cases 95
Metaverse: Time for Practical Applications 108
Audio: Digital Audio Will Drive More Consumer Time and Spend 138
Sports and Sports Betting: Younger Next-Gen Sports Fans Drive Growth 152
Digital Fitness: Consumer Adoption Will Continue to Grow 167
Over the next years, the imperative for technology and media companies
will be to identify, reach, and super-serve Super Users – the single group
of power users whose time and spend far surpass those of other users

16
SUPER USERS
Source: Activate analysis
Super Users account for a disproportionately large share of time and
spend across all major media and technology verticals, including video,
gaming, music, podcasts, messaging and social media, eCommerce,
Metaverse, live events, mobile data, and more
The key challenge and opportunity for technology and media companies will be
to successfully target these consumers, and capture their time and spend,
through unique and personalized experiences
Representing 22% of the U.S. population, Super Users spend more
than double the amount of time consuming media as all other users

17
AVERAGE DAILY TIME SPENT WITH MEDIAPER USER1, U.S., 2022E, % ADULTS AGED 18+ / HOURS:MINUTES
SUPER USERS
SUPER
USERS
User Population
18:55
TOTAL HOURS
22%
ALL
OTHER
USERS
9:21
TOTAL HOURS
78%
1. Includes time spent watching video, playing video games, listening to music, listening to podcasts, and using messaging /
social media services. Does not account for multitasking.
Sources: Activate analysis, Activate 2022 Consumer Technology & Media Research Study (n = 4,001), Company filings, Comscore,
Conviva, eMarketer, GWI, Music Biz, Newzoo, Nielsen, NPD Group, Pew Research Center, U.S. Bureau of Labor Statistics
Video
Gaming
Music
Podcasts
Messaging &
Social Media
(includes social video)
Super Users spend substantially more time engaging in all major
media activities than all other users
AVERAGE DAILY TIME SPENT PER USER BY MEDIA TYPE, U.S., 2022E, HOURS:MINUTES
SUPER USERS
Super Users All Other Users
18:55
Total Hours1
9:21
Total Hours1,2
7:01
4:47
4:02
1:09
3:35
1:41
1:48
0:27
2:29
1:18
1. “Total hours” do not account for multitasking. 2. Figures do not sum due to rounding.
Sources: Activate analysis, Activate 2022 Consumer Technology & Media Research Study (n = 4,001), Company filings,
Comscore, Conviva, eMarketer, GWI, Music Biz, Newzoo, Nielsen, NPD Group, Pew Research Center, U.S. Bureau of
Labor Statistics 
18
1.5x
3.5x
2.1x
4.1x
1.9x
SUPER USERS
ALL OTHER USERS
WATCHING
VIDEOS
PLAYING
VIDEO GAMES
LISTENING
TO MUSIC
LISTENING
TO PODCASTS
USING
SOCIAL MEDIA
SUPER
USERS
ALL
OTHER
USERS
Across all major media activities, Super Users are significantly
more likely to multitask, enabling them to spend more overall time
with media

19
MULTITASKING1 BEHAVIOR BY MEDIA ACTIVITY, U.S., 2022, % ADULTS AGED 18+ WHO ENGAGE IN EACH ACTIVITY
1. “Multitasking” is defined as simultaneously doing another activity, such as working, cleaning, cooking, or exercising.
Sources: Activate analysis, Activate 2022 Consumer Technology & Media Research Study (n = 4,001)
SUPER USERS
CONSUMERS WHO MULTITASK1 ALL, ALMOST ALL, OR MOST OF THE TIME WHEN…
60% 52% 78% 69% 66%
33% 24% 64% 53% 38%
Commensurate with the amount of time they spend with media,
Super Users account for a disproportionately high share of dollar
spend across video, gaming, and music
MONTHLY DOLLAR SPEND BY MEDIA TYPE,
U.S., 2022E, % ADULTS AGED 18+ / % TOTAL SPEND BY MEDIA TYPE / USD PER USER
SUPER USERS
78%
22%
ALL
OTHER
USERS
User
Population
Total
Video Spend1
Total
Gaming Spend2
Total
Music Spend3
1. Includes money spent on all videos and video services, including traditional/virtual Pay TV, video streaming subscription
services, and video purchases/rentals. 2. Includes money spent on video games and other video gaming purchases (e.g. in-
app purchases, video gaming subscription services) across all devices. 3. Includes money spent on music and music services.
Sources: Activate analysis, Activate 2022 Consumer Technology & Media Research Study (n = 4,001), eMarketer, Goldman
Sachs, Grand View Research, IFPI, Newzoo, Omdia, PricewaterhouseCoopers, Recording Industry Association of America,
SiriusXM, Statista
SUPER
USERS
74%
20%
80%
20%
80%
56%
44%

20
$27/
USER
$4/
USER
$1/
USER
$21/
SUPER USER
$49/
SUPER USER
$76/
SUPER USER
Super Users are younger, more affluent, and have a higher level of
education than all other users

21
SUPER USERS
Are aged 18-34
Have a household income of
$100K or greater
Are the sole or primary earner
for their household
Hold an associate
degree or higher
43%
57%
26%
24%
54%
80%
47%
52%
% Super Users % All Other Users
Sources: Activate analysis, Activate 2022 Consumer Technology & Media Research Study (n = 4,001), U.S. Census Bureau
USER DEMOGRAPHICS, U.S., 2022, % ADULTS AGED 18+
Super Users All Other Users
23%
14%
66%
85%
Super Users are highly connected; the vast majority subscribe to
unlimited mobile data plans
MOBILE DATA PLAN ACCESS, U.S., 2022, % ADULTS AGED 18+
SUPER USERS
1. “Unlimited” as reported by consumers.
Sources: Activate analysis, Activate 2022 Consumer Technology & Media Research Study (n = 4,001)
11%
No mobile data plan
Mobile data plan
with data limit
Unlimited1
mobile data plan

22
1%
Enjoy keeping informed on trends and
news about the latest technology
and media products/services
Enjoy buying/using new technology and media
products/services before anyone else they know
Enjoy recommending technology and media
products/services to others
Feel that they can better express
themselves when online
Feel that it is easier to socialize
and make new friends online
Feel comfortable sharing data with technology
and media companies in exchange for more
personalized/relevant recommendations and ads
Super Users are in the vanguard of technology and media adoption; the
majority are brand advocates, highly attuned to new products/services, and
comfortable expressing themselves and sharing their personal data online

23
CONSUMER ATTITUDES, U.S., 2022, % ADULTS AGED 18+
Sources: Activate analysis, Activate 2022 Consumer Technology & Media Research Study (n = 4,001)
SUPER USERS
18%
25%
25%
26%
21%
32%
63%
69%
68%
71%
70%
75%
% Super Users % All Other Users
EARLY ADOPTER
ATTITUDES
DIGITAL-FIRST
ATTITUDES

24
ECOMMERCE SPEND, U.S., 2022,
% ADULTS AGED 18+ / % TOTAL ECOMMERCE SPEND
Sources: Activate analysis, Activate 2022 Consumer Technology & Media Research Study (n = 4,001)
Within eCommerce, Super Users account for the bulk of total spend
and also over-index on emerging eCommerce behaviors
Total
eCommerce Spend
User
Population
SUPER USERS
78%
22%
40%
60%
EMERGING ECOMMERCE BEHAVIORS
IN THE LAST 12 MONTHS, U.S., 2022,
SUPER USERS INDEXED TO ALL OTHER USERS
As likely to have bought a
product directly through a
social media website/app
As likely to have bought a
product through a livestream
shopping event
As likely to have used an
AR-powered virtual try-on
or visualization feature
(e.g. to test clothing, footwear,
accessories, beauty products, furniture,
home goods, appliances)
Super Users over-index on several
emerging eCommerce activities
3.1x
SOCIAL
COMMERCE
6.5x
LIVESTREAM
SHOPPING
5.5x
VIRTUAL
TRY-ON
ALL
OTHER
USERS
SUPER
USERS
Super Users are early adopters of both cryptocurrency and NFTs

25
SUPER USERS
1. “Cryptocurrency participation” is defined as buying, receiving, mining, or selling cryptocurrency. 2. “NFT participation”
is defined as researching/discussing, browsing, bidding for, purchasing, displaying, selling, or creating NFTs.
Sources: Activate analysis, Activate 2022 Consumer Technology & Media Research Study (n = 4,001), Activate 2022
Metaverse & NFT Consumer Research Study (n = 3,078)
CRYPTOCURRENCY PARTICIPATION1 IN THE LAST 12
MONTHS, U.S., 2022, % ADULTS AGED 18+
NFT PARTICIPATION2 IN THE LAST 12 MONTHS,
U.S., 2022, % ADULTS AGED 18+
Super Users All Other Users
12%
60%
Super Users All Other Users
9%
49%
+40pp
+48pp
Super Users are the pioneers of the Metaverse, with over 80%
having used a Metaverse platform in the last 12 months

26
USAGE OF METAVERSE PLATFORMS1 IN THE LAST 12 MONTHS, U.S., 2022, % ADULTS AGED 18+
1. “Metaverse platforms” are defined as platforms with immersive virtual worlds, within which consumers can explore with a
personalized character/avatar, interact with other users, and participate in a range of activities (e.g. online concerts, online
games, online work meetings).
Sources: Activate analysis, Activate 2022 Consumer Technology & Media Research Study (n = 4,001)
SUPER USERS
Super Users All Other Users
21%
81%
EXAMPLE
METAVERSE PLATFORMS1
CREATION ACTIVITIES
IN THE METAVERSE
Creating/personalizing
a virtual character/avatar or virtual items
Creating/personalizing
virtual places or maps
SOCIAL ACTIVITIES
IN THE METAVERSE
Attending live performances,
sporting events, or esports events
Socializing with friends/family
or meeting new people
Traveling to virtual versions
of real-world locations
Attending educational classes,
work-related meetings, or networking events
TRANSACTIONAL
ACTIVITIES
IN THE METAVERSE
Purchasing or selling virtual goods
Purchasing or selling physical goods
Investing, lending, or borrowing money
Going forward, Super Users are interested in using the Metaverse
for a broad range of activities

27
INTEREST IN PARTICIPATING IN SELECT METAVERSE ACTIVITIES IN THE NEXT 12 MONTHS, U.S., 2022, % ADULTS AGED 18+
Sources: Activate analysis, Activate 2022 Consumer Technology & Media Research Study (n = 4,001)
SUPER USERS
10%
17%
15%
19%
21%
20%
25%
14%
20%
57%
69%
71%
66%
71%
72%
73%
67%
76%
% Super Users % All Other Users
EXTREMELY OR VERY INTERESTED IN…
CONCERTS OR
MUSIC FESTIVALS
LIVE PROFESSIONAL
SPORTING EVENTS
LIVE COLLEGE
SPORTING EVENTS
COMEDY SHOWS
LIVE ESPORTS
EVENTS
THEATER
PERFORMANCES
AVERAGE NUMBER OF LIVE EVENTS1 ATTENDED IN THE LAST 12 MONTHS
15%
6%
12%
13%
14%
20%
46%
46%
48%
49%
52%
56%
Super Users will also usher in the return of live in-person events

28
INTENT TO ATTEND MORE LIVE EVENTS1 IN THE NEXT 12 MONTHS THAN IN THE LAST 12 MONTHS,
U.S., 2022, % ADULTS AGED 18+
1. Includes live events in large venues (e.g. theaters, stadiums, festival grounds).
Sources: Activate analysis, Activate 2022 Consumer Technology & Media Research Study (n = 4,001)
1.3
4.4 1.1
4.2 0.9
4.0 0.2
2.2
0.8
3.8 1.0
3.8
% Super Users % All Other Users
SUPER USERS
www.activate.com 
29
CONTENTS PAGE
$420B Global Technology and Media Growth Dollars Up for Grabs 4
Consumer Technology and Media Time and Attention 9
Super Users: The Critical Segment for Technology and Media Companies 15
eCommerce and Marketplaces: Growth will Continue Across Categories
With Major Consumer Trends Serving as Tailwinds 29
Video: Streaming and Social Drive Growth 47
Gaming and Esports: A Mainstream Behavior and Precursor to The Metaverse 78
NFTs: Past the Hype Cycle, Towards Tangible Use Cases 95
Metaverse: Time for Practical Applications 108
Audio: Digital Audio Will Drive More Consumer Time and Spend 138
Sports and Sports Betting: Younger Next-Gen Sports Fans Drive Growth 152
Digital Fitness: Consumer Adoption Will Continue to Grow 167
2022E 2026E
$32.0T
$25.8T $9.4T
$3.6T
$5.8T
$2.6T
$22.6T
$20.0T
$28
$26
Global eCommerce will reach $9.4T in 2026, continuing to grow
faster and add more absolute dollars than physical retail post-
pandemic

30
RETAIL SALES1 BY CHANNEL, GLOBAL, 2022E VS. 2026E, TRILLIONS USD
ECOMMERCE & MARKETPLACES
23% 29%
eCommerce Share of
Total Retail Sales
eCommerce
Physical Retail
13%
3%
6%
2022E-2026E
CAGR:
1. Excludes travel and event tickets, food and drink services, and vice goods and activities.
Sources: Activate analysis, Digital Commerce 360, eMarketer, Research and Markets
ACTIVATE
FORECAST
The leaders in eCommerce are companies based in APAC and the U.S.

31
SHARE OF ONLINE GROSS MERCHANDISE VOLUME (GMV)BY COMPANY1, GLOBAL, 2021, % TOTAL ONLINE GMV
37%
13%
7%
10%
24%
Rest of Web2
PINDUODUO
2021 TOTAL
ONLINE GMV:
$5.1T 2%
2%
1%
1%
1%
1%
Share of Total Online
GMV for Top APAC-Based
Companies:
44%
Share of Total Online
GMV for Top U.S.-Based
Companies:
18%
1. Figures do not sum to 100% due to rounding. 2. All of online gross merchandise volume not covered by top 10 companies.
Sources: Activate analysis, Company filings, Company press releases, Company sites, Digital Commerce 360, eMarketer,
Internal Revenue Service
ECOMMERCE & MARKETPLACES
11%
12%
15%
28%
35%
43%
China U.K. South
Korea
U.S. Japan Germany
$6.1T $0.7T $0.5T $6.6T $1.4T $1.1T
China has been at the vanguard of eCommerce, as it represents
over 50% of total eCommerce sales worldwide

32
Sources: Activate analysis, Business Insider, CBRE Group, Digital Commerce 360, eMarketer, Forbes, Internal Revenue Service,
Jefferies, J.P
. Morgan, Morning Consult, Quartz, Schroders, Statista, The Wall Street Journal, World Bank
ECOMMERCE SHARE OF RETAIL SALES BY
COUNTRY, GLOBAL, 2021, % TOTAL RETAIL
SALES IN EACH COUNTRY
SHARE OF ONLINE GROSS MERCHANDISE
VOLUME (GMV) BY COUNTRY, GLOBAL,
2021, % TOTAL ONLINE GMV
2021 TOTAL
ONLINE GMV:
$5.1T
China
51%
U.S.
19%
U.K.
5%
3%
Japan
3%
Germany
2%
South Korea
17%
Rest of World
- Consumer preference
for online vs. in-store
shopping
- Adoption of digital
wallets and mobile
payments
- Usage of platform
experiences
(e.g. WeChat)
RETAIL SALES BY COUNTRY
China leads in both total retail sales as well as
eCommerce share of retail sales
As such, China is a dominant force in eCommerce,
with over 50% share of worldwide online GMV
Going forward, drivers of China’s
eCommerce growth could propel
growth in other major markets,
particularly the U.S.
ECOMMERCE
GROWTH DRIVERS
ECOMMERCE & MARKETPLACES
ECOMMERCE SHARE OF
TOTAL RETAIL SALES
We forecast that eCommerce in the U.S. will reach $1.7T by 2026,
accounting for 20% of total retail sales

33
RETAIL ECOMMERCE SALES, U.S., 2019 VS. 2022E VS. 2026E, TRILLIONS USD
2019 2022E 2026E
$1.7T
$1.1T
$0.6T
Sources: Activate analysis, Company filings, Company press releases, Company sites, Digital Commerce 360, eMarketer,
Internal Revenue Service, Statista
11% 20%
15%
2019-2022E
CAGR:
21%
2022E-2026E
CAGR:
12%
ACTIVATE
FORECAST
ECOMMERCE & MARKETPLACES

34
CLOTHING, SHOES,
ACCESSORIES
BEAUTY &
PERSONAL CARE
JEWELRY
MASS ONLINE RETAILERS
GROCERIES HOUSEHOLD
PRODUCTS
There will be large category-focused eCommerce businesses selling through their
own online stores in addition to mass online retailers
FURNITURE ELECTRONICS SPORTING GOODS TOYS & GAMES
HOME IMPROVEMENT
& DECOR AUTOMOTIVE
CATEGORY-FOCUSED RETAILERS
Note: As of Oct. 2022.
Sources: Activate analysis, Andreessen Horowitz, Comscore, eMarketer, Forbes, Business Insider, Statista
ECOMMERCE & MARKETPLACES
FUNCTION DESCRIPTION EXAMPLE COMPANIES
Storefront
Creation
Providers for eCommerce website creation
and hosting capabilities
Inventory
Management
and Fulfillment
Tools essential to tracking and managing
inventory (e.g. location, amount, current mix)
as well as delivering products (e.g. carriers,
delivery and shipping options)
Payment
Services
Providers enabling eCommerce purchasing
through first- and third-party gateways, POS
app and hardware integration, and payment
and financing plans
Customer Service,
Relationship
Management,
and Loyalty
Tools and services dedicated to tracking
customer relationships and communicating
with customers
Marketing
and Sales
Effectiveness
Solutions with capabilities that utilize data
to effectively reach consumers across
channels (e.g. analytics, sales channels,
pricing, merchandising)
Back-end
Solutions
Solutions enabling eCommerce sales,
including cloud storage/hosting, content
delivery, and accounting software
eCommerce enablement solutions, including storefront and site
creation tools, will fuel the growth of category-focused players

35
ECOMMERCE ENABLEMENT
REVENUE, GLOBAL, 2022E VS.
2026E, BILLIONS USD
2022E 2026E
$8.7B
$7.3B
2022E-2026E
CAGR:
4.6%
MAJOR
CROSS-
FUNCTION
LEADERS
Sources: Activate analysis, Apps Run The World, BigCommerce, Company sites, Salesforce, Statista
ECOMMERCE & MARKETPLACES
ESSENTIAL ITEMS
CONSUMER MONETARY SPEND PER ONLINE PURCHASE
CONSUMER
TIME/EFFORT
SPENT
Essential product categories will continue to lead eCommerce growth
as they require less consideration before purchase decisions and
continue to exhibit growing online penetration

36
Size of bubble represents 2022E
share of total product category
retail sales from eCommerce
HIGH
LOW
HIGH
LOW
1.7x vs. 20171
Furniture
1.1x vs. 20171
Jewelry
1.8x vs. 20171
Clothing, Shoes,
Accessories
2.1x vs. 20171
Household Products
3.7x vs. 20171
Groceries
PRODUCT CATEGORY SEGMENTATION FOR ONLINE PURCHASES
1.3x vs. 20171
Auto & Parts
Beauty &
Personal Care
1.7x vs. 20171
1. Represents the share of total category retail sales from eCommerce in 2022E indexed to 2017.
Sources: Activate analysis, Activate 2022 Consumer Technology & Media Research Study (n = 4,001), Company press releases,
Company sites, eMarketer, Forrester, Statista
ECOMMERCE & MARKETPLACES
As one of the major retail categories with low eCommerce penetration today,
we forecast that by 2026, revenue from cars purchased online and fulfilled via
delivery will reach over $200B and represent over 10% of total car purchases

37
CAR PURCHASES COMPLETED ONLINE1 AND FULFILLED VIA DELIVERY,
U.S., 2021 VS. 2026E, % TOTAL CAR PURCHASES2
Total Car Purchases
Completed Online and
Fulfilled via Delivery
2%
10%-15%
0.9M
Sales from car
purchases completed
online and fulfilled via
delivery will surpass
$200B
annually by 2026
6M-9M
2026E
2021
1. “Completed online” is defined as having set up the full car deal online, including the down payment, monthly payment, and
trade-in. 2. “Total car purchases” include both new and used cars.
Sources: Activate analysis, Company filings, Company press releases, Company sites, Comscore, Cox Automotive, eMarketer,
Federal Reserve Bank of St. Louis, IBISWorld, IHS Markit, Khaveen Investments, U.S. Bureau of Economic Analysis, U.S. Census
Bureau, Wells Fargo
ACTIVATE
FORECAST
ECOMMERCE & MARKETPLACES
Despite rising prices due to inflation, over half of online shoppers
have increased or maintained online purchases across essential
categories

38
CHANGE IN ONLINE PURCHASING BEHAVIOR IN RESPONSE TO RECENT PRICE INCREASES BY CATEGORY,
U.S., 2022, % ADULTS 18+ WHO HAVE SHOPPED FOR PRODUCTS ONLINE IN EACH CATEGORY IN THE LAST 12 MONTHS
ESSENTIAL ITEMS
Groceries Household Products Beauty &
Personal Care
Clothing, Shoes,
Accessories
Furniture Jewelry
13%
13%
10%
12%
11%
17%
34%
35%
40%
49%
53%
53%
Have
increased
purchases
Have
maintained
purchases
Sources: Activate analysis, Activate 2022 Consumer Technology & Media Research Study (n = 4,001)
ECOMMERCE & MARKETPLACES
In response to the recent price increases, consumers are choosing
to use online channels to compare prices and find deals and
promotions

39
ACTIONS TAKEN WHILE SHOPPING ONLINE IN RESPONSE TO RECENT PRICE INCREASES,
U.S., 2022, % ADULTS AGED 18+ WHO HAVE SHOPPED ONLINE IN THE LAST 12 MONTHS
Visited multiple online stores
to find the best price
Looked for or waited for discounts and
promotions before making a purchase
Bought in larger quantities
to receive a discount
Bought from used/refurbished item
marketplaces (e.g. eBay, Facebook Marketplace)
Used “Buy Now, Pay Later” options
(e.g. Affirm, Afterpay, Klarna)
Signed up for a paid shopping program
membership (e.g. Amazon Prime, Walmart+, Costco)
Took on debt to purchase a product 7%
11%
11%
12%
16%
32%
47%
Sources: Activate analysis, Activate 2022 Consumer Technology & Media Research Study (n = 4,001)
Re-commerce is a growing trend addressing
consumers seeking sustainability and savings
ECOMMERCE & MARKETPLACES
Intend to buy through
re-commerce marketplaces
in the next 12 months
88M
U.S. CONSUMERS
Intend to continue to buy through
re-commerce marketplaces
in the next 12 months
93M
U.S. CONSUMERS
Re-commerce is one of the major growth drivers of eCommerce,
with high levels of current and expected consumer usage

40
USAGE OF ONLINE RE-COMMERCE MARKETPLACES1 FOR BUYING IN THE LAST 12 MONTHS, U.S., 2022,% ADULTS AGED 18+
EXAMPLE
RE-COMMERCE MARKETPLACES
62%
have not bought
from an online
re-commerce
marketplace1
38%
have bought
from an online
re-commerce
marketplace1
1. “Online re-commerce marketplaces” are defined as online platforms where previously owned items (e.g. clothing, accessories,
or other goods) can be purchased and sold.
Sources: Activate analysis, 2022 Activate Re-Commerce Marketplace Consumer Research Study (n = 2,026), U.S. Census Bureau
ECOMMERCE & MARKETPLACES
Livestream shopping sales will continue to increase as it becomes a
popular way for major retailers to engage consumers through
eCommerce

41
RETAILERS ARE USING THEIR OWN PLATFORMS, SOCIAL
MEDIA PLATFORMS, AND THIRD-PARTY PLATFORMS TO
ENGAGE CONSUMERS THROUGH LIVESTREAM SHOPPING
MAJOR RETAILERS USING
LIVESTREAM SHOPPING
2020 2022E 2026E
$55B
$17B
$5B
LIVESTREAM ECOMMERCE SALES,
U.S., 2020 VS. 2022E VS. 2026E, BILLIONS USD
2020-2026E
CAGR:
49%
Sources: Activate analysis, Company sites, eMarketer
ECOMMERCE & MARKETPLACES
2021 2022E 2023E 2024E 2025E 2026E
$143B
$128B
$112B
$95B
$76B
$43B
1.8%
1.7%
1.5%
1.3%
1.1%
0.7%
1.8%
1.7%
1.5%
1.3%
1.1%
0.7%

42
EXAMPLE BUY NOW,
PAY LATER SERVICES
USAGE OF BUY NOW, PAY LATER (BNPL) SERVICES WHEN
SHOPPING ONLINE, U.S., 20211 VS. 20222, % ADULTS 18+
BUY NOW, PAY LATER (BNPL) SALES, U.S., 2021-2026E,
BILLIONS USD / % TOTAL RETAIL SALES
35%
29%
20211 20222
BNPL Sales as a % of Total Retail Sales
2021-2026E
CAGR:
27%
50%
of consumers
are likely3
to use BNPL
in the next
12 months
1. Reflects Sept. 2020-Aug. 2021. 2. Reflects Sept. 2021-Aug. 2022. 3. “Likely” is defined as extremely, very, somewhat, or
slightly likely.
Sources: Activate analysis, Activate 2021 Consumer Technology & Media Research Study (n = 4,018), Activate 2022 Metaverse
& NFT Consumer Research Study (n = 3,078), eMarketer, Statista
The growth of Buy Now, Pay Later adoption will fuel eCommerce
sales
ECOMMERCE & MARKETPLACES
Household Products
(e.g. cleaning supplies,
paper towels)
Clothing, Shoes, Accessories
(e.g. dresses, sneakers, sunglasses)
Beauty & Personal Care
(e.g. makeup, deodorant)
Groceries
(e.g. cereal, eggs)
Jewelry
(e.g. rings, watches)
Furniture
(e.g. couch, bed)
When consumers are looking for specific products to purchase,
Amazon is the go-to online channel to begin their search

43
CHANNELS USED TO START SEARCHES FOR SPECIFIC PRODUCTS ONLINE BY CATEGORY1, U.S., 2022,
% ADULTS AGED 18+ WHO HAVE SHOPPED FOR PRODUCTS ONLINE IN EACH CATEGORY IN THE LAST 12 MONTHS
32%
27%
21%
19%
22%
16%
5%
6%
7%
8%
6%
8%
13%
11%
25%
18%
11%
23%
33%
36%
36%
41%
44%
45%
2%
3%
4%
4%
4%
1%
1%
2%
1%
2%
1%
2%
2%
3%
1%
4%
12%
7%
3%
6%
10%
8%
Website/app Website/app Website/app
Membership
warehouse club
website/app
(e.g. Costco.com,
Samsclub.com,
BJs.com)
Specific brand
website/app
(e.g. Nike.com,
Apple.com)
Used/refurbished
item marketplace
website/app
(e.g. eBay, Facebook
Marketplace)
Social media
website/app
(e.g. checking an
influencer’s Instagram
for recommendations)
Other
(e.g. online
search engine,
asking a friend)
2% 1%
1. Figures do not sum to 100% due to rounding.
Sources: Activate analysis, Activate 2022 Consumer Technology & Media Research Study (n = 4,001)
ECOMMERCE & MARKETPLACES
Amazon Prime drives loyalty for Amazon as a platform; consumer demand for
shopping program memberships goes well beyond Amazon to a broader set of
providers

44
1. “Paid shopping program memberships” are defined as paid loyalty program memberships providing members exclusive
access to benefits (e.g. Amazon Prime, Walmart+, Uber One).
Sources: Activate analysis, Activate 2022 Consumer Technology & Media Research Study (n = 4,001), Activate COVID-19
Consumer Technology & Media Study May 2021 (n = 2,913), Company sites
IMPORTANCE OF AMAZON PRIME BENEFITS,
U.S., 2021, % ADULTS AGED 18+ WHOSE
HOUSEHOLD PAYS FOR AMAZON PRIME
INTENT TO CONTINUE PAYING FOR PAID SHOPPING PROGRAM MEMBERSHIPS1
IN THE NEXT 12 MONTHS, U.S., 2022, % ADULTS AGED 18+ WHOSE HOUSEHOLD
CURRENTLY PAYS FOR EACH PAID SHOPPING PROGRAM MEMBERSHIP1
41%
45%
48%
48%
54%
58%
62%
74%
79%
81%
87%
93%
(Club, Plus)
(Inner Circle Membership,
Perks Rewards Membership)
(from DoorDash, Caviar)
(from Bed Bath & Beyond,
previously BEYOND+)
96%
of Amazon Prime
members find at least
one benefit provided
by the membership
extremely or very
important
(Gold Star, Executive)
ECOMMERCE & MARKETPLACES
When it comes to paid shopping program membership benefits,
free delivery is considered the most important

45
TOP MEMBERSHIP BENEFITS1 INFLUENCING SUBSCRIPTION TO A PAID SHOPPING PROGRAM MEMBERSHIP2, U.S., 2022,
% ADULTS AGED 18+ WHOSE HOUSEHOLD CURRENTLY PAYS FOR AT LEAST ONE PAID SHOPPING PROGRAM MEMBERSHIP2
4%
7%
7%
8%
8%
9%
13%
14%
24%
33%
36%
66%
Free delivery Free returns Special
discounts
Cash back
rewards
(e.g. 2% cash
back on all your
purchases from
a store)
Ability to
earn points
that can be
redeemed for
rewards
(e.g. travel,
accessories)
Physical
retail
locations
near where
I live
(e.g. Costco
store near
my home)
Exclusive
products
(i.e. products
only available
to members)
Flexible
payment
options
(i.e. Buy Now,
Pay Later)
Premium
customer
service
(e.g. dedicated
phone line,
24/7 support)
Entertainment-
related
benefits
(e.g. Prime
Video included
with Amazon
Prime
membership)
Faster
access
to new
products
(e.g. ability to
pre-order
products)
Ability to use
a mobile app
for in-store
check-out
(e.g. Scan
and Go)
1. Consumers were asked to select up to 3 top reasons. 2. “Paid shopping program memberships” are defined as paid loyalty
program memberships providing members exclusive access to benefits (e.g. Amazon Prime, Walmart+, Uber One).
Sources: Activate analysis, Activate 2022 Consumer Technology & Media Research Study (n = 4,001)
ECOMMERCE & MARKETPLACES
2019 2022E 2026E
$85B
$41B
$13B
$64B
$31B
$10B

46
RETAIL MEDIA NETWORK ADVERTISING SPEND1,
U.S., 2019 VS. 2022E VS. 2026E, BILLIONS USD
First-Party
Customer
Loyalty Data
Enables measurement of both offline and online
sales, allowing personalized, targeted
advertising for brands with the ability to
activate against highly customized segments
Access to Scaled
Marketplace
Audiences
Provides large, engaged audiences who can be
targeted with relevant advertisements through
an effective medium (i.e. able to drive shopper
behavior as close as possible to point of sale)
Accurate Sales
Attribution
Metrics
Measures impact of advertisements through
direct links to customer purchases, allowing
ongoing view of campaign performance and
mid-campaign optimization
Partnerships
with CTV
Publishers
Allows upper-funnel brand advertising,
facilitated through partnerships providing
access to CTV inventory (e.g. Kroger & Roku,
Target & Disney)
EMERGING RETAIL MEDIA NETWORKS
Rest of Web
74%
46%
2019-2022E
CAGR:
2022E-2026E
CAGR:
35%
19%
20%
38%
46%
18%
$3B
$7B
$0.5B $3B
$13B
$8B
FEATURES DRIVING THE VALUE PROPOSITION
OF RETAIL MEDIA NETWORKS
1. Includes digital advertising appearing on websites or apps engaged in retail or commerce, bought through a retailer’s media
network or demand-side platform. Figures do not sum due to rounding.
Sources: Activate analysis, Company filings, Company press releases, Company sites, Dunnhumby, eMarketer, Forrester
JOURNEY ADS
ACTIVATE
FORECAST
Going forward, retail media networks will be increasingly instrumental
in leveraging first-party data to provide retailers with greater
personalization for customer experience and consumer targeting
ECOMMERCE & MARKETPLACES
www.activate.com 
47
CONTENTS PAGE
$420B Global Technology and Media Growth Dollars Up for Grabs 4
Consumer Technology and Media Time and Attention 9
Super Users: The Critical Segment for Technology and Media Companies 15
eCommerce and Marketplaces: Growth will Continue Across Categories
With Major Consumer Trends Serving as Tailwinds 29
Video: Streaming and Social Drive Growth 47
Gaming and Esports: A Mainstream Behavior and Precursor to The Metaverse 78
NFTs: Past the Hype Cycle, Towards Tangible Use Cases 95
Metaverse: Time for Practical Applications 108
Audio: Digital Audio Will Drive More Consumer Time and Spend 138
Sports and Sports Betting: Younger Next-Gen Sports Fans Drive Growth 152
Digital Fitness: Consumer Adoption Will Continue to Grow 167
Overall time spent with video will remain flat through 2026, though
digital video will continue to grow at the expense of traditional
television

48
AVERAGE DAILY VIDEO TIME SPENT PER ADULT AGED 18+ BY TYPE1, U.S., 2019-2022E VS. 2026E, HOURS:MINUTES
2022E-2026E
CAGR:
ACTIVATE
FORECAST
2019 2020 2021 2022E 2026E
3:10
2:47
2:29
1:53
5:03 5:14
5:28
3:10
2:18
Television3
Digital Video2
5:17
2:11
3:04
2019-2022E
CAGR:
5:17
2:37
2:39
1.4%
11.7%
-5.8%
-0.2%
4.0%
-4.8%
VIDEO
1. Figures do not sum due to rounding. 2. “Digital video” is defined as video watched on a mobile phone, tablet, desktop/
laptop, or Connected TV. Connected TVs are TV sets that can connect to the internet through built-in internet capabilities
(i.e. Smart TVs) or through another device such as a streaming device (e.g. Amazon Fire TV, Apple TV, Google Chromecast,
Roku), game console, or Blu-ray player. Does not include social video. 3. “Television” is defined as traditional live and time-
shifted (e.g. DVR) television viewing.
Sources: Activate analysis, eMarketer, GWI, Nielsen, Pew Research Center, U.S. Bureau of Labor Statistics
Increasingly, Connected TVs will play a larger role in digital video
consumption; nearly all U.S. households will have a Connected TV
by 2026

49
1. “Connected TVs” are defined as TV sets that can connect to the internet through built-in internet capabilities (i.e. Smart TVs)
or through another device such as a streaming device (e.g. Amazon Fire TV, Apple TV, Google Chromecast, Roku), gaming
console, or Blu-ray player. 2. ”Connected TV households” are defined as households for which at least one person of any age
uses the internet through a Connected TV at least once per month. 3. “Penetration” is defined as the share of Connected TV
monthly users of any age who use the internet through the listed device at least once per month. Listed devices are not mutually
exclusive. 4. “Connected TV monthly users” are defined as consumers of any age who use the internet through a Connected TV
at least once per month.
Sources: Activate analysis, eMarketer, Leichtman Research Group
CONNECTED TV HOUSEHOLDS1,2,
U.S., 2019-2026E, MILLIONS HOUSEHOLDS
PENETRATION3 BY SELECT CONNECTED TV DEVICES1,
U.S., 2019-2022E, % CONNECTED TV MONTHLY USERS4
2019 2020 2021 2022E 2023E 2024E 2025E 2026E
112M
108M
103M
95M
121M
119M
117M
115M
112M
3.5%
2019-2026E
CAGR:
2019 2020 2021 2022E
41%
35%
35%
14%
13%
14%
Connected
Gaming
Consoles
2019-2022E
PENETRATION
CHANGE:
Blu-ray Players
53%
35%
46%
13%
13%
10%
Smart TVs
74%
58%
+12pp
+11pp
0pp
-1pp
-4pp
+16pp
0pp
VIDEO
1M
2M
4M
5M
10M
11M
12M
12M
13M
23M
25M
27M
29M
37M
39M
40M
41M
42M
46M
66M
91M
103M
126M
162M
229M
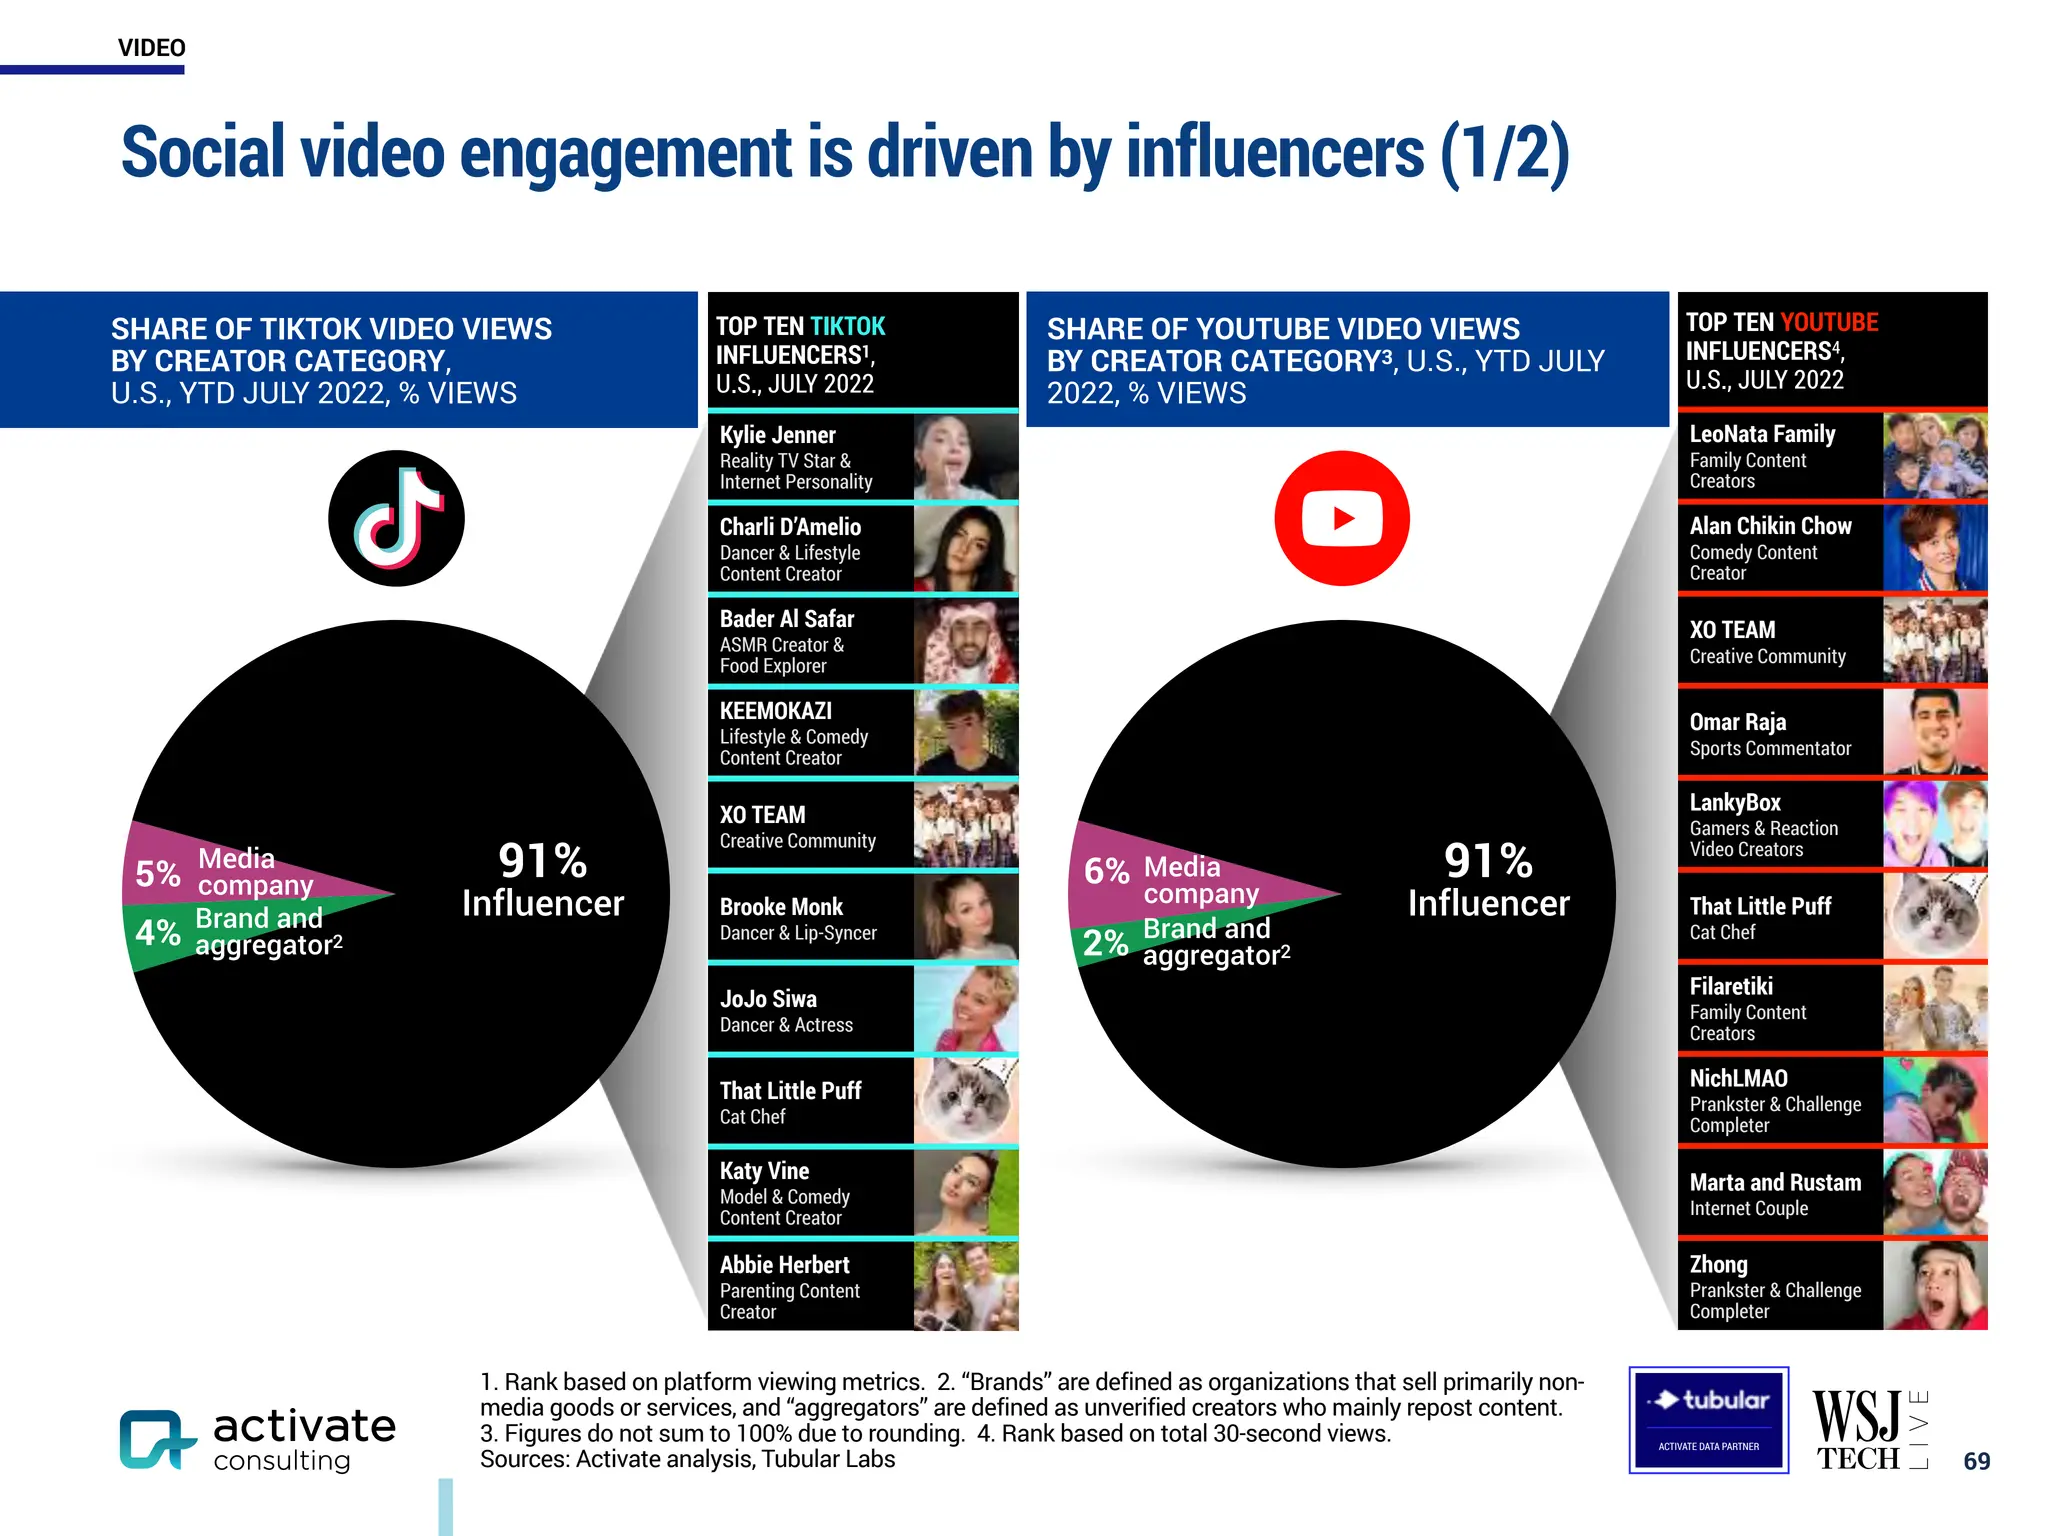
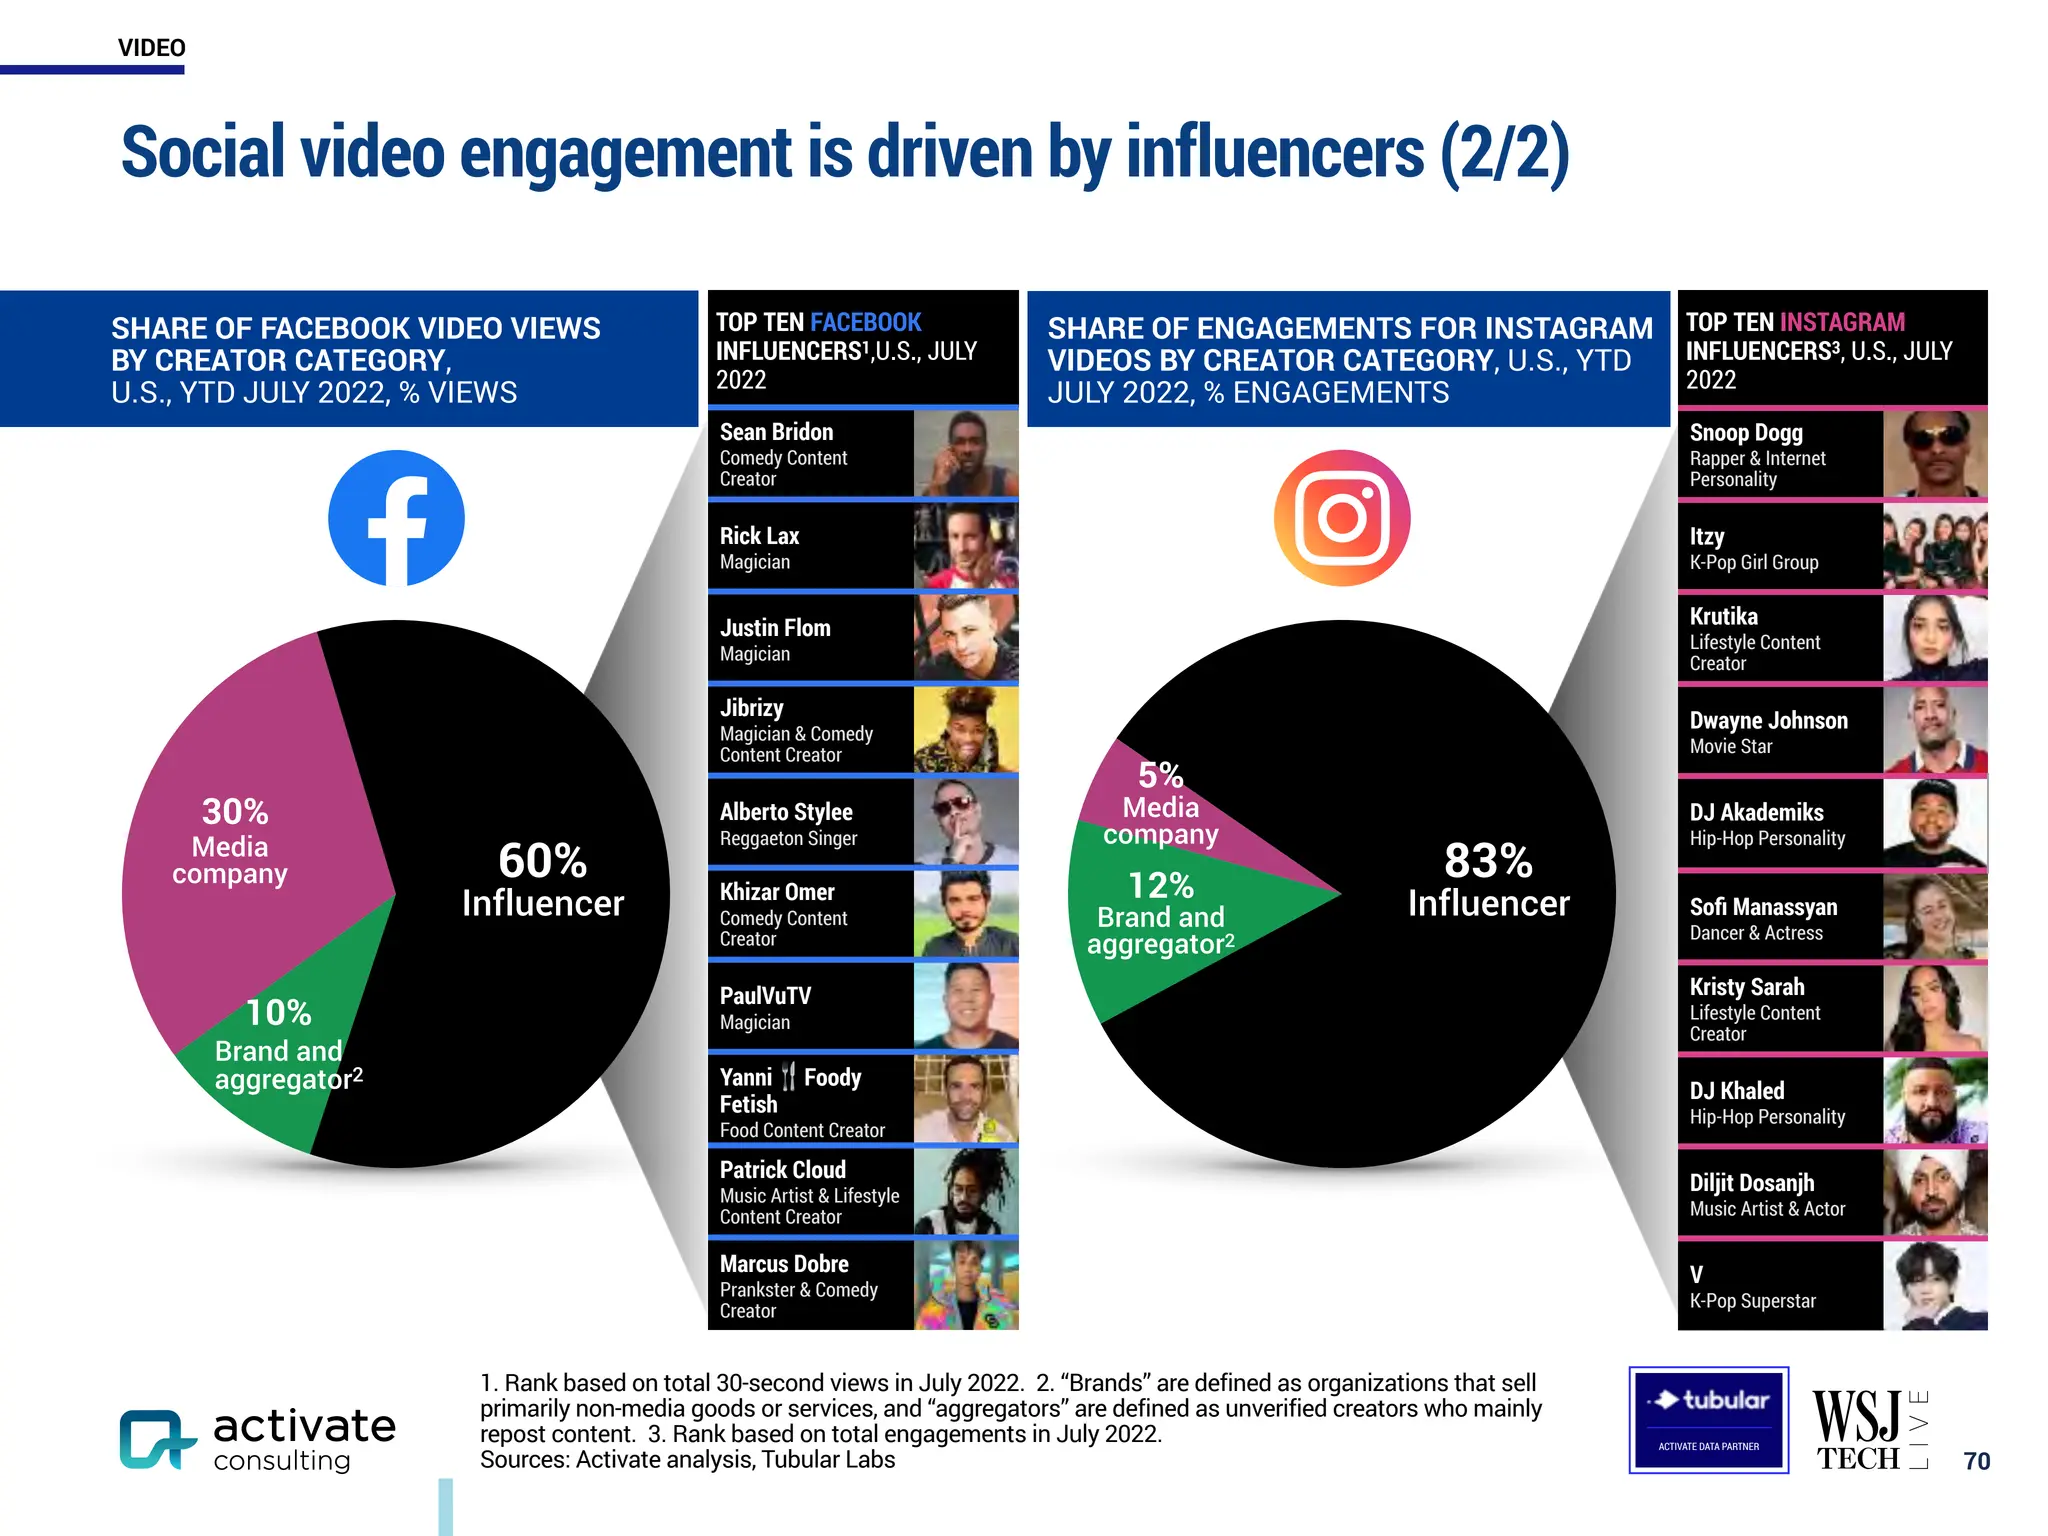
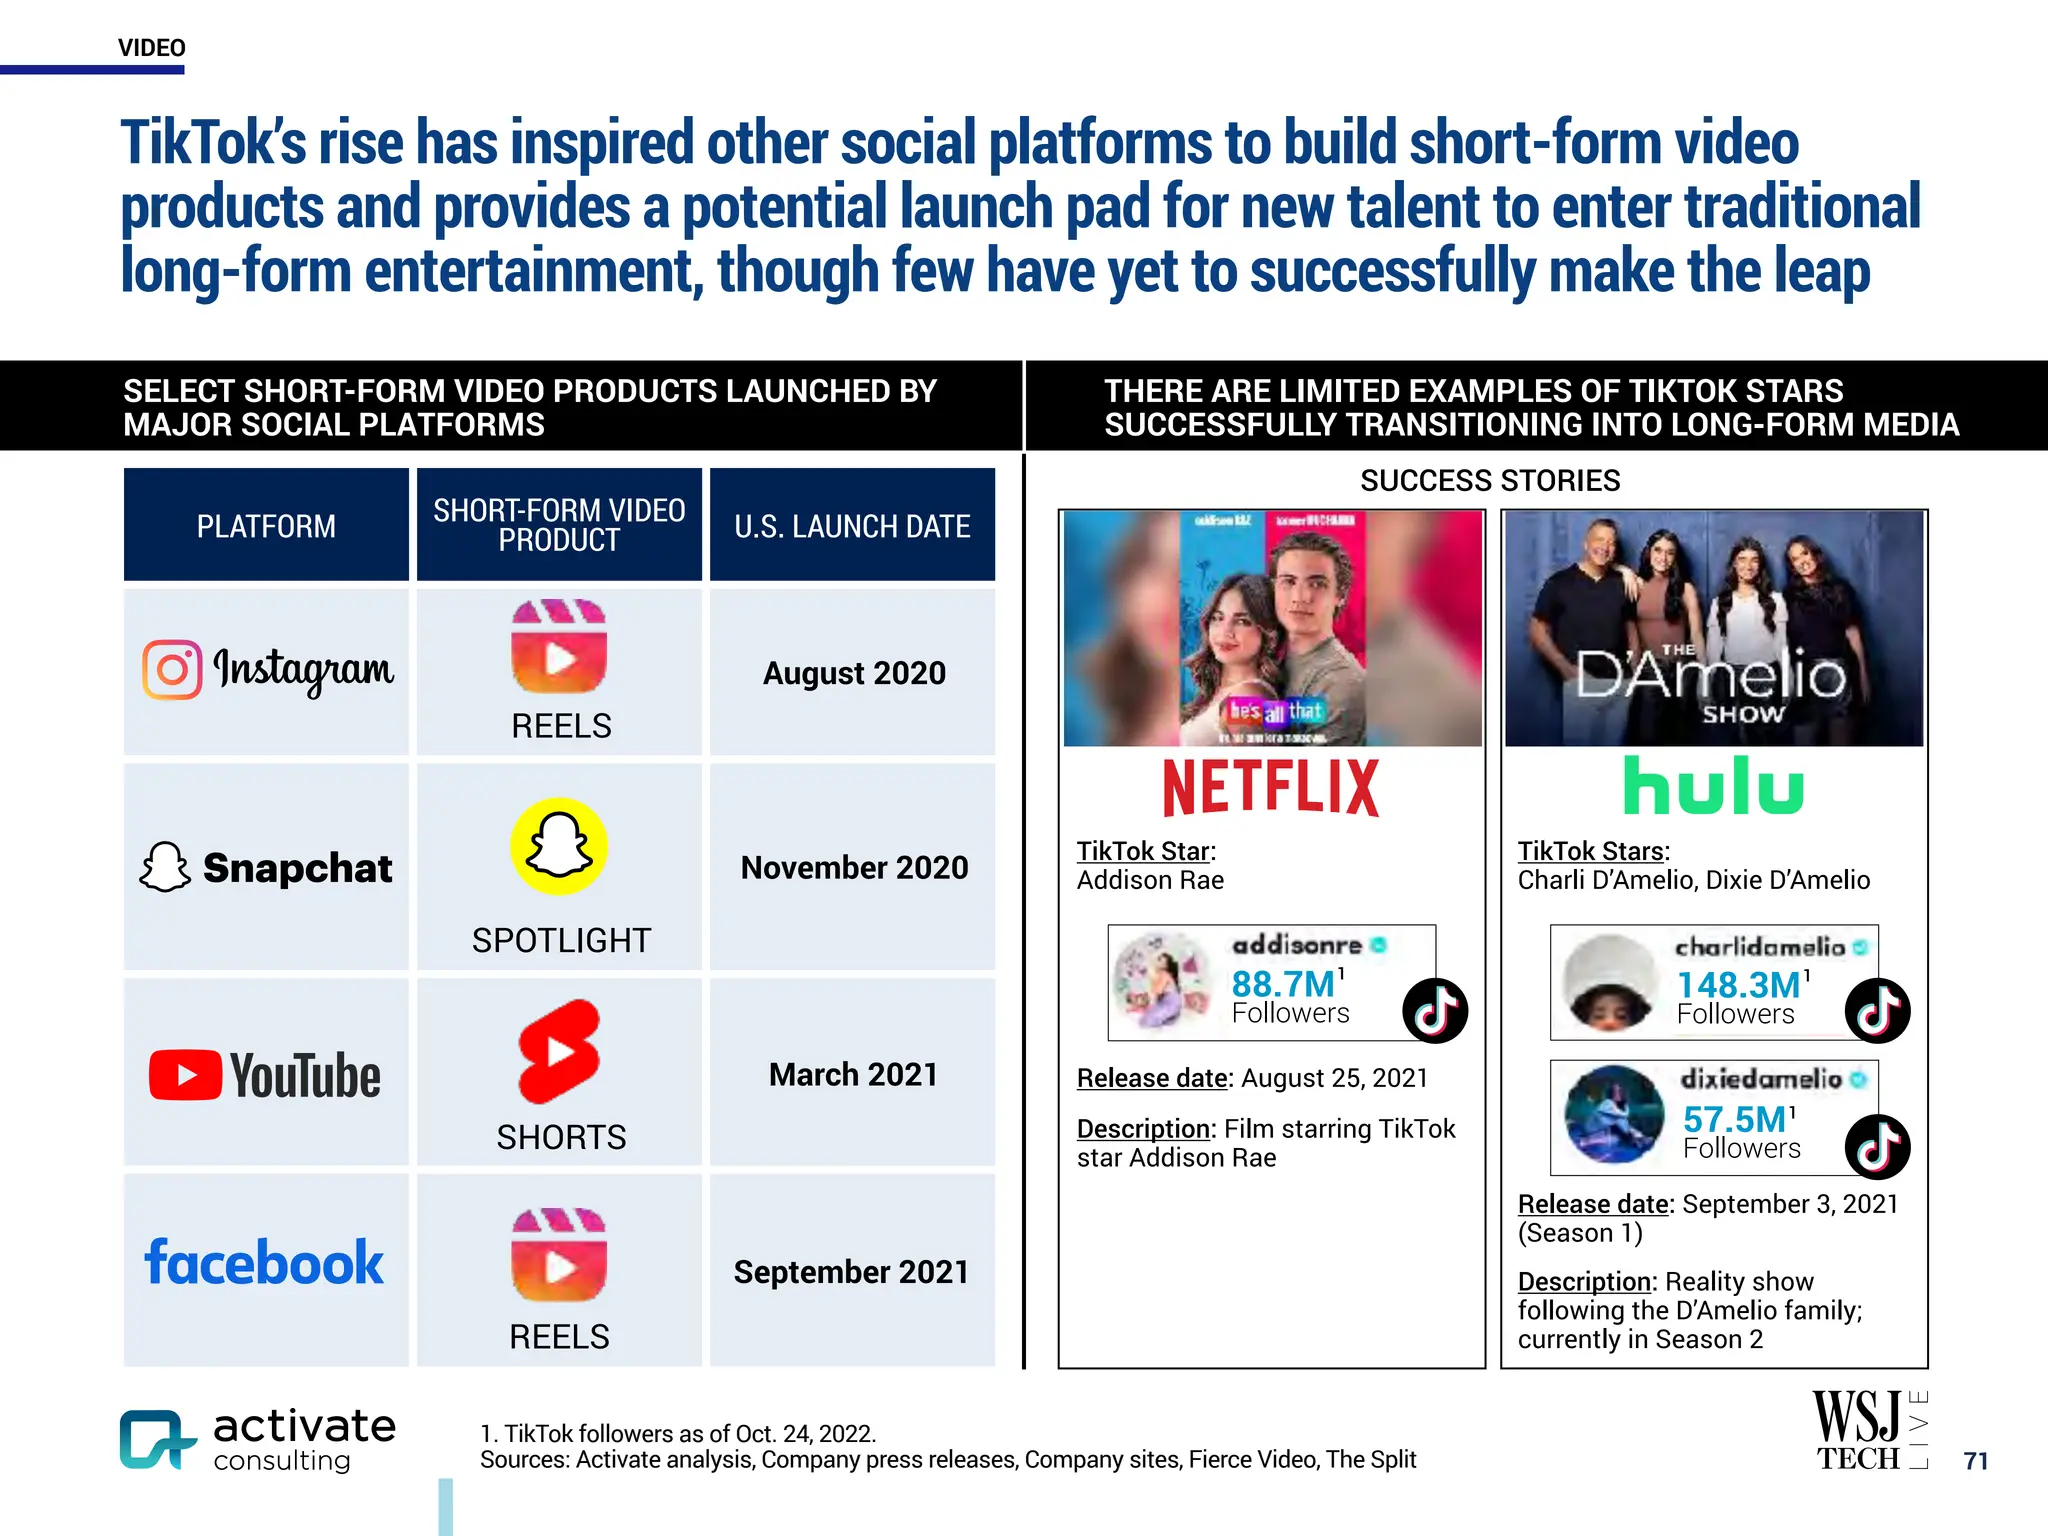
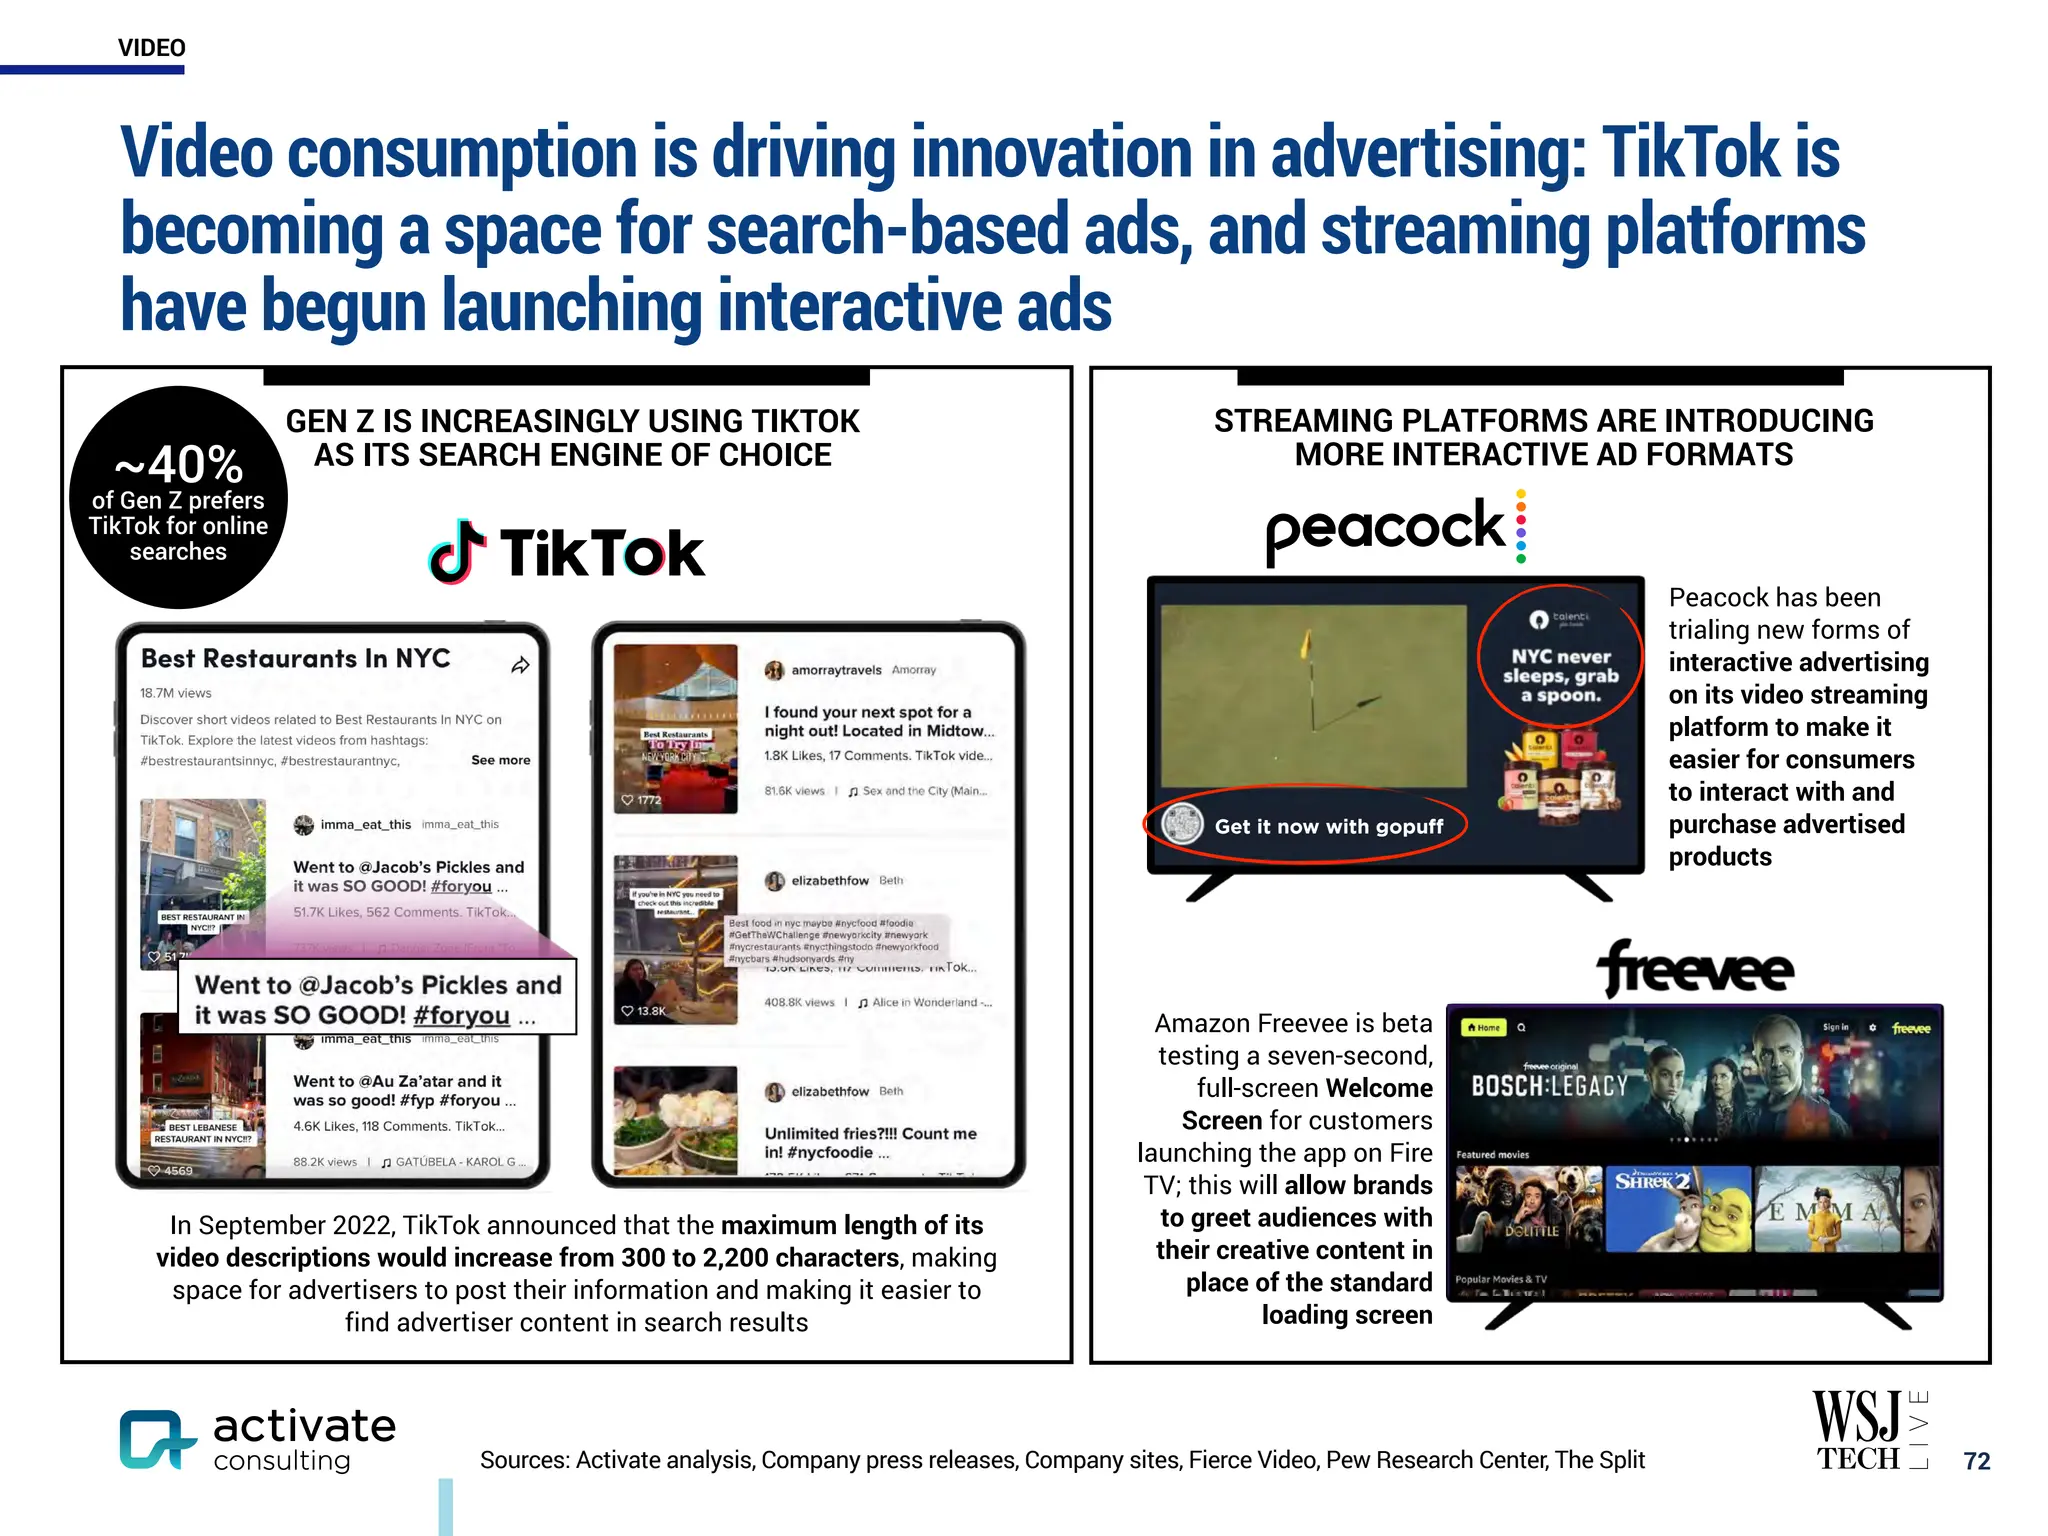
Digital video consumption is taking place across a wide range of
platforms

50
ESTIMATED NUMBER OF SUBSCRIBERS/USERS/WATCHERS BY SELECT VIDEO STREAMING SERVICES,
U.S., Q2 2022, MILLIONS SUBSCRIBERS / MONTHLY ACTIVE USERS / MONTHLY ACTIVE VIDEO WATCHERS
3
4
Paid video streaming subscription service [SVOD]
(Millions subscribers)
Free video streaming service with ads [AVOD, FAST]
(Millions monthly active users)
Video streaming service with a paid subscription
tier and a free tier with ads (Millions monthly active users)
Virtual Pay TV service1 [vMVPD]
(Millions subscribers)
Social / Web Video
(Millions monthly active video watchers)
3
2
(
i
n
c
l
u
d
i
n
g
P
r
i
m
e
V
i
d
e
o
)
3
3
3
5
3
3
3
3
3
3
3
6
3
3
3
3
Note: Figures reflect latest publicly disclosed statistics as of Oct. 2022, unless noted otherwise. 1. “Virtual Pay TV service” is
defined as a service that delivers TV through the internet without a set-top box. 2. Reflects estimate of total Prime users.
3. Reflects estimate. 4. Reflects estimate of Roku monthly active accounts in North America viewing The Roku Channel.
5. Reflects monthly active accounts as of the end of Q3 2022. Includes 15M paid subscribers. 6. Includes Sling Blue and Orange.
Sources: Activate analysis, Activate 2022 Consumer Technology & Media Research Study (n = 4,001), CNBC, Company filings,
Company press releases, Company sites, eMarketer, Entertainment Strategy Guy, MoffettNathanson, Morgan Stanley
VIDEO
Major streaming platforms will rely on international markets to
drive subscriber growth

51
1. Includes OTT and linear subscribers.
Sources: Activate analysis, Activate 2022 Consumer Technology & Media Research Study (n = 4,001), Bank of America,
Company filings, Company press releases, Company sites, Eikon, eMarketer, Entertainment Strategy Guy, JP Morgan,
MoffettNathanson, Morgan Stanley, S&P Global, Wells Fargo
PAID STREAMING AND AD-SUPPORTED FREE STREAMING SUBSCRIBERS / MONTHLY ACTIVE USERS BY REGION,
GLOBAL, 2022E VS. 2026E, MILLIONS SUBSCRIBERS / MONTHLY ACTIVE USERS
2022E 2026E
% Total U.S. Subscribers / Monthly Active Users % Total International Subscribers / Monthly Active Users
INTERNATIONAL
SHARE OF
INCREMENTAL NEW
SUBSCRIBERS /
MONTHLY
ACTIVE USERS:
U.S.
INTERNATIONAL
2022E 2026E 2022E 2026E
2022E 2026E
71%
74%
72%
78%
1
2022E 2026E 2022E 2026E
29% 26%
28%
22% 56% 43%
44%
57%
228M
269M
159M
264M
55%
45%
52%
48%
51M
79M 78M
114M
53M
65M
48%
52%
59%
41% 81%
19%
23%
77%
90% 85% 90% 64% 82% 38%
PAID VIDEO STREAMING
AD-SUPPORTED
FREE VIDEO STREAMING
VIDEO
137M
99M
By 2026, the average paid video streaming subscriber will have 6.3
subscriptions

52
NUMBER OF PAID VIDEO STREAMING SUBSCRIPTIONS OWNED PER PAYING SUBSCRIBER1,
U.S., 2016-2022, % PAID VIDEO STREAMING SUBSCRIPTION OWNERS AGED 18+
1. Figures do not sum to 100% due to rounding. Includes both ad-supported and ad-free paid video streaming subscriptions.
Sources: Activate analysis, Activate 2016 Consumer Technology & Media Research Study (n = 4,000), Activate 2017 Consumer
Technology & Media Research Study (n = 4,047), Activate 2018 Consumer Technology & Media Research Study (n = 4,000),
Activate 2019 Consumer Technology & Media Research Study (n = 4,006), Activate 2020 Consumer Technology & Media
Research Study (n = 4,003), Activate 2021 Consumer Technology & Media Research Study (n = 4,018), Activate 2021 Consumer
Video Research Study (n = 2,014), Activate 2022 Consumer Technology & Media Research Study (n = 4,001), Omdia,
PricewaterhouseCoopers, U.S. Department of Labor
(+20%) (+44%) (+30%)
(+15%) (+9%)
2016 2017 2018 2019 2020 2021 2022
67%
65%
57%
50%
32%
21%
13%
16%
17%
21%
28%
31%
32%
31%
17%
18%
22%
22%
37%
47%
56%
1 Service
2 Services
3.1
3+ Services
2.2
1.8 4.1
1.6
ACTIVATE
FORECAST
We forecast that the
average paid video
streaming subscriber
will own
6.3
subscriptions
by 2026
4.4
(+7%)
4.7
AVERAGE # PAID VIDEO
STREAMING SUBSCRIPTIONS
OWNED PER SUBSCRIBER
VIDEO
All 2021 Warner Bros. movies were made available to
stream through HBO Max for 31 days on the same day
as their theatrical releases
Cost: Included with ad-free subscription
($14.99/month)
HBO MAX /
WARNER BROS.
2021 PREMIERES:
Select Disney movies were made available for
purchase through Disney+ Premier Access on the same
day as their theatrical releases
Cost: $29.99/movie plus price of Disney+
($7.99/month)
DISNEY+
PREMIER ACCESS
2021 PREMIERES:
During the pandemic, direct-to-streaming strategies from HBO Max
and Disney+ led to subscriber growth and retention

53
1. “Newly released movies” are defined as movies that are not yet widely available (i.e. only available in theaters or on Disney+
Premier Access / HBO Max). 2. If multiple newly released movies were viewed on Disney+ or HBO Max, answers for each
movie/service were counted separately. 3. Viewings by adults aged 18+.
Sources: Activate analysis, Activate 2021 Consumer Video Research Study (n = 2,014)
MOVIE RELEASE STRATEGIES
BY HBO MAX AND DISNEY+, U.S., 2021
28%
14%
15%
16%
57%
70% Definitely/likely
would have
watched
in theaters
Not sure if would
have watched
in theaters
IMPACT OF ACCESS TO NEWLY RELEASED
MOVIES1 FOR SELECT SUBSCRIPTIONS, U.S.,
2021, % ADULTS AGED 18+ WHO VIEWED A
NEWLY RELEASED MOVIE1 ON DISNEY+
PREMIER ACCESS OR HBO MAX2
Had the movie not been available through Disney+ Premier
Access or HBO Max and assuming personal health due to
COVID-19 was not a concern…
Of those who watched newly released movies1 through
Disney+ Premier Access or HBO Max, access to these
movies influenced…
80%
to subscribe to or keep
these paid video
streaming
subscriptions
Definitely/likely
would not have
watched
in theaters
NEWLY RELEASED MOVIE1 VIEWINGS THROUGH:
LIKELIHOOD OF HAVING GONE TO A THEATER TO WATCH
NEWLY RELEASED MOVIES1 VIEWED ON EACH SERVICE,
U.S., 2021, % VIEWINGS OF NEWLY RELEASED MOVIES1 ON
DISNEY+ PREMIER ACCESS OR HBO MAX2,3
VIDEO
In 2022, major film studios have returned to giving films an exclusive
theatrical run but now have greater flexibility over theatrical window
length

54
Sources: Activate analysis, Box Office Mojo, Company sites, Deadline, S&P Global, Variety
MOVIE RELEASE STRATEGIES BY SELECT MAJOR FILM STUDIOS, U.S., 2022
ADHERENCE TO ~45-DAY THEATRICAL
WINDOW: Tentpole films are given at least
a 45-day theatrical window before they
appear on streaming platforms
Jackass Forever was released exclusively
in theaters on 2/4/22 and arrived on
Paramount+ 45 days later
Sonic the Hedgehog 2 was released
exclusively in theaters on 4/8/22 and
arrived on Paramount+ 45 days later
The Batman was released exclusively in
theaters on 3/4/22 and arrived on
HBO Max 45 days later
DC League of Super-Pets was released
exclusively in theaters on 7/29/22 and
arrived on HBO Max 45 days later
Lightyear was released exclusively in
theaters on 6/17/22 and arrived on
Disney+ 47 days later
FURTHER FLEXIBILITY / “CASE-BY-CASE”:
Some films are receiving longer theatrical
windows before reaching streaming platforms
Top Gun: Maverick was released
exclusively in theaters on 5/27/22, and
the film’s Paramount+ arrival date has
yet to be announced; it is the top-
grossing film of 2022 so far (~$715M
in U.S. box office revenue as of
10/13/22)
Elvis was released exclusively in
theaters on 6/24/22 and arrived on
HBO Max 70 days later; the film
grossed over $150M in U.S.
box office revenue
Thor: Love and Thunder was released
exclusively in theaters on 7/8/22
and arrived on Disney+ over 60 days
later; the film grossed over
$340M in U.S. box office revenue
2022
STUDIO/EXHIBITOR DEAL EXAMPLES
STUDIO EXHIBITORS DEAL DETAILS
Greater than $50M
opening weekend box
office gross:
31-day exclusive
theatrical window
Less than $50M
opening weekend box
office gross:
17-day exclusive
theatrical window;
Universal then has
the option to release
the film digitally
45-day exclusive
theatrical window,
followed by digital
release
VIDEO
There is a sizable audience who prefers to watch newly released
movies in theaters, validating movie studios’ renewed focus on
theatrical releases

55
Sources: Activate analysis, Activate 2022 Metaverse & NFT Consumer Research Study (n = 3,078)
40%
would prefer to watch
newly released movies
at a movie theater
18%
would not have
a preference
42%
would prefer
to watch newly released
movies online 50%
expect to see a
movie in theaters
at least once per
month
PREFERENCE FOR WATCHING NEWLY RELEASED MOVIES, U.S., 2022, % ADULTS AGED 18+
VIDEO
Many top performing films on streaming also drove substantial
theatrical revenues, suggesting that a theatrical window does not
cannibalize engagement on streaming platforms

56
1. Based on viewership during debut week on paid streaming services (as determined by Nielsen Streaming Content Ratings).
SVOD services measured include Netflix, Disney+, Amazon Prime Video, HBO Max, and Hulu. Reflects films streamed by persons
aged 2+. Excludes movies released via Disney+ Premier Access.
Sources: Activate analysis, Box Office Mojo, Entertainment Strategy Guy, Nielsen Streaming Content Ratings
RELEASE MODEL: Direct-to-streaming Theatrical-exclusive window Domestic theatrical gross
TOTAL HOURS WATCHED IN DEBUT WEEK ON STREAMING1, U.S., JAN. 2021-SEPT. 2022, MILLIONS HOURS
$343 $164 $411 $96 $118 $162 $224 $148 $73
Many of the top performers on streaming also drove revenues through theatrical releases:
$343M $164M $224M
$162M
$118M
$96M
$411M $148M $73M
RED NOTICE TURNING RED LUCA DON’T LOOK UP THOR: LOVE
AND THUNDER
THE GRAY MAN ETERNALS DR. STRANGE 2 ENCANTO THE ADAM
PROJECT
LIGHTYEAR SING 2 HUSTLE THE HARDER
THEY FALL
SHANG-CHI UNCHARTERED PINOCCHIO MORBIUS CHIP ’N DALE:
RESCUE
RANGERS
THE ICE AGE
ADVENTURES
OF BUCK WILD
10.2M
16.9M
17.9M
21.1M
21.8M
22.9M
23.8M
24.0M
25.0M
5.8M
9.9M
15.5M
19.9M
20.3M
22.7M
24.0M
25.9M
26.2M
28.4M
30.7M
VIDEO
Streaming content spend on original series and movies is growing
to drive increased consumption

57
STREAMING SERVICE CONTENT SPEND BY COMPANY1, GLOBAL, 2021 VS. 2026E, BILLIONS USD
1. Represents cash content spend.
Sources: Activate analysis, MoffettNathanson, Wells Fargo
$6.6B
$6.6B
$9.7B
$11.2B
$18.4B
$19.8B
$21.1B
$1.5B
$1.3B
$6.0B
$2.1B
$9.1B
$6.3B
$17.5B
2021 2026E
2021-2026E
CAGR:
SELECT MAJOR CONTENT INVESTMENTS
4%
26%
15%
40%
10%
38%
34%
VIDEO

58
Movie consumption on streaming is driven by new releases — of the
top 30 movies streamed in 2022 so far, only three films were
released before 2021
2021 | PG | 23.8B 2022 | PG | 8.7B 2021 | PG | 7.2B 2022 | PG-13 | 4.8B 2022 | PG-13 | 4.0B 2016 | PG | 3.8B
2021 | R | 3.7B 2022 | PG-13 | 2.9B 2022 | PG | 2.8B 2022 | PG-13 | 2.8B 2021 | PG-13 | 2.6B 2022 | R | 2.6B
2022 | PG-13 | 2.5B 2022 | R | 2.3B 2022 | R | 2.3B 2022 | PG | 2.2B 2022 | PG-13 | 2.1B 2022 | R | 2.1B
2022 | TV-MA | 2.0B 2010 | PG | 2.0B 2022 | TV-14 | 1.9B 2021 | PG-13 | 1.8B 2022 | PG | 1.4B 2022 | TV-MA | 1.4B
Prey
2022 | PG | 1.3B 1986 | PG | 1.3B 2022 | R | 1.3B 2022 | PG | 1.2B 2022 | PG-13 | 1.2B 2022 | PG-13 | 1.1B
XXXX | XX | X.XB
LEGEND
RATING
BILLIONS
MINUTES
RELEASE
YEAR
= Disney+
= Netflix
= Amazon
Prime Video
= Hulu
= HBO Max
Only three movies
in the Top 301 were
released before 2021
TOP 30 MOST STREAMED FILMS ON PAID VIDEO STREAMING SUBSCRIPTION SERVICES1,
U.S., DEC. 2021-SEPT. 20222, BILLIONS MINUTES STREAMED
1. Based on aggregate viewership of weekly top 10 most viewed films across select paid video streaming
subscription services (determined by Nielsen Streaming Content Ratings). Services measured include
Amazon Prime Video, Disney+, HBO Max, Hulu, and Netflix. Includes films streamed by persons aged 2+.
2. Period spanning Dec. 27, 2021 to Sept. 18, 2022.
Sources: Activate analysis, Nielsen Streaming Content Ratings
ACTIVATE DATA PARTNER
VIDEO
1. Based on aggregate viewership of weekly top 10 most viewed series across select paid video streaming
subscription services (determined by Nielsen Streaming Content Ratings). Services measured include
Amazon Prime Video, Disney+, HBO Max, Hulu, and Netflix. Includes series streamed by persons aged 2+.
2. Period spanning Dec. 27, 2021 to Sept. 18, 2022.
Sources: Activate analysis, Nielsen Streaming Content Ratings 
59
Original and acquired series are critical to drive viewing and
engagement
60%
40%
ORIGINAL
= Disney+
= Netflix
= Amazon
Prime Video
= HBO Max
X.X X.X ACQUIRED
ORIGINAL VS. ACQUIRED VIEWING
SHARE OF TOP 30 SERIES
STREAMED ON PAID STREAMING
SUBSCRIPTION SERVICES1, U.S.,
DEC. 2021-SEP. 20222,% TOTAL
MINUTES STREAMED1
LEGEND
46.1B 27.8B 27.4B 26.1B 17.3B
16.7B 10.8B 10.8B 10.6B 10.3B
10.0B 9.7B 9.2B 9.0B 7.9B
6.8B 6.7B 6.6B 5.9B 5.8B
5.6B 5.6B 5.5B 5.0B 4.8B
4.6B 4.6B 4.6B 4.5B 4.3B
TOP 30 MOST STREAMED SERIES ON PAID VIDEO STREAMING SUBSCRIPTION SERVICES1,
U.S., DEC. 2021-SEPT. 20222, BILLIONS MINUTES STREAMED
ACTIVATE DATA PARTNER
VIDEO

60
As services have become more established and increased in scale,
they have raised prices to drive monetization
1 2 3 4 5 6 7 8 9 10 11 12 1 2 3 4 5 6 7 8 9 10 11 12 1 2 3 4 5 6 7 8 9 10
2020 2021 2022
1. As of Oct. 1, 2022. 2. Reported launch date: Nov. 3, 2022. Cost for Netflix Basic with ads: $6.99. 3. Reported launch date:
Dec. 8, 2022. Cost for Disney+ with ads: $7.99. 4. By summer 2023, HBO Max and Discovery+ expected to merge into a new
streaming service; name, exact launch date, and subscription price have not been announced.
Sources: Activate analysis, Company press releases, Company sites
MONTHLY STANDARD SUBSCRIPTION PRICES OF SELECT PAID VIDEO STREAMING SERVICES, U.S., JAN. 2020-OCT. 20221, USD
Premium
Standard
(no ads)4
(no ads)
(ads)4
(ads)
(ads)
$15.99
$12.99
$11.99
$8.99
$6.99
$4.99
$5.99
$14.99
$9.99
$9.99
$6.99
$4.99 $4.99
↑$17.99
↑$19.99
↑$13.99
↑$15.49
↑$12.99
↑$9.99 ↑$9.99
↑$6.99
↑$5.99
↑$6.99
↑$7.99
(no ads)
Basic (no ads)
FUTURE AD-TIER SERVICE
LAUNCHES
(ads)2
CURRENT PRICE
PRICE ANNOUNCED
TO INCREASE TO
$10.99 IN DEC. 2022
$19.99
$15.49
$14.99
$14.99
$4.99
$4.99
$6.99
$9.99
$9.99
$7.99
(no ads)
$9.99
$7.99
$9.99
(ads)4
(no ads)4
↑$7.99
↑$14.99
(ads)3
VIDEO
POTENTIAL SERVICES FOR BUNDLING
NOT EXHAUSTIVE
TODAY: MEDIA COMPANIES BUNDLE THEIR OWN
VIDEO STREAMING SERVICES TO DRIVE
SUBSCRIPTION GROWTH
NOT EXHAUSTIVE
MEDIA COMPANY BUNDLES
FUTURE: BUNDLING WILL CONTINUE AND EXPAND
TO INCLUDE VIDEO STREAMING SERVICES ACROSS
PARENT COMPANIES
POTENTIAL SERVICES FOR BUNDLING
NOT EXHAUSTIVE
As individual streaming service prices increase, consumers will
increasingly turn to bundles offering higher value

61
1. Not exhaustive. 2. Prices reflect the ad-supported monthly service tiers when applicable. Prices as of Oct. 23, 2022.
3. Price announced to increase to $14.99 on Dec. 8, 2022. 4. AMC+ also includes additional content from AMC, BBC
America, IFC, and Sundance TV.
Sources: Activate analysis, Company press releases, Company sites
Price2: $11.99($15.98 value)
Price2: $13.993 ($25.97 value)
Price2: $8.99($18.97 value)
4
VIDEO
Streaming players have also signaled that they will crack down on
password sharing, which could convert non-paying borrowers to
paying subscribers

62
EXPECTED RESPONSE TO PASSWORD-SHARING
CRACKDOWN ON PAID STREAMING SUBSCRIPTION
BORROWER BEHAVIOR1,2, U.S., 2022, % PAID STREAMING
SUBSCRIPTION BORROWERS1
35%
26%
24%
35%
37%
41%
30%
36%
36%
I would no
longer use
I would subscribe
at full price
I would subscribe
but only at a
reduced price
AT&T: HBO Max has built-in features to mitigate
password sharing | April 21, 2022 | Fierce Video
“AT&T incorporated features into HBO Max to crack down on
password sharing and actions considered as ‘rampant abuse’ of the
streaming service.”
STREAMING PLAYERS ARE TAKING MEASURES
TO MINIMIZE PASSWORD SHARING
Disney+ may be next to crack down on password sharing
| May 5, 2022 | Protocol
“Disney recently sent out a questionnaire to subscribers in Spain,
asking them why they are sharing their Disney+ passwords with
people outside of their own household.”
Netflix unveils “add a home” feature to curb password
sharing | July 19, 2022 | Fierce Video
“Starting next month, Netflix subscribers in select Latin American
countries will be able to purchase up to a certain number of additional
homes, depending on the subscription tier.”
IF I WERE NO LONGER ABLE TO USE/ACCESS THE FOLLOWING SERVICES
WITHOUT PAYING FOR MY OWN SUBSCRIPTION…
1. “Paid streaming subscription borrowers” are defined as adults aged 18+ who use a subscription paid for by someone outside
of the household. 2. Figures do not sum to 100% due to rounding.
Sources: Activate analysis, Activate 2022 Consumer Technology & Media Research Study (n = 4,001), Fierce Video, Protocol
VIDEO
EXAMPLES OF AD-SUPPORTED FREE STREAMING SERVICES INVESTING IN ORIGINAL CONTENT
Weird: The Al Yankovic Story | Released Sept. 8, 2022
Tubi is streaming 27,000 hours of
Halloween-related content
throughout October 2022, including
6 brand-new Tubi Originals
- A music biopic parody of Weird Al Yankovic, starring
Daniel Radcliffe
- A 2022 Toronto International Film Festival’s People's
Choice winner in the Midnight Madness Award category
Older episodes from TV
shows still running
Episodes from TV shows
no longer running
Movies that first
premiered
in last 5 years
Movies that first
premiered
over 5 years ago
To capture audience time, ad-supported free streaming services have
been investing in original programming and deepening their library of
content

63
USE OF FREE VIDEO STREAMING SERVICES
WITH ADS1 BY PAID VIDEO STREAMING
SERVICE SUBSCRIBERS, U.S., 2022,
% PAID VIDEO WATCHERS2
CONTENT TYPES FREQUENTLY3 WATCHED ON SELECT AD-SUPPORTED
FREE STREAMING SERVICES4, U.S., 2022, % AD-SUPPORTED FREE
STREAMING USERS OF SELECT SERVICES5
50%
of paid video
streaming service
subscribers use free
video streaming
services with ads
50%
of paid video
streaming service
subscribers do not use
free video streaming
services with ads
65%
59%
61%
57%
1. YouTube and Twitch excluded due to their focus on user-generated video. 2. “Paid video watchers” are defined as adults
aged 18+ who use at least one paid video streaming subscription service at least once per month. 3. “Frequently” is defined as
a 4 or 5 on a scale of 1-5, where 5 represents “I frequently watch this type of content on this service” and 1 represents “I never
watch this type of content on this service.” 4. Includes Pluto TV, Tubi, and XUMO. 5. “Ad-supported free streaming users” are
defined as adults aged 18+ who use either Pluto TV, Tubi, or XUMO to watch video.
Sources: Activate analysis, Activate 2022 Consumer Technology & Media Research Study (n = 4,001), Company press releases,
Company sites
VIDEO
Paid video streaming services are launching ad-supported tiers to
better align with consumer preferences

64
EXPECTED RESPONSE TO PAID STREAMING
SUBSCRIPTION SERVICES LAUNCHING LOWER-PRICED
PLANS WITH ADS1, U.S., 2022, % CURRENT DISNEY+/
NETFLIX USERS AGED 18+
AD-SUPPORTED SUBSCRIPTIONS AS A SHARE OF TOTAL
SUBSCRIPTIONS BY SERVICE, U.S., JUNE 2022,
% SUBSCRIBERS FOR EACH SERVICE3
54%
55%
23%
23%
23%
21%
If Disney+/Netflix offered a new lower-priced plan with ads…
Would prefer plan
without ads that has a
higher price
No preference
Would prefer plan
with ads that has a
lower price
Ad-Supported Tier
Launch Date:
December 8, 20222 November 3, 20222
74%
58%
51%
43%
12%
1. Figures do not sum to 100% due to rounding. 2. Reported launch date. 3. Does not include sign-ups via Pay TV / Telco
distribution or select bundles.
Sources: Activate analysis, Activate 2022 Consumer Technology & Media Research Study (n = 4,001), Antenna, Company sites
HBO Max launched with only an ad-free offering on May 27, 2020 while its
ad-supported tier was not offered until June 2, 2021; the other streaming
platforms shown launched ad-free and ad-supported tiers at similar times,
which increased the uptake of their ad-supported tiers
VIDEO
Ad-supported
HBO Max’s experience demonstrates that adding an ad-supported
tier can be an effective way to drive customer acquisition

65
HBO MAX GROSS SUBSCRIBER ADDITIONS1 BY TIER, U.S., JUNE 2021-JUNE 2022, % GROSS SUBSCRIBER ADDITIONS1
1. “Gross subscriber additions” are defined as total new subscribers in each month, including both newly signed up paid users
and users who converted from a free trial.
Sources: Activate analysis, Antenna
Ad-free
2021 2022
June July Aug. Sept. Oct. Nov. Dec. Jan. Feb. Mar. Apr. May June
31%
27%
26%
26%
30%
31%
25%
20%
19%
11%
20%
16%
15%
69%
73%
74%
74%
70%
69%
75%
80%
81%
89%
80%
84%
85%
VIDEO
PAID
FREE + PAID
2022E-2026E
CAGR:
Domestic advertising revenues for the major streaming services
will more than double to $16B between 2022 and 2026

66
ADVERTISING REVENUES FOR SELECT AD-SUPPORTED SERVICES1, U.S., 2022E VS. 2026E, BILLIONS USD
1. Figures do not sum due to rounding. 2. Combined revenues due to expected merger in 2023. 3. Ad-supported tiers launching
in Q4 2022. 4. Indicates 2023E-2026E CAGR.
Sources: Activate analysis, MoffettNathanson, Morgan Stanley, S&P Global, Standard Media Index
$3.4B
$0.4B
$1.2B
$1.0B
$5.0B
$0.8B
$1.1B
$1.4B
$1.7B
$2.7B
$1.5B
$1.1B
$7.6B
$16.6B
3
3
2022E 2026E
21%
23%
39%3,4
25%3,4
22%
22%
10%
22%
FREE
$1.3B 17%
12%
$0.6B
$0.6B
2
$0.6B
VIDEO
Consumers will grow their consumption of social video, reaching
almost an hour per day by 2026

67
ACTIVATE
FORECAST
2:11
2019 2020 2021 2022E 2026E
0:59
0:47
0:43
0:35
0:24
Sources: Activate analysis, eMarketer, GWI, Nielsen, Pew Research Center, U.S. Bureau of Labor Statistics
2019-2022E
CAGR:
26.1%
2022E-2026E
CAGR:
5.6%
AVERAGE DAILY TIME SPENT WITH SOCIAL VIDEO PER ADULT AGED 18+, U.S., 2019-2022E VS. 2026E, HOURS:MINUTES
VIDEO
Social platforms will continue to grow around the world

68
SOCIAL PLATFORM MONTHLY ACTIVE USERS BY REGION, GLOBAL, 2022E VS. 2026E, BILLIONS MONTHLY ACTIVE USERS
Sources: Activate analysis, Activate 2022 Consumer Technology & Media Research Study (n = 4,001), Company filings,
Company press releases, Company sites, eMarketer
2022E 2026E
U.S. Share of Monthly Active Users International Share of Monthly Active Users
2022E 2026E
2022E 2026E
1.5B
2.0B
1.3B
1.5B
2.1B
2.4B
6%
94%
95%
5%
90%
90%
10% 10% 11% 10%
89%
90%
SOCIAL
97% 92% 93%
INTERNATIONAL
SHARE OF MONTHLY
ACTIVE USERS:
U.S.
INTERNATIONAL
VIDEO
Social video engagement is driven by influencers (1/2)

69
SHARE OF TIKTOK VIDEO VIEWS
BY CREATOR CATEGORY,
U.S., YTD JULY 2022, % VIEWS
SHARE OF YOUTUBE VIDEO VIEWS
BY CREATOR CATEGORY3, U.S., YTD JULY
2022, % VIEWS
TOP TEN YOUTUBE
INFLUENCERS4,
U.S., JULY 2022
LeoNata Family
Family Content
Creators
Alan Chikin Chow
Comedy Content
Creator
XO TEAM
Creative Community
Omar Raja
Sports Commentator
LankyBox
Gamers & Reaction
Video Creators
That Little Puff
Cat Chef
Filaretiki
Family Content
Creators
NichLMAO
Prankster & Challenge
Completer
Marta and Rustam
Internet Couple
Zhong
Prankster & Challenge
Completer
91%
Influencer
Brand and
aggregator2
Media
company
4%
5% 91%
Influencer
Brand and
aggregator2
Media
company
2%
6%
TOP TEN TIKTOK
INFLUENCERS1,
U.S., JULY 2022
Kylie Jenner
Reality TV Star &
Internet Personality
Charli D’Amelio
Dancer & Lifestyle
Content Creator
Bader Al Safar
ASMR Creator &
Food Explorer
KEEMOKAZI
Lifestyle & Comedy
Content Creator
XO TEAM
Creative Community
Brooke Monk
Dancer & Lip-Syncer
JoJo Siwa
Dancer & Actress
That Little Puff
Cat Chef
Katy Vine
Model & Comedy
Content Creator
Abbie Herbert
Parenting Content
Creator
1. Rank based on platform viewing metrics. 2. “Brands” are defined as organizations that sell primarily non-
media goods or services, and “aggregators” are defined as unverified creators who mainly repost content.
3. Figures do not sum to 100% due to rounding. 4. Rank based on total 30-second views.
Sources: Activate analysis, Tubular Labs
ACTIVATE DATA PARTNER
VIDEO
1. Rank based on total 30-second views in July 2022. 2. “Brands” are defined as organizations that sell
primarily non-media goods or services, and “aggregators” are defined as unverified creators who mainly
repost content. 3. Rank based on total engagements in July 2022.
Sources: Activate analysis, Tubular Labs
Social video engagement is driven by influencers (2/2)

70
SHARE OF FACEBOOK VIDEO VIEWS
BY CREATOR CATEGORY,
U.S., YTD JULY 2022, % VIEWS
SHARE OF ENGAGEMENTS FOR INSTAGRAM
VIDEOS BY CREATOR CATEGORY, U.S., YTD
JULY 2022, % ENGAGEMENTS
TOP TEN FACEBOOK
INFLUENCERS1,U.S., JULY
2022
Sean Bridon
Comedy Content
Creator
Rick Lax
Magician
Justin Flom
Magician
Jibrizy
Magician & Comedy
Content Creator
Alberto Stylee
Reggaeton Singer
Khizar Omer
Comedy Content
Creator
PaulVuTV
Magician
Yanni🍴 Foody
Fetish
Food Content Creator
Patrick Cloud
Music Artist & Lifestyle
Content Creator
Marcus Dobre
Prankster & Comedy
Creator
TOP TEN INSTAGRAM
INFLUENCERS3, U.S., JULY
2022
Snoop Dogg
Rapper & Internet
Personality
Itzy
K-Pop Girl Group
Krutika
Lifestyle Content
Creator
Dwayne Johnson
Movie Star
DJ Akademiks
Hip-Hop Personality
Sofi Manassyan
Dancer & Actress
Kristy Sarah
Lifestyle Content
Creator
DJ Khaled
Hip-Hop Personality
Diljit Dosanjh
Music Artist & Actor
V
K-Pop Superstar
60%
Influencer
Brand and
aggregator2
Media
company
30%
10%
83%
Influencer
Brand and
aggregator2
Media
company
12%
5%
ACTIVATE DATA PARTNER
VIDEO
PLATFORM
SHORT-FORM VIDEO
PRODUCT U.S. LAUNCH DATE
REELS
August 2020
SPOTLIGHT
November 2020
SHORTS
March 2021
REELS
September 2021
TikTok’s rise has inspired other social platforms to build short-form video
products and provides a potential launch pad for new talent to enter traditional
long-form entertainment, though few have yet to successfully make the leap

71
SELECT SHORT-FORM VIDEO PRODUCTS LAUNCHED BY
MAJOR SOCIAL PLATFORMS
THERE ARE LIMITED EXAMPLES OF TIKTOK STARS
SUCCESSFULLY TRANSITIONING INTO LONG-FORM MEDIA
TikTok Star:
Addison Rae
Release date: August 25, 2021
Description: Film starring TikTok
star Addison Rae
TikTok Stars:
Charli D’Amelio, Dixie D’Amelio
Release date: September 3, 2021
(Season 1)
Description: Reality show
following the D’Amelio family;
currently in Season 2
88.7M
Followers
148.3M
Followers
57.5M
Followers
1. TikTok followers as of Oct. 24, 2022.
Sources: Activate analysis, Company press releases, Company sites, Fierce Video, The Split
1 1
1
SUCCESS STORIES
VIDEO
Video consumption is driving innovation in advertising: TikTok is
becoming a space for search-based ads, and streaming platforms
have begun launching interactive ads

72
Peacock has been
trialing new forms of
interactive advertising
on its video streaming
platform to make it
easier for consumers
to interact with and
purchase advertised
products
Amazon Freevee is beta
testing a seven-second,
full-screen Welcome
Screen for customers
launching the app on Fire
TV; this will allow brands
to greet audiences with
their creative content in
place of the standard
loading screen
~40%
of Gen Z prefers
TikTok for online
searches
STREAMING PLATFORMS ARE INTRODUCING
MORE INTERACTIVE AD FORMATS
GEN Z IS INCREASINGLY USING TIKTOK
AS ITS SEARCH ENGINE OF CHOICE
Get it now with gopuff
Sources: Activate analysis, Company press releases, Company sites, Fierce Video, Pew Research Center, The Split
In September 2022, TikTok announced that the maximum length of its
video descriptions would increase from 300 to 2,200 characters, making
space for advertisers to post their information and making it easier to
find advertiser content in search results
VIDEO
30.2%
Despite the decline in the Pay TV universe and the growth in
streaming, Pay TV still commands a significant share of value
in the video ecosystem

73
1. Figures do not sum due to rounding. 2. “EST” stands for electronic sell-through; includes spend on online video on-demand
transactions (e.g. purchases and rentals). 3. Includes spend on paid video streaming subscriptions. 4. Includes in-stream video
advertising (e.g. pre-roll, mid-roll, post-roll) on digital video content, including on social networks and out-stream video advertising
(e.g. native, in-feed, in-article, in-banner, interstitial). 5. Includes advertising on broadcast TV and Pay TV. 6. “Pay TV” includes
traditional Pay TV (i.e. TV delivered through a set-top box) and virtual Pay TV (i.e. TV delivered through the internet without a set-
top box).
Sources: Activate analysis, BMO Capital Markets, eMarketer, MoffettNathanson, Omdia, PricewaterhouseCoopers, Wells Fargo
ACTIVATE
FORECAST
2019-2023E
CAGR:
$91B
$76B
$60B
$41B
$32B
$69B
$70B
$68B
$64B
$70B
$78B
$83B
$88B
$91B
$94B Pay TV6
Subscriptions
TV Advertising5
Ad-Supported4
Subscriptions3
EST2/Rentals
$273B
$221B
$214B
Television
Digital Video
$245B
$5B
$261B
$6B
$7B
$6B
$6B
20.8%
-0.6%
-4.4%
6.3%
2019 2020 2021 2022E 2023E
$13B $18B
$22B
$25B
$28B
VIDEO REVENUE BY TYPE1, U.S., 2019-2023E, BILLIONS USD
7.7%
VIDEO
We forecast that “battleground TV households” will continue to
grow as Pay TV households decline through 2026

74
2022E 2026E
125M
122M
18M
15M
51M
36M
Core
TV Households
ACTIVATE
FORECAST
2022E-2026E
CAGR:
NON-PAY TV2
HOUSEHOLDS
PAY TV2
HOUSEHOLDS
OVER-THE-AIR
BROADBAND ONLY
PAY TV2
Battleground
TV Households
57M
INCLUDING
18M
VIRTUAL PAY TV2
HOUSEHOLDS
72M
INCLUDING
16M
VIRTUAL PAY TV2
HOUSEHOLDS
1. Figures do not sum due to rounding. 2. “Pay TV” is defined as traditional Pay TV (i.e. TV delivered through a set-top box) and
virtual Pay TV (i.e. TV delivered through the internet without a set-top box).
Sources: Activate analysis, Activate 2016 Consumer Technology & Media Research Study (n = 4,000), Activate 2017 Consumer
Technology & Media Research Study (n = 4,047), Activate 2018 Consumer Technology & Media Research Study (n = 4,000),
Activate 2019 Consumer Technology & Media Research Study (n = 4,006), Activate 2020 Consumer Technology & Media
Research Study (n = 4,003), Activate 2021 Consumer Technology & Media Research Study (n = 4,018), Activate 2021 Consumer
Video Research Study (n = 2,014), Activate 2022 Consumer Technology & Media Research Study (n = 4,001), eMarketer,
MoffettNathanson, Nielsen, S&P Global, U.S. Census Bureau, Wells Fargo
TELEVISION HOUSEHOLD BREAKDOWN1, U.S., 2022E VS. 2026E, MILLIONS HOUSEHOLDS
4.7%
9.0%
-5.6%
VIDEO
2017 2018 2019 2020 2021 2022E 2023E 2024E 2025E 2026E
After growing at over 30% per year, Virtual Pay TV growth will slow
through 2026

75
4.5M
7.6M
10.1M
12.3M
14.4M
15.7M
16.5M
17.2M
17.8M
18.2M
Other
36%
31%
15%
12%
6%
Subscriptions
YoY % Change
124%
32%
22%
17%
9%
5% 4% 3%
3%
VIRTUAL PAY TV1 SUBSCRIPTIONS, U.S., 2017-2026E, MILLIONS SUBSCRIPTIONS / YOY % CHANGE
2022E-2026E
CAGR:
2017-2021
CAGR:
71%
33.9%
85.9%
2.4%
75.3%
96.3%
33.9%
-8.8%
12.5%
-2.7%
5.3%
5.0%
3.8%
1. “Virtual Pay TV services” are defined as services that deliver TV through the internet without a set-top box.
Sources: Activate analysis, eMarketer, MoffettNathanson, Nielsen, S&P Global, Wells Fargo
ACTIVATE
FORECAST
VIDEO
1 2 3 4 5 6 7 8 9 10 11 12 1 2 3 4 5 6 7 8 9 10 11 12 1 2 3 4 5 6 7 8 9 10 11 12 1 2 3 4 5 6 7 8 9 10 11 12 1 2 3 4 5 6 7 8 9 10
2018 2019 2020 2021 2022
Virtual Pay TV prices will continue to increase, resulting in lower
growth in the adoption of these services

76
MONTHLY SUBSCRIPTION PRICE1 OF VIRTUAL PAY TV SERVICES2, U.S., JAN. 2018-OCT. 20223, USD
$69.99
$64.99
$69.99
$69.99
$35.00
$35.00
$25.00
$6.99
CURRENT PRICE3
4
Blue
Orange
$5.99
↑$25.00
↑$64.99
$20.00
↑$25.00
$20.00
↑$30.00
↑$35.00
$25.00
↑$30.00
↑$35.00
$44.99
↑$54.99
↑$64.99
$39.99
↑$44.99
↑$54.99
$35.00
↑$40.00
↑$50.00
$35.00
↑$40.00
↑$50.00
↑$65.00
↓$55.00
↑$69.99
↑$59.99
↑$64.99
↑$69.99 ↑$69.99
↑$6.99
5 PRICE ANNOUNCED TO
INCREASE TO $74.99
IN DEC. 2022
↑$64.99
1. Price reflects each service’s base package. 2. “Virtual Pay TV services” are defined as services that deliver TV through the
internet without a set-top box. 3. Pricing information as of Oct. 10, 2022. 4. Includes prices from previously rebranded services
(i.e. DirecTV Now, AT&T TV Now, and AT&T TV). 5. As of Dec. 21, 2021, Hulu + Live TV subscriptions include Disney+ and ESPN+.
Sources: Activate analysis, Company press releases, Company sites, S&P Global
VIDEO
We forecast that Pay TV will mostly decline and do so at a much
slower pace internationally than in the U.S.

77
PAY TV1 PENETRATION BY REGION, GLOBAL, 2020-2026E, % HOUSEHOLDS IN EACH REGION
2020 2021 2022E 2023E 2024E 2025E 2026E
26%
26%
26%
26%
26%
25%
24%
34%
34%
35%
35%
36%
37%
38%
64%
64%
65%
65%
65%
65%
65%
45%
46%
48%
50%
53%
57%
62%
53%
54%
54%
55%
55%
56%
57%
38%
39%
39%
40%
40%
41%
42%
2020-2026E
CHANGE:
Western Europe -1pp
Central &
Eastern Europe
-4pp
U.S. -17pp
APAC
(excluding China, India)
-4pp
Latin America -4pp
Middle East & Africa +2pp
53%
55%
56%
57%
62%
65%
1. “Pay TV” is defined as traditional Pay TV (i.e. TV delivered through a set-top box) and virtual Pay TV (i.e. TV delivered through
the internet without a set-top box).
Sources: Activate analysis, Omdia, PricewaterhouseCoopers, S&P Global
VIDEO
www.activate.com 
78
CONTENTS PAGE
$420B Global Technology and Media Growth Dollars Up for Grabs 4
Consumer Technology and Media Time and Attention 9
Super Users: The Critical Segment for Technology and Media Companies 15
eCommerce and Marketplaces: Growth will Continue Across Categories
With Major Consumer Trends Serving as Tailwinds 29
Video: Streaming and Social Drive Growth 47
Gaming and Esports: A Mainstream Behavior and Precursor to The Metaverse 78
NFTs: Past the Hype Cycle, Towards Tangible Use Cases 95
Metaverse: Time for Practical Applications 108
Audio: Digital Audio Will Drive More Consumer Time and Spend 138
Sports and Sports Betting: Younger Next-Gen Sports Fans Drive Growth 152
Digital Fitness: Consumer Adoption Will Continue to Grow 167
2019 1,988M
864M
124M

79
GAMING POPULATION BY REGION, GLOBAL, 2019 VS. 2022E, MILLIONS GAMERS1
2019-2022E
CAGR:
6%
There are nearly 150M active gamers in the U.S. today, up from
124M in 2019
1. “Gamers” are defined as adults aged 18+ who currently play video games.
Sources: Activate analysis, Activate 2019 Consumer Technology & Media Research Study (n = 4,006), Activate 2022 Consumer
Technology & Media Research Study (n = 4,001), Newzoo, U.S. Census Bureau
U.S.
2022E 2,364M
917M
148M 2,217M
1,864M
INTERNATIONAL
GAMING AND ESPORTS
We forecast that the global video game market will grow to nearly
$220B by 2026, with over $50B generated in the U.S.

80
CONSUMER VIDEO GAME REVENUE BY REGION1, GLOBAL, 2018 VS. 2022E VS. 2026E, BILLIONS USD
2018 2022E 2026E
$218B
$182B
$128B $166B
$140B
$99B
$52B
$42B
$29B
9%
10%
5%
5%
2018-2022E
CAGR:
2022E-2026E
CAGR:
9%
5%
INTERNATIONAL
U.S.
1. Excludes hardware and device sales, augmented reality / virtual reality content, and advertising.
Sources: Activate analysis, Newzoo, Omdia, PricewaterhouseCoopers
GAMING AND ESPORTS
HABITUAL GAMERS2 RECREATIONAL GAMERS3 OCCASIONAL GAMERS4
• Play video games as their primary
source of entertainment
• Follow gaming content online
(e.g. watch playthroughs, read
reviews)
• Play video games as one of a few
equivalent sources of entertainment
• May follow gaming content online
• Play video games only when other
sources of entertainment are
unavailable
• Are unlikely to follow gaming
content online
35%
OF U.S. GAMERS1
51M
IN THE U.S.
36%
OF U.S. GAMERS1
54M
IN THE U.S.
29%
OF U.S. GAMERS1
43M
IN THE U.S.
We have segmented the gaming population by their level of
engagement within the space, from the most involved Habitual
Gamers to the more infrequent Occasional Gamers

81
OUR RESEARCH SHOWS THAT U.S. GAMERS1 FALL INTO ONE OF THREE SEGMENTS…
1. “Gamers” are defined as adults aged 18+ who currently play video games. 2. “Habitual Gamers” are defined as gamers
who view gaming as their primary source of entertainment and follow gaming content online. 3. “Recreational Gamers” are
defined as gamers who view gaming as one of a few equivalent options for entertainment, or gamers who view gaming as
their primary source of entertainment but do not follow gaming content online. 4. “Occasional Gamers” are defined as
gamers who only view gaming as an entertainment option when other options are not available, or gamers who view gaming
as one of a few equivalent options for entertainment but do not follow gaming content online.
Sources: Activate analysis, Activate 2022 Consumer Technology & Media Research Study (n = 4,001), U.S. Census Bureau
GAMING AND ESPORTS
28%
19%
41%
27%
45%
49%
41%
53%
67%
% Habitual Gamers % Recreational Gamers % Occasional Gamers

82
DEMOGRAPHICS BY GAMER1 SEGMENT,
U.S., 2022, % GAMERS1 BY SEGMENT
MULTI-PLATFORM USAGE BY GAMER1 SEGMENT,
U.S., 2022, % GAMERS1 BY SEGMENT
2 3 4
41%
74%
86%
Multi-
platform
gamers5
Compared to
Occasional
Gamers4…
…as much
time per week
playing video
games
Habitual
Gamers2 spend
2.4x
Recreational
Gamers3 spend
1.7x
Gamers in each segment are demographically and behaviorally distinct:
Habitual Gamers are more likely to be male, younger, and higher-
income, and they dedicate more time to gaming across multiple devices
1. “Gamers” are defined as adults aged 18+ who currently play video games. 2. “Habitual Gamers” are defined as gamers
who view gaming as their primary source of entertainment and follow gaming content online. 3. “Recreational Gamers” are
defined as gamers who view gaming as one of a few equivalent options for entertainment, or gamers who view gaming as
their primary source of entertainment but do not follow gaming content online. 4. “Occasional Gamers” are defined as
gamers who only view gaming as an entertainment option when other options are not available, or gamers who view
gaming as one of a few equivalent options for entertainment but do not follow gaming content online. 5. “Multi-platform
gamers” are defined as gamers who currently play video games across two or more platforms (i.e. mobile, PC, console).
Sources: Activate analysis, Activate 2022 Consumer Technology & Media Research Study (n = 4,001)
Have a household
income of $100K
or greater
Are male
Are aged 18-34
GAMING AND ESPORTS
2 3 4
Participation in
Social
Activities
Within Games
SOCIAL ACTIVITIES WITHIN GAMES INCLUDE:
Socializing with friends/family or meeting new people; attending educational
classes, work-related meetings, networking events, or live in-game
performances; watching in-game movies, TV shows, or previews; traveling to
virtual versions of real-world locations
Participation in
Creation
Activities
Within Games
CREATION ACTIVITIES WITHIN GAMES INCLUDE:
Creating/personalizing characters/avatars, items, places, maps, or new
games/levels
Participation in
Transactional
Activities
Within Games
TRANSACTIONAL ACTIVITIES WITHIN GAMES INCLUDE:
Purchasing game skins, emotes, and other in-game personalization content/
items; purchasing virtual versions of brand-name items; selling virtual goods/
items to other players; completing jobs in games in exchange for money from
other players; offering money to other players in exchange for completing jobs;
investing, lending, or borrowing money; betting/gambling; owning virtual land
13%
23%
19%
55%
67%
58%
85%
86%
85%
% Habitual Gamers % Recreational Gamers % Occasional Gamers
Habitual Gamers will be the earliest adopters of the Metaverse as
they already take advantage of opportunities for immersive
activities within games today

83
76%
of Habitual
Gamers2
participated in
all three types of
activities within
games in the
last 12 months
1. “Gamers” are defined as adults aged 18+ who currently play video games. 2. “Habitual Gamers” are defined as gamers
who view gaming as their primary source of entertainment and follow gaming content online. 3. “Recreational Gamers” are
defined as gamers who view gaming as one of a few equivalent options for entertainment, or gamers who view gaming as
their primary source of entertainment but do not follow gaming content online. 4. “Occasional Gamers” are defined as
gamers who only view gaming as an entertainment option when other options are not available, or gamers who view gaming
as one of a few equivalent options for entertainment but do not follow gaming content online.
Sources: Activate analysis, Activate 2022 Consumer Technology & Media Research Study (n = 4,001)
PARTICIPATION IN SELECT METAVERSE ACTIVITIES WITHIN GAMES BY GAMER1 SEGMENT, U.S., 2022, % GAMERS1 BY SEGMENT
GAMING AND ESPORTS
The top-performing PC and console game titles of the last year
offer cross-platform, multiplayer, and open-world features to
enable creative and connected experiences for gamers

84
TOP-EARNING PAID PC AND CONSOLE VIDEO GAME TITLES, U.S., 2021
1. Multiplayer mode is expected to launch on Oct. 28, 2022.
Sources: Activate analysis, Company sites, NPD Group
NINTENDO SWITCH PLAYSTATION XBOX DESKTOP/LAPTOP
MARVEL'S SPIDER-MAN:
MILES MORALES MARIO KART 8 RESIDENT EVIL:
VILLAGE1
MLB:
THE SHOW 21
SUPER MARIO
3D WORLD
CALL OF DUTY:
VANGUARD
CALL OF DUTY:
BLACK OPS COLD WAR
MADDEN NFL 22 POKEMON:
BRILLIANT DIAMOND / SHINING PEARL
BATTLEFIELD 2042
2 3 4 5
1
7 8 9 10
6
Includes Open World
(i.e. ability to freely explore
and interact with environment)
Includes Multiplayer
(i.e. ability to play with others)
GAMING AND ESPORTS
MOBILE
GAMING TITLE REVENUE3 SOCIAL FEATURES/REWARDS
In-Game
Chat
Feature
Ability to
Connect to
Social Media
Ability
to Form
Teams
$2.8B
• Ability to share highlights and results via chat
• Ability to invite and compete with players from the same region
$2.8B
• Cooperative play with five people
• Integrations with social or messaging platforms (e.g. WeChat, QQ)
Genshin Impact $1.8B
• Ability to invite others to online cooperative mode
• Built-in chat system to communicate within server —
$1.3B
• Ability to invite others to specific servers
• Increasing in-game payouts based on engagement
$1.3B
• Bonuses for linking to social media accounts (e.g. Facebook)
• In-game rewards for inviting friends
$1.2B
• Ability to send in-game gifts to others
• Bonuses based on tiered “Friendship Levels”
Announced
The top-earning mobile game titles offer integrated social features
and unique rewards for playing online with friends, suggesting that
gaming is increasingly a community-driven behavior

85
TOP-EARNING1 MOBILE GAME TITLES, GLOBAL, 20212, BILLIONS USD
1. Top-earning mobile games on the Google Play Store and Apple App Store. Excludes third-party app stores.
2. Between Jan. 1, 2021 and Dec. 14, 2021.
Sources: Activate analysis, Company sites, Sensor Tower
TOP MOBILE GAMES ENCOURAGE PLAYERS TO ENGAGE SOCIALLY WITH OTHERS
GAMING AND ESPORTS
Games
Expansions/
Add-Ons
Performance
Items
(e.g. weapon upgrades,
character attribute
boosts)
Non-Performance
Items
(e.g. clothes, skins,
stickers, dances, poses) 22%
8%
15%
35%
43%
35%
44%
70%
57%
37%
54%
79%
% Habitual Gamers % Recreational Gamers % Occasional Gamers
Gamers on average are spending more than ever as content offerings
become more varied — Habitual Gamers are especially eager to spend
on add-ons and items to enhance their experiences

86
AVERAGE MONTHLY SPEND PER GAMER1,
U.S., 2019-2022E, USD PER MONTH
GAMING PURCHASES BY PURCHASE TYPE AND GAMER1
SEGMENT, U.S., 2022, % GAMERS1 WHO SPEND ON GAMING
CONTENT BY SEGMENT
2019 2020 2021 2022E
$23.87
$19.93
$17.10
$19.04
2 3 4
1. “Gamers” are defined as adults aged 18+ who currently play video games. 2. “Habitual Gamers” are defined as gamers
who view gaming as their primary source of entertainment and follow gaming content online. 3. “Recreational Gamers” are
defined as gamers who view gaming as one of a few equivalent options for entertainment, or gamers who view gaming as
their primary source of entertainment but do not follow gaming content online. 4. “Occasional Gamers” are defined as
gamers who only view gaming as an entertainment option when other options are not available, or gamers who view
gaming as one of a few equivalent options for entertainment but do not follow gaming content online.
Sources: Activate analysis, Activate 2019 Consumer Technology & Media Research Study (n = 4,006), Activate 2020
Consumer Technology & Media Research Study (n = 4,003), Activate 2021 Consumer Technology & Media Research Study
(n = 4,018), Activate 2022 Consumer Technology & Media Research Study (n = 4,001)
2019-2022E
CAGR:
8%
GAMING AND ESPORTS
In-game advertising captures consumer attention in exchange for
free in-game content; Habitual Gamers are most receptive to in-game
advertising, especially on mobile

87
WILLINGNESS TO VIEW IN-GAME ADVERTISEMENTS IN EXCHANGE FOR FREE IN-GAME CONTENT BY PLATFORM,
U.S., 2022, % GAMERS1 WHO USE EACH PLATFORM BY SEGMENT
27%
24%
40%
43%
41%
50%
69%
72%
77%
% Habitual Gamers % Recreational Gamers % Occasional Gamers
CONSOLE
MOBILE
PC
2 3 4
Extremely or very willing to view in-game ads for free in-game content on…
1. “Gamers” are defined as adults aged 18+ who currently play video games. 2. “Habitual Gamers” are defined as gamers
who view gaming as their primary source of entertainment and follow gaming content online. 3. “Recreational Gamers”
are defined as gamers who view gaming as one of a few equivalent options for entertainment, or gamers who view
gaming as their primary source of entertainment but do not follow gaming content online. 4. “Occasional Gamers” are
defined as gamers who only view gaming as an entertainment option when other options are not available, or gamers
who view gaming as one of a few equivalent options for entertainment but do not follow gaming content online.
Sources: Activate analysis, Activate 2022 Consumer Technology & Media Research Study (n = 4,001)
GAMING AND ESPORTS
Gaming IP is increasingly leveraged in all forms of media and
entertainment as studios capitalize on increased consumer affinity
and demand

88
SONIC THE
HEDGEHOG 2
APRIL 2022
Sonic the Hedgehog 2
became the top-
grossing video game
movie of all time,
earning $331M at the
box office
The Sonic the Hedgehog
game series sold ~5M
units in 2022,
quadrupling from 2021
THE WITCHER
DECEMBER 2021
Netflix released
Season 2 of The
Witcher, a fantasy
drama TV series
Following the release,
The Witcher video
game spiked to 71,000
concurrent players
UNCHARTED
FEBRUARY 2022
Uncharted became the
fifth-highest-grossing
video game movie of
all time
The movie had a
budget of $120M and
starred Tom Holland
and Mark Wahlberg
HALO:
THE SERIES
MARCH 2022
This science fiction
series was developed
for Paramount+
Halo is now the
streaming service’s
second-most-watched
original series
Sources: Activate analysis, Company press releases, Company sites
SELECT TV/FILM ADAPTATIONS OF GAMING IP
GAMING AND ESPORTS
Technology companies are increasingly taking a full-stack approach to
build out capabilities in the gaming space as consumer demand grows
NETFLIX NINTENDO VALVE
GAME
PUBLISHER
VIRTUAL
WORLD
CONSOLE3
AR/VR DEVICE
CLOUD
APP STORE
SUBSCRIPTION
SERVICE
GAMING AS
VIDEO
1. Information as of Oct. 2022. Does not include areas in which company is a majority stakeholder. 2. Engine created by Valve
and game eventually published by Valve, but independently developed by Garry Newman and Facepunch Studios. 3. Excludes
devices with a primary purpose other than gaming (e.g. Apple TV). 4. Co-developed by Logitech and Tencent. 5. Meta does not
offer a standalone cloud service but allows streaming of select games through Facebook on Android and web. The standalone
Facebook Gaming app for iOS and Android will be shut down in Oct. 2022 but gaming features will remain available in the main
Facebook app. 6. Only available through a bundle with Xbox Game Pass Ultimate. 7. On a game-by-game basis, not as a
subscription or service.
Sources: Activate analysis, Company press releases, Company sites 
89
SELECT COMPANIES’ PRESENCE IN GAMING1
EGAME
Announced,
not yet released
*
*
5
*
7
4
*
5
*
2
6
6
Store
GAMING AND ESPORTS
Major technology companies are leveraging their scale to acquire game
publishers in pursuit of full-stack gaming capabilities — this is only the beginning
for M&A in the gaming space, as we expect industry consolidation to continue

90
ACQUIRING
COMPANY
TARGET
COMPANY
DATE OF
ANNOUNCEMENT
ACQUIRING
COMPANY
MARKET CAP1
REPORTED
TRANSACTION
VALUE
RATIONALE
Microsoft Activision Jan. 2022 $1,830B $68.7B
Provide building blocks
for the Metaverse
Take-Two Zynga Jan. 2022 $20.6B $12.7B Expand into mobile gaming
Sony Bungie Jan. 2022 $80.5B $3.6B
Expand live service
game offerings
Embracer Group Asmodee Dec. 2021 $5.47B $3.0B Improve player experience
Savvy Gaming Group ESL / FACEIT Jan. 2022 Undisclosed $1.5B
Improve capabilities and
resources in esports
Embracer Group
Square Enix
Western Studios
May 2022 $5.47B $0.3B
Create new installments
from original IP
Stillfront Group 6waves Jan. 2022 $1.26B $0.2B
Strengthen presence in free-
to-play gaming and the
Japanese market
Sony Savage Game Studios Aug. 2022 $80.5B UNDISCLOSED Expand to additional platforms
1. Market capitalizations as of Oct. 24, 2022.
Sources: Activate analysis, Company press releases
RECENT ACQUISITIONS OF GAMING STUDIOS
GAMING AND ESPORTS
1. “Esports viewers” (2019) are defined as adults aged 18+ who have watched an esports competition at any point in time.
2. “Esports viewers” (2022) are defined as adults aged 18+ who have watched or attended an esports competition within the last
12 months. 3. Figures do not sum to 100% due to rounding. 4. “Gamers” are defined as adults aged 18+ who currently play
video games. 5. “Occasional Gamers” are defined as gamers who only view gaming as an entertainment option when other
options are not available, or gamers who view gaming as one of a few equivalent options for entertainment but do not follow
gaming content online. 6. “Recreational Gamers” are defined as gamers who view gaming as one of a few equivalent options for
entertainment, or Gamers who view gaming as their primary source of entertainment but do not follow gaming content online.
7. “Habitual Gamers” are defined as gamers who view gaming as their primary source of entertainment and follow gaming
content online.
Sources: Activate analysis, Activate 2019 Consumer Technology & Media Research Study (n = 4,006), Activate 2022 Consumer
Technology & Media Research Study (n = 4,001), U.S. Census Bureau
2019 2022E
64M
39M
There are over 64M esports viewers in the U.S. today — while the
majority of esports viewers are also gamers, there are key differences
in the populations the two spaces attract

91
ESPORTS VIEWERSHIP, U.S., 2019 VS.
2022E, MILLIONS ESPORTS VIEWERS1,2
ESPORTS VIEWERS2 BY GAMER
SEGMENT3, U.S., 2022,
% ESPORTS VIEWERS2
ESPORTS VIEWER2 AND GAMER4
DEMOGRAPHICS, U.S., 2022,
% ESPORTS VIEWERS2 VS. % GAMERS4
Have a household
income of $100K
or greater
2 4
Are male
32%
43%
53%
68%
% Esports Viewers % Gamers
40%
57%
Are aged 18-34
2019-2022E
CAGR:
18%
Esports Viewers
7%
3%
30%
59%
Habitual
Gamers7
Recreational
Gamers6
Occasional
Gamers5
Non-Gamers4
2
3%
7%
GAMING AND ESPORTS
The global esports audience has already surpassed half a billion
viewers and will continue to grow as the space develops

92
ESPORTS VIEWERSHIP, GLOBAL, 2022E-2026E, MILLIONS ESPORTS VIEWERS
Sources: Activate analysis, Activate 2022 Consumer Technology & Media Research Study (n = 4,001), Newzoo
2022E 2023E 2024E 2025E 2026E
722M
679M
638M
600M
564M
ACTIVATE
FORECAST
2022E-2026E
CAGR:
6%
GLOBAL
ESPORTS
AUDIENCE
GAMING AND ESPORTS
The future of esports will be driven by media rights and distribution
to capture incremental audiences

93
ESPORTS REVENUE BY TYPE, GLOBAL, 2022E VS. 2026E, BILLIONS USD
Sources: Activate analysis, Activate 2022 Consumer Technology & Media Research Study (n = 4,001), Company press releases,
Newzoo, Omdia, PricewaterhouseCoopers
2022E 2026E
$6.1B
$4.1B
$2.1B
$1.4B
$4.0B
$2.7B
B2B Spend
(e.g. sponsorships,
advertising, media rights)
Consumer Spend
(e.g. tickets,
merchandise, betting)
2022E-2026E
CAGR:
10.5%
10.9%
SELECT DEVELOPMENTS IN
ESPORTS MEDIA RIGHTS
CS:GO esports series BLAST Premier has agreed to
35 media deals for the broadcast of its 2022 season
G4, the exclusive media rights partner to ESL
Gaming, has partnered with Pluto TV to distribute
its content through ad-supported free streaming
10.8%
GAMING AND ESPORTS

94
Growing esports markets will have an amplified impact across
technology and media, enabling a broad set of other digital activities
Esports followers1 are…
Have Bought/Sold/Created NFTs2 Have Used/Acquired Cryptocurrency2 Own Connected Fitness Equipment3 Use VR Headsets2
Listen to Podcasts Watch Live Sports2 Listen to Music Use Social Media
…as non-esports followers1
1. “Esports followers” are defined as adults aged 18+ who have attended esports events or watched, listened to, or read esports
content (e.g. highlights, news, competitions) in the last 12 months. 2. Based on behaviors in the last 12 months. 3. “Connected
fitness equipment” is defined as internet-connected exercise equipment with social / live-class capabilities. Ownership is
defined at the household level.
Sources: Activate analysis, Activate 2022 Consumer Technology & Media Research Study (n = 4,001)
17.7x 7.9x 7.8x 6.5x
as likely to as likely to as likely to as likely to
3.4x 1.6x 1.3x 1.3x
as likely to as likely to as likely to as likely to
MEDIA BEHAVIORS, U.S., 2022, ESPORTS FOLLOWERS1 INDEXED TO NON-ESPORTS FOLLOWERS1
GAMING AND ESPORTS
www.activate.com 
95
CONTENTS PAGE
$420B Global Technology and Media Growth Dollars Up for Grabs 4
Consumer Technology and Media Time and Attention 9
Super Users: The Critical Segment for Technology and Media Companies 15
eCommerce and Marketplaces: Growth will Continue Across Categories
With Major Consumer Trends Serving as Tailwinds 29
Video: Streaming and Social Drive Growth 47
Gaming and Esports: A Mainstream Behavior and Precursor to The Metaverse 78
NFTs: Past the Hype Cycle, Towards Tangible Use Cases 95
Metaverse: Time for Practical Applications 108
Audio: Digital Audio Will Drive More Consumer Time and Spend 138
Sports and Sports Betting: Younger Next-Gen Sports Fans Drive Growth 152
Digital Fitness: Consumer Adoption Will Continue to Grow 167
In 2022, NFTs passed their peak hype, making way for more
tangible use cases

96
“HYPE CYCLE”1 FOR NFTS AND RELATED TOPICS, U.S., SEPT. 2022
1. “Hype cycle” is defined as a visual representation of the path from initial interest to widespread adoption of a new
technology / technology application over time. 2. ”Hype" is derived from average Google Trends search frequency.
Sources: Activate analysis, Google Trends, PitchBook
HYPE
2
PHASE
ACTIVATE “HYPE CYCLE”1
INITIAL
INTEREST
HYPE
BUBBLE
DISSATISFACTION
BACKLASH
PRACTICAL
APPLICATION
DEVELOPMENT
WIDESPREAD
ADOPTION
Decentralized
Autonomous
Organization
Web3
Cryptocurrencies
Decentralized
Finance
• Past peak hype bubble
• Hype to decline further as NFT landscape
matures
• Continued Blockchain and Web3 innovation
to provide tailwinds driving NFT utility
NFTS’ POSITION IN “HYPE CYCLE”1
ACTIVATE POINT OF VIEW
The end of excessive NFT hype is making way for a
new set of more tangible use cases rooted in
established technology and media behaviors
(e.g. commerce, social)
Moving forward, these use cases will focus on
problems that NFTs have a strong rationale for
solving, such as community building and rewarding
loyal brand users
User rationale for purchasing NFTs has also changed,
moving away from investment use cases and towards
displaying and collecting
NFT companies have continued to be attractive
targets for investors and have grown substantially in
the last 12 months, reflecting continued interest in
the NFT market (despite falling cryptocurrency values
driving down NFT prices)
1
2
3
4
NFTs
NFT usage is still a relatively nascent behavior, with less than one third
of the population aware of what NFTs are and relatively younger and
more affluent consumers leading the way

97
1. “Aware of NFTs” is defined as knowing what NFTs are. 2. “NFT market participants” are defined as those who researched/
discussed, browsed, bid on, purchased, displayed, sold, or created NFTs in the last 12 months.
Sources: Activate analysis, Activate 2021 Consumer NFT Research Study (n = 1,040), Activate 2022 Metaverse & NFT
Consumer Research Study (n = 3,078)
NFT AWARENESS1 AND PARTICIPATION2,
U.S., 2021 VS. 2022, % ADULTS AGED 18+
NFT MARKET PARTICIPANT2 DEMOGRAPHICS,
U.S., 2022, % NFT MARKET PARTICIPANTS2 AGED 18+
18%
32%
12%
27%
2021 2022
Aware of NFTs1 NFT Market Participants2

97
Less than $25K
$25K-$50K
$50K-$100K
$100K+
NFT MARKET PARTICIPANTS2
BY HOUSEHOLD INCOME
15%
17%
25%
43%
Aged 18-44
Aged 45+
NFT MARKET PARTICIPANTS2
BY AGE GROUP
25%
75%
NFTs
Consumers are moving away from primarily buying NFTs as
investments and towards other tangible use cases, such as displaying
and collecting digital items

98
1. Consumers were asked to select up to two top reasons. 2. “NFT purchasers” are defined as adults 18+ who have
purchased NFTs in the last 12 months.
Sources: Activate analysis, Activate 2021 Consumer NFT Research Study (n = 1,040), Activate 2022 Metaverse & NFT
Consumer Research Study (n = 3,078)
INVESTMENT
DISPLAY OF
DIGITAL ITEMS
COLLECTION OF
DIGITAL ITEMS
INNOVATIVENESS/
NOVELTY
SUPPORT FOR
FAVORITE ARTISTS/
ATHLETES
2021 2022
-25pp
14%
20%
22%
33%
51%
12%
32%
18%
14%
76%
+19pp
-12pp
+4pp
+2pp
TOP REASONS1 FOR PURCHASING NFTS,U.S., 2021 VS. 2022, % NFT PURCHASERS2
NFTs
Moving forward, NFTs can add the most value through creating
exclusive digital communities and rewarding loyal customers
Sources: Activate analysis, Company sites
Community Building: NFTs enable digital
communities to form around the ownership of
scarce collectibles
• Sellers: Enables the leveraging of a community
vs. a one-off sale
• Buyers: Provides outlet for connection and
feelings of belonging in digital spaces
Bored Ape Yacht Club’s success
hinges upon scarcity; there are
only 10,000 unique Bored Ape
NFTs in existence, so
membership is limited and
exclusive, similar to physical
membership clubs
(e.g. Soho House)
Rewarding Loyal Users: NFTs can function as a
way to reward loyal customers with perks and
connections to the brand
•Sellers: Develops a more engaged customer base
•Buyers: Allows customers to connect with,
support, and invest in the brand in novel ways
Starbucks plans to create a
series of branded NFT
collections, which will allow
members to access exclusive
experiences and rewards
(e.g. espresso martini-making
class, exclusive artwork)

99
SELECT NFT USE CASES
NFTs
Community Building: Many NFT projects are finding success online
through Discord, beginning with the development of a project server
and eventually growing into a global community

100
Sources: Activate analysis, Chain Debrief, Company sites, Cyber Scrilla, Token Minds, Wealth Quint
ORIGINATION PROMOTION
COMMUNITY
FORMATION
MAINTAINING
POPULARITY
NFT teams begin initial
project development by
creating a Discord server,
where investors, artists,
digital developers,
businesses, and fans come
together in a community chat
to collaborate and discuss
new ideas
Next, teams begin promotion
of the project through
methods such as inviting
users via social media,
sharing the Community
Server link through existing
channels, and making the
platform settings public and
discoverable to all users
Teams then develop a
community by engaging in
conversation with followers,
maintaining standard rules,
hosting frequent Q&A
sessions and competitions,
and offering whitelist
memberships, guaranteeing
early access to NFT minting
Finally, teams maintain this
following through large-scale
initiatives like collaboration
with other NFT teams, one-
time NFT giveaways or
exclusive line drops, and
partnering with NFT / social
media influencers
1
1 2
2 3
3 4
4
NFT PROJECT GROWTH PROCESS ON DISCORD
NFTs
Sources: Activate analysis, Company sites
INSTAGRAM
Description:
Instagram allows users to integrate their
digital wallet into their profile to display
their NFT collection
Activate Perspective:
The ability to integrate NFTs
seamlessly into profiles will be critical
for NFT use in social media
TIKTOK
Description:
TikTok released three one-of-one and
limited-edition drop NFTs of viral videos
through TikTok Top Moments, but faced
issues releasing more due to waning user
interest
Activate Perspective:
Social media companies must provide
a clear utility to users when launching
NFT projects to achieve success
TWITTER
Description:
Twitter launched support for NFT profile
pictures, which take on a distinct
hexagonal shape
Activate Perspective:
The ability to signal membership in
exclusive clubs remains the major use
case for NFTs in social media
Community Building: Social media companies are integrating
features to support users who want to display NFTs as part of a
community identification

101
EXAMPLE NFT USE CASES IN SOCIAL MEDIA
NFTs
Rewarding Loyal Users: eCommerce Brands will use NFTs that are
redeemable for physical goods as a rewards system for their most
loyal customers

102
EXAMPLE NFT USE CASES IN ECOMMERCE
Sources: Activate analysis, Company sites
LOYALTY
Description:
Existing brands can offer
NFTs to reward their most
engaged clients, which can
include attaching physical
perks to digital collectibles
Example:
Clinique ran a competition for its loyalty program
members, offering a limited-edition NFT to three
winners, which gave them access to exclusive products
each year for the next decade
Activate Perspective:
The most successful innovators
with NFTs will be able to provide
consumers with tangible benefits
(e.g. physical product
counterparts, exclusive product
launches, influence on future
products)
PRODUCT
CONTRIBUTION
Description:
Emerging brands are using
NFTs as part of their
customer rewards strategy,
promising collectibles as
incentives for early adopters
Example:
Try Your Best is a Web3 platform designed to help
consumer goods brands offer their most loyal customers
incentives to share their feedback and preferences
in exchange for collectible NFTs,
physical products, and the ability
to influence product choices
(e.g. packaging colors)
See full wallet
Joggy
We’re picking packaging
colors. Help us choose!
Earn a Joggy Doggy collectible
NFTs
PROMOTIONS/
LOYALTY
Being gifted NFT(s) for free
as part of a promotion/loyalty
program from a brand/artist
PURCHASES Paying for NFT(s)
EXCHANGES
Receiving NFT(s) in exchange
for a non-monetary action
(e.g. leaving a review)
GAMES
Earning NFT(s) through
playing a game
Rewarding Loyal Users: Promotional/loyalty campaigns are the most
common pathway to NFT ownership as companies look for new ways
to reward their loyal customers

103
METHODS OF NFT ACQUISITION IN THE LAST 12 MONTHS, U.S., 2022, % NFT OWNERS AGED 18+
Sources: Activate analysis, Activate 2022 Metaverse & NFT Consumer Research Study (n = 3,078), Insider, The Verge
33%
35%
38%
46%
PROMOTION/
LOYALTY
EXAMPLES
BURGER KING, “KEEP IT REAL MEALS”
NFT CAMPAIGN: QR CODE LEADING TO
DIGITAL COLLECTIBLE ON NEARLY SIX
MILLION MEAL BOXES. REWARDS INCLUDED:
• WHOPPER SANDWICHES FOR A YEAR
• AUTOGRAPHED GOODS
• PHONE CALL WITH ONE OF THE
CAMPAIGN’S CELEBRITIES
NFL, COMPLIMENTARY NFTS
FOR SELECT GAMES: THE LEAGUE
DISTRIBUTED MORE THAN 500,000
COMPLIMENTARY VIRTUAL COMMEMORATIVE
TICKET NFTS TO FANS
NFTs
While NFT sales growth has slowed recently, overall sales volume has
already exceeded $23B in 2022, underscoring continued consumer
interest

104
$23.0B
$15.1B
YTD Aug.
2021
YTD Aug.
2022
$1.1B
$1.3B
$1.4B
$3.0B
$4.0B
$2.6B
$3.8B
$5.8B
$3.8B
$3.7B
$4.1B
$4.3B
$6.2B
$1.7B
$0.9B
$2.5B
$1.5B
$1.1B
$0.9B
$0.1B
2021 2022
Jan. Feb. Mar. Apr. May June July Aug. Sept. Oct. Nov. Dec. Jan. Feb. Mar. Apr. May June July Aug.
2022
YoY
Change
-82%
57%
18%
164%
126%
309%
>5000%
2022
YoY
Change
53%
Part of this spike can be
attributed to the launch of
the Mutant Apes collection
by Bored Ape Yacht Club’s
NFT project
There is significant
NFT sales volume in
2022, with a positive
YoY growth rate for
every month except
July and August
-24%
TOTAL SALES OF NFTS1, GLOBAL, 2021-YTD AUG. 2022, USD BILLIONS
1. Includes primary and secondary market sales. 95% of the sales from LooksRare is excluded due to wash trading. Wash
trading is an act where a trader sells an asset belonging to them to another wallet controlled by them (often to game platform
financial incentives).
Sources: Activate analysis, Bloomberg, CryptoSlam, DappRadar
NFTs
Jan. Feb. Mar. Apr. May June July Aug. Sept.
0%
50%
100%
150%
200%
NFT Sales
Ethereum Price
Recent trends in the NFT market have mirrored those in
cryptocurrency, given the overlap of users and dependencies on
cryptocurrency for purchasing

105
1. Includes primary and secondary market sales for the trailing one month period. 2. Relative to USD for the trailing one month
period. 3. Refers to minted (i.e. created), verified, and tracked NFTs.
Sources: Activate analysis, Activate 2022 Metaverse & NFT Consumer Research Study (n = 3,078), Company sites, CryptoSlam,
DappRadar, NonFungible
• Ethereum is the underlying blockchain for
over 86% of current NFTs3
• As a general rule, consumers can only
purchase NFTs using cryptocurrency,
typically Ethereum
• There is a significant overlap of purchasers
for NFTs and cryptocurrency, with over two
thirds of NFT purchasers also purchasing
cryptocurrency
• Given this, when cryptocurrency prices
(especially Ethereum) decline, it has a direct
impact on NFT sales value when expressed
in fiat currency (e.g. USD)
2
1
Pak’s “Clock” sells for
$53M; CryptoPunks
nets $30M in four days
Bored Ape Yacht Club
sales eclipse $200M in
one week
RATIONALE
FOR COMPARING NFT SALES
TO ETHEREUM PRICE
AVERAGE NFT SALES1 AND ETHEREUM PRICE2,
GLOBAL, YTD SEPT. 2022, % INDEXED TO JAN. 1, 2022
NFTs
Significant growth in funding for NFT-related ventures in 2022 will further
support NFT use cases, especially those related to Gaming and Marketplaces,
which have made up more than 70% of all investments

106
TOP NFT INVESTMENT CATEGORIES BY FUNDING SIZE1, GLOBAL, SEPT. 2020-SEPT. 2022, MILLIONS USD
CATEGORY PRIMARY FOCUS EXAMPLES
GAMING Building NFT-native games
NFT
MARKETPLACES
Functioning as a place to buy
and sell third-party NFTs
TECHNOLOGY
Developing technology to enable
specific advancements in NFT
projects
INVESTING
Creating investment vehicles for
funding other NFT projects
MEDIA
Generating narrative storytelling
media content around NFT
projects
MUSIC
Supporting monetization of
musical content and
performances through NFTs $126M
$177M
$190M
$855M
$1,109M
$1,733M
$87M
$42M
$56M
$46M
$294M
$573M
Sept. 2020-Sept. 2021
Sept. 2021-Sept. 2022
1. Data is based on the 50 largest investments made in NFT projects between Sept. 8, 2020 and Sept. 7, 2021 and the 50 largest
investments made in NFT projects between Sept. 8, 2021 and Sept. 7, 2022.
Sources: Activate analysis, PitchBook
NFTs
More than 80% of NFTs are part of the Ethereum blockchain and the
majority of them go through the OpenSea marketplace

107
1. Includes primary and secondary market sales. 2. 95% of the sales from LooksRare is excluded due to wash trading. Wash
trading is an act where a trader sells an asset belonging to them to another wallet controlled by them (often to game platform
financial incentives). 3. Figures do not sum due to rounding. 4. Decline in “Other” is mainly due to the decline of Ronin NFT sales.
Sources: Activate analysis, BeinCrypto, CryptoSlam, DappRadar
SHARE OF NFT SALES1 BY BLOCKCHAIN,
GLOBAL, 2021 VS. YTD AUG. 2022, % NFT SALES1
SHARE OF NFT SALES1 BY MARKETPLACE2,3,
GLOBAL, 2021 VS. YTD AUG. 2022, % NFT SALES1
2021 YTD Aug. 2022
7%
30%
86%
66%
Other4
2021-YTD Aug. 2022
Change in Share:
+20pp
+3pp
-23pp Other
2021-YTD Aug. 2022
Change in Share:
-2pp
+3pp
+12pp
-13pp
12%
4%
7%
NFTs
2021 YTD Aug. 2022
7%
20%
12%
75%
77%
2% 6%
www.activate.com 
108
CONTENTS PAGE
$420B Global Technology and Media Growth Dollars Up for Grabs 4
Consumer Technology and Media Time and Attention 9
Super Users: The Critical Segment for Technology and Media Companies 15
eCommerce and Marketplaces: Growth will Continue Across Categories
With Major Consumer Trends Serving as Tailwinds 29
Video: Streaming and Social Drive Growth 47
Gaming and Esports: A Mainstream Behavior and Precursor to The Metaverse 78
NFTs: Past the Hype Cycle, Towards Tangible Use Cases 95
Metaverse: Time for Practical Applications 108
Audio: Digital Audio Will Drive More Consumer Time and Spend 138
Sports and Sports Betting: Younger Next-Gen Sports Fans Drive Growth 152
Digital Fitness: Consumer Adoption Will Continue to Grow 167
We believe that the Metaverse has just passed its peak hype cycle;
now is when companies need to begin sustained development
and investment

109
METAVERSE
1. Google Trends captures interest in a topic on a scale of 1-100 over time, with 100 representing the peak interest.
Sources: Activate analysis, Google Trends
TIME
2021 2022
2000
GOOGLE SEARCH INTEREST1 IN THE METAVERSE, U.S., JAN. 2021-OCT. 2022, INDEXED TO PEAK INTEREST
100
50
0
SUSTAINED
DEVELOPMENT
AND INVESTMENT
Companies need to identify the
opportunities and begin
sustained development
FOUNDATIONS OF
THE METAVERSE:
20+ YEARS IN THE MAKING
Early forms of virtual worlds
were developed via social
communities, simulations,
and games
PEAK OF THE
HYPE CYCLE
Rush of interest initially
triggered during the pandemic
and heightened by substantial
investments from major
industry players

110
Note: Not exhaustive. 1. Previously Android Market. Rebranded to Google Play in Mar. 2012. 2. CryptoPunks is an early NFT project developed on the
Ethereum blockchain. 3. Lens Studio is Snap’s AR platform available on mobile devices. 4. Previously Uplay+, Ubisoft+ is a game subscription service that
allows access to 100+ games. 5. Not exhaustive. Other Metaverse concerts include but are not limited to Ariana Grande in Fortnite, Charli XCX in Roblox,
BLACKPINK in PUBG, and BTS in Minecraft. 6. Top Shot is a collection of NFTs that showcase memorable NBA moments. 7. Rebranded from Oculus Quest
2. 8. Microsoft Mesh became available for limited preview in Mar. 2022. Initially announced in Mar. 2021. 9. As of Oct. 24, 2022. 10. Unreal Engine 5
released in 2022. Unreal Engine originally released in 1998. 11. 6G projected in the coming years. 12. Apple AR glass rumored. 13. PlayStation VR2
expected to launch in early 2023. 14. Unity Metacast to offer interactive 3D sports experiences.
Sources: Activate analysis, Company press releases, Company sites
TECHNOLOGY INNOVATIONS
METAVERSE EVENTS/PLATFORMS
Mesh
= virtual world platforms
2000-2005 2006-2010 2011-2016 2017-2018 2019 2020 2021
FIRST
NFTS
FORTNITE
CONCERT
FORTNITE
CONCERT
20229
IPO
CHANGES
NAME TO
HORIZON
WORLDS
CONCERT
PATENTS
TECHNOLOGY
METAVERSE
THEME PARK
RAISES $2B TO
FUND METAVERSE
EXPANSION
ANNOUNCES
INTENT TO
ACQUIRE
Beyond
10
METACAST
14
11
AR GLASS
12
13
5
5
2
6
3
ACQUIRES
4
Pro
METAVERSE
EMERGENCE
OF PRACTICAL
APPLICATIONS
(CONSUMER
AND
ENTERPRISE)
8
COACHELLAVERSE
1
7
The foundation for the Metaverse has been in development for the last
20 years through games, virtual experiences, and technologies; going forward
we will see the emergence of practical applications (consumer and enterprise)
5

111
Source: Activate analysis
METAVERSE
The Metaverse is already here (not years away): virtual worlds,
experiences, large scale user bases, functionality, IP, user agency,
and social activities largely exist inside of video games today and
will provide the foundation for the future
Video games
already offer
connected
immersive
experiences
at scale
Consumers are
participating in
non-gaming
activities and
demonstrating
social
behaviors
inside of video
games
User creation,
co-creation,
and building
are established
behaviors
(e.g. user-
generated
activities, games,
experiences, virtual
goods,
environments,
worlds)
Players control
their identity
Users can
customize a digital
persona in a virtual
world distinct from
their real-world
identity, for use in
virtual platforms
Digital twins as
mirrors of the
real world
(e.g. virtual
representations of
real-world spaces/
objects)
Established IP
and relatable
contexts and
characters
Technology,
game engines,
and platforms
already in
wide use
(e.g. game
mechanics,
concurrency,
social, AR/VR
integration,
security, identity,
content
moderation)
Large-scale,
established
global
economies
Eventually, all digital behavior and many daily activities will be in
Metaverse platforms; many of these take place in games today
SOCIAL ENTERPRISE
Communication Social
Networks
Messaging Workplace and
Productivity
Browsing Search
Telephony Dating/
Relationships
Shopping and
Marketplaces
Events/
Performances/
Exhibits
Learning Experience and
Content Creation
Sex and
Pornography
NFTs and Other
Digital Goods
Real Estate and
Land Ownership
Video Music Video Games
Advertising/
Sponsorships/
Partnerships
Trading and
Finance
Payments and
Currency
Gambling News Sports
ECONOMIES MEDIA EXPERIENCES

112
METAVERSE
Source: Activate analysis
WWW
Our research shows that the majority of gamers participate in non-
gaming, Metaverse-like activities inside of games

113
METAVERSE
1. “Gamers” are defined as adults aged 18+ who currently play video games.
Sources: Activate analysis, Activate 2022 Consumer Technology & Media Research Study (n = 4,001), Activate 2022 Metaverse
& NFT Consumer Research Study (n = 3,078), U.S. Census Bureau
PARTICIPATION IN NON-GAMING ACTIVITIES
OR EVENTS WITHIN VIDEO GAMES IN THE
LAST 12 MONTHS, U.S., 2022, % GAMERS1
77%
of gamers1 have
participated in non-
gaming activities
within games in the
last 12 months
PARTICIPATION IN NON-GAMING ACTIVITIES OR EVENTS WITHIN VIDEO
GAMES IN THE LAST 12 MONTHS, U.S., 2022, % GAMERS1
Watching movies, TV shows,
and previews
Socializing / meeting new people
Creating/personalizing
a virtual character/avatar
Creating/personalizing virtual items
Creating/personalizing
virtual places or maps
Purchasing virtual goods
Betting/gambling
Creating new games/levels
Trading or gifting items
Purchasing physical goods 18%
19%
21%
21%
24%
24%
30%
34%
47%
48%
100% = 148M U.S. Gamers1
10:12
10:06
10:25
202M
140M
81M
27M
20M
Other
4
2
1
3
5
Today, there are over 300M people globally who spend a great part
of their lives in the major virtual world Metaverse games

114
METAVERSE
1. Estimate. 2. As of Aug. 2021. 3. As of June 2020. 4. Includes MAUs for all Blizzard Entertainment games as of June 2022.
5. As of Mar. 2022. Users predominantly in China, Japan, and South Korea. 6. Includes France, Germany, UK, and U.S.
Sources: Activate analysis, Company filings, Company press releases, DappRadar, Naver, Newzoo, RTrack, Yahoo
GLOBAL MAUs
AVERAGE TIME SPENT PER MONTH BY METAVERSE GAME,
SELECT COUNTRIES6, 2022, HOURS:MINUTES
Media and Technology Super Users are Metaverse Natives; over 80%
of Super Users have used a Metaverse platform in the last 12 months

115
ROBOTO BOLD 16PT, ROBOTO REGULAR 16 PT
METAVERSE
1. “Metaverse platforms” are defined as platforms with immersive virtual worlds, within which consumers can explore with
a personalized character/avatar, interact with other users, and participate in a range of activities (e.g. online concerts, online
games, online work meetings). 2. “Super Users” are a segment who over-index on daily time spent with technology and
media (18:55 vs. 9:21 for all other users).
Sources: Activate analysis, Activate 2022 Consumer Technology & Media Research Study (n = 4,001)
(78% OF POPULATION)
(22% OF POPULATION)
SEE SUPER USERS SECTION FOR DETAILED DEFINITION AND ANALYSIS
Super Users All Other Users
21%
81%
EXAMPLE
METAVERSE PLATFORMS1
USAGE OF METAVERSE PLATFORMS1 IN THE LAST 12 MONTHS, U.S., 2022, % ADULTS AGED 18+
2
Super Users – the most important user segment for all technology
and media businesses – will be critical for the growth of Metaverse
platforms
CREATION ACTIVITIES
IN THE METAVERSE
Creating/personalizing
a virtual character/avatar or virtual items
Creating/personalizing
virtual places or maps
SOCIAL ACTIVITIES
IN THE METAVERSE
Attending live performances,
sporting events, or esports events
Socializing with friends/family
or meeting new people
Traveling to virtual versions
of real-world locations
Attending educational classes,
work-related meetings, or networking events
TRANSACTIONAL
ACTIVITIES
IN THE METAVERSE
Purchasing or selling virtual goods
Purchasing or selling physical goods
Investing, lending, or borrowing money

116
INTEREST IN PARTICIPATING IN SELECT METAVERSE ACTIVITIES IN THE NEXT 12 MONTHS, U.S., 2022, % ADULTS AGED 18+
METAVERSE
1. “Super Users” are a segment who over-index on daily time spent with technology and media (18:55 vs. 9:21 for all other users).
Sources: Activate analysis, Activate 2022 Consumer Technology & Media Research Study (n = 4,001)
10%
17%
15%
19%
21%
20%
25%
14%
20%
57%
69%
71%
66%
71%
72%
73%
67%
76%
% Super Users % All Other Users
EXTREMELY OR VERY INTERESTED IN… (78% OF POPULATION)
(22% OF POPULATION)
1
SEE SUPER USERS SECTION FOR DETAILED DEFINITION AND ANALYSIS
We see eight foundational elements of the Metaverse and proof
points for each of these elements today

117
METAVERSE
Source: Activate analysis
IMMERSIVE EXPERIENCES
MIXED REALITY
VIRTUAL OWNERSHIP
ECONOMY CREATION AND AGENCY
IDENTITY
DIGITAL TWINS
SOCIAL INTERACTIONS
• Immersive virtual worlds
• Interactive digital overlays in
physical spaces
• Persistent digital content
anchored to real-world locations
• Virtual goods ownership and usage
• Authenticated ownership of digital/
physical assets
• Marketplaces
• Branding and advertising
• In-game experience creation
• Design and development tools
• Personalized avatars enabling
self-expression
• Persistent identity
• Digital counterparts to physical
spaces/objects with real-time
synchronization
• Immersive social communities and experiences
• Enterprise collaboration / distributed work
• Interactive gameplay in virtual worlds
• Presence in simulated environments
ELEMENTS
OF THE
METAVERSE
IMMERSIVE
EXPERIENCES ✔︎ ✔︎ ✔︎ ✔︎ ✔︎
IDENTITY ✔︎ ✔︎ ✔︎ ✔︎ ✔︎
CREATION &
AGENCY ✔︎ ✔︎ ✔︎ ✔︎ ✔︎
DIGITAL TWINS ✔︎ ✔︎ ✔︎
SOCIAL
INTERACTIONS ✔︎ ✔︎ ✔︎ ✔︎ ✔︎
VIRTUAL
OWNERSHIP ✔︎ ✔︎ ✔︎ ✔︎ ✔︎
ECONOMY ✔︎ ✔︎ ✔︎ ✔︎ ✔︎
MIXED REALITY ✔︎ ✔︎
Virtual world video games already include most of the eight
foundational Metaverse elements

118
ROBOTO BOLD 16PT, ROBOTO REGULAR 16 PT
METAVERSE
Note: Information as of Oct. 20, 2022. Includes early-stage indicators for Metaverse applications (e.g. ability to create
environments that mirror the real world, ability to create personalized avatars, ability to purchase virtual goods).
Sources: Activate analysis, Company sites
✔︎ FEATURE/CAPABILITY AVAILABLE
SELECT VIRTUAL WORLDS AND METAVERSE ELEMENTS
METAVERSE
ELEMENTS
MAJOR VIRTUAL WORLD GAMES
EXPLORE WORLD OF WARCRAFT’S OPEN-GAME WORLD,
COMPLETE QUESTS, AND INTERACT WITH OTHER PLAYERS
ATTEND A LIVE VIRTUAL MUSIC PERFORMANCE WITH FRIENDS
IN SOUNDSCAPE VR
PARTICIPATE IN A 3D VIRTUAL KARAOKE EXPERIENCE IN
XRSPACE PARTYON
BATTLE OTHER USERS IN REC ROOM’S LASER TAG ARENA
Shared immersive experiences will be the foundation
for Metaverse platforms

119
METAVERSE
Sources: Activate analysis, Company sites
EXAMPLES OF IMMERSIVE EXPERIENCES WITHIN THE METAVERSE
ACTIVATE PERSPECTIVE
Immersive experiences in the
Metaverse will:
• Grow in variety and number as
the Metaverse develops
• Provide opportunities to meet
people through both structured
activities (e.g. sports, games,
concerts) and non-structured
activities (e.g. open space
exploration)
• Increasingly replicate real-life
activities and experiences as
Metaverse participation
becomes a more mainstream
behavior
• Evolve in complexity, detail, and
functionality to offer virtual
experiences with greater
similarity to physical world
activities
IMMERSIVE
EXPERIENCES
SPEND TIME WITH FRIENDS IN FORTNITE’S PARTY WORLDS
PARTY WITH PARIS HILTON AT CRYPTOWEEN IN ROBLOX AND
THE SANDBOX
PLAY GAMES OF PICKUP BASKETBALL IN NBA 2K22 “THE
NEIGHBORHOOD”
CELEBRATE A VIRTUAL WEDDING IN ANIMAL CROSSING
Social experiences and interactions will increasingly
take place in Metaverse platforms

120
METAVERSE
Sources: Activate analysis, Company sites
EXAMPLES OF SOCIAL INTERACTIONS WITHIN THE METAVERSE
ACTIVATE PERSPECTIVE
Social interactions in the
Metaverse will:
• Include the ability to engage
with real-life friends and meet
new people in virtual worlds
(e.g. open spaces, events,
meetings)
• Enhance activities with live
user-to-user interaction
(e.g. virtual gameplay)
• Develop additional applications
as more activities become
available (e.g. dating, attending
festivals, professional
networking)
• Supplement or even replace an
increasing number of real-
world social events over time
(e.g. parties, weddings, sports
games)
SOCIAL
INTERACTIONS
DEVELOP AND SHARE IDEAS REMOTELY IN
CUSTOMIZED, FLEXIBLE ROOMS WITH HORIZON
WORKROOMS
BUILD IMMERSIVE WORKSPACES TO GATHER
WITH COWORKERS AND ATTEND MEETINGS WITH
MESH FOR TEAMS
Metaverse workplace collaboration platforms will
provide a more immersive vehicle for virtual interaction
and an expansion of video conferencing technologies

121
ROBOTO BOLD 16PT, ROBOTO REGULAR 16 PT
METAVERSE
Sources: Activate analysis, Company sites
Mesh
EXAMPLES OF EARLY METAVERSE WORKPLACE COLLABORATION
ACTIVATE PERSPECTIVE
Collaboration in the Metaverse
will:
• Enable deeper levels of
immersion over time
• Leverage avatars to create a
sense of presence and provide
users with agency over their
own representation
• Include a broadening set of
tools and resources to
facilitate immersive
collaboration (e.g. virtual
conference rooms, shared
whiteboards, spatial audio)
• Allow users to collaborate
directly on files/projects as if
in person together (e.g. object
manipulation, 3D physical
objects, interoperability of files
across platforms)
SOCIAL
INTERACTIONS
Digital twins will provide a bridge between the real
world and virtual worlds

122
EXAMPLES OF EARLY METAVERSE DIGITAL TWINS
METAVERSE
Sources: Activate analysis, Company sites
BuildTheEarth is an open-
contribution effort to recreate
the world at a 1:1 scale in
Minecraft
Currently, BuildTheEarth has over
4,700 ongoing build projects
across more than 7,000 square
kilometers
Real estate giant Jamestown
and digital assets investor
Digital Currency Group partnered
to recreate One Times Square in
Decentraland
The build area spans 170 LAND
parcels and was launched on
New Year’s Eve with the
MetaFest 2022 global party
HDR, Inc. and Seattle City Light
developed a digital twin model of
Diablo Dam down to a 2cm
visual accuracy through high-res
photography
The model incorporates data
from additional technologies for
a holistic view of the dam
(e.g. piezometers, seepage/
leakage detectors, ground-
penetrating radar)
ACTIVATE PERSPECTIVE
Digital twins in the Metaverse
will:
• Serve as digital replications of
a growing number of real-world
systems, objects, and locations
• Develop to be larger, more
complex, and more
synchronized with their real-
world counterparts
• Incorporate a range of data
types beyond visual inputs
(e.g. spatial data, performance
data, health data)
• Become increasingly
accessible for public viewing,
usage, and contribution
• Feature two-way
synchronization, more closely
linking the physical and digital
worlds (e.g. products, changes,
ownership)
DIGITAL TWINS
AZURE DIGITAL TWINS:
Allows users to create digital models
of buildings, factories, energy
networks, railways, cities, and more
NVIDIA OMNIVERSE DIGITAL TWINS:
Enables users to develop physically
accurate, AI-enabled virtual
simulations of real world
environments
GE DIGITAL TWIN SOFTWARE:
Allows users to create digital twins
that represent an individual asset, an
integrated system of assets, or a fleet
of assets
Example Applications: Ansys, Bentley
Systems, Bosch, ICONICS, Samsung,
and Willow use Azure Digital Twins in
their software applications
Example Applications: BMW uses
NVIDIA’s Omniverse platform to build
digital twins for 31 different factories;
individual creators and developers
can download, use, and contribute to
NVIDIA Omniverse for free
Example Applications: Chevron uses
GE’s Digital Twin software for
predictive maintenance in its oil fields
and refineries
The tools to build digital twins are becoming accessible
to enterprise and SMBs to create their own digital models
of environments

123
ROBOTO BOLD 16PT, ROBOTO REGULAR 16 PT
METAVERSE
Sources: Activate analysis, Company sites
EXAMPLES OF DIGITAL TWINS WITH ENTERPRISE AND SMB USE CASES
ACTIVATE PERSPECTIVE
Digital twins in the Metaverse
will:
• Be applied to a greater set of
enterprise use cases and
leveraged across a widening
set of businesses
• Become increasingly
accessible to SMBs and
consumers, in addition to
enterprises, as tools for
building and using digital twins
become more user-friendly
• Evolve to support systems with
greater size and complexity as
technology improves
DIGITAL TWINS
Interoperability
(i.e. use the same avatar in
separate platforms and
environments)
Personalization
(i.e. customize how one
wants to be perceived
in a virtual world through
self-expression)
Authentication
(i.e. establish procedures for
identify verification to ensure
security and build trust
between users)
Privacy
(i.e. provide users the choice
over how their personal data
and digital identity is used)
People will have an expansive set of options to define
their Metaverse identity – either as themselves today,
an idealized version, or entirely new person

124
IMPORTANCE OF IDENTITY IN THE METAVERSE
METAVERSE
Sources: Activate analysis, Company sites
KEY ELEMENTS
FOR IDENTITY
IN THE FUTURE
STATE OF THE
METAVERSE
ALTSPACEVR CUSTOMIZABLE AVATARS GENIES DIGITAL 3D AVATARS
IDENTITY WILL BE CORE TO THE METAVERSE
• Personalized identities will allow people to
reinvent themselves, reflecting who they are and
want to be
• The ability to use a consistent identity across
platforms will serve to unify the Metaverse
across separate systems
• Building the infrastructure and systems to
ensure security, privacy, and protections for
participants will be critical to the development of
the Metaverse
IDENTITY
CREATING/PERSONALIZING
AN AVATAR
CREATING/PERSONALIZING
VIRTUAL ITEMS
CREATING/PERSONALIZING
VIRTUAL PLACES OR MAPS
CREATING NEW GAMES
OR LEVELS
User creation and agency will be critical to the full
development of Metaverse platforms; people will expect to create
and build themselves (not just accept a world created for them)

125
METAVERSE
1. “Interested” includes consumers who are extremely or very interested in participating in the future.
Sources: Activate analysis, Activate 2022 Consumer Technology & Media Research Study (n = 4,001)
35%
OF U.S. ADULTS ARE
INTERESTED1 IN
PERSONALIZING
THEIR METAVERSE
EXPERIENCES THROUGH
CREATION-BASED
ACTIVITIES
29% 27%
26% 23%
INTEREST1 IN CREATION ACTIVITIES IN THE METAVERSE,
U.S., 2022, % ADULTS AGED 18+
CREATION AND
AGENCY
User creation and agency are core to today’s major
Metaverse platforms and games

126
ROBOTO BOLD 16PT, ROBOTO REGULAR 16 PT
METAVERSE
Sources: Activate analysis, Company filings, Company press releases, Company sites
• Roblox experiences are
built almost entirely by
users and developers
• Roblox has more than 10M
developers globally who
have built over 29M virtual
experiences
• In 2021, Roblox paid out
over $500M in in-game
currency to developers and
creators, up by 52% from
2020 — 2,200 creators
earned over $10K, and 500
creators earned over
$100K
• Rec Room enables users
to build, create, and play
games in rooms, with over
12M rooms created as of
Dec. 2021
• Rec Room also offers
community programs to
educate and connect
creators
• During Q1 2021, Rec
Room paid creators $1M
for their contributions to
the platform
• Fortnite allows players to
make unique islands and
games to share with
friends through its
Creative Mode
• Fortnite also features new
games on their discovery
page to encourage
exploration of user-
generated content
• Over 50% of playtime
among Fortnite users is
spent with content made
by other players
• Minecraft users can build
worlds in Creative Mode
and develop story-based
games in Adventure Mode
• Users can monetize
creations through the
Minecraft Marketplace
(e.g. maps, mini games,
skins)
• As of Q3 2021, creators
have generated over
$350M in revenue for
Minecraft from over 1B
downloads of mods, add-
ons, and experiences
EXAMPLES OF USER-GENERATED CONTENT AND CREATOR ECONOMIES WITHIN THE METAVERSE
ACTIVATE PERSPECTIVE
• The Metaverse will be built by
both professional developers
and everyday users
• User-generated creation will
lead to a rapid proliferation of
virtual content and Metaverse
experiences
• Tools for content creation will
become more intuitive, widely
available, and easy to use,
allowing for greater
participation, creation, and
sharing of unique experiences
(e.g. A.I.-enhanced hyper-
personalization of avatars,
drag-and-drop tools for in-game
creation and customization,
and stable diffusion to create
original and explicit image and
video content)
• The development of Metaverse
economies, virtual ownership,
and content monetization will
create an ecosystem that
fosters user-led creation
CREATION AND
AGENCY
Unity’s ProBuilder is a hybrid
design tool with tutorials for
beginners and a consumer-
friendly interface, providing easy
access to world generation and
object modeling
Adobe Substance 3D Modeler,
available on desktop and in VR
with a free trial, allows users to
create 3D models
Consumers of all design
backgrounds can create in Meta
Horizon Worlds by leveraging
templates and tutorials in build
mode
Everyday users can leverage
Microsoft Mesh’s simple menu of
creative actions to quickly build
collaborative spaces for free
Roblox Studio is a free immersive creation
engine that users can access on their own
Windows or Mac devices
Creative mode in Minecraft is free and
simple, and enables users to generate
custom content across all platforms
Unreal Engine is free for all creators, and the
Blueprints Visual Scripting system allows
beginners to create game elements without
writing any code
Consumerization of development tools will fuel
expanded Metaverse creation and participation

127
ROBOTO BOLD 16PT, ROBOTO REGULAR 16 PT
METAVERSE
Sources: Activate analysis, Company sites
EXAMPLES OF CREATOR TOOLS WITHIN THE METAVERSE
ACTIVATE PERSPECTIVE
Developer tools will evolve to
include:
• Increasingly accessible
versions for everyday
consumers (e.g. user-friendly
interfaces, project templates,
free pricing)
• More complex capabilities and
toolsets available to expand
the possibilities of creation
• More comprehensive
integration of data, analytics,
and AI services to fuel creation
in the Metaverse
• Ability to import content from
third-party tools and other
platforms, further enabling
user creativity and unifying
content across otherwise
siloed experiences
CREATION AND
AGENCY
Virtual economies, created by companies and users, will become
increasingly sophisticated and expansive; we expect that a
substantial number of people will make their entire living in the Metaverse
Zepeto users can design and sell clothes to other users on the
platform, earning a revenue share with in-game currency
In The Sandbox, users can purchase, sell, and rent land to other
users, including through secondary markets (e.g. OpenSea,
Rarible)
Second Life players can generate income from designing and
selling goods on the platform (e.g. homes, furniture, vehicles) and
can hire other players to fulfill certain roles (e.g. shop attendants,
security agents, real estate agents)
Developers on Roblox can earn money by designing and selling
access to games, experiences, and virtual items, with Roblox
paying out over $500M to developers in 2021

128
EXAMPLES OF VIRTUAL ECONOMIES WITHIN THE METAVERSE
METAVERSE
Sources: Activate analysis, Company press releases, Company sites
ACTIVATE PERSPECTIVE
• Building blocks of the
Metaverse economy will
include:
- Digital goods/services
(e.g. skins for avatars, virtual
fashion, virtual makeup)
- eCommerce (e.g. shopping
for physical goods in a virtual
environment)
- Advertising (e.g. showrooms,
product testing, product
placement)
• Brands will utilize both virtual
and real-world storefronts to
engage with customers
- Digital outfits from
Balenciaga, Prada, and Thom
Browne are coming to Meta's
soon-to-be-unveiled Avatar
Store
ECONOMY
One world will not be enough: brands will need to
build a presence in multiple Metaverse platforms
and virtual worlds

129
ROBOTO BOLD 16PT, ROBOTO REGULAR 16 PT
METAVERSE
Sources: Activate analysis, Company sites
Visit Ralph
Lauren’s Winter
Escape in
Roblox to enjoy
winter activities
and discover
exclusive Ralph
Lauren styles
Participate in
Puma Mania in
NBA 2K22 The
City, receiving
bonus XP for
playing games
while wearing
Puma gear
Unlock Star
Wars skins in
Fortnite and
wield signature
lightsabers and
blaster rifles in
combat
Play as Die
Hard’s John
McClane in Call
of Duty:
Warzone and
complete
special quests
inside Die Hard-
themed
locations
EXAMPLES OF IN-GAME BRAND PLACEMENTS
ECONOMY
Fortnite partnered with the NBA to celebrate the NBA’s 75th
anniversary by offering a collection of transactable in-game
character skins modeled after NBA team apparel and uniforms
Nike partnered with Roblox to create a Nike-branded virtual world
called Nikeland where users can buy virtual goods from Nike,
which has reached over 21M visitors as of Sept. 2022
Decentraland users can display owned 2D NFTs on the platform,
including displaying virtual art galleries in owned spaces
Zara partnered with Zepeto in Mar. 2022 to launch a limited-
edition fashion collection for users’ avatars, including a range of
apparel, makeup, and accessories
Virtual ownership will be more than just virtual goods;
it will be about self-expression, prestige, personalization,
and the fundamental need to belong

130
EXAMPLES OF OWNING VIRTUAL GOODS WITHIN THE METAVERSE
METAVERSE
Sources: Activate analysis, Company press releases, Company sites
ACTIVATE PERSPECTIVE
• Virtual ownership will become
more mainstream as platforms
make items more attainable, a
wider range of items become
available, and a greater number
of brands and users participate
• Virtual goods will hold value for
consumers (e.g. self-
expression, status, exclusivity,
personalization, ability to
trade)
• Platforms will explore select
circumstances in which
consumers can access owned
virtual goods from other
platforms
• Physical items will be paired
with ownership of digital items
(e.g. ownership of real-world
items will be reflected on
virtual platforms)
VIRTUAL
OWNERSHIP
Mixed reality will significantly enhance immersion but will not
be critical to the growth of the Metaverse; we forecast that VR
and AR headset sales will fall short in reaching the great majority
of potential Metaverse users

131
METAVERSE
2021 2022E 2023E 2024E 2025E 2026E
44.4M
35.5M
27.9M
21.9M
16.2M
12.3M 29.0M
25.9M
22.6M
19.1M
15.5M
11.9M
0.4M
0.7M
2.8M
5.2M
9.6M
15.4M
Augmented
Reality
(AR)
Virtual
Reality
(VR)
ACTIVATE
FORECAST
1. Excludes Google Cardboard and other headsets with no built-in technology. Figures do not sum due to rounding.
Sources: Activate analysis, AR Insider, Company press releases, Company sites, eMarketer, IDC, Morgan Stanley Research,
Omdia, PricewaterhouseCoopers, Road to VR, Sensor Tower, Statista, Steam Spy, Strategy Analytics, SuperData, VGChartz
2021-2026E
CAGR:
107%
20%
29%
AR AND VR HEADSET UNIT SALES1, GLOBAL, 2021-2026E, MILLIONS UNITS
MIXED REALITY
Actual usage of VR headsets for non-gaming/Metaverse
activities has far exceeded the original purchase intent
for the headset
Video games
Virtual tours
or travel
Entertainment
videos /
documentaries
Social
interactions
Live event
streaming
Educational
purposes
Therapeutic
activities Shopping
Job training /
job-related
activities
33%
35%
37%
40%
42%
43%
47%
48%
49%
19%
19%
25%
23%
25%
25%
28%
28%
46%
Reason for purchasing Currently using VR for this purpose

132
REASONS FOR PURCHASING AND USING VR HEADSETS, U.S., 2022, % VR HEADSET USERS
METAVERSE
1. “Gamers” are defined as adults aged 18+ who currently play video games.
Sources: Activate analysis, Activate 2022 Metaverse & NFT Consumer Research Study (n = 3,078)
91% of VR users
are gamers1, and
78% of VR users
use VR for non-
gaming activities
MIXED REALITY
Over the next years, companies building the Metaverse will be part
of an extensive ecosystem

133
METAVERSE
Note: Not exhaustive.
Sources: Activate analysis, Company sites
WEIBO
TELEGRAM
EXAMPLES OF COMPANIES
POWERING THE
METAVERSE
ECOSYSTEM
DECENTRALAND
FACEBOOK
FACEBOOK
SNAP INC.
PINDUODUO
DEVELOPERS/
PUBLISHERS
DIGITAL
PROPERTY & NFTs
CRYPTO &
PAYMENTS
ECOMMERCE
MEDIA
AR/VR
SOCIAL &
MESSAGING
COMMUNICATION
& COMPUTING
GAMES & VIRTUAL
SPACES
The major technology and gaming companies will build out their
capabilities across each element of the Metaverse

134
METAVERSE
Note: Not exhaustive. Information as of Oct. 20, 2022. Categorization reflective of forward-looking indicators for Metaverse
applications (e.g. NFTs for virtual ownership, real-time synchronization for digital twins).
Sources: Activate analysis, Company sites
Immersive
Experiences
Mixed Reality: AR
Mixed Reality: VR
Social Interactions
Roblox Chat
& Community Space
Creation & Agency
Identity
Digital Twins
Economy
Game Shop
Virtual Ownership
Roblox Avatars
Roblox Studio
VR
Unreal Engine
Google Chrome Avatar
Google
Lens
Google Maps
Live View
Google
Earth VR
Google Play
YouTube
VR
Google Cloud: Supply
Chain Twin and Pulse
YouTube
VR
NFT Sharing with
Verified Ownership on
Instagram/Facebook
Meta 3D Avatar
Instagram Messenger
Gaming
Azure Digital
Twins
Mesh
NFTs in
Windows 11
Microsoft
Store
Teams
Altspace VR
MY APP
Tencent
Cloud
Magic Core
(No longer issuing new NFTs)
QQ
(Series D Investment)
PlayStation
Store
PlayStation
Plus
Partnership
PlayStation
ARKit
Apple NFT Trading Cards
(Rumored)
RoomPlan
Build NFT
Applications
IoT TwinMaker
AR View
Luna
Teams and Mesh Avatars
Fortnite Avatars
Reality Scan
Unreal Engine
Reality
Composer
(Rumored)
Pro
Robux
Mesh
Mesh
iMessage
Store
Mesh
Enable NFT Games via
Epic Games Store
(e.g. Blankos Block
Party)
Co-development
Guardian Creation
(Series D Investment)
We expect to see significant and sustained investment in innovation
over the next years

135
METAVERSE
Note: Not exhaustive. Companies listed by primary category but may have capabilities in other categories listed.
Information as of Oct. 24, 2022.
Sources: Activate analysis, Company press releases, Company sites
EXAMPLE INVESTORS
IMMERSIVE
EXPERIENCES
MIXED REALITY SOCIAL
INTERACTIONS
CREATION &
AGENCY
IDENTITY DIGITAL TWINS ECONOMY VIRTUAL
OWNERSHIP
GRAVVITY
JADU AR
Interoperability between Metaverse platforms will take place through
third-party companies and applications, creating significant opportunities
for all businesses to capitalize on the potential of the Metaverse

136
ROBOTO BOLD 16PT, ROBOTO REGULAR 16 PT
METAVERSE
Source: Activate analysis
INTEROPERABILITY LAYERS OF THE METAVERSE
PAYMENTS
(e.g. single digital wallet,
virtual currencies, credit)
SOCIAL
(e.g. Discord, VRChat,
AltspaceVR)
MARKETING
(e.g. branding, sponsorship,
advertising)
ECONOMIES/
BUSINESS
(e.g. virtual goods and services,
commerce, reselling)
CONSUMER
COMMUNICATION
(e.g. advanced messaging,
immersive video conferencing,
virtual collaboration)
EMBEDDED
MEDIA
(e.g. audio, video, live)
USER IDENTITY
(e.g. profile, user data,
credentials)
The Metaverse will be the user interface for Web3, similar to the
role the browser played with the internet

137
METAVERSE
Source: Activate analysis
A digitally native world in
which we will spend our
time working, socializing,
and engaging in all types
of activities
Metaverse
The Metaverse will provide a unified, user-friendly
interface that can integrate complex Web3 elements
A set of decentralized
protocols and technologies
that can be used to build
parts of the Metaverse and
secure the new communities
and economies that
it will enable
WEB3
NFTs
Decentralized
Infrastructure
Blockchain Cryptocurrencies
Decentralized
Finance (DeFi)
Decentralized
Identity
Decentralized
Autonomous
Organizations
(DAOs)
Artificial
Intelligence
Immersive Experiences
Social Interactions
Digital Twins
Identity
Creation and Agency
Economy
Virtual Ownership
Mixed Reality
The Metaverse and Web3 are
two separate concepts
• Metaverse interfaces will be
the user-friendly way to
interact with Web3
• Web3 will set the future
standards and technology
foundations for Metaverse
experiences
• Developments in both will be
required to fully realize the
potential of the Metaverse
ACTIVATE
PERSPECTIVE
www.activate.com 
138
CONTENTS PAGE
$420B Global Technology and Media Growth Dollars Up for Grabs 4
Consumer Technology and Media Time and Attention 9
Super Users: The Critical Segment for Technology and Media Companies 15
eCommerce and Marketplaces: Growth will Continue Across Categories
With Major Consumer Trends Serving as Tailwinds 29
Video: Streaming and Social Drive Growth 47
Gaming and Esports: A Mainstream Behavior and Precursor to The Metaverse 78
NFTs: Past the Hype Cycle, Towards Tangible Use Cases 95
Metaverse: Time for Practical Applications 108
Audio: Digital Audio Will Drive More Consumer Time and Spend 138
Sports and Sports Betting: Younger Next-Gen Sports Fans Drive Growth 152
Digital Fitness: Consumer Adoption Will Continue to Grow 167
Consumer audio time will continue to increase and shift to digital;
by 2026, 63% of audio time will be digital, up from 51% in 2019

139
AVERAGE DAILY AUDIO TIME PER ADULT AGED 18+ BY TYPE1,
U.S., 2019-2022E VS. 2026E, HOURS:MINUTES
AUDIO
1. Figures do not sum due to rounding. 2. “Digital audio” includes audio streamed via mobile and desktop/laptop.
3. “Radio” excludes digital radio. 4. “Music listeners” are defined as adults aged 18+ who spend any time listening to music.
5. “Music services” include free and paid services used for listening to music through any format excluding terrestrial radio.
Sources: Activate analysis, Activate 2022 Consumer Technology & Media Research Study (n = 4,001), eMarketer, GWI, Music Biz
-1.9%
2019 2020 2021 2022E 2026E
Digital
Audio2
ACTIVATE
FORECAST
2:51
1:11
1:40
0.6%
2022E-2026E
CAGR:
1:06
1:50
2:55
Radio3
Terrestrial
& Satellite
88% of music listeners4 use
a free or paid music service5
at least once per month
64% of music listeners4 use
multiple music services5 at
least once per month
Music listeners4 are now more
likely to use a smartphone or
tablet to listen to music than any
other device
CORE BEHAVIORS DRIVING INCREASED
TIME SPENT WITH DIGITAL AUDIO2
1:14
1:30
1:11
1:37
2:43 2:44 2:48
2.3%
63%
37%
1:23
51%
1:20
49%
2021 2022E 2023E 2024E 2025E 2026E
$41.9B
$38.3B
$35.1B
$32.2B
$29.7B
$27.4B
$51.9B
$51.7B
$51.5B
$51.4B
$51.3B
$51.4B
Significant growth in the global music industry will continue in the
coming years, reaching $94B in revenue by 2026, driven almost
entirely by digital audio

140
MUSIC REVENUE BY TYPE (EXCLUDING LIVE MUSIC)1, GLOBAL, 2021-2026E, BILLIONS USD
1. Figures do not sum due to rounding. 2. “Digital” is defined as revenue generated from paid digital downloads of any licensed
recorded music and from subscriptions and advertising on music streaming platforms, including platforms that offer podcasts
(e.g. Spotify). 3. “Non-Digital” is defined as revenue generated from the use of music in other media (e.g. television), paying
record companies for the right to play their music publicly, any purchase of physical audio formats (e.g. vinyl), satellite radio
subscriptions and advertising (including non-music content such as talk and sports), and AM/FM radio stations and networks
(including non-music content such as talk and sports).
Sources: Activate analysis, Goldman Sachs, Grand View Research, IFPI, Omdia, PricewaterhouseCoopers, Recording Industry
Association of America, SiriusXM, Statista
2021-2026E
CAGR:
ACTIVATE
FORECAST
$93.8B
$90.0B
$86.6B
$83.6B
$81.0B
$78.7B
Share of growth dollars from digital, 2021-2026E: 96%
Digital2
Non-Digital3
Digital will
account for 45%
of music revenue
(excluding live
music) by 2026
3.6%
8.9%
0.2%
35%
$27.4B
65%
$51.4B
45%
$41.9B
55%
$51.9B
AUDIO
More listeners than ever are using multiple free and paid music
services

141
NUMBER OF FREE OR PAID MUSIC SERVICES1 USED AT LEAST ONCE PER MONTH, U.S., 2019-2022, % MUSIC LISTENERS2
1. “Music services” include free and paid services used for listening to music through any format excluding terrestrial radio.
2. “Music listeners” are defined as adults aged 18+ who spend any time listening to music. 3. “No services” includes those
who do not use music services (e.g. only listen through terrestrial radio, CDs, vinyl). 4. Figures do not sum due to rounding.
Sources: Activate analysis, Activate 2019 Consumer Technology & Media Research Study (n = 4,006), Activate 2020 Consumer
Technology & Media Research Study (n = 4,003), Activate 2021 Consumer Technology & Media Research Study (n = 4,018),
Activate 2022 Consumer Technology & Media Research Study (n = 4,001)
2019 2020 2021 2022
40%
38%
33%
20%
24%
21%
22%
24%
24%
26%
29%
39%
12%
15%
16%
17%
1 Service
2 Services
3+ Services
No Services3
64%
of music listeners2
use multiple music
services1 per month,
up from 43%4 in
2019
AUDIO
YouTube is the most used music service among music listeners,
followed by Spotify and Amazon Music

142
FREE OR PAID MUSIC SERVICES1 USED AT LEAST ONCE PER MONTH, U.S., 2022, % MUSIC LISTENERS2
5%
5%
5%
5%
6%
10%
15%
19%
21%
23%
35%
35%
61%
/ 3
1. “Music services” include free and paid services used for listening to music through any format excluding terrestrial radio.
2. “Music listeners” are defined as adults aged 18+ who spend any time listening to music. 3. Includes consumers who use
Amazon Music through their Amazon Prime subscription, as well as consumers who use the standalone Amazon Music service.
Sources: Activate analysis, Activate 2022 Consumer Technology & Media Research Study (n = 4,001)
AUDIO

143
1. “Music listeners” are defined as adults aged 18+ who spend any time listening to music. 2. Includes using headphones.
Sources: Activate analysis, Activate 2021 Consumer Technology & Media Research Study (n = 4,018), Activate 2022 Consumer
Technology & Media Research Study (n = 4,001)
PAID MUSIC SUBSCRIPTION OWNERSHIP,
U.S., 2021 VS. 2022, % MUSIC LISTENERS1
MUSIC LISTENER1 DEMOGRAPHICS AND BEHAVIORS,
U.S., 2022, % MUSIC LISTENERS1
2021 2022
35%
34%
65%
66%
Do not own a paid
music subscription
Own a paid
music subscription
55%
29%
22%
39%
48%
49%
% Non-Owners of Paid Music Subscriptions
% Owners of Paid Music Subscriptions
Are aged 55+
Have a household income
of less than $50K
Listen to music
directly through a
smartphone or tablet2
In 2021 and 2022, over a third of music listeners did not pay for a music service,
presenting an opportunity to serve them via ad-supported offerings; these
listeners are older, less affluent, and less likely to use mobile devices for music
AUDIO
17%
17%
29%
37%
42%
54%
54%
8%
8%
15%
19%
20%
24%
25%
% Non-TikTok Users
% TikTok Users
TikTok has helped fuel consumer engagement with music; its users
are significantly more likely to participate in music-related activities

144
PARTICIPATION IN MUSIC-RELATED ACTIVITIES IN THE LAST 12 MONTHS, U.S., 2022, % MUSIC LISTENERS1
1. “Music listeners” are defined as adults aged 18+ who spend any time listening to music. 2. “TikTok users” are defined as
adults aged 18+ who use TikTok at least once per month. 3. “Music services” include free and paid services used for listening
to music through any format excluding terrestrial radio.
Sources: Activate analysis, Activate 2022 Consumer Technology & Media Research Study (n = 4,001)
Followed an
artist on social
media
Heard a new
song on social
media & sought
it out on a music
streaming
service
Discovered an
artist that is
now a favorite
Shared an
artist’s music or
content on
social media
Purchased an
artist’s
merchandise
Attended the
same concert
more than once
Met an artist
in person
TikTok
users2 are
1.5x
as likely to attend
concerts as non-
users2
TikTok
users2 spend
2.1x
as much money on
music and music
services3 as
non-users2
TikTok
users2 use
1.8x
as many music
services3 as non-
users2
2
2
AUDIO
TikTok’s discovery features help spur consumer interest in new
artists and genres, further deepening engagement

145
SELECT TIKTOK DISCOVERY FEATURES
1. Only available for select songs.
Sources: Activate analysis, TikTok
Discover music by listening to songs
on an artist’s profile
Listen to full songs with
Apple Music integration1
Use the in-app search feature to
discover new music and sounds by
artist, genre, or popularity
AUDIO
Nearly 40% of music listeners create music or are interested in
creating music, driving demand for creation and distribution tools
that best serve the needs of independent creators

146
1. “Music listeners” are defined as adults aged 18+ who spend any time listening to music.
Sources: Activate analysis, Activate 2022 Consumer Technology & Media Research Study (n = 4,001), Company press releases,
Company sites
MUSIC CREATION AND INTEREST IN MUSIC CREATION,
U.S., 2022, % MUSIC LISTENERS1
19%
17%
Create music Do not create music
but are interested in
creating music
MAJOR MUSIC AND TECHNOLOGY COMPANIES
ARE INVESTING IN CREATOR DISTRIBUTION TOOLS
Gives independent artists distribution tools to share
their music on major music streaming services, as
well as marketing support to help promote their songs
Enables creators to distribute their music on TikTok
and all major music streaming services, providing
artists with an opportunity to leverage TikTok as a
major promotional channel
Provides monthly grants of up to $100K to
independent artists and helps them distribute their
music through Snapchat
Sounds Creator Fund
X
AUDIO
The live music industry will surpass pre-COVID-19 levels by 2023,
with high participation expected across age groups

147
1. Figures do not sum due to rounding. 2. “Sponsorship” includes revenue from sponsorship of live music events (advertising
spending). 3. “Ticket sales” include revenue from consumer spend on tickets to live music events. Does not include revenue
from merchandise or concessions. 4. “Music listeners” are defined as adults aged 18+ who spend any time listening to music.
Sources: Activate analysis, Activate 2022 Consumer Technology & Media Research Study (n = 4,001), Omdia,
PricewaterhouseCoopers, Statista
2.8%
2.9%
3.0%
2019-2026E
CAGR:
2019 2020 2021 2022E 2023E 2024E 2025E 2026E
$35.5B
$33.8B
$32.4B
$30.8B
$26.5B
$11.9B
$6.7B
$29.1B
$7.5B
$7.1B
$6.8B
$6.4B
$5.5B
$2.5B
$1.4B
$6.1B
$28.0B
$26.7B
$25.6B
$24.4B
$21.1B
$9.5B
$5.4B
$23.1B
Ticket Sales3
Sponsorship2
$1.4B
Aged 18-34
58%
Aged 35-54
57%
IN-PERSON LIVE MUSIC REVENUE BY TYPE1, GLOBAL, 2019-2026E, BILLIONS USD
INTENT TO ATTEND AN
IN-PERSON CONCERT OR MUSIC
FESTIVAL IN THE NEXT 12 MONTHS
BY AGE GROUP, U.S., 2022,
% MUSIC LISTENERS4
ACTIVATE
FORECAST
AUDIO
While virtual event attendance is down from 2021, consumers increasingly see
virtual as a complement to, rather than a replacement for, in-person events,
especially given the uniquely immersive experiences virtual events offer

148
EXAMPLES OF VIRTUAL LIVE MUSIC EVENT VR/AR TECHNOLOGY
VR AND METAVERSE CONCERTS AR-ENHANCED STREAMING
Artists are increasingly performing in
VR and Metaverse concerts, in which
users can watch artists through VR
headsets or as avatars in virtual worlds
With AR, artists are able to provide
viewers at home with a differentiated
experience compared to in-person live
music events
For Megan Thee Stallion’s 2022 VR tour,
attendees were given VR headsets in select
theaters for a more immersive concert
experience
Using AR technology, Flume provided at-home
viewers of his 2022 Coachella performance with
a unique set of visuals that were overlaid onto
the YouTube livestream
Grimes performed in her avatar form for the
Metaverse Fashion Week in Decentraland
Beyond Live, an online paid concert platform,
leverages augmented reality to create visual
experiences optimized for online audiences, such
as integrating 3D graphics into performances
ATTENDED A VIRTUAL
LIVE MUSIC EVENT
1. “Music listeners” are defined as adults aged 18+ who spend any time listening to music. 2. Figures do not sum due to rounding.
Sources: Activate analysis, Activate 2021 Consumer Technology & Media Research Study (n = 4,018), Activate 2022 Consumer
Technology & Media Research Study (n = 4,001), ARPost, Company press releases, Company sites, TIME, Zero Density
ATTENDED BOTH AN
IN-PERSON AND VIRTUAL
LIVE MUSIC EVENT
2021 2022
26%
22%
2021 2022
27%
30%
YoY
Change:
-3pp
YoY
Change:
+3pp2
LIVE MUSIC EVENT ATTENDANCE,
U.S., 2021 VS. 2022, % MUSIC LISTENERS1
AUDIO
Podcast listening is a core behavior for audio platforms to address,
with significant potential for further user growth

149
MONTHLY PODCAST LISTENERS1,
U.S., 2020-2022E VS. 2026E, MILLIONS LISTENERS AGED 12+
1. “Podcast listeners” are defined as adults aged 12+ who spend any time listening to podcasts. 2. “Music services” include free
and paid services used for listening to music through any format excluding terrestrial radio.
Sources: Activate analysis, Activate 2019 Consumer Technology & Media Research Study (n = 4,006), Activate 2021 Consumer
Technology & Media Research Study (n = 4,018), AdExchanger, Apple World Today, Apple WWDC 2018, Automotive News, Car &
Driver, Cox Automotive, Digital Trends, Edison Research, eMarketer, Nielsen, Omdia, Pew Research Center,
PricewaterhouseCoopers, Scarborough Research, TechCrunch, U.S. Bureau of Economic Analysis, U.S. Census Bureau, The Verge
2020 2021 2022E 2026E
159M
134M
123M
112M
DRIVERS OF PODCAST GROWTH
INTEGRATION OF PODCASTS INTO
MUSIC STREAMING SERVICES
Most major music services2 now allow
users to listen to podcasts, providing
consumers with a single platform for
multiple audio behaviors
INCREASING VALUE OF AD SPOTS
IN PODCASTS
Dynamic ad insertion will drive up the
value of ad spots in podcasts — major
acquisitions in adtech (e.g. Chartable
and Podsights) have signaled a
continued push into targeted advertising
SOCIAL MEDIA PLATFORMS’ PUSH
INTO THE PODCAST SPACE
Social media companies are increasingly
integrating podcasts into their platforms,
driving new modes of podcast discovery
and consumption
2022E-2026E
CAGR:
4.4%
ACTIVATE
FORECAST
AUDIO
Most music and podcast listeners use the same service to listen to
both types of content; music services will continue to acquire and
produce major podcast titles to drive consumer engagement

150
FREE OR PAID SERVICES USED AT LEAST ONCE PER MONTH FOR BOTH
MUSIC AND PODCASTS, U.S., 2022, % MUSIC/PODCAST LISTENERS1
1. “Music/podcast listeners” are defined as adults aged 18+ who spend any time listening to both music and podcasts.
Sources: Activate analysis, Activate 2022 Consumer Technology & Media Research Study (n = 4,001), Apple Podcasts, Billboard,
Company press releases, Company sites, The Hollywood Reporter, iHeartMedia, TechCrunch, Variety
SELECT PODCAST TITLES ACQUIRED
BY MAJOR AUDIO PLATFORMS
AUDIO PLATFORM PODCASTS
of music/podcast
listeners1 use the
same service
to listen to both
music and podcasts
81%
2%
3%
5%
5%
8%
9%
12%
14%
30%
37%
39%
SERVICES USED FOR BOTH MUSIC AND PODCASTS
THE JOE ROGAN
EXPERIENCE ARCHETYPES
MORBID
HELP! I SUCK AT DATING
WITH DEAN, JARED & …
SUAVE
CONAN O’BRIEN
NEEDS A FRIEND
CALL HER DADDY
AUDIO
Consumers are highly receptive to podcast advertising; ad unit
improvements, such as targeting and dynamic ad insertion, will
continue to drive up the value of podcast inventory in the future

151
PODCAST AD RECEPTIVITY,
U.S., 2022, % PODCAST LISTENERS1
1. “Podcast listeners” are defined as adults aged 18+ who spend any time listening to podcasts. 2. “Likely” is defined as
extremely, very, somewhat, or slightly likely.
Sources: Activate analysis, Activate 2022 Consumer Technology & Media Research Study (n = 4,001), Castos, Company press
releases, Company sites, Digiday, RiversideFM
82%
of podcast listeners1 are likely2 to
look into a product/service being
advertised during a podcast
DYNAMIC AD INSERTION
(2022)
(2020) (2022) (2021)
(2021)
(2020)
KEY ACQUISITIONS
Ad spots increase in value as
a result of the increased
targeting and measurement
capabilities dynamic ad
insertion enables
Advertisers can deliver
advertisements on-demand
into ad slots, as opposed to
advertisements being
“baked-in” as permanent,
pre-recorded components
of a podcast
Advertisers can deliver
different advertisements
tailored to listeners based
on their individual traits
(e.g. geography,
demographics)
AUDIO
www.activate.com 
152
CONTENTS PAGE
$420B Global Technology and Media Growth Dollars Up for Grabs 4
Consumer Technology and Media Time and Attention 9
Super Users: The Critical Segment for Technology and Media Companies 15
eCommerce and Marketplaces: Growth will Continue Across Categories
With Major Consumer Trends Serving as Tailwinds 29
Video: Streaming and Social Drive Growth 47
Gaming and Esports: A Mainstream Behavior and Precursor to The Metaverse 78
NFTs: Past the Hype Cycle, Towards Tangible Use Cases 95
Metaverse: Time for Practical Applications 108
Audio: Digital Audio Will Drive More Consumer Time and Spend 138
Sports and Sports Betting: Younger Next-Gen Sports Fans Drive Growth 152
Digital Fitness: Consumer Adoption Will Continue to Grow 167
We expect three major trends to drive sports revenue growth in
2023 and beyond

153
SPORTS & SPORTS BETTING
Source: Activate analysis
1 2 3
EMERGENCE OF
NEXT-GEN SPORTS
FANS
TRANSITION OF
LIVE SPORTS TO
STREAMING
CONTINUED GROWTH
OF SPORTS BETTING
A younger generation of sports fans will
drive growth in:
• Live sports streaming
• Non-live game content consumption
• Participation in sports-related
activities
• Media companies will continue to
transition live sports to streaming
• Technology companies will
increasingly enter live sports
• Fans will adopt sports-focused
streaming services
• A growing number of states will
pursue legalization
• Overall consumer participation in
sports betting will increase
SPORTS FAN1
SEGMENT
AGE
GROUP
% OF
SPORTS
FANS1
TOTAL
POPULATION
NEXT-GEN
FANS2
LEGACY FANS3
There is a growing divergence in behavior between Next-Gen and
Legacy Fans that will impact the future of the sports ecosystem

154
SPORTS FANS1 VS. NON-SPORTS FANS1,
U.S., 2019-2022, % ADULTS AGED 18+
2019 2020 2021 2022
30%
30%
37%
29%
70%
70%
63%
71%
-8pp +7pp 0pp
Sports Fans1
Non-Sports
Fans1
18-34 32% 58M
35+ 68% 122M
1. “Sports fans” are defined as adults aged 18+ who followed at least one sport in the last 12 months (e.g. those attending live
games in person, watching live games or game highlights, reading articles or statistics). 2. “Next-Gen Fans” are defined as
sports fans aged 18-34. 3. “Legacy Fans” are defined as sports fans aged 35 or older.
Sources: Activate analysis, Activate 2019 Consumer Technology & Media Research Study (n = 4,006), Activate 2020 Consumer
Technology & Media Research Study (n = 4,003), Activate 2021 Consumer Technology & Media Research Study (n = 4,018),
Activate 2022 Consumer Technology & Media Research Study (n = 4,001), U.S. Census Bureau
SPORTS & SPORTS BETTING
Live sports streaming continues to grow in 2022, driven by Next-
Gen Fans who are avoiding the Pay TV bundle

155
LIVE SPORTS VIEWERSHIP BY VIEWING METHOD,
U.S., 2019 VS. 2022, % SPORTS FANS1
2019 2022
29%
6%
Paid video streaming service
NEXT-GEN FANS2 ARE
25% LESS LIKELY TO WATCH
LIVE SPORTS THROUGH PAY TV4…
…AND 36% MORE LIKELY TO WATCH
THROUGH A PAID VIDEO STREAMING
SERVICE THAN LEGACY FANS3
In the last 12 months, I have watched live sports through…
1. “Sports fans” are defined as adults aged 18+ who followed at least one sport in the last 12 months (e.g. those attending live
games in person, watching live games or game highlights, reading articles or statistics). 2. “Next-Gen Fans” are defined as
sports fans aged 18-34. 3. “Legacy Fans” are defined as sports fans aged 35 or older. 4. “Pay TV” includes traditional Pay TV
(i.e. TV delivered through a set-top box) and virtual Pay TV (i.e. TV delivered through the internet without a set-top box).
5. Value does not include viewership of Thursday Night Football on Amazon Prime.
Sources: Activate analysis, Activate 2019 Consumer Technology & Media Research Study (n = 4,006), Activate 2022 Consumer
Technology & Media Research Study (n = 4,001)
2019 2022
52%
67%
Pay TV
-15pp
4
29%5
+23pp
6%
SPORTS & SPORTS BETTING
NFL Case Study: Live sports streaming will continue to grow in 2023,
as technology and media companies increasingly provide access to
premier sports properties through their paid services

156
U.S. NFL LIVE SPORTS PROGRAMMING ACCESS FOR THE 2022-2023 SEASON
1. Value reflects NFL’s new contract term beginning in 2022. 2. “Pay TV” includes traditional Pay TV (i.e. TV delivered through a
set-top box) and virtual Pay TV (i.e. TV delivered through the internet without a set-top box).
Sources: Activate analysis, Bloomberg, Company sites, Fierce Video, MoffettNathanson, Sportico, The Sports Business Journal
BROADCAST
PARTNER FOX DISNEY PARAMOUNT COMCAST AMAZON
The September
15th debut of
Thursday Night
Football on
Prime Video
averaged 13
million viewers,
demonstrating
to major
leagues that
streaming
exclusives can
reach a mass
audience
EST. ANNUAL
CONTRACT VALUE1 $2.0B $2.7B $2.1B $2.0B $1.2B
PROPERTY
PAY TV2 CHANNEL FOX LOGO ESPN LOGO CBS LOGO NBC LOGO N/A
INCLUDES DIGITAL
RIGHTS
STREAMING
OPTION
No digital
streaming option
Alternative
broadcast on
Digital simulcast
full slate on
Digital simulcast
full slate on
Exclusive
rights on
FIRST YEAR OF
FULL STREAMING
AVAILABILITY
N/A 2021 2022 2022 2022
For the first time, 3 out of 5 major NFL broadcast properties will be fully available via streaming for the 2022-2023 season
SPORTS & SPORTS BETTING
Technology companies are increasingly competing with traditional
media companies for live rights, driving contract values to new heights

157
2018 2022E 2026E
$29B
$21B
$18B
ESTIMATED TOTAL ANNUAL VALUE OF LIVE
SPORTS BROADCAST RIGHTS1, U.S.,
2018 VS. 2022E VS. 2026E, BILLIONS USD
PROPERTY
PREVIOUS DEAL NEW DEAL
DATA AS OF OCTOBER 2022 VALUE
INCREASE
Rights
Owners
Est. Annual
Value2
Rumored
Bidders3
Rights
Owners
Est. Annual
Value2
$1.5B $2.5B 1.7X
$0.7B $1.2B 1.8X
$90M $250M 2.8X
$5M $83M 17X
SELECT EXAMPLES OF RISING CONTENT RIGHTS VALUATIONS
DRIVEN BY EMERGENCE OF TECHNOLOGY COMPANIES INTO SPORTS
Rumored
2022E-2026E
CAGR:
8%
2018-2022E
CAGR:
5%
Technology company Traditional media company
1. Includes spend by U.S. TV networks and streaming services on rights to major U.S. leagues (i.e. MLB, NBA, NFL, NHL),
international leagues (e.g. English Premier League, Formula 1), top leagues in other major sports (e.g. golf, motor racing, pro
wrestling, soccer, tennis, UFC), college sports, and the Olympics. 2. Based on total value and length of contract. 3. “Rumored
Bidders” excludes new rights owners.
Sources: Activate analysis, The Athletic, Bloomberg, The Guardian, MoffettNathanson, The New York Times, Sports Business
Journal, Variety, The Wall Street Journal
SPORTS & SPORTS BETTING
Next-Gen Fans are more likely to use sports-focused streaming
services and will fuel the continued growth of these services going
forward

158
NUMBER OF SPORTS-FOCUSED STREAMING SERVICES USED1, U.S., 2022, % SPORTS FANS2 BY SEGMENT
1 SERVICE
2 SERVICES
3+ SERVICES
HAVE NOT USED
A SERVICE
1.6
AVERAGE #
SPORTS-FOCUSED VIDEO
STREAMING SERVICES USED
0.9
ON AVERAGE, NEXT-GEN4 FANS USE 1.8X AS MANY SERVICES
14%
29% 7%
13%
13%
16%
65%
42%
Next-Gen Fans3 Legacy Fans4
EXAMPLE SPORTS-FOCUSED
VIDEO STREAMING SERVICES
1. “Usage” is defined as having watched live sports through a sports-focused streaming service when the sport they follow was
in season. 2. “Sports fans” are defined as followers (e.g. those attending live games in person, watching live games or game
highlights, reading articles or statistics) of at least one sport in the last 12 months. 3. “Next-Gen Fans” are defined as sports
fans between the ages of 18-34. 4. “Legacy Fans” are defined as sports fans aged 35 or older.
Sources: Activate analysis, Activate 2022 Consumer Technology & Media Research Study (n = 4,001)
SPORTS & SPORTS BETTING
RSN subscriptions have declined faster than overall Pay TV
subscriptions due to traditional and virtual Pay TV providers reducing
carriage — the future role of RSNs in live sports is uncertain

159
TOTAL SUBSCRIPTIONS TO TOP 50 RSNs VS. PAY TV
SUBSCRIPTIONS1, U.S., 2018-2022E, MILLIONS
2018 2019 2020 2021 2022E
80M
85M
89M
93M
97M
109M
125M
140M
158M
180M
RSN Subscriptions Pay TV Subscriptions
2018-2022E
CAGR:
-12%
2018-2022E
CAGR:
-5%
1. “Pay TV subscriptions” are defined as total subscriptions to traditional and virtual Pay TV. 2. “Pay TV” includes traditional Pay
TV (i.e. TV delivered through a set-top box) and virtual Pay TV (i.e. TV delivered through the internet without a set-top box).
Sources: Activate analysis, Company sites, eMarketer, Fierce Video, MoffettNathanson, Nielsen, S&P Global, The Sports
Business Journal, Stratechery, The Streamable, U.S. Census Bureau, Wells Fargo
1,2
RSN EXAMPLES
KEY INSIGHT
RSNs are declining faster than Pay TV1, as traditional and virtual Pay
TV providers reduce RSN carriage or exclude them from the bundle
INDUSTRY INSIGHTS
• RSNs drive significant costs for traditional and virtual Pay TV
providers — they are among the most expensive in the Pay
TV bundle (top RSNs average $5-$8 in monthly affiliate
revenue per subscriber)
• Consumers are watching less live-game content on RSNs
(e.g. the majority of RSNs saw year-over-year MLB ratings
decline in the 2021-2022 season, regular-season NHL games
on RSNs saw 23% ratings declines in 2021-2022)
• To adapt to a shifting landscape, RSNs will increasingly go
direct-to-consumer (e.g. Bally Sports+, NESN 360)
• To be viable long-term, DTC services likely need to bundle
SPORTS & SPORTS BETTING
Next-Gen Fans consume an outsized share of non-live-game content
compared to Legacy Fans – they spend significantly more time engaged
with digital-native sports content via social media, YouTube, and podcasts

160
SHARE OF TIME SPENT CONSUMING SPORTS CONTENT BY
CONTENT TYPE, U.S., 2022, % SPORTS FANS1 BY SEGMENT
Next-Gen
Fans
Legacy
Fans
29%
40%
71%
60%
Non-Live-
Game
Sports
Content
Live-Game
Sports
Content
CONSUMPTION OF NON-LIVE-GAME SPORTS CONTENT,
U.S., 2022, % SPORTS FANS1 BY SEGMENT
34%
28%
18%
15%
30%
25%
16%
18%
Engaging with
social media
content
Watching
YouTube
Researching
team/player
statistics
Listening
to podcasts
Watching
docuseries
Listening
to radio
shows
Reading
publications
Watching talk/
highlight shows
DIGITAL-NATIVE TRADITIONAL
1.8x 1.2x
1.6x 0.9x
0.9x
0.9x
1.2x
1.6x
11%
18%
15%
18% 18%
21%
24%
32%
NEXT-GEN FANS LEGACY FANS
1. “Sports fans” are defined as followers (e.g. those attending live games in person, watching live games or game highlights,
reading articles or statistics) of at least one sport in the last 12 months. 2. “Next-Gen Fans” are defined as sports fans between
the ages of 18-34. 3. “Legacy Fans” are defined as sports fans aged 35 or older.
Sources: Activate analysis, Activate 2022 Consumer Technology & Media Research Study (n = 4,001)
2 3
2 3
SPORTS & SPORTS BETTING
Pay for a sports editorial
subscription
Purchase access to a
pay-per-view event
Bet real money on
fantasy sports
Purchase sports
collectibles/memorabilia
Bet real money
on sports3
Use a sports-focused
streaming service
Purchase sports
merchandise
Purchase a ticket to a
live sporting event
Next-Gen Fans are more likely to participate in sports-related spending
activities — technology and media companies are diversifying their
offerings to capture a greater share of Next-Gen Fan spend and attention

161
SPORTS-RELATED SPENDING BEHAVIORS IN THE LAST 12 MONTHS, U.S., 2022, NEXT-GEN FANS1 INDEXED TO LEGACY FANS2
1. “Next-Gen Fans” are defined as sports fans between the ages of 18-34. 2. “Legacy Fans” are defined as sports fans aged 35
or older. 3. Does not include fantasy sports leagues, contests, or office pools.
Sources: Activate analysis, Activate 2022 Consumer Technology & Media Research Study (n = 4,001), Bloomberg, Company
press releases, Company sites, Sports Business Journal
1.3X
1.3X
1.7X
1.8X
1.9X
2.0X
2.3X
2.3X
Announced plans to launch a sports
betting platform by the end of 2022
Grew its pay-per-view (PPV) platform
Rough N’ Rowdy, averaging 60,000
PPV units sold per event in 2022
In 2022, announced its new OTT
service FanDuel+
Purchased online subscription-based
sports editorial site The Athletic in
early 2022
Launched its NFT Marketplace in late
2021, enabling users to buy and sell
digital collectibles
In 2022, announced plans to enter
the sports betting space in
partnership with DraftKings
NEXT-GEN FANS ARE MORE LIKELY TO…
SPORTS & SPORTS BETTING
Sports betting continues to surge in the U.S., with total wagers
nearly doubling year-over-year to reach $47B in the first half of 2022

162
Note: Sports betting excludes fantasy sports and horse racing. Florida passed a gaming compact that legalized sports betting, but
the compact has been vacated as of late 2021. 1. “Live states” are defined as states in which sports betting is legal and currently
operational as of Sept. 2022. Includes Washington, D.C. as a state. Includes states in which sports betting is only legal and
currently operational in tribal gaming venues via tribal-state compact. 2. “Geofenced online & retail” states are defined as states in
which online sports betting is legal and live, but permitted only within the physical boundaries of a retail-licensed sports betting
operator (e.g. sports venues, casinos, hotels, restaurants). 3. Online sports betting is legal in MD, but not live. 4. Both retail and
online sports betting are legal in MA, ME, and OH, but not live. Retail sports betting is legal in NE, but not live.
Sources: Activate analysis, Legal Sports Report, State regulator sites
SPORTS BETTING MARKET LIVE STATES1 BY CHANNEL,
U.S., SEPT. 2022
TOTAL SPORTS BETTING WAGERS BY MONTH,
U.S., AUG. 2019-JUNE 2022, BILLIONS USD
# States:
◼︎ Online & Retail 22
Geofenced Online & Retail2
4
◼︎ Online Only 1
◼︎ Retail3 Only 5
◼︎ Not Live4
19 2019
2000
4000
6000
8000
10000
$8B
$6B
$4B
$2B
2020 2021
PEAK MONTHLY WAGERS
JAN. 2022: $9.8B
H1 2022:
$47B
94% YoY
Change
$10B
Washington,
D.C.
32
Live
States1
2022
SPORTS & SPORTS BETTING
We forecast that the total sports betting amount wagered will reach
$210B by 2026 as sports betting becomes legal in a growing number
of states

163
TOTAL SPORTS BETTING AMOUNT WAGERED1, U.S., 2021-2026E, BILLIONS USD
2021 2022E 2023E 2024E 2025E 2026E
$210B
$192B
$171B
$149B
$99B
$58B
30%
32 36 38 40 41
NUMBER OF
STATES WITH LEGAL
SPORTS BETTING2:
45
2021-2026E
CAGR:
ACTIVATE
FORECAST
1. Projection assumes 45 states will legalize (but not necessarily launch) sports betting by 2026. 2. Projected number of states
that have legalized (but not necessarily launched) betting by the end of the stated year. Includes Washington D.C., as a state.
Sources: Activate analysis, Action Network, Legal Sports Report, State regulator reports, U.S. Bureau of Economic Analysis
SPORTS & SPORTS BETTING
We expect that U.S. sports betting direct revenues will reach $15B
by 2026

164
DIRECT SPORTS BETTING REVENUE1, U.S., 2021-2026E, BILLIONS USD
1. “Direct sports betting revenue” is defined as revenue calculated as a share of the total amount wagered and depends on
odds, type of wager, and individual sportsbooks. 2. State tax income is generated as a share of the total amount wagered, a
share of gross gaming revenue (ranges depending on the state and type of betting), and by gaming licensing fees.
Sources: Activate analysis, Eilers & Krejcik Gaming, Legal Sports Report, The Lines, Nevada Gaming Control Board, U.S.
Bureau of Economic Analysis
2021 2022E 2023E 2024E 2025E 2026E
$15.0B
$13.6B
$12.0B
$10.3B
$6.8B
$4.3B
ACTIVATE
FORECAST
ONLINE SPORTSBOOKS
CASINOS/RACETRACKS
STATES2
DIRECT SPORTS BETTING REVENUE1 GOES TO:
2021-2026E
CAGR
29%
SPORTS & SPORTS BETTING
Next-Gen Fans are more likely to participate in and spend more on
sports betting than Legacy Fans

165
SPORTS FAN1 PARTICIPATION AND SPEND IN SPORTS BETTING, U.S., 2022, % SPORTS FANS BY SEGMENT
1. “Sports fans” are defined as followers (e.g. those attending live games in person, watching live games or game highlights,
reading articles or statistics) of at least one sport in the last 12 months. 2. “Next-Gen Fans” are defined as sports fans
between the ages of 18-34. 3. “Legacy Fans” are defined as sports fans aged 35 or older. 4. As of Aug. 2022.
Sources: Activate analysis, Activate 2022 Consumer Technology & Media Research Study (n = 4,001)
Next-Gen Fans2 Legacy Fans3
10%
17%
42%
Under
$150/mo
58%
Over
$150/mo
50%
Over
$150/mo
50%
Under
$150/mo
Next-Gen Fans2 will define the trajectory of the U.S. sports betting market,
already representing over half of U.S. aggregate total wagers year-to-date4
SPORTS FAN1 PARTICIPATION IN SPORTS BETTING
NEXT-GEN FAN2
MONTHLY SPEND
LEGACY FAN3
MONTHLY SPEND
SPORTS & SPORTS BETTING
The largest states have yet to reach maturity or legalize sports
betting — legislative battles in these states will be instrumental in
determining the full U.S. market potential

166
1. Figures do not sum due to rounding. Aggregate gross amount wagered. 2. “Maturity” is defined as when all states reach a
steady-state average aggregate total wagers per capita. Excludes “betting never” states. 3. YTD June 2022 aggregate total
wagers annualized. 4. “Launch date” is defined as the year in which sports betting became / will become operational (online or
retail) in the state. 5. Florida signed legislation authorizing retail and online sports betting into law in Apr. 2021, but the tribal-
state gaming compact ratified by the legislation was invalidated in Nov. 2021.
Sources: Activate analysis, Action Network, Legal Sports Report, Nevada Gaming Control Board, State legislature reports, State
regulator reports, U.S. Bureau of Economic Analysis, U.S. Census Bureau
All Other
States:
$195B
TOTAL
VALUE
$385B
Top
States:
$190B
STATE
CURRENT
VALUE (2022E3)
VALUE AT
MATURITY2
LAUNCH
DATE4
California N/A $55B 2026
(estimated)
Texas N/A $39B 2025
(estimated)
New York $17B $28B 2019
Florida5
N/A $22B 2026
(estimated)
Illinois $9B $17B 2020
Pennsylvania $7B $15B 2018
Ohio N/A $13B 2023
(estimated)
TOTAL SPORTS BETTING AMOUNT WAGERED AT MARKET MATURITY1,2 BY STATE, U.S., BILLIONS USD
Not Launched
in State
Launched
& Currently
Live in State
ACTIVATE
FORECAST
SPORTS & SPORTS BETTING
www.activate.com 
167
CONTENTS PAGE
$420B Global Technology and Media Growth Dollars Up for Grabs 4
Consumer Technology and Media Time and Attention 9
Super Users: The Critical Segment for Technology and Media Companies 15
eCommerce and Marketplaces: Growth will Continue Across Categories
With Major Consumer Trends Serving as Tailwinds 29
Video: Streaming and Social Drive Growth 47
Gaming and Esports: A Mainstream Behavior and Precursor to The Metaverse 78
NFTs: Past the Hype Cycle, Towards Tangible Use Cases 95
Metaverse: Time for Practical Applications 108
Audio: Digital Audio Will Drive More Consumer Time and Spend 138
Sports and Sports Betting: Younger Next-Gen Sports Fans Drive Growth 152
Digital Fitness: Consumer Adoption Will Continue to Grow 167
1. Figures do not sum due to rounding. 2. Includes revenue from both subscriptions and in-app purchases. 3. Includes B2C
revenue only.
Sources: Activate analysis, Activate 2019 Consumer Technology & Media Research Study (n = 4,006), Activate 2022
Consumer Technology & Media Research Study (n = 4,001), Canaccord Genuity, Centers for Disease Control and Prevention,
CFRA, Cisco, Company sites, Crunchbase, data.ai, eMarketer, Euromonitor, Gallup, Gartner, IDC, Morgan Stanley, National
Telecommunications and Information Administration, Oppenheimer, Piper Sandler, S&P Global, Statista, Truist Securities,
U.S. Census Bureau, U.S. Department of Health & Human Services, William Blair
Health and fitness technology and services will reach a combined
market value of $30B by 2026

168
HEALTH AND FITNESS MOBILE APP
, CONNECTED FITNESS EQUIPMENT, AND WEARABLE DEVICE REVENUE1,
U.S., 2019 VS. 2022E VS. 2026E, BILLIONS USD
2019 2022E 2026E
$30B
$23B
$9B
$5.5B
$5.2B
$1.4B
$23.1B
$17.2B
$7.1B
ACTIVATE
FORECAST HEALTH AND FITNESS MOBILE APPS2
Workout/training, diet/nutrition tracking,
mindfulness/meditation, and sleep tracking
mobile apps for iOS and Android
WEARABLE DEVICES
Accessories or clothing embedded with
electronics, software, or sensors (excludes
headphones and AR/VR headsets)
CONNECTED FITNESS EQUIPMENT3
Internet-connected exercise equipment with
social / live class capabilities
2022E-2026E
CAGR:
6%
11%
2%
8%
$1.1B
2019-2022E
CAGR:
38%
26%
55%
34%
$0.7B
$0.4B
$1.4B
DIGITAL FITNESS
2019 2022
40%
24%
2019 2022
26%
11%
2019 2022
36%
23%
Consumer adoption of digital fitness technologies has significantly
increased since the COVID-19 outbreak, with wearable devices having
the largest penetration among consumers today

169
USAGE OF HEALTH AND FITNESS
SERVICES/APPS1, U.S., 2019 VS. 2022,
% ADULTS AGED 18+
OWNERSHIP OF CONNECTED FITNESS
EQUIPMENT2, U.S., 2019 VS. 2022,
% ADULTS AGED 18+
OWNERSHIP OF WEARABLE DEVICES3,
U.S., 2019 VS. 2022,
% ADULTS AGED 18+
+13pp
+15pp
+16pp
1. “Health and fitness services/apps” are defined as workout/training, diet/nutrition tracking, mindfulness/meditation, and sleep
tracking services/apps. 2. “Connected fitness equipment" is defined as internet-connected exercise equipment with social / live
class capabilities. Ownership is defined at the household level. 3. “Wearable devices” are defined as accessories or clothing
embedded with electronics, software, or sensors. Excludes headphones and AR/VR headsets.
Sources: Activate analysis, Activate 2019 Consumer Technology & Media Research Study (n = 4,006), Activate 2022 Consumer
Technology & Media Research Study (n = 4,001)
DIGITAL FITNESS
There is high consumer overlap with these behaviors; over one third
of digital fitness participants use all three digital fitness types

170
DIGITAL FITNESS
PARTICIPANTS1, U.S., 2022,
% ADULTS AGED 18+
135M
ADULTS AGED 18+
ARE DIGITAL FITNESS
PARTICIPANTS1
52%
Digital
Fitness
Participants1
48%
Non-Digital
Fitness
Participants1
15%
4%
4%
Health and Fitness
Service/App2 Users
14%
Wearable Device4
Owners
21%
Connected Fitness
Equipment3 Owners
5%
36%
OVERLAP
BETWEEN DIGITAL
FITNESS TYPES5
1. “Digital fitness participants” are defined as adults aged 18+ who use health and fitness services/apps, are in a household
that owns connected fitness equipment, or own a wearable device. 2. “Health and fitness services/apps” are defined as
workout/training, diet/nutrition tracking, mindfulness/meditation, and sleep tracking services/apps. 3. “Connected fitness
equipment” is defined as internet-connected exercise equipment with social / live class capabilities. Ownership is defined at
the household level. 4. “Wearable devices” are defined as accessories or clothing embedded with electronics, software, or
sensors. Excludes headphones and AR/VR headsets. 5. Figures do not sum to 100% due to rounding.
Sources: Activate analysis, Activate 2022 Consumer Technology & Media Research Study (n = 4,001), U.S. Census Bureau
DIGITAL FITNESS
SMART RINGS
SMART CLOTHING/SHOES
CHEST HEART RATE MONITORS
SMARTWATCHES / FITNESS TRACKERS
HEALTH AND FITNESS
SERVICES/APPS1 WEARABLE DEVICES3
CONNECTED FITNESS
EQUIPMENT2
As consumer interest has grown, a broad set of companies have
entered the digital health and fitness space

171
WORKOUT/TRAINING
DIET/NUTRITION TRACKING
SLEEP TRACKING
MINDFULNESS/MEDITATION
Workouts &
Fitness Plans
STATIONARY BIKES
TREADMILLS
ELLIPTICALS
ROWERS
MIRRORS/SCREENS
PUNCHING/BOXING EQUIPMENT
Note: As of Sept. 2022. 1. “Health and fitness services/apps” are defined as workout/training, diet/nutrition tracking,
mindfulness/meditation, and sleep tracking services/apps. 2. “Connected fitness equipment" is defined as internet-connected
exercise equipment with social / live class capabilities. 3. “Wearable devices” are defined as accessories or clothing embedded
with electronics, software, or sensors. Excludes headphones and AR/VR headsets.
Sources: Activate analysis, Company sites, data.ai
DIGITAL FITNESS
47M
48M
55M
65M
79%
80%
59%
25%
21%
20%
41%
75%
Workout/Training Diet/Nutrition Tracking Meditation/Mindfulness Sleep Tracking
Top apps/
services by
% adults aged
18+ who
subscribe2
While workout/training apps currently have the highest
penetration, we forecast that the next wave of consumer growth
will come from diet, meditation, and sleep services/apps

172
1. “Health and fitness subscriptions” are defined as paid subscriptions to workout/training, diet/nutrition tracking, mindfulness/
meditation, and sleep tracking services/apps. 2. Defined at the household level. 3. “Intend” is defined as extremely or very likely
to purchase a subscription in the next 12 months.
Sources: Activate analysis, Activate 2022 Consumer Technology & Media Research Study (n = 4,001), U.S. Census Bureau
CURRENT AND INTENDED OWNERSHIP OF DIGITAL HEALTH AND FITNESS SUBSCRIPTIONS1, U.S., 2022,
% ADULTS AGED 18+ WHO SUBSCRIBE2 TO OR INTEND3 TO SUBSCRIBE TO EACH TYPE OF DIGITAL HEALTH AND FITNESS SERVICE/APP
Adults aged 18+ who currently subscribe2 or intend3 to subscribe
Intend to Subscribe
(Extremely or very likely to
purchase a subscription in
the next 12 months)
Currently Subscribe
DIGITAL FITNESS
Our consumer research shows that interest in connected
fitness equipment is driven by convenience

173
INTENDED1 OWNERSHIP OF CONNECTED
FITNESS EQUIPMENT2, U.S., 2022,
% ADULTS AGED 18+
TOP REASONS3 FOR PURCHASING CONNECTED FITNESS EQUIPMENT2,
U.S., 2022, % ADULTS AGED 18+ WHO OWN4 CONNECTED FITNESS
EQUIPMENT
To exercise at any time
To exercise alone
(e.g. not with others at a gym/studio)
To save time
(e.g. time spent traveling to the gym)
To save money on traditional
gym/studio memberships
To track exercise performance and metrics
(e.g. active minutes, exercise frequency)
To access a specific type of exercise/workout
that I would not be able to access otherwise
To stay accountable
to health/fitness goals
To connect socially
(e.g. competing or taking live classes with friends)
To access professional guidance/instruction
To avoid gyms/studios due to health concerns
To replace gyms/studios that have closed
due to COVID-19 restrictions
24%
of consumers are
extremely or very
interested in purchasing
connected fitness
equipment in the
next 12 months
9%
11%
12%
12%
13%
14%
16%
16%
18%
26%
27%
1. “Intend” is defined as extremely or very likely to purchase connected fitness equipment in the next 12 months.
2. “Connected fitness equipment" is defined as internet-connected exercise equipment with social / live class
capabilities. 3. Consumers were asked to select up to two top reasons. 4. Ownership is defined at the household level.
Sources: Activate analysis, Activate 2022 Consumer Technology & Media Research Study (n = 4,001)
DIGITAL FITNESS
Millennials are twice as likely as all other age groups to own a wearable
device and also the most likely to purchase one in the future; the main
use case across all consumers is tracking daily activity

174
1. “Intend” is defined as extremely or very likely to purchase a wearable device in the next 12 months. Includes both
current owners and non-owners who intend to purchase. 2. “Wearable devices” are defined as accessories or clothing
embedded with electronics, software, or sensors. Excludes headphones and AR/VR headsets. 3. Consumers were asked
to select up to two top reasons.
Sources: Activate analysis, Activate 2022 Consumer Technology & Media Research Study (n = 4,001)
CURRENT AND INTENDED1 OWNERSHIP OF WEARABLE
DEVICES2 BY AGE GROUP, U.S., 2022, % ADULTS AGED 18+
TOP REASONS3 FOR PURCHASING A WEARABLE DEVICE,
U.S. 2022, % ADULTS AGED 18+ WHO OWN A WEARABLE
DEVICE2
To track daily activity
(e.g. daily steps, daily calories burned)
To monitor health information
(e.g. heart rate, blood oxygen levels)
To track exercise
performance and metrics
(e.g. active minutes, distance run)
To access smartphone capabilities
(e.g. to check notifications, to answer a call,
to play music, to make cardless payments)
To monitor and track sleep habits
(e.g. hours slept, quality of sleep)
To connect socially
(e.g. to enter competitions or share activity
with friends/family)
To access safety-related
functionality
(e.g. to be able to send SOS distress signals)
13%
13%
19%
25%
29%
31%
43%
Aged 18-24 Aged 25-34 Aged 35-44 Aged 45-54 Aged 55-64 Aged 65+
6%
8%
21%
52%
49%
37%
21%
20%
39%
60%
61%
45%
Intend to
Purchase
(Extremely or very
likely to purchase
in the next
12 months)
Currently Own
Adults
aged 25-44 are
2X
as likely to own
a wearable device as
all other age
groups
DIGITAL FITNESS
Immersive VR
fitness game that
provides a
variety of
workouts
(e.g. cardio,
meditation,
stretching)
set in virtual
locations
A wide range of
different types
of VR exercise
classes
(e.g. HIIT,
boxing, dance)
guided by
instructors and
paired with
music
VR rhythm game
in which players
hold virtual
sabers and slash
objects to the
beat of music
VR app that
allows users to
do a wide
variety of
workouts
(e.g. rowing,
running, HIIT)
with the option
to connect to
home fitness
equipment
Virtual reality fitness games will enhance the digital fitness experience
through a combination of wearables, connected devices, and subscription
services; potentially a precursor to more advanced Metaverse experiences

175
1. “Digital fitness participants” are defined as adults aged 18+ who use health and fitness services/apps, are in a household
that owns connected fitness equipment, or own a wearable device. 2. Used in the last 12 months.
Sources: Activate analysis, Activate 2022 Consumer Technology & Media Research Study (n = 4,001), Company sites,
eMarketer, Everyday Health, The Gamer, Meta Quest Store, Muscle and Health, Steam, The Wall Street Journal
DIGITAL FITNESS
PARTICIPANTS1 ARE
5X
AS LIKELY TO HAVE
USED2 A VR HEADSET THAN
NON-DIGITAL FITNESS
PARTICIPANTS1
DIGITAL FITNESS
Our 2023 data partners

176
ACTIVATE DATA PARTNERS
ENTERTAINMENT
STRATEGY GUY
Activate growth.
Own the future.
Technology. Internet. Media. Entertainment. These are the industries we’ve shaped, but the
future is where we live.
Activate Consulting helps technology and media companies drive revenue growth, identify
new strategic opportunities, and position their businesses for the future.
As the leading management consulting firm for these industries, we know what success
looks like because we’ve helped our clients achieve it in the key areas that will impact their
top and bottom lines.
Together, we can help you grow faster than the market and smarter than the competition.
New York
212 316 4444
www.activate.com
GET IN TOUCH:
Seref Turkmenoglu
seref@activate.com
Michael J. Wolf
michael@activate.com
Samuel Studnia
sam@activate.com
Edward Doueihi
edward@activate.com
Donovan Rose
donovan@activate.com
Anthony Aguila
anthony@activate.com
David Howard
david@activate.com
Activate’s capabilities to position companies for growth
GROWTH
STRATEGY
REVENUE OPTIMIZATION
AND ENGINEERING
IDENTIFY
OPPORTUNITIES AND
BUILD TECHNOLOGY-
ENABLED BUSINESSES
IMPLEMENTATION
AND EXECUTION
MANAGEMENT
PRINCIPAL AND PRIVATE
EQUITY INVESTORS
• Work with CEOs,
Founders, and senior
executives to build the
strategic roadmap for
growth and value
creation
• Identify new market
opportunities (business
areas, new products/
services, M&A)
• Create pragmatic
growth initiatives to
capture the
opportunities
• Go-to-market
• Customer acquisition
• Loyalty, retention, and
reactivation
• Sales activation
• Customer insight and
segmentation
• Marketing optimization
• Pricing
• Identify major new
opportunities
• Evaluate through
consumer and market
research
• Build the content,
experience,
functionality,
distribution
technology, and
business plan
• Define the execution
roadmap
• Create major initiatives
• Set revenue targets
• Create roadmap/
timeline and ensure
delivery
• Build organization and
team
• Define and specify
technology architecture
• Integration
• Build capabilities and
enabling technology
• Strategic due diligence
• Value creation programs
and strategies
• Publicly-traded company
opportunities
• Opportunity identification
• Sell-side diligence and
market evaluation
www.activate.com
CREATED BY
THE ACTIVATE CONSULTING TEAM:
Activate Technology
& Media
Outlook 2023
Michael Wolf
Seref Turkmenoglu
Samuel Studnia
Edward Doueihi
Donovan Rose
Anthony Aguila
David Howard
Allison Brito
Ellis Bowen
Çigdem Binal
Ryan Muldowney
Marlee Melendy
Lily Silva
Mark Manley
Griffin Glenn
Kyler Meehan
George Levy
Karinya Ghiara
Rachel Lunsford
Jonathan Homidan
Joe Sileo
Malcolm Bowman
Brigid Lynch
Cansu Seckin
Rebecca Federman
Taylan Tuncata
Danielle Koterbay
Leah Kochendoerfer
Ann Dockery
Justine Paolini
Max Wills
Ryan Bush
Aeron Davies
Ahmad Yousef
Ashkan Vafai
Gyana Singh
Madison Restivo
Max Sanson
Bert Li
Kate Buchholz
Leo deSouza
Nate Robards
Alexia Buchholz
Noah Sugerman
Tamara Levi
Laura Miller
Annik Wolf
Frank Noto
Denise Shea
Stephen Corsello
David Wish
Cassie Wat
Gbemi Adesanya
Leah Collins
Sydney Frame
www.activate.com
Thank you!
Digital version
of this report:
www.activate.com/#outlook
Mobile version:
www.activate.com
11 Madison Square North
New York, NY 10010
@activateinc

Activate Technology & Media Outlook 2023

  • 1.
  • 2.
    www.activate.com  1 Continued ➔ 11Takeaways from the Activate Technology & Media Outlook 2023 Time and Attention: User time spent with technology and media jumped during the pandemic by almost an hour, and that level has largely been sustained. More consumer time will lead to new opportunities to grow revenues and build new businesses. eCommerce and Marketplaces: By 2026, we forecast that 20% of retail sales in the U.S. will be through eCommerce. The growth will be fueled by large eCommerce players as well as category- focused businesses across all consumer categories. Even high-ticket categories such as automotive, jewelry, and furniture will accelerate their move online. A number of consumer trends including interest and adoption of re-commerce, livestream shopping, BNPL (Buy Now, Pay Later), and shopping memberships will be growth accelerators. Video: TikTok will be one of the most disruptive forces, not only in video but also in messaging, search, and eCommerce. Consumer time in streaming and social video will surpass that of television. The streaming wars will intensify, leading to bundled offerings of streaming services to lower acquisition costs and churn, increased spend on originals, advertising-supported tiers, and focus on international growth – all to drive subscriber growth and profitability. Gaming and Esports: Video gaming is a mainstream behavior appealing to a diverse array of users, from habitual gamers who embrace gaming as a lifestyle to occasional gamers. Habitual Gamers will be the earliest adopters of the Metaverse as they already take advantage of opportunities for immersive activities within games today. NFTs: The consumer use cases for NFTs will move away from speculative investments into more tangible use cases, rooted in community, loyalty, and collecting. We estimate that NFT revenues globally have already exceeded $23B in 2022 and we forecast continued growth in the coming years.
  • 3.
    www.activate.com  2 11 Takeawaysfrom the Activate Technology & Media Outlook 2023 Metaverse: Most of the foundational elements of the Metaverse are already here in video games. Over 300M people are spending a large part of their lives in Metaverse virtual worlds. People and companies cannot stand by and wait for the Metaverse to happen. Now is the time for sustained development and investment in practical applications. There will be vast opportunities for companies who can be part of the “interoperability layer.” Super Users are the “Metaverse Natives'' and will lead the way to the Metaverse for gamers and non-gamers alike. To scale, most experiences will be in 2D as we forecast that global sales of VR and AR headsets will grow to 44M units by 2026. Audio: Digital audio will lead to more time and spend on music and more advertising for podcasts. Most people are using multiple music services. TikTok is reshaping how users discover and engage with music. In-person live event revenue will surpass pre-COVID-19 levels, and virtual live events are here to stay. Podcasts are one of the fastest growing user behaviors and will reach nearly 160M U.S. listeners by 2026. Sports and Sports Betting: Sports fan consumption and engagement is in a transitional period – a new generation of consumers is emerging, live sports are moving to streaming, and sports betting is becoming an increasingly prevalent consumer behavior. Digital Fitness: Consumer adoption of digital fitness technologies has significantly increased since the COVID-19 outbreak. We forecast that this growth will continue, reaching a combined $30B in revenue by 2026, up from $23B today. Going forward, virtual reality will enhance digital fitness experiences in the Metaverse. Super Users: It will be critical for technology and media companies to identify, reach, and super- serve Super Users, who account for 22% of the population and heavily over-index on time and dollar spend. Super Users are “Metaverse Natives,” with over 80% having used a Metaverse platform over the last 12 months. Technology and Media Revenues: We forecast over $400B in global spend by 2026, as consumers continue to spend on technology and media through economic uncertainty.
  • 4.
    www.activate.com  3 CONTENTS PAGE $420BGlobal Technology and Media Growth Dollars Up for Grabs 4 Consumer Technology and Media Time and Attention 9 Super Users: The Critical Segment for Technology and Media Companies 15 eCommerce and Marketplaces: Growth will Continue Across Categories With Major Consumer Trends Serving as Tailwinds 29 Video: Streaming and Social Drive Growth 47 Gaming and Esports: A Mainstream Behavior and Precursor to The Metaverse 78 NFTs: Past the Hype Cycle, Towards Tangible Use Cases 95 Metaverse: Time for Practical Applications 108 Audio: Digital Audio Will Drive More Consumer Time and Spend 138 Sports and Sports Betting: Younger Next-Gen Sports Fans Drive Growth 152 Digital Fitness: Consumer Adoption Will Continue to Grow 167
  • 5.
    www.activate.com  4 CONTENTS PAGE $420BGlobal Technology and Media Growth Dollars Up for Grabs 4 Consumer Technology and Media Time and Attention 9 Super Users: The Critical Segment for Technology and Media Companies 15 eCommerce and Marketplaces: Growth will Continue Across Categories With Major Consumer Trends Serving as Tailwinds 29 Video: Streaming and Social Drive Growth 47 Gaming and Esports: A Mainstream Behavior and Precursor to The Metaverse 78 NFTs: Past the Hype Cycle, Towards Tangible Use Cases 95 Metaverse: Time for Practical Applications 108 Audio: Digital Audio Will Drive More Consumer Time and Spend 138 Sports and Sports Betting: Younger Next-Gen Sports Fans Drive Growth 152 Digital Fitness: Consumer Adoption Will Continue to Grow 167
  • 6.
    We forecast significantgrowth ahead for the global internet and media industries, with more than $400B in growth between 2022 and 2026  5 TECHNOLOGY AND MEDIA REVENUES 1. “Internet and media revenues” include radio subscription and licensing fees, recorded music, magazine publishing, newspaper publishing, video games, filmed entertainment, book publishing, TV subscription and licensing fees, internet access, digital advertising, and traditional advertising on these platforms. Sources: Activate analysis, Alliance for Audited Media, Dentsu International, eMarketer, GroupM, IBISWorld, Newzoo, Omdia, Pew Research Center, PricewaterhouseCoopers, Zenith Media 2022E 2026E $2.7T $2.3T $421B GROWTH DOLLARS 2022E-2026E CAGR: 4.3% ACTIVATE FORECAST INTERNET AND MEDIA REVENUES1, GLOBAL, 2022E VS. 2026E, USD
  • 7.
    Paid content2 Advertising revenue Cost ofinternet access3 Global advertising spend will drive more than half of the growth  6 INTERNET AND MEDIA REVENUE1 GROWTH BY SEGMENT, GLOBAL, 2022E VS. 2026E, USD 1. “Internet and media revenues” include radio subscription and licensing fees, recorded music, magazine publishing, newspaper publishing, video games, filmed entertainment, book publishing, TV subscription and licensing fees, internet access, digital advertising, and traditional advertising on these platforms. 2. “Paid content” includes radio subscription and licensing fees, recorded music, magazine publishing, book publishing, newspaper publishing, video games, TV subscription and licensing fees, and filmed entertainment. 3. “Internet access” includes fixed broadband, wireless, and mobile internet access. Sources: Activate analysis, Alliance for Audited Media, Dentsu International, eMarketer, GroupM, IBISWorld, Newzoo, Omdia, Pew Research Center, PricewaterhouseCoopers, Zenith Media 2022E 2026E $223B $101B $97B $2.3T $2.7T 30% 35% 35% 29% 33% 38% ACTIVATE FORECAST 3.3% 3.0% 6.3% 2022E-2026E CAGR: Driving over half of the growth TECHNOLOGY AND MEDIA REVENUES
  • 8.
    Subscription revenue Single transactions In terms ofconsumer spending, subscriptions will add $146B in growth dollars and single transactions will add $51B  7 CONSUMER INTERNET AND MEDIA REVENUE1 GROWTH BY REVENUE MODEL, GLOBAL, 2022E VS. 2026E, USD 1. “Consumer internet and media revenues” include radio subscription and licensing fees, recorded music, magazine publishing, newspaper publishing, video games, filmed entertainment, book publishing, TV subscription and licensing fees, and internet access. Sources: Activate analysis, Alliance for Audited Media, Dentsu International, eMarketer, GroupM, IBISWorld, Newzoo, Omdia, Pew Research Center, PricewaterhouseCoopers, Zenith Media 2022E 2026E 81% 19% 80% 20% $1.5T $1.7T $146B $51B ACTIVATE FORECAST 2022E-2026E CAGR: 4.2% 2.9% TECHNOLOGY AND MEDIA REVENUES
  • 9.
    1. “Video gaming”excludes spend on hardware and devices. Sources: Activate analysis, Activate 2022 Consumer Technology & Media Research Study (n = 4,001) Groceries Household Products Cable / Satellite TV Music Services Video Gaming1 Video Streaming Clothing and Shoes Travel/ Vacation Dining Out  8 31% 35% 37% 59% 52% 64% 62% 65% 76% 48% 49% 52% 68% 69% 70% 73% 78% 85% % with household income at or above $100K % with household income less than $100K TECHNOLOGY & MEDIA SPEND CATEGORIES Adults expect they would maintain/increase their spend on technology and media at higher rates than other discretionary spend categories In response to economic uncertainty, most consumers anticipate they would maintain their spend on technology and media; adults with household incomes above $100K are more likely to maintain/increase their spend EXPECTATION TO MAINTAIN OR INCREASE SPEND IN RESPONSE TO ECONOMIC UNCERTAINTY BY CATEGORY, U.S., 2022, % ADULTS AGED 18+ WHO CURRENTLY SPEND IN EACH CATEGORY TECHNOLOGY AND MEDIA REVENUES
  • 10.
    www.activate.com  9 CONTENTS PAGE $420BGlobal Technology and Media Growth Dollars Up for Grabs 4 Consumer Technology and Media Time and Attention 9 Super Users: The Critical Segment for Technology and Media Companies 15 eCommerce and Marketplaces: Growth will Continue Across Categories With Major Consumer Trends Serving as Tailwinds 29 Video: Streaming and Social Drive Growth 47 Gaming and Esports: A Mainstream Behavior and Precursor to The Metaverse 78 NFTs: Past the Hype Cycle, Towards Tangible Use Cases 95 Metaverse: Time for Practical Applications 108 Audio: Digital Audio Will Drive More Consumer Time and Spend 138 Sports and Sports Betting: Younger Next-Gen Sports Fans Drive Growth 152 Digital Fitness: Consumer Adoption Will Continue to Grow 167
  • 11.
    Activate’s Attention Clock:Our analysis of consumer technology and media activity shows that multitasking leads to a 32-hour day for the average American, with over 13 hours spent using technology and media  10 1. Behaviors averaged over 7 days. Figures do not sum due to rounding. 2 “Other” includes media activities outside of the listed categories, such as browsing websites, reading, and attending live events. Sources: Activate analysis, Activate 2022 Consumer Technology & Media Research Study (n = 4,001), Company filings, Comscore, Conviva, Edison Research, eMarketer, Gallup, GWI, Interactive Advertising Bureau, Music Biz, National Sleep Foundation, Newzoo, Nielsen, NPD Group, Pew Research Center, U.S. Bureau of Labor Statistics, YouGov 7:00 Other Non-Work Activities Cooking & housework, personal & household care, leisure, fitness, eating & drinking, community & other activities 5:20 Work & Work-Related Activities 6:35 13:09 Consumer Technology & Media Activity 7:00 5:20 1:53 2:48 5:17 1:33 1:39 32:04 Average Day Length per Adult Other2 Messaging & Social Media (includes social video) AVERAGE DAY BY ACTIVITY PER ADULT AGED 18+1, U.S., 2021, HOURS:MINUTES 6:35 Sleep Video Audio Gaming CONSUMER ATTENTION
  • 12.
    Video captures thelargest share of consumers’ daily time spent with technology and media  11 1. Behaviors averaged over 7 days. Values rounded to the nearest whole 15-minute increment. 2. “Other” includes media activities outside of the listed categories, such as browsing websites, reading, and attending live events. Sources: Activate analysis, Activate 2022 Consumer Technology & Media Research Study (n = 4,001), Company filings, Comscore, Conviva, eMarketer, GWI, Music Biz, Newzoo, Nielsen, NPD Group, Pew Research Center, U.S. Bureau of Labor Statistics Audio Gaming Video Other2 An average 13-hour technology and media day in 15-minute intervals Messaging & Social Media (includes social video) AVERAGE DAILY TECHNOLOGY AND MEDIA ATTENTION PER ADULT AGED 18+1, U.S., 2021, 15-MINUTE INTERVALS CONSUMER ATTENTION
  • 13.
    Gaming & Reading aremore likely to require focus Social Media & Video enable a mix of passive and active engagement Music & Podcasts are often consumed passively Multitasking is a prevalent behavior among consumers and explains the growth in time spent with technology and media  12 MULTITASKING1 BEHAVIOR BY ACTIVITY, U.S., 2022, % ADULTS AGED 18+ WHO ENGAGE IN EACH ACTIVITY 1. “Multitasking” is defined as simultaneously doing another activity, such as working, cleaning, cooking, or exercising. Sources: Activate analysis, Activate 2022 Consumer Technology & Media Research Study (n = 4,001) Listening to Music Listening to Podcasts Using Social Media Watching Videos Playing Video Games Reading Consumers who multitask1 all, almost all, or most of the time when… 61% 68% 21% 34% 40% 46% Visual-Based Activity Audio-Based Activity CONSUMER ATTENTION
  • 14.
    The growth indaily time spent with technology and media since the COVID-19 spike has largely been sustained  13 AVERAGE DAILY TECHNOLOGY AND MEDIA ATTENTION PER ADULT AGED 18+1, U.S., 2019-2022E, HOURS:MINUTES 1. Behaviors averaged over 7 days. Sources: Activate analysis, Activate 2022 Consumer Technology & Media Research Study (n = 4,001), Company filings, Comscore, Conviva, eMarketer, GWI, Music Biz, Newzoo, Nielsen, NPD Group, Pew Research Center, U.S. Bureau of Labor Statistics 2019 2020 2021 2022E 13:05 1.9% 1.2% -0.5% YOY CHANGE: 12:24 13:11 13:09 6.3% -0.3% Growth in time spent with technology and media has been sustained since the COVID-19 outbreak ACTIVATE FORECAST CONSUMER ATTENTION
  • 15.
    We forecast thatgaming will lead the growth in consumer daily time spent with technology and media over the next four years  14 AVERAGE DAILY TECHNOLOGY AND MEDIA ATTENTION PER ADULT AGED 18+1, U.S., 2022E VS. 2026E, HOURS:MINUTES CONSUMER ATTENTION 1. Behaviors averaged over 7 days. Figures do not sum due to rounding. 2. “Other” includes media activities outside of listed categories, such as browsing websites, reading, and attending live events. Sources: Activate analysis, Activate 2022 Consumer Technology & Media Research Study (n = 4,001), Company filings, Comscore, Conviva, eMarketer, GWI, Music Biz, Newzoo, Nielsen, NPD Group, Pew Research Center, U.S. Bureau of Labor Statistics 2022E 2026E 13:05 13:15 5:17 2:51 1:47 1:33 1:37 5:14 2:55 1:59 1:33 1:33 Audio Gaming Messaging & Social Media (includes social video) Other2 Video TOTAL TIME: -1.2% -0.1% 2.7% 0.6% -0.2% 0.3% 2022E-2026E CAGR: ACTIVATE FORECAST
  • 16.
    www.activate.com  15 CONTENTS PAGE $420BGlobal Technology and Media Growth Dollars Up for Grabs 4 Consumer Technology and Media Time and Attention 9 Super Users: The Critical Segment for Technology and Media Companies 15 eCommerce and Marketplaces: Growth will Continue Across Categories With Major Consumer Trends Serving as Tailwinds 29 Video: Streaming and Social Drive Growth 47 Gaming and Esports: A Mainstream Behavior and Precursor to The Metaverse 78 NFTs: Past the Hype Cycle, Towards Tangible Use Cases 95 Metaverse: Time for Practical Applications 108 Audio: Digital Audio Will Drive More Consumer Time and Spend 138 Sports and Sports Betting: Younger Next-Gen Sports Fans Drive Growth 152 Digital Fitness: Consumer Adoption Will Continue to Grow 167
  • 17.
    Over the nextyears, the imperative for technology and media companies will be to identify, reach, and super-serve Super Users – the single group of power users whose time and spend far surpass those of other users  16 SUPER USERS Source: Activate analysis Super Users account for a disproportionately large share of time and spend across all major media and technology verticals, including video, gaming, music, podcasts, messaging and social media, eCommerce, Metaverse, live events, mobile data, and more The key challenge and opportunity for technology and media companies will be to successfully target these consumers, and capture their time and spend, through unique and personalized experiences
  • 18.
    Representing 22% ofthe U.S. population, Super Users spend more than double the amount of time consuming media as all other users  17 AVERAGE DAILY TIME SPENT WITH MEDIAPER USER1, U.S., 2022E, % ADULTS AGED 18+ / HOURS:MINUTES SUPER USERS SUPER USERS User Population 18:55 TOTAL HOURS 22% ALL OTHER USERS 9:21 TOTAL HOURS 78% 1. Includes time spent watching video, playing video games, listening to music, listening to podcasts, and using messaging / social media services. Does not account for multitasking. Sources: Activate analysis, Activate 2022 Consumer Technology & Media Research Study (n = 4,001), Company filings, Comscore, Conviva, eMarketer, GWI, Music Biz, Newzoo, Nielsen, NPD Group, Pew Research Center, U.S. Bureau of Labor Statistics
  • 19.
    Video Gaming Music Podcasts Messaging & Social Media (includessocial video) Super Users spend substantially more time engaging in all major media activities than all other users AVERAGE DAILY TIME SPENT PER USER BY MEDIA TYPE, U.S., 2022E, HOURS:MINUTES SUPER USERS Super Users All Other Users 18:55 Total Hours1 9:21 Total Hours1,2 7:01 4:47 4:02 1:09 3:35 1:41 1:48 0:27 2:29 1:18 1. “Total hours” do not account for multitasking. 2. Figures do not sum due to rounding. Sources: Activate analysis, Activate 2022 Consumer Technology & Media Research Study (n = 4,001), Company filings, Comscore, Conviva, eMarketer, GWI, Music Biz, Newzoo, Nielsen, NPD Group, Pew Research Center, U.S. Bureau of Labor Statistics  18 1.5x 3.5x 2.1x 4.1x 1.9x SUPER USERS ALL OTHER USERS
  • 20.
    WATCHING VIDEOS PLAYING VIDEO GAMES LISTENING TO MUSIC LISTENING TOPODCASTS USING SOCIAL MEDIA SUPER USERS ALL OTHER USERS Across all major media activities, Super Users are significantly more likely to multitask, enabling them to spend more overall time with media  19 MULTITASKING1 BEHAVIOR BY MEDIA ACTIVITY, U.S., 2022, % ADULTS AGED 18+ WHO ENGAGE IN EACH ACTIVITY 1. “Multitasking” is defined as simultaneously doing another activity, such as working, cleaning, cooking, or exercising. Sources: Activate analysis, Activate 2022 Consumer Technology & Media Research Study (n = 4,001) SUPER USERS CONSUMERS WHO MULTITASK1 ALL, ALMOST ALL, OR MOST OF THE TIME WHEN… 60% 52% 78% 69% 66% 33% 24% 64% 53% 38%
  • 21.
    Commensurate with theamount of time they spend with media, Super Users account for a disproportionately high share of dollar spend across video, gaming, and music MONTHLY DOLLAR SPEND BY MEDIA TYPE, U.S., 2022E, % ADULTS AGED 18+ / % TOTAL SPEND BY MEDIA TYPE / USD PER USER SUPER USERS 78% 22% ALL OTHER USERS User Population Total Video Spend1 Total Gaming Spend2 Total Music Spend3 1. Includes money spent on all videos and video services, including traditional/virtual Pay TV, video streaming subscription services, and video purchases/rentals. 2. Includes money spent on video games and other video gaming purchases (e.g. in- app purchases, video gaming subscription services) across all devices. 3. Includes money spent on music and music services. Sources: Activate analysis, Activate 2022 Consumer Technology & Media Research Study (n = 4,001), eMarketer, Goldman Sachs, Grand View Research, IFPI, Newzoo, Omdia, PricewaterhouseCoopers, Recording Industry Association of America, SiriusXM, Statista SUPER USERS 74% 20% 80% 20% 80% 56% 44%  20 $27/ USER $4/ USER $1/ USER $21/ SUPER USER $49/ SUPER USER $76/ SUPER USER
  • 22.
    Super Users areyounger, more affluent, and have a higher level of education than all other users  21 SUPER USERS Are aged 18-34 Have a household income of $100K or greater Are the sole or primary earner for their household Hold an associate degree or higher 43% 57% 26% 24% 54% 80% 47% 52% % Super Users % All Other Users Sources: Activate analysis, Activate 2022 Consumer Technology & Media Research Study (n = 4,001), U.S. Census Bureau USER DEMOGRAPHICS, U.S., 2022, % ADULTS AGED 18+
  • 23.
    Super Users AllOther Users 23% 14% 66% 85% Super Users are highly connected; the vast majority subscribe to unlimited mobile data plans MOBILE DATA PLAN ACCESS, U.S., 2022, % ADULTS AGED 18+ SUPER USERS 1. “Unlimited” as reported by consumers. Sources: Activate analysis, Activate 2022 Consumer Technology & Media Research Study (n = 4,001) 11% No mobile data plan Mobile data plan with data limit Unlimited1 mobile data plan  22 1%
  • 24.
    Enjoy keeping informedon trends and news about the latest technology and media products/services Enjoy buying/using new technology and media products/services before anyone else they know Enjoy recommending technology and media products/services to others Feel that they can better express themselves when online Feel that it is easier to socialize and make new friends online Feel comfortable sharing data with technology and media companies in exchange for more personalized/relevant recommendations and ads Super Users are in the vanguard of technology and media adoption; the majority are brand advocates, highly attuned to new products/services, and comfortable expressing themselves and sharing their personal data online  23 CONSUMER ATTITUDES, U.S., 2022, % ADULTS AGED 18+ Sources: Activate analysis, Activate 2022 Consumer Technology & Media Research Study (n = 4,001) SUPER USERS 18% 25% 25% 26% 21% 32% 63% 69% 68% 71% 70% 75% % Super Users % All Other Users EARLY ADOPTER ATTITUDES DIGITAL-FIRST ATTITUDES
  • 25.
     24 ECOMMERCE SPEND, U.S.,2022, % ADULTS AGED 18+ / % TOTAL ECOMMERCE SPEND Sources: Activate analysis, Activate 2022 Consumer Technology & Media Research Study (n = 4,001) Within eCommerce, Super Users account for the bulk of total spend and also over-index on emerging eCommerce behaviors Total eCommerce Spend User Population SUPER USERS 78% 22% 40% 60% EMERGING ECOMMERCE BEHAVIORS IN THE LAST 12 MONTHS, U.S., 2022, SUPER USERS INDEXED TO ALL OTHER USERS As likely to have bought a product directly through a social media website/app As likely to have bought a product through a livestream shopping event As likely to have used an AR-powered virtual try-on or visualization feature (e.g. to test clothing, footwear, accessories, beauty products, furniture, home goods, appliances) Super Users over-index on several emerging eCommerce activities 3.1x SOCIAL COMMERCE 6.5x LIVESTREAM SHOPPING 5.5x VIRTUAL TRY-ON ALL OTHER USERS SUPER USERS
  • 26.
    Super Users areearly adopters of both cryptocurrency and NFTs  25 SUPER USERS 1. “Cryptocurrency participation” is defined as buying, receiving, mining, or selling cryptocurrency. 2. “NFT participation” is defined as researching/discussing, browsing, bidding for, purchasing, displaying, selling, or creating NFTs. Sources: Activate analysis, Activate 2022 Consumer Technology & Media Research Study (n = 4,001), Activate 2022 Metaverse & NFT Consumer Research Study (n = 3,078) CRYPTOCURRENCY PARTICIPATION1 IN THE LAST 12 MONTHS, U.S., 2022, % ADULTS AGED 18+ NFT PARTICIPATION2 IN THE LAST 12 MONTHS, U.S., 2022, % ADULTS AGED 18+ Super Users All Other Users 12% 60% Super Users All Other Users 9% 49% +40pp +48pp
  • 27.
    Super Users arethe pioneers of the Metaverse, with over 80% having used a Metaverse platform in the last 12 months  26 USAGE OF METAVERSE PLATFORMS1 IN THE LAST 12 MONTHS, U.S., 2022, % ADULTS AGED 18+ 1. “Metaverse platforms” are defined as platforms with immersive virtual worlds, within which consumers can explore with a personalized character/avatar, interact with other users, and participate in a range of activities (e.g. online concerts, online games, online work meetings). Sources: Activate analysis, Activate 2022 Consumer Technology & Media Research Study (n = 4,001) SUPER USERS Super Users All Other Users 21% 81% EXAMPLE METAVERSE PLATFORMS1
  • 28.
    CREATION ACTIVITIES IN THEMETAVERSE Creating/personalizing a virtual character/avatar or virtual items Creating/personalizing virtual places or maps SOCIAL ACTIVITIES IN THE METAVERSE Attending live performances, sporting events, or esports events Socializing with friends/family or meeting new people Traveling to virtual versions of real-world locations Attending educational classes, work-related meetings, or networking events TRANSACTIONAL ACTIVITIES IN THE METAVERSE Purchasing or selling virtual goods Purchasing or selling physical goods Investing, lending, or borrowing money Going forward, Super Users are interested in using the Metaverse for a broad range of activities  27 INTEREST IN PARTICIPATING IN SELECT METAVERSE ACTIVITIES IN THE NEXT 12 MONTHS, U.S., 2022, % ADULTS AGED 18+ Sources: Activate analysis, Activate 2022 Consumer Technology & Media Research Study (n = 4,001) SUPER USERS 10% 17% 15% 19% 21% 20% 25% 14% 20% 57% 69% 71% 66% 71% 72% 73% 67% 76% % Super Users % All Other Users EXTREMELY OR VERY INTERESTED IN…
  • 29.
    CONCERTS OR MUSIC FESTIVALS LIVEPROFESSIONAL SPORTING EVENTS LIVE COLLEGE SPORTING EVENTS COMEDY SHOWS LIVE ESPORTS EVENTS THEATER PERFORMANCES AVERAGE NUMBER OF LIVE EVENTS1 ATTENDED IN THE LAST 12 MONTHS 15% 6% 12% 13% 14% 20% 46% 46% 48% 49% 52% 56% Super Users will also usher in the return of live in-person events  28 INTENT TO ATTEND MORE LIVE EVENTS1 IN THE NEXT 12 MONTHS THAN IN THE LAST 12 MONTHS, U.S., 2022, % ADULTS AGED 18+ 1. Includes live events in large venues (e.g. theaters, stadiums, festival grounds). Sources: Activate analysis, Activate 2022 Consumer Technology & Media Research Study (n = 4,001) 1.3 4.4 1.1 4.2 0.9 4.0 0.2 2.2 0.8 3.8 1.0 3.8 % Super Users % All Other Users SUPER USERS
  • 30.
    www.activate.com  29 CONTENTS PAGE $420BGlobal Technology and Media Growth Dollars Up for Grabs 4 Consumer Technology and Media Time and Attention 9 Super Users: The Critical Segment for Technology and Media Companies 15 eCommerce and Marketplaces: Growth will Continue Across Categories With Major Consumer Trends Serving as Tailwinds 29 Video: Streaming and Social Drive Growth 47 Gaming and Esports: A Mainstream Behavior and Precursor to The Metaverse 78 NFTs: Past the Hype Cycle, Towards Tangible Use Cases 95 Metaverse: Time for Practical Applications 108 Audio: Digital Audio Will Drive More Consumer Time and Spend 138 Sports and Sports Betting: Younger Next-Gen Sports Fans Drive Growth 152 Digital Fitness: Consumer Adoption Will Continue to Grow 167
  • 31.
    2022E 2026E $32.0T $25.8T $9.4T $3.6T $5.8T $2.6T $22.6T $20.0T $28 $26 GlobaleCommerce will reach $9.4T in 2026, continuing to grow faster and add more absolute dollars than physical retail post- pandemic  30 RETAIL SALES1 BY CHANNEL, GLOBAL, 2022E VS. 2026E, TRILLIONS USD ECOMMERCE & MARKETPLACES 23% 29% eCommerce Share of Total Retail Sales eCommerce Physical Retail 13% 3% 6% 2022E-2026E CAGR: 1. Excludes travel and event tickets, food and drink services, and vice goods and activities. Sources: Activate analysis, Digital Commerce 360, eMarketer, Research and Markets ACTIVATE FORECAST
  • 32.
    The leaders ineCommerce are companies based in APAC and the U.S.  31 SHARE OF ONLINE GROSS MERCHANDISE VOLUME (GMV)BY COMPANY1, GLOBAL, 2021, % TOTAL ONLINE GMV 37% 13% 7% 10% 24% Rest of Web2 PINDUODUO 2021 TOTAL ONLINE GMV: $5.1T 2% 2% 1% 1% 1% 1% Share of Total Online GMV for Top APAC-Based Companies: 44% Share of Total Online GMV for Top U.S.-Based Companies: 18% 1. Figures do not sum to 100% due to rounding. 2. All of online gross merchandise volume not covered by top 10 companies. Sources: Activate analysis, Company filings, Company press releases, Company sites, Digital Commerce 360, eMarketer, Internal Revenue Service ECOMMERCE & MARKETPLACES
  • 33.
    11% 12% 15% 28% 35% 43% China U.K. South Korea U.S.Japan Germany $6.1T $0.7T $0.5T $6.6T $1.4T $1.1T China has been at the vanguard of eCommerce, as it represents over 50% of total eCommerce sales worldwide  32 Sources: Activate analysis, Business Insider, CBRE Group, Digital Commerce 360, eMarketer, Forbes, Internal Revenue Service, Jefferies, J.P . Morgan, Morning Consult, Quartz, Schroders, Statista, The Wall Street Journal, World Bank ECOMMERCE SHARE OF RETAIL SALES BY COUNTRY, GLOBAL, 2021, % TOTAL RETAIL SALES IN EACH COUNTRY SHARE OF ONLINE GROSS MERCHANDISE VOLUME (GMV) BY COUNTRY, GLOBAL, 2021, % TOTAL ONLINE GMV 2021 TOTAL ONLINE GMV: $5.1T China 51% U.S. 19% U.K. 5% 3% Japan 3% Germany 2% South Korea 17% Rest of World - Consumer preference for online vs. in-store shopping - Adoption of digital wallets and mobile payments - Usage of platform experiences (e.g. WeChat) RETAIL SALES BY COUNTRY China leads in both total retail sales as well as eCommerce share of retail sales As such, China is a dominant force in eCommerce, with over 50% share of worldwide online GMV Going forward, drivers of China’s eCommerce growth could propel growth in other major markets, particularly the U.S. ECOMMERCE GROWTH DRIVERS ECOMMERCE & MARKETPLACES
  • 34.
    ECOMMERCE SHARE OF TOTALRETAIL SALES We forecast that eCommerce in the U.S. will reach $1.7T by 2026, accounting for 20% of total retail sales  33 RETAIL ECOMMERCE SALES, U.S., 2019 VS. 2022E VS. 2026E, TRILLIONS USD 2019 2022E 2026E $1.7T $1.1T $0.6T Sources: Activate analysis, Company filings, Company press releases, Company sites, Digital Commerce 360, eMarketer, Internal Revenue Service, Statista 11% 20% 15% 2019-2022E CAGR: 21% 2022E-2026E CAGR: 12% ACTIVATE FORECAST ECOMMERCE & MARKETPLACES
  • 35.
     34 CLOTHING, SHOES, ACCESSORIES BEAUTY & PERSONALCARE JEWELRY MASS ONLINE RETAILERS GROCERIES HOUSEHOLD PRODUCTS There will be large category-focused eCommerce businesses selling through their own online stores in addition to mass online retailers FURNITURE ELECTRONICS SPORTING GOODS TOYS & GAMES HOME IMPROVEMENT & DECOR AUTOMOTIVE CATEGORY-FOCUSED RETAILERS Note: As of Oct. 2022. Sources: Activate analysis, Andreessen Horowitz, Comscore, eMarketer, Forbes, Business Insider, Statista ECOMMERCE & MARKETPLACES
  • 36.
    FUNCTION DESCRIPTION EXAMPLECOMPANIES Storefront Creation Providers for eCommerce website creation and hosting capabilities Inventory Management and Fulfillment Tools essential to tracking and managing inventory (e.g. location, amount, current mix) as well as delivering products (e.g. carriers, delivery and shipping options) Payment Services Providers enabling eCommerce purchasing through first- and third-party gateways, POS app and hardware integration, and payment and financing plans Customer Service, Relationship Management, and Loyalty Tools and services dedicated to tracking customer relationships and communicating with customers Marketing and Sales Effectiveness Solutions with capabilities that utilize data to effectively reach consumers across channels (e.g. analytics, sales channels, pricing, merchandising) Back-end Solutions Solutions enabling eCommerce sales, including cloud storage/hosting, content delivery, and accounting software eCommerce enablement solutions, including storefront and site creation tools, will fuel the growth of category-focused players  35 ECOMMERCE ENABLEMENT REVENUE, GLOBAL, 2022E VS. 2026E, BILLIONS USD 2022E 2026E $8.7B $7.3B 2022E-2026E CAGR: 4.6% MAJOR CROSS- FUNCTION LEADERS Sources: Activate analysis, Apps Run The World, BigCommerce, Company sites, Salesforce, Statista ECOMMERCE & MARKETPLACES
  • 37.
    ESSENTIAL ITEMS CONSUMER MONETARYSPEND PER ONLINE PURCHASE CONSUMER TIME/EFFORT SPENT Essential product categories will continue to lead eCommerce growth as they require less consideration before purchase decisions and continue to exhibit growing online penetration  36 Size of bubble represents 2022E share of total product category retail sales from eCommerce HIGH LOW HIGH LOW 1.7x vs. 20171 Furniture 1.1x vs. 20171 Jewelry 1.8x vs. 20171 Clothing, Shoes, Accessories 2.1x vs. 20171 Household Products 3.7x vs. 20171 Groceries PRODUCT CATEGORY SEGMENTATION FOR ONLINE PURCHASES 1.3x vs. 20171 Auto & Parts Beauty & Personal Care 1.7x vs. 20171 1. Represents the share of total category retail sales from eCommerce in 2022E indexed to 2017. Sources: Activate analysis, Activate 2022 Consumer Technology & Media Research Study (n = 4,001), Company press releases, Company sites, eMarketer, Forrester, Statista ECOMMERCE & MARKETPLACES
  • 38.
    As one ofthe major retail categories with low eCommerce penetration today, we forecast that by 2026, revenue from cars purchased online and fulfilled via delivery will reach over $200B and represent over 10% of total car purchases  37 CAR PURCHASES COMPLETED ONLINE1 AND FULFILLED VIA DELIVERY, U.S., 2021 VS. 2026E, % TOTAL CAR PURCHASES2 Total Car Purchases Completed Online and Fulfilled via Delivery 2% 10%-15% 0.9M Sales from car purchases completed online and fulfilled via delivery will surpass $200B annually by 2026 6M-9M 2026E 2021 1. “Completed online” is defined as having set up the full car deal online, including the down payment, monthly payment, and trade-in. 2. “Total car purchases” include both new and used cars. Sources: Activate analysis, Company filings, Company press releases, Company sites, Comscore, Cox Automotive, eMarketer, Federal Reserve Bank of St. Louis, IBISWorld, IHS Markit, Khaveen Investments, U.S. Bureau of Economic Analysis, U.S. Census Bureau, Wells Fargo ACTIVATE FORECAST ECOMMERCE & MARKETPLACES
  • 39.
    Despite rising pricesdue to inflation, over half of online shoppers have increased or maintained online purchases across essential categories  38 CHANGE IN ONLINE PURCHASING BEHAVIOR IN RESPONSE TO RECENT PRICE INCREASES BY CATEGORY, U.S., 2022, % ADULTS 18+ WHO HAVE SHOPPED FOR PRODUCTS ONLINE IN EACH CATEGORY IN THE LAST 12 MONTHS ESSENTIAL ITEMS Groceries Household Products Beauty & Personal Care Clothing, Shoes, Accessories Furniture Jewelry 13% 13% 10% 12% 11% 17% 34% 35% 40% 49% 53% 53% Have increased purchases Have maintained purchases Sources: Activate analysis, Activate 2022 Consumer Technology & Media Research Study (n = 4,001) ECOMMERCE & MARKETPLACES
  • 40.
    In response tothe recent price increases, consumers are choosing to use online channels to compare prices and find deals and promotions  39 ACTIONS TAKEN WHILE SHOPPING ONLINE IN RESPONSE TO RECENT PRICE INCREASES, U.S., 2022, % ADULTS AGED 18+ WHO HAVE SHOPPED ONLINE IN THE LAST 12 MONTHS Visited multiple online stores to find the best price Looked for or waited for discounts and promotions before making a purchase Bought in larger quantities to receive a discount Bought from used/refurbished item marketplaces (e.g. eBay, Facebook Marketplace) Used “Buy Now, Pay Later” options (e.g. Affirm, Afterpay, Klarna) Signed up for a paid shopping program membership (e.g. Amazon Prime, Walmart+, Costco) Took on debt to purchase a product 7% 11% 11% 12% 16% 32% 47% Sources: Activate analysis, Activate 2022 Consumer Technology & Media Research Study (n = 4,001) Re-commerce is a growing trend addressing consumers seeking sustainability and savings ECOMMERCE & MARKETPLACES
  • 41.
    Intend to buythrough re-commerce marketplaces in the next 12 months 88M U.S. CONSUMERS Intend to continue to buy through re-commerce marketplaces in the next 12 months 93M U.S. CONSUMERS Re-commerce is one of the major growth drivers of eCommerce, with high levels of current and expected consumer usage  40 USAGE OF ONLINE RE-COMMERCE MARKETPLACES1 FOR BUYING IN THE LAST 12 MONTHS, U.S., 2022,% ADULTS AGED 18+ EXAMPLE RE-COMMERCE MARKETPLACES 62% have not bought from an online re-commerce marketplace1 38% have bought from an online re-commerce marketplace1 1. “Online re-commerce marketplaces” are defined as online platforms where previously owned items (e.g. clothing, accessories, or other goods) can be purchased and sold. Sources: Activate analysis, 2022 Activate Re-Commerce Marketplace Consumer Research Study (n = 2,026), U.S. Census Bureau ECOMMERCE & MARKETPLACES
  • 42.
    Livestream shopping saleswill continue to increase as it becomes a popular way for major retailers to engage consumers through eCommerce  41 RETAILERS ARE USING THEIR OWN PLATFORMS, SOCIAL MEDIA PLATFORMS, AND THIRD-PARTY PLATFORMS TO ENGAGE CONSUMERS THROUGH LIVESTREAM SHOPPING MAJOR RETAILERS USING LIVESTREAM SHOPPING 2020 2022E 2026E $55B $17B $5B LIVESTREAM ECOMMERCE SALES, U.S., 2020 VS. 2022E VS. 2026E, BILLIONS USD 2020-2026E CAGR: 49% Sources: Activate analysis, Company sites, eMarketer ECOMMERCE & MARKETPLACES
  • 43.
    2021 2022E 2023E2024E 2025E 2026E $143B $128B $112B $95B $76B $43B 1.8% 1.7% 1.5% 1.3% 1.1% 0.7% 1.8% 1.7% 1.5% 1.3% 1.1% 0.7%  42 EXAMPLE BUY NOW, PAY LATER SERVICES USAGE OF BUY NOW, PAY LATER (BNPL) SERVICES WHEN SHOPPING ONLINE, U.S., 20211 VS. 20222, % ADULTS 18+ BUY NOW, PAY LATER (BNPL) SALES, U.S., 2021-2026E, BILLIONS USD / % TOTAL RETAIL SALES 35% 29% 20211 20222 BNPL Sales as a % of Total Retail Sales 2021-2026E CAGR: 27% 50% of consumers are likely3 to use BNPL in the next 12 months 1. Reflects Sept. 2020-Aug. 2021. 2. Reflects Sept. 2021-Aug. 2022. 3. “Likely” is defined as extremely, very, somewhat, or slightly likely. Sources: Activate analysis, Activate 2021 Consumer Technology & Media Research Study (n = 4,018), Activate 2022 Metaverse & NFT Consumer Research Study (n = 3,078), eMarketer, Statista The growth of Buy Now, Pay Later adoption will fuel eCommerce sales ECOMMERCE & MARKETPLACES
  • 44.
    Household Products (e.g. cleaningsupplies, paper towels) Clothing, Shoes, Accessories (e.g. dresses, sneakers, sunglasses) Beauty & Personal Care (e.g. makeup, deodorant) Groceries (e.g. cereal, eggs) Jewelry (e.g. rings, watches) Furniture (e.g. couch, bed) When consumers are looking for specific products to purchase, Amazon is the go-to online channel to begin their search  43 CHANNELS USED TO START SEARCHES FOR SPECIFIC PRODUCTS ONLINE BY CATEGORY1, U.S., 2022, % ADULTS AGED 18+ WHO HAVE SHOPPED FOR PRODUCTS ONLINE IN EACH CATEGORY IN THE LAST 12 MONTHS 32% 27% 21% 19% 22% 16% 5% 6% 7% 8% 6% 8% 13% 11% 25% 18% 11% 23% 33% 36% 36% 41% 44% 45% 2% 3% 4% 4% 4% 1% 1% 2% 1% 2% 1% 2% 2% 3% 1% 4% 12% 7% 3% 6% 10% 8% Website/app Website/app Website/app Membership warehouse club website/app (e.g. Costco.com, Samsclub.com, BJs.com) Specific brand website/app (e.g. Nike.com, Apple.com) Used/refurbished item marketplace website/app (e.g. eBay, Facebook Marketplace) Social media website/app (e.g. checking an influencer’s Instagram for recommendations) Other (e.g. online search engine, asking a friend) 2% 1% 1. Figures do not sum to 100% due to rounding. Sources: Activate analysis, Activate 2022 Consumer Technology & Media Research Study (n = 4,001) ECOMMERCE & MARKETPLACES
  • 45.
    Amazon Prime drivesloyalty for Amazon as a platform; consumer demand for shopping program memberships goes well beyond Amazon to a broader set of providers  44 1. “Paid shopping program memberships” are defined as paid loyalty program memberships providing members exclusive access to benefits (e.g. Amazon Prime, Walmart+, Uber One). Sources: Activate analysis, Activate 2022 Consumer Technology & Media Research Study (n = 4,001), Activate COVID-19 Consumer Technology & Media Study May 2021 (n = 2,913), Company sites IMPORTANCE OF AMAZON PRIME BENEFITS, U.S., 2021, % ADULTS AGED 18+ WHOSE HOUSEHOLD PAYS FOR AMAZON PRIME INTENT TO CONTINUE PAYING FOR PAID SHOPPING PROGRAM MEMBERSHIPS1 IN THE NEXT 12 MONTHS, U.S., 2022, % ADULTS AGED 18+ WHOSE HOUSEHOLD CURRENTLY PAYS FOR EACH PAID SHOPPING PROGRAM MEMBERSHIP1 41% 45% 48% 48% 54% 58% 62% 74% 79% 81% 87% 93% (Club, Plus) (Inner Circle Membership, Perks Rewards Membership) (from DoorDash, Caviar) (from Bed Bath & Beyond, previously BEYOND+) 96% of Amazon Prime members find at least one benefit provided by the membership extremely or very important (Gold Star, Executive) ECOMMERCE & MARKETPLACES
  • 46.
    When it comesto paid shopping program membership benefits, free delivery is considered the most important  45 TOP MEMBERSHIP BENEFITS1 INFLUENCING SUBSCRIPTION TO A PAID SHOPPING PROGRAM MEMBERSHIP2, U.S., 2022, % ADULTS AGED 18+ WHOSE HOUSEHOLD CURRENTLY PAYS FOR AT LEAST ONE PAID SHOPPING PROGRAM MEMBERSHIP2 4% 7% 7% 8% 8% 9% 13% 14% 24% 33% 36% 66% Free delivery Free returns Special discounts Cash back rewards (e.g. 2% cash back on all your purchases from a store) Ability to earn points that can be redeemed for rewards (e.g. travel, accessories) Physical retail locations near where I live (e.g. Costco store near my home) Exclusive products (i.e. products only available to members) Flexible payment options (i.e. Buy Now, Pay Later) Premium customer service (e.g. dedicated phone line, 24/7 support) Entertainment- related benefits (e.g. Prime Video included with Amazon Prime membership) Faster access to new products (e.g. ability to pre-order products) Ability to use a mobile app for in-store check-out (e.g. Scan and Go) 1. Consumers were asked to select up to 3 top reasons. 2. “Paid shopping program memberships” are defined as paid loyalty program memberships providing members exclusive access to benefits (e.g. Amazon Prime, Walmart+, Uber One). Sources: Activate analysis, Activate 2022 Consumer Technology & Media Research Study (n = 4,001) ECOMMERCE & MARKETPLACES
  • 47.
    2019 2022E 2026E $85B $41B $13B $64B $31B $10B  46 RETAILMEDIA NETWORK ADVERTISING SPEND1, U.S., 2019 VS. 2022E VS. 2026E, BILLIONS USD First-Party Customer Loyalty Data Enables measurement of both offline and online sales, allowing personalized, targeted advertising for brands with the ability to activate against highly customized segments Access to Scaled Marketplace Audiences Provides large, engaged audiences who can be targeted with relevant advertisements through an effective medium (i.e. able to drive shopper behavior as close as possible to point of sale) Accurate Sales Attribution Metrics Measures impact of advertisements through direct links to customer purchases, allowing ongoing view of campaign performance and mid-campaign optimization Partnerships with CTV Publishers Allows upper-funnel brand advertising, facilitated through partnerships providing access to CTV inventory (e.g. Kroger & Roku, Target & Disney) EMERGING RETAIL MEDIA NETWORKS Rest of Web 74% 46% 2019-2022E CAGR: 2022E-2026E CAGR: 35% 19% 20% 38% 46% 18% $3B $7B $0.5B $3B $13B $8B FEATURES DRIVING THE VALUE PROPOSITION OF RETAIL MEDIA NETWORKS 1. Includes digital advertising appearing on websites or apps engaged in retail or commerce, bought through a retailer’s media network or demand-side platform. Figures do not sum due to rounding. Sources: Activate analysis, Company filings, Company press releases, Company sites, Dunnhumby, eMarketer, Forrester JOURNEY ADS ACTIVATE FORECAST Going forward, retail media networks will be increasingly instrumental in leveraging first-party data to provide retailers with greater personalization for customer experience and consumer targeting ECOMMERCE & MARKETPLACES
  • 48.
    www.activate.com  47 CONTENTS PAGE $420BGlobal Technology and Media Growth Dollars Up for Grabs 4 Consumer Technology and Media Time and Attention 9 Super Users: The Critical Segment for Technology and Media Companies 15 eCommerce and Marketplaces: Growth will Continue Across Categories With Major Consumer Trends Serving as Tailwinds 29 Video: Streaming and Social Drive Growth 47 Gaming and Esports: A Mainstream Behavior and Precursor to The Metaverse 78 NFTs: Past the Hype Cycle, Towards Tangible Use Cases 95 Metaverse: Time for Practical Applications 108 Audio: Digital Audio Will Drive More Consumer Time and Spend 138 Sports and Sports Betting: Younger Next-Gen Sports Fans Drive Growth 152 Digital Fitness: Consumer Adoption Will Continue to Grow 167
  • 49.
    Overall time spentwith video will remain flat through 2026, though digital video will continue to grow at the expense of traditional television  48 AVERAGE DAILY VIDEO TIME SPENT PER ADULT AGED 18+ BY TYPE1, U.S., 2019-2022E VS. 2026E, HOURS:MINUTES 2022E-2026E CAGR: ACTIVATE FORECAST 2019 2020 2021 2022E 2026E 3:10 2:47 2:29 1:53 5:03 5:14 5:28 3:10 2:18 Television3 Digital Video2 5:17 2:11 3:04 2019-2022E CAGR: 5:17 2:37 2:39 1.4% 11.7% -5.8% -0.2% 4.0% -4.8% VIDEO 1. Figures do not sum due to rounding. 2. “Digital video” is defined as video watched on a mobile phone, tablet, desktop/ laptop, or Connected TV. Connected TVs are TV sets that can connect to the internet through built-in internet capabilities (i.e. Smart TVs) or through another device such as a streaming device (e.g. Amazon Fire TV, Apple TV, Google Chromecast, Roku), game console, or Blu-ray player. Does not include social video. 3. “Television” is defined as traditional live and time- shifted (e.g. DVR) television viewing. Sources: Activate analysis, eMarketer, GWI, Nielsen, Pew Research Center, U.S. Bureau of Labor Statistics
  • 50.
    Increasingly, Connected TVswill play a larger role in digital video consumption; nearly all U.S. households will have a Connected TV by 2026  49 1. “Connected TVs” are defined as TV sets that can connect to the internet through built-in internet capabilities (i.e. Smart TVs) or through another device such as a streaming device (e.g. Amazon Fire TV, Apple TV, Google Chromecast, Roku), gaming console, or Blu-ray player. 2. ”Connected TV households” are defined as households for which at least one person of any age uses the internet through a Connected TV at least once per month. 3. “Penetration” is defined as the share of Connected TV monthly users of any age who use the internet through the listed device at least once per month. Listed devices are not mutually exclusive. 4. “Connected TV monthly users” are defined as consumers of any age who use the internet through a Connected TV at least once per month. Sources: Activate analysis, eMarketer, Leichtman Research Group CONNECTED TV HOUSEHOLDS1,2, U.S., 2019-2026E, MILLIONS HOUSEHOLDS PENETRATION3 BY SELECT CONNECTED TV DEVICES1, U.S., 2019-2022E, % CONNECTED TV MONTHLY USERS4 2019 2020 2021 2022E 2023E 2024E 2025E 2026E 112M 108M 103M 95M 121M 119M 117M 115M 112M 3.5% 2019-2026E CAGR: 2019 2020 2021 2022E 41% 35% 35% 14% 13% 14% Connected Gaming Consoles 2019-2022E PENETRATION CHANGE: Blu-ray Players 53% 35% 46% 13% 13% 10% Smart TVs 74% 58% +12pp +11pp 0pp -1pp -4pp +16pp 0pp VIDEO
  • 51.
    1M 2M 4M 5M 10M 11M 12M 12M 13M 23M 25M 27M 29M 37M 39M 40M 41M 42M 46M 66M 91M 103M 126M 162M 229M Digital video consumptionis taking place across a wide range of platforms  50 ESTIMATED NUMBER OF SUBSCRIBERS/USERS/WATCHERS BY SELECT VIDEO STREAMING SERVICES, U.S., Q2 2022, MILLIONS SUBSCRIBERS / MONTHLY ACTIVE USERS / MONTHLY ACTIVE VIDEO WATCHERS 3 4 Paid video streaming subscription service [SVOD] (Millions subscribers) Free video streaming service with ads [AVOD, FAST] (Millions monthly active users) Video streaming service with a paid subscription tier and a free tier with ads (Millions monthly active users) Virtual Pay TV service1 [vMVPD] (Millions subscribers) Social / Web Video (Millions monthly active video watchers) 3 2 ( i n c l u d i n g P r i m e V i d e o ) 3 3 3 5 3 3 3 3 3 3 3 6 3 3 3 3 Note: Figures reflect latest publicly disclosed statistics as of Oct. 2022, unless noted otherwise. 1. “Virtual Pay TV service” is defined as a service that delivers TV through the internet without a set-top box. 2. Reflects estimate of total Prime users. 3. Reflects estimate. 4. Reflects estimate of Roku monthly active accounts in North America viewing The Roku Channel. 5. Reflects monthly active accounts as of the end of Q3 2022. Includes 15M paid subscribers. 6. Includes Sling Blue and Orange. Sources: Activate analysis, Activate 2022 Consumer Technology & Media Research Study (n = 4,001), CNBC, Company filings, Company press releases, Company sites, eMarketer, Entertainment Strategy Guy, MoffettNathanson, Morgan Stanley VIDEO
  • 52.
    Major streaming platformswill rely on international markets to drive subscriber growth  51 1. Includes OTT and linear subscribers. Sources: Activate analysis, Activate 2022 Consumer Technology & Media Research Study (n = 4,001), Bank of America, Company filings, Company press releases, Company sites, Eikon, eMarketer, Entertainment Strategy Guy, JP Morgan, MoffettNathanson, Morgan Stanley, S&P Global, Wells Fargo PAID STREAMING AND AD-SUPPORTED FREE STREAMING SUBSCRIBERS / MONTHLY ACTIVE USERS BY REGION, GLOBAL, 2022E VS. 2026E, MILLIONS SUBSCRIBERS / MONTHLY ACTIVE USERS 2022E 2026E % Total U.S. Subscribers / Monthly Active Users % Total International Subscribers / Monthly Active Users INTERNATIONAL SHARE OF INCREMENTAL NEW SUBSCRIBERS / MONTHLY ACTIVE USERS: U.S. INTERNATIONAL 2022E 2026E 2022E 2026E 2022E 2026E 71% 74% 72% 78% 1 2022E 2026E 2022E 2026E 29% 26% 28% 22% 56% 43% 44% 57% 228M 269M 159M 264M 55% 45% 52% 48% 51M 79M 78M 114M 53M 65M 48% 52% 59% 41% 81% 19% 23% 77% 90% 85% 90% 64% 82% 38% PAID VIDEO STREAMING AD-SUPPORTED FREE VIDEO STREAMING VIDEO 137M 99M
  • 53.
    By 2026, theaverage paid video streaming subscriber will have 6.3 subscriptions  52 NUMBER OF PAID VIDEO STREAMING SUBSCRIPTIONS OWNED PER PAYING SUBSCRIBER1, U.S., 2016-2022, % PAID VIDEO STREAMING SUBSCRIPTION OWNERS AGED 18+ 1. Figures do not sum to 100% due to rounding. Includes both ad-supported and ad-free paid video streaming subscriptions. Sources: Activate analysis, Activate 2016 Consumer Technology & Media Research Study (n = 4,000), Activate 2017 Consumer Technology & Media Research Study (n = 4,047), Activate 2018 Consumer Technology & Media Research Study (n = 4,000), Activate 2019 Consumer Technology & Media Research Study (n = 4,006), Activate 2020 Consumer Technology & Media Research Study (n = 4,003), Activate 2021 Consumer Technology & Media Research Study (n = 4,018), Activate 2021 Consumer Video Research Study (n = 2,014), Activate 2022 Consumer Technology & Media Research Study (n = 4,001), Omdia, PricewaterhouseCoopers, U.S. Department of Labor (+20%) (+44%) (+30%) (+15%) (+9%) 2016 2017 2018 2019 2020 2021 2022 67% 65% 57% 50% 32% 21% 13% 16% 17% 21% 28% 31% 32% 31% 17% 18% 22% 22% 37% 47% 56% 1 Service 2 Services 3.1 3+ Services 2.2 1.8 4.1 1.6 ACTIVATE FORECAST We forecast that the average paid video streaming subscriber will own 6.3 subscriptions by 2026 4.4 (+7%) 4.7 AVERAGE # PAID VIDEO STREAMING SUBSCRIPTIONS OWNED PER SUBSCRIBER VIDEO
  • 54.
    All 2021 WarnerBros. movies were made available to stream through HBO Max for 31 days on the same day as their theatrical releases Cost: Included with ad-free subscription ($14.99/month) HBO MAX / WARNER BROS. 2021 PREMIERES: Select Disney movies were made available for purchase through Disney+ Premier Access on the same day as their theatrical releases Cost: $29.99/movie plus price of Disney+ ($7.99/month) DISNEY+ PREMIER ACCESS 2021 PREMIERES: During the pandemic, direct-to-streaming strategies from HBO Max and Disney+ led to subscriber growth and retention  53 1. “Newly released movies” are defined as movies that are not yet widely available (i.e. only available in theaters or on Disney+ Premier Access / HBO Max). 2. If multiple newly released movies were viewed on Disney+ or HBO Max, answers for each movie/service were counted separately. 3. Viewings by adults aged 18+. Sources: Activate analysis, Activate 2021 Consumer Video Research Study (n = 2,014) MOVIE RELEASE STRATEGIES BY HBO MAX AND DISNEY+, U.S., 2021 28% 14% 15% 16% 57% 70% Definitely/likely would have watched in theaters Not sure if would have watched in theaters IMPACT OF ACCESS TO NEWLY RELEASED MOVIES1 FOR SELECT SUBSCRIPTIONS, U.S., 2021, % ADULTS AGED 18+ WHO VIEWED A NEWLY RELEASED MOVIE1 ON DISNEY+ PREMIER ACCESS OR HBO MAX2 Had the movie not been available through Disney+ Premier Access or HBO Max and assuming personal health due to COVID-19 was not a concern… Of those who watched newly released movies1 through Disney+ Premier Access or HBO Max, access to these movies influenced… 80% to subscribe to or keep these paid video streaming subscriptions Definitely/likely would not have watched in theaters NEWLY RELEASED MOVIE1 VIEWINGS THROUGH: LIKELIHOOD OF HAVING GONE TO A THEATER TO WATCH NEWLY RELEASED MOVIES1 VIEWED ON EACH SERVICE, U.S., 2021, % VIEWINGS OF NEWLY RELEASED MOVIES1 ON DISNEY+ PREMIER ACCESS OR HBO MAX2,3 VIDEO
  • 55.
    In 2022, majorfilm studios have returned to giving films an exclusive theatrical run but now have greater flexibility over theatrical window length  54 Sources: Activate analysis, Box Office Mojo, Company sites, Deadline, S&P Global, Variety MOVIE RELEASE STRATEGIES BY SELECT MAJOR FILM STUDIOS, U.S., 2022 ADHERENCE TO ~45-DAY THEATRICAL WINDOW: Tentpole films are given at least a 45-day theatrical window before they appear on streaming platforms Jackass Forever was released exclusively in theaters on 2/4/22 and arrived on Paramount+ 45 days later Sonic the Hedgehog 2 was released exclusively in theaters on 4/8/22 and arrived on Paramount+ 45 days later The Batman was released exclusively in theaters on 3/4/22 and arrived on HBO Max 45 days later DC League of Super-Pets was released exclusively in theaters on 7/29/22 and arrived on HBO Max 45 days later Lightyear was released exclusively in theaters on 6/17/22 and arrived on Disney+ 47 days later FURTHER FLEXIBILITY / “CASE-BY-CASE”: Some films are receiving longer theatrical windows before reaching streaming platforms Top Gun: Maverick was released exclusively in theaters on 5/27/22, and the film’s Paramount+ arrival date has yet to be announced; it is the top- grossing film of 2022 so far (~$715M in U.S. box office revenue as of 10/13/22) Elvis was released exclusively in theaters on 6/24/22 and arrived on HBO Max 70 days later; the film grossed over $150M in U.S. box office revenue Thor: Love and Thunder was released exclusively in theaters on 7/8/22 and arrived on Disney+ over 60 days later; the film grossed over $340M in U.S. box office revenue 2022 STUDIO/EXHIBITOR DEAL EXAMPLES STUDIO EXHIBITORS DEAL DETAILS Greater than $50M opening weekend box office gross: 31-day exclusive theatrical window Less than $50M opening weekend box office gross: 17-day exclusive theatrical window; Universal then has the option to release the film digitally 45-day exclusive theatrical window, followed by digital release VIDEO
  • 56.
    There is asizable audience who prefers to watch newly released movies in theaters, validating movie studios’ renewed focus on theatrical releases  55 Sources: Activate analysis, Activate 2022 Metaverse & NFT Consumer Research Study (n = 3,078) 40% would prefer to watch newly released movies at a movie theater 18% would not have a preference 42% would prefer to watch newly released movies online 50% expect to see a movie in theaters at least once per month PREFERENCE FOR WATCHING NEWLY RELEASED MOVIES, U.S., 2022, % ADULTS AGED 18+ VIDEO
  • 57.
    Many top performingfilms on streaming also drove substantial theatrical revenues, suggesting that a theatrical window does not cannibalize engagement on streaming platforms  56 1. Based on viewership during debut week on paid streaming services (as determined by Nielsen Streaming Content Ratings). SVOD services measured include Netflix, Disney+, Amazon Prime Video, HBO Max, and Hulu. Reflects films streamed by persons aged 2+. Excludes movies released via Disney+ Premier Access. Sources: Activate analysis, Box Office Mojo, Entertainment Strategy Guy, Nielsen Streaming Content Ratings RELEASE MODEL: Direct-to-streaming Theatrical-exclusive window Domestic theatrical gross TOTAL HOURS WATCHED IN DEBUT WEEK ON STREAMING1, U.S., JAN. 2021-SEPT. 2022, MILLIONS HOURS $343 $164 $411 $96 $118 $162 $224 $148 $73 Many of the top performers on streaming also drove revenues through theatrical releases: $343M $164M $224M $162M $118M $96M $411M $148M $73M RED NOTICE TURNING RED LUCA DON’T LOOK UP THOR: LOVE AND THUNDER THE GRAY MAN ETERNALS DR. STRANGE 2 ENCANTO THE ADAM PROJECT LIGHTYEAR SING 2 HUSTLE THE HARDER THEY FALL SHANG-CHI UNCHARTERED PINOCCHIO MORBIUS CHIP ’N DALE: RESCUE RANGERS THE ICE AGE ADVENTURES OF BUCK WILD 10.2M 16.9M 17.9M 21.1M 21.8M 22.9M 23.8M 24.0M 25.0M 5.8M 9.9M 15.5M 19.9M 20.3M 22.7M 24.0M 25.9M 26.2M 28.4M 30.7M VIDEO
  • 58.
    Streaming content spendon original series and movies is growing to drive increased consumption  57 STREAMING SERVICE CONTENT SPEND BY COMPANY1, GLOBAL, 2021 VS. 2026E, BILLIONS USD 1. Represents cash content spend. Sources: Activate analysis, MoffettNathanson, Wells Fargo $6.6B $6.6B $9.7B $11.2B $18.4B $19.8B $21.1B $1.5B $1.3B $6.0B $2.1B $9.1B $6.3B $17.5B 2021 2026E 2021-2026E CAGR: SELECT MAJOR CONTENT INVESTMENTS 4% 26% 15% 40% 10% 38% 34% VIDEO
  • 59.
     58 Movie consumption onstreaming is driven by new releases — of the top 30 movies streamed in 2022 so far, only three films were released before 2021 2021 | PG | 23.8B 2022 | PG | 8.7B 2021 | PG | 7.2B 2022 | PG-13 | 4.8B 2022 | PG-13 | 4.0B 2016 | PG | 3.8B 2021 | R | 3.7B 2022 | PG-13 | 2.9B 2022 | PG | 2.8B 2022 | PG-13 | 2.8B 2021 | PG-13 | 2.6B 2022 | R | 2.6B 2022 | PG-13 | 2.5B 2022 | R | 2.3B 2022 | R | 2.3B 2022 | PG | 2.2B 2022 | PG-13 | 2.1B 2022 | R | 2.1B 2022 | TV-MA | 2.0B 2010 | PG | 2.0B 2022 | TV-14 | 1.9B 2021 | PG-13 | 1.8B 2022 | PG | 1.4B 2022 | TV-MA | 1.4B Prey 2022 | PG | 1.3B 1986 | PG | 1.3B 2022 | R | 1.3B 2022 | PG | 1.2B 2022 | PG-13 | 1.2B 2022 | PG-13 | 1.1B XXXX | XX | X.XB LEGEND RATING BILLIONS MINUTES RELEASE YEAR = Disney+ = Netflix = Amazon Prime Video = Hulu = HBO Max Only three movies in the Top 301 were released before 2021 TOP 30 MOST STREAMED FILMS ON PAID VIDEO STREAMING SUBSCRIPTION SERVICES1, U.S., DEC. 2021-SEPT. 20222, BILLIONS MINUTES STREAMED 1. Based on aggregate viewership of weekly top 10 most viewed films across select paid video streaming subscription services (determined by Nielsen Streaming Content Ratings). Services measured include Amazon Prime Video, Disney+, HBO Max, Hulu, and Netflix. Includes films streamed by persons aged 2+. 2. Period spanning Dec. 27, 2021 to Sept. 18, 2022. Sources: Activate analysis, Nielsen Streaming Content Ratings ACTIVATE DATA PARTNER VIDEO
  • 60.
    1. Based onaggregate viewership of weekly top 10 most viewed series across select paid video streaming subscription services (determined by Nielsen Streaming Content Ratings). Services measured include Amazon Prime Video, Disney+, HBO Max, Hulu, and Netflix. Includes series streamed by persons aged 2+. 2. Period spanning Dec. 27, 2021 to Sept. 18, 2022. Sources: Activate analysis, Nielsen Streaming Content Ratings  59 Original and acquired series are critical to drive viewing and engagement 60% 40% ORIGINAL = Disney+ = Netflix = Amazon Prime Video = HBO Max X.X X.X ACQUIRED ORIGINAL VS. ACQUIRED VIEWING SHARE OF TOP 30 SERIES STREAMED ON PAID STREAMING SUBSCRIPTION SERVICES1, U.S., DEC. 2021-SEP. 20222,% TOTAL MINUTES STREAMED1 LEGEND 46.1B 27.8B 27.4B 26.1B 17.3B 16.7B 10.8B 10.8B 10.6B 10.3B 10.0B 9.7B 9.2B 9.0B 7.9B 6.8B 6.7B 6.6B 5.9B 5.8B 5.6B 5.6B 5.5B 5.0B 4.8B 4.6B 4.6B 4.6B 4.5B 4.3B TOP 30 MOST STREAMED SERIES ON PAID VIDEO STREAMING SUBSCRIPTION SERVICES1, U.S., DEC. 2021-SEPT. 20222, BILLIONS MINUTES STREAMED ACTIVATE DATA PARTNER VIDEO
  • 61.
     60 As services havebecome more established and increased in scale, they have raised prices to drive monetization 1 2 3 4 5 6 7 8 9 10 11 12 1 2 3 4 5 6 7 8 9 10 11 12 1 2 3 4 5 6 7 8 9 10 2020 2021 2022 1. As of Oct. 1, 2022. 2. Reported launch date: Nov. 3, 2022. Cost for Netflix Basic with ads: $6.99. 3. Reported launch date: Dec. 8, 2022. Cost for Disney+ with ads: $7.99. 4. By summer 2023, HBO Max and Discovery+ expected to merge into a new streaming service; name, exact launch date, and subscription price have not been announced. Sources: Activate analysis, Company press releases, Company sites MONTHLY STANDARD SUBSCRIPTION PRICES OF SELECT PAID VIDEO STREAMING SERVICES, U.S., JAN. 2020-OCT. 20221, USD Premium Standard (no ads)4 (no ads) (ads)4 (ads) (ads) $15.99 $12.99 $11.99 $8.99 $6.99 $4.99 $5.99 $14.99 $9.99 $9.99 $6.99 $4.99 $4.99 ↑$17.99 ↑$19.99 ↑$13.99 ↑$15.49 ↑$12.99 ↑$9.99 ↑$9.99 ↑$6.99 ↑$5.99 ↑$6.99 ↑$7.99 (no ads) Basic (no ads) FUTURE AD-TIER SERVICE LAUNCHES (ads)2 CURRENT PRICE PRICE ANNOUNCED TO INCREASE TO $10.99 IN DEC. 2022 $19.99 $15.49 $14.99 $14.99 $4.99 $4.99 $6.99 $9.99 $9.99 $7.99 (no ads) $9.99 $7.99 $9.99 (ads)4 (no ads)4 ↑$7.99 ↑$14.99 (ads)3 VIDEO
  • 62.
    POTENTIAL SERVICES FORBUNDLING NOT EXHAUSTIVE TODAY: MEDIA COMPANIES BUNDLE THEIR OWN VIDEO STREAMING SERVICES TO DRIVE SUBSCRIPTION GROWTH NOT EXHAUSTIVE MEDIA COMPANY BUNDLES FUTURE: BUNDLING WILL CONTINUE AND EXPAND TO INCLUDE VIDEO STREAMING SERVICES ACROSS PARENT COMPANIES POTENTIAL SERVICES FOR BUNDLING NOT EXHAUSTIVE As individual streaming service prices increase, consumers will increasingly turn to bundles offering higher value  61 1. Not exhaustive. 2. Prices reflect the ad-supported monthly service tiers when applicable. Prices as of Oct. 23, 2022. 3. Price announced to increase to $14.99 on Dec. 8, 2022. 4. AMC+ also includes additional content from AMC, BBC America, IFC, and Sundance TV. Sources: Activate analysis, Company press releases, Company sites Price2: $11.99($15.98 value) Price2: $13.993 ($25.97 value) Price2: $8.99($18.97 value) 4 VIDEO
  • 63.
    Streaming players havealso signaled that they will crack down on password sharing, which could convert non-paying borrowers to paying subscribers  62 EXPECTED RESPONSE TO PASSWORD-SHARING CRACKDOWN ON PAID STREAMING SUBSCRIPTION BORROWER BEHAVIOR1,2, U.S., 2022, % PAID STREAMING SUBSCRIPTION BORROWERS1 35% 26% 24% 35% 37% 41% 30% 36% 36% I would no longer use I would subscribe at full price I would subscribe but only at a reduced price AT&T: HBO Max has built-in features to mitigate password sharing | April 21, 2022 | Fierce Video “AT&T incorporated features into HBO Max to crack down on password sharing and actions considered as ‘rampant abuse’ of the streaming service.” STREAMING PLAYERS ARE TAKING MEASURES TO MINIMIZE PASSWORD SHARING Disney+ may be next to crack down on password sharing | May 5, 2022 | Protocol “Disney recently sent out a questionnaire to subscribers in Spain, asking them why they are sharing their Disney+ passwords with people outside of their own household.” Netflix unveils “add a home” feature to curb password sharing | July 19, 2022 | Fierce Video “Starting next month, Netflix subscribers in select Latin American countries will be able to purchase up to a certain number of additional homes, depending on the subscription tier.” IF I WERE NO LONGER ABLE TO USE/ACCESS THE FOLLOWING SERVICES WITHOUT PAYING FOR MY OWN SUBSCRIPTION… 1. “Paid streaming subscription borrowers” are defined as adults aged 18+ who use a subscription paid for by someone outside of the household. 2. Figures do not sum to 100% due to rounding. Sources: Activate analysis, Activate 2022 Consumer Technology & Media Research Study (n = 4,001), Fierce Video, Protocol VIDEO
  • 64.
    EXAMPLES OF AD-SUPPORTEDFREE STREAMING SERVICES INVESTING IN ORIGINAL CONTENT Weird: The Al Yankovic Story | Released Sept. 8, 2022 Tubi is streaming 27,000 hours of Halloween-related content throughout October 2022, including 6 brand-new Tubi Originals - A music biopic parody of Weird Al Yankovic, starring Daniel Radcliffe - A 2022 Toronto International Film Festival’s People's Choice winner in the Midnight Madness Award category Older episodes from TV shows still running Episodes from TV shows no longer running Movies that first premiered in last 5 years Movies that first premiered over 5 years ago To capture audience time, ad-supported free streaming services have been investing in original programming and deepening their library of content  63 USE OF FREE VIDEO STREAMING SERVICES WITH ADS1 BY PAID VIDEO STREAMING SERVICE SUBSCRIBERS, U.S., 2022, % PAID VIDEO WATCHERS2 CONTENT TYPES FREQUENTLY3 WATCHED ON SELECT AD-SUPPORTED FREE STREAMING SERVICES4, U.S., 2022, % AD-SUPPORTED FREE STREAMING USERS OF SELECT SERVICES5 50% of paid video streaming service subscribers use free video streaming services with ads 50% of paid video streaming service subscribers do not use free video streaming services with ads 65% 59% 61% 57% 1. YouTube and Twitch excluded due to their focus on user-generated video. 2. “Paid video watchers” are defined as adults aged 18+ who use at least one paid video streaming subscription service at least once per month. 3. “Frequently” is defined as a 4 or 5 on a scale of 1-5, where 5 represents “I frequently watch this type of content on this service” and 1 represents “I never watch this type of content on this service.” 4. Includes Pluto TV, Tubi, and XUMO. 5. “Ad-supported free streaming users” are defined as adults aged 18+ who use either Pluto TV, Tubi, or XUMO to watch video. Sources: Activate analysis, Activate 2022 Consumer Technology & Media Research Study (n = 4,001), Company press releases, Company sites VIDEO
  • 65.
    Paid video streamingservices are launching ad-supported tiers to better align with consumer preferences  64 EXPECTED RESPONSE TO PAID STREAMING SUBSCRIPTION SERVICES LAUNCHING LOWER-PRICED PLANS WITH ADS1, U.S., 2022, % CURRENT DISNEY+/ NETFLIX USERS AGED 18+ AD-SUPPORTED SUBSCRIPTIONS AS A SHARE OF TOTAL SUBSCRIPTIONS BY SERVICE, U.S., JUNE 2022, % SUBSCRIBERS FOR EACH SERVICE3 54% 55% 23% 23% 23% 21% If Disney+/Netflix offered a new lower-priced plan with ads… Would prefer plan without ads that has a higher price No preference Would prefer plan with ads that has a lower price Ad-Supported Tier Launch Date: December 8, 20222 November 3, 20222 74% 58% 51% 43% 12% 1. Figures do not sum to 100% due to rounding. 2. Reported launch date. 3. Does not include sign-ups via Pay TV / Telco distribution or select bundles. Sources: Activate analysis, Activate 2022 Consumer Technology & Media Research Study (n = 4,001), Antenna, Company sites HBO Max launched with only an ad-free offering on May 27, 2020 while its ad-supported tier was not offered until June 2, 2021; the other streaming platforms shown launched ad-free and ad-supported tiers at similar times, which increased the uptake of their ad-supported tiers VIDEO
  • 66.
    Ad-supported HBO Max’s experiencedemonstrates that adding an ad-supported tier can be an effective way to drive customer acquisition  65 HBO MAX GROSS SUBSCRIBER ADDITIONS1 BY TIER, U.S., JUNE 2021-JUNE 2022, % GROSS SUBSCRIBER ADDITIONS1 1. “Gross subscriber additions” are defined as total new subscribers in each month, including both newly signed up paid users and users who converted from a free trial. Sources: Activate analysis, Antenna Ad-free 2021 2022 June July Aug. Sept. Oct. Nov. Dec. Jan. Feb. Mar. Apr. May June 31% 27% 26% 26% 30% 31% 25% 20% 19% 11% 20% 16% 15% 69% 73% 74% 74% 70% 69% 75% 80% 81% 89% 80% 84% 85% VIDEO
  • 67.
    PAID FREE + PAID 2022E-2026E CAGR: Domesticadvertising revenues for the major streaming services will more than double to $16B between 2022 and 2026  66 ADVERTISING REVENUES FOR SELECT AD-SUPPORTED SERVICES1, U.S., 2022E VS. 2026E, BILLIONS USD 1. Figures do not sum due to rounding. 2. Combined revenues due to expected merger in 2023. 3. Ad-supported tiers launching in Q4 2022. 4. Indicates 2023E-2026E CAGR. Sources: Activate analysis, MoffettNathanson, Morgan Stanley, S&P Global, Standard Media Index $3.4B $0.4B $1.2B $1.0B $5.0B $0.8B $1.1B $1.4B $1.7B $2.7B $1.5B $1.1B $7.6B $16.6B 3 3 2022E 2026E 21% 23% 39%3,4 25%3,4 22% 22% 10% 22% FREE $1.3B 17% 12% $0.6B $0.6B 2 $0.6B VIDEO
  • 68.
    Consumers will growtheir consumption of social video, reaching almost an hour per day by 2026  67 ACTIVATE FORECAST 2:11 2019 2020 2021 2022E 2026E 0:59 0:47 0:43 0:35 0:24 Sources: Activate analysis, eMarketer, GWI, Nielsen, Pew Research Center, U.S. Bureau of Labor Statistics 2019-2022E CAGR: 26.1% 2022E-2026E CAGR: 5.6% AVERAGE DAILY TIME SPENT WITH SOCIAL VIDEO PER ADULT AGED 18+, U.S., 2019-2022E VS. 2026E, HOURS:MINUTES VIDEO
  • 69.
    Social platforms willcontinue to grow around the world  68 SOCIAL PLATFORM MONTHLY ACTIVE USERS BY REGION, GLOBAL, 2022E VS. 2026E, BILLIONS MONTHLY ACTIVE USERS Sources: Activate analysis, Activate 2022 Consumer Technology & Media Research Study (n = 4,001), Company filings, Company press releases, Company sites, eMarketer 2022E 2026E U.S. Share of Monthly Active Users International Share of Monthly Active Users 2022E 2026E 2022E 2026E 1.5B 2.0B 1.3B 1.5B 2.1B 2.4B 6% 94% 95% 5% 90% 90% 10% 10% 11% 10% 89% 90% SOCIAL 97% 92% 93% INTERNATIONAL SHARE OF MONTHLY ACTIVE USERS: U.S. INTERNATIONAL VIDEO
  • 70.
    Social video engagementis driven by influencers (1/2)  69 SHARE OF TIKTOK VIDEO VIEWS BY CREATOR CATEGORY, U.S., YTD JULY 2022, % VIEWS SHARE OF YOUTUBE VIDEO VIEWS BY CREATOR CATEGORY3, U.S., YTD JULY 2022, % VIEWS TOP TEN YOUTUBE INFLUENCERS4, U.S., JULY 2022 LeoNata Family Family Content Creators Alan Chikin Chow Comedy Content Creator XO TEAM Creative Community Omar Raja Sports Commentator LankyBox Gamers & Reaction Video Creators That Little Puff Cat Chef Filaretiki Family Content Creators NichLMAO Prankster & Challenge Completer Marta and Rustam Internet Couple Zhong Prankster & Challenge Completer 91% Influencer Brand and aggregator2 Media company 4% 5% 91% Influencer Brand and aggregator2 Media company 2% 6% TOP TEN TIKTOK INFLUENCERS1, U.S., JULY 2022 Kylie Jenner Reality TV Star & Internet Personality Charli D’Amelio Dancer & Lifestyle Content Creator Bader Al Safar ASMR Creator & Food Explorer KEEMOKAZI Lifestyle & Comedy Content Creator XO TEAM Creative Community Brooke Monk Dancer & Lip-Syncer JoJo Siwa Dancer & Actress That Little Puff Cat Chef Katy Vine Model & Comedy Content Creator Abbie Herbert Parenting Content Creator 1. Rank based on platform viewing metrics. 2. “Brands” are defined as organizations that sell primarily non- media goods or services, and “aggregators” are defined as unverified creators who mainly repost content. 3. Figures do not sum to 100% due to rounding. 4. Rank based on total 30-second views. Sources: Activate analysis, Tubular Labs ACTIVATE DATA PARTNER VIDEO
  • 71.
    1. Rank basedon total 30-second views in July 2022. 2. “Brands” are defined as organizations that sell primarily non-media goods or services, and “aggregators” are defined as unverified creators who mainly repost content. 3. Rank based on total engagements in July 2022. Sources: Activate analysis, Tubular Labs Social video engagement is driven by influencers (2/2)  70 SHARE OF FACEBOOK VIDEO VIEWS BY CREATOR CATEGORY, U.S., YTD JULY 2022, % VIEWS SHARE OF ENGAGEMENTS FOR INSTAGRAM VIDEOS BY CREATOR CATEGORY, U.S., YTD JULY 2022, % ENGAGEMENTS TOP TEN FACEBOOK INFLUENCERS1,U.S., JULY 2022 Sean Bridon Comedy Content Creator Rick Lax Magician Justin Flom Magician Jibrizy Magician & Comedy Content Creator Alberto Stylee Reggaeton Singer Khizar Omer Comedy Content Creator PaulVuTV Magician Yanni🍴 Foody Fetish Food Content Creator Patrick Cloud Music Artist & Lifestyle Content Creator Marcus Dobre Prankster & Comedy Creator TOP TEN INSTAGRAM INFLUENCERS3, U.S., JULY 2022 Snoop Dogg Rapper & Internet Personality Itzy K-Pop Girl Group Krutika Lifestyle Content Creator Dwayne Johnson Movie Star DJ Akademiks Hip-Hop Personality Sofi Manassyan Dancer & Actress Kristy Sarah Lifestyle Content Creator DJ Khaled Hip-Hop Personality Diljit Dosanjh Music Artist & Actor V K-Pop Superstar 60% Influencer Brand and aggregator2 Media company 30% 10% 83% Influencer Brand and aggregator2 Media company 12% 5% ACTIVATE DATA PARTNER VIDEO
  • 72.
    PLATFORM SHORT-FORM VIDEO PRODUCT U.S.LAUNCH DATE REELS August 2020 SPOTLIGHT November 2020 SHORTS March 2021 REELS September 2021 TikTok’s rise has inspired other social platforms to build short-form video products and provides a potential launch pad for new talent to enter traditional long-form entertainment, though few have yet to successfully make the leap  71 SELECT SHORT-FORM VIDEO PRODUCTS LAUNCHED BY MAJOR SOCIAL PLATFORMS THERE ARE LIMITED EXAMPLES OF TIKTOK STARS SUCCESSFULLY TRANSITIONING INTO LONG-FORM MEDIA TikTok Star: Addison Rae Release date: August 25, 2021 Description: Film starring TikTok star Addison Rae TikTok Stars: Charli D’Amelio, Dixie D’Amelio Release date: September 3, 2021 (Season 1) Description: Reality show following the D’Amelio family; currently in Season 2 88.7M Followers 148.3M Followers 57.5M Followers 1. TikTok followers as of Oct. 24, 2022. Sources: Activate analysis, Company press releases, Company sites, Fierce Video, The Split 1 1 1 SUCCESS STORIES VIDEO
  • 73.
    Video consumption isdriving innovation in advertising: TikTok is becoming a space for search-based ads, and streaming platforms have begun launching interactive ads  72 Peacock has been trialing new forms of interactive advertising on its video streaming platform to make it easier for consumers to interact with and purchase advertised products Amazon Freevee is beta testing a seven-second, full-screen Welcome Screen for customers launching the app on Fire TV; this will allow brands to greet audiences with their creative content in place of the standard loading screen ~40% of Gen Z prefers TikTok for online searches STREAMING PLATFORMS ARE INTRODUCING MORE INTERACTIVE AD FORMATS GEN Z IS INCREASINGLY USING TIKTOK AS ITS SEARCH ENGINE OF CHOICE Get it now with gopuff Sources: Activate analysis, Company press releases, Company sites, Fierce Video, Pew Research Center, The Split In September 2022, TikTok announced that the maximum length of its video descriptions would increase from 300 to 2,200 characters, making space for advertisers to post their information and making it easier to find advertiser content in search results VIDEO
  • 74.
    30.2% Despite the declinein the Pay TV universe and the growth in streaming, Pay TV still commands a significant share of value in the video ecosystem  73 1. Figures do not sum due to rounding. 2. “EST” stands for electronic sell-through; includes spend on online video on-demand transactions (e.g. purchases and rentals). 3. Includes spend on paid video streaming subscriptions. 4. Includes in-stream video advertising (e.g. pre-roll, mid-roll, post-roll) on digital video content, including on social networks and out-stream video advertising (e.g. native, in-feed, in-article, in-banner, interstitial). 5. Includes advertising on broadcast TV and Pay TV. 6. “Pay TV” includes traditional Pay TV (i.e. TV delivered through a set-top box) and virtual Pay TV (i.e. TV delivered through the internet without a set- top box). Sources: Activate analysis, BMO Capital Markets, eMarketer, MoffettNathanson, Omdia, PricewaterhouseCoopers, Wells Fargo ACTIVATE FORECAST 2019-2023E CAGR: $91B $76B $60B $41B $32B $69B $70B $68B $64B $70B $78B $83B $88B $91B $94B Pay TV6 Subscriptions TV Advertising5 Ad-Supported4 Subscriptions3 EST2/Rentals $273B $221B $214B Television Digital Video $245B $5B $261B $6B $7B $6B $6B 20.8% -0.6% -4.4% 6.3% 2019 2020 2021 2022E 2023E $13B $18B $22B $25B $28B VIDEO REVENUE BY TYPE1, U.S., 2019-2023E, BILLIONS USD 7.7% VIDEO
  • 75.
    We forecast that“battleground TV households” will continue to grow as Pay TV households decline through 2026  74 2022E 2026E 125M 122M 18M 15M 51M 36M Core TV Households ACTIVATE FORECAST 2022E-2026E CAGR: NON-PAY TV2 HOUSEHOLDS PAY TV2 HOUSEHOLDS OVER-THE-AIR BROADBAND ONLY PAY TV2 Battleground TV Households 57M INCLUDING 18M VIRTUAL PAY TV2 HOUSEHOLDS 72M INCLUDING 16M VIRTUAL PAY TV2 HOUSEHOLDS 1. Figures do not sum due to rounding. 2. “Pay TV” is defined as traditional Pay TV (i.e. TV delivered through a set-top box) and virtual Pay TV (i.e. TV delivered through the internet without a set-top box). Sources: Activate analysis, Activate 2016 Consumer Technology & Media Research Study (n = 4,000), Activate 2017 Consumer Technology & Media Research Study (n = 4,047), Activate 2018 Consumer Technology & Media Research Study (n = 4,000), Activate 2019 Consumer Technology & Media Research Study (n = 4,006), Activate 2020 Consumer Technology & Media Research Study (n = 4,003), Activate 2021 Consumer Technology & Media Research Study (n = 4,018), Activate 2021 Consumer Video Research Study (n = 2,014), Activate 2022 Consumer Technology & Media Research Study (n = 4,001), eMarketer, MoffettNathanson, Nielsen, S&P Global, U.S. Census Bureau, Wells Fargo TELEVISION HOUSEHOLD BREAKDOWN1, U.S., 2022E VS. 2026E, MILLIONS HOUSEHOLDS 4.7% 9.0% -5.6% VIDEO
  • 76.
    2017 2018 20192020 2021 2022E 2023E 2024E 2025E 2026E After growing at over 30% per year, Virtual Pay TV growth will slow through 2026  75 4.5M 7.6M 10.1M 12.3M 14.4M 15.7M 16.5M 17.2M 17.8M 18.2M Other 36% 31% 15% 12% 6% Subscriptions YoY % Change 124% 32% 22% 17% 9% 5% 4% 3% 3% VIRTUAL PAY TV1 SUBSCRIPTIONS, U.S., 2017-2026E, MILLIONS SUBSCRIPTIONS / YOY % CHANGE 2022E-2026E CAGR: 2017-2021 CAGR: 71% 33.9% 85.9% 2.4% 75.3% 96.3% 33.9% -8.8% 12.5% -2.7% 5.3% 5.0% 3.8% 1. “Virtual Pay TV services” are defined as services that deliver TV through the internet without a set-top box. Sources: Activate analysis, eMarketer, MoffettNathanson, Nielsen, S&P Global, Wells Fargo ACTIVATE FORECAST VIDEO
  • 77.
    1 2 34 5 6 7 8 9 10 11 12 1 2 3 4 5 6 7 8 9 10 11 12 1 2 3 4 5 6 7 8 9 10 11 12 1 2 3 4 5 6 7 8 9 10 11 12 1 2 3 4 5 6 7 8 9 10 2018 2019 2020 2021 2022 Virtual Pay TV prices will continue to increase, resulting in lower growth in the adoption of these services  76 MONTHLY SUBSCRIPTION PRICE1 OF VIRTUAL PAY TV SERVICES2, U.S., JAN. 2018-OCT. 20223, USD $69.99 $64.99 $69.99 $69.99 $35.00 $35.00 $25.00 $6.99 CURRENT PRICE3 4 Blue Orange $5.99 ↑$25.00 ↑$64.99 $20.00 ↑$25.00 $20.00 ↑$30.00 ↑$35.00 $25.00 ↑$30.00 ↑$35.00 $44.99 ↑$54.99 ↑$64.99 $39.99 ↑$44.99 ↑$54.99 $35.00 ↑$40.00 ↑$50.00 $35.00 ↑$40.00 ↑$50.00 ↑$65.00 ↓$55.00 ↑$69.99 ↑$59.99 ↑$64.99 ↑$69.99 ↑$69.99 ↑$6.99 5 PRICE ANNOUNCED TO INCREASE TO $74.99 IN DEC. 2022 ↑$64.99 1. Price reflects each service’s base package. 2. “Virtual Pay TV services” are defined as services that deliver TV through the internet without a set-top box. 3. Pricing information as of Oct. 10, 2022. 4. Includes prices from previously rebranded services (i.e. DirecTV Now, AT&T TV Now, and AT&T TV). 5. As of Dec. 21, 2021, Hulu + Live TV subscriptions include Disney+ and ESPN+. Sources: Activate analysis, Company press releases, Company sites, S&P Global VIDEO
  • 78.
    We forecast thatPay TV will mostly decline and do so at a much slower pace internationally than in the U.S.  77 PAY TV1 PENETRATION BY REGION, GLOBAL, 2020-2026E, % HOUSEHOLDS IN EACH REGION 2020 2021 2022E 2023E 2024E 2025E 2026E 26% 26% 26% 26% 26% 25% 24% 34% 34% 35% 35% 36% 37% 38% 64% 64% 65% 65% 65% 65% 65% 45% 46% 48% 50% 53% 57% 62% 53% 54% 54% 55% 55% 56% 57% 38% 39% 39% 40% 40% 41% 42% 2020-2026E CHANGE: Western Europe -1pp Central & Eastern Europe -4pp U.S. -17pp APAC (excluding China, India) -4pp Latin America -4pp Middle East & Africa +2pp 53% 55% 56% 57% 62% 65% 1. “Pay TV” is defined as traditional Pay TV (i.e. TV delivered through a set-top box) and virtual Pay TV (i.e. TV delivered through the internet without a set-top box). Sources: Activate analysis, Omdia, PricewaterhouseCoopers, S&P Global VIDEO
  • 79.
    www.activate.com  78 CONTENTS PAGE $420BGlobal Technology and Media Growth Dollars Up for Grabs 4 Consumer Technology and Media Time and Attention 9 Super Users: The Critical Segment for Technology and Media Companies 15 eCommerce and Marketplaces: Growth will Continue Across Categories With Major Consumer Trends Serving as Tailwinds 29 Video: Streaming and Social Drive Growth 47 Gaming and Esports: A Mainstream Behavior and Precursor to The Metaverse 78 NFTs: Past the Hype Cycle, Towards Tangible Use Cases 95 Metaverse: Time for Practical Applications 108 Audio: Digital Audio Will Drive More Consumer Time and Spend 138 Sports and Sports Betting: Younger Next-Gen Sports Fans Drive Growth 152 Digital Fitness: Consumer Adoption Will Continue to Grow 167
  • 80.
    2019 1,988M 864M 124M  79 GAMING POPULATIONBY REGION, GLOBAL, 2019 VS. 2022E, MILLIONS GAMERS1 2019-2022E CAGR: 6% There are nearly 150M active gamers in the U.S. today, up from 124M in 2019 1. “Gamers” are defined as adults aged 18+ who currently play video games. Sources: Activate analysis, Activate 2019 Consumer Technology & Media Research Study (n = 4,006), Activate 2022 Consumer Technology & Media Research Study (n = 4,001), Newzoo, U.S. Census Bureau U.S. 2022E 2,364M 917M 148M 2,217M 1,864M INTERNATIONAL GAMING AND ESPORTS
  • 81.
    We forecast thatthe global video game market will grow to nearly $220B by 2026, with over $50B generated in the U.S.  80 CONSUMER VIDEO GAME REVENUE BY REGION1, GLOBAL, 2018 VS. 2022E VS. 2026E, BILLIONS USD 2018 2022E 2026E $218B $182B $128B $166B $140B $99B $52B $42B $29B 9% 10% 5% 5% 2018-2022E CAGR: 2022E-2026E CAGR: 9% 5% INTERNATIONAL U.S. 1. Excludes hardware and device sales, augmented reality / virtual reality content, and advertising. Sources: Activate analysis, Newzoo, Omdia, PricewaterhouseCoopers GAMING AND ESPORTS
  • 82.
    HABITUAL GAMERS2 RECREATIONALGAMERS3 OCCASIONAL GAMERS4 • Play video games as their primary source of entertainment • Follow gaming content online (e.g. watch playthroughs, read reviews) • Play video games as one of a few equivalent sources of entertainment • May follow gaming content online • Play video games only when other sources of entertainment are unavailable • Are unlikely to follow gaming content online 35% OF U.S. GAMERS1 51M IN THE U.S. 36% OF U.S. GAMERS1 54M IN THE U.S. 29% OF U.S. GAMERS1 43M IN THE U.S. We have segmented the gaming population by their level of engagement within the space, from the most involved Habitual Gamers to the more infrequent Occasional Gamers  81 OUR RESEARCH SHOWS THAT U.S. GAMERS1 FALL INTO ONE OF THREE SEGMENTS… 1. “Gamers” are defined as adults aged 18+ who currently play video games. 2. “Habitual Gamers” are defined as gamers who view gaming as their primary source of entertainment and follow gaming content online. 3. “Recreational Gamers” are defined as gamers who view gaming as one of a few equivalent options for entertainment, or gamers who view gaming as their primary source of entertainment but do not follow gaming content online. 4. “Occasional Gamers” are defined as gamers who only view gaming as an entertainment option when other options are not available, or gamers who view gaming as one of a few equivalent options for entertainment but do not follow gaming content online. Sources: Activate analysis, Activate 2022 Consumer Technology & Media Research Study (n = 4,001), U.S. Census Bureau GAMING AND ESPORTS
  • 83.
    28% 19% 41% 27% 45% 49% 41% 53% 67% % Habitual Gamers% Recreational Gamers % Occasional Gamers  82 DEMOGRAPHICS BY GAMER1 SEGMENT, U.S., 2022, % GAMERS1 BY SEGMENT MULTI-PLATFORM USAGE BY GAMER1 SEGMENT, U.S., 2022, % GAMERS1 BY SEGMENT 2 3 4 41% 74% 86% Multi- platform gamers5 Compared to Occasional Gamers4… …as much time per week playing video games Habitual Gamers2 spend 2.4x Recreational Gamers3 spend 1.7x Gamers in each segment are demographically and behaviorally distinct: Habitual Gamers are more likely to be male, younger, and higher- income, and they dedicate more time to gaming across multiple devices 1. “Gamers” are defined as adults aged 18+ who currently play video games. 2. “Habitual Gamers” are defined as gamers who view gaming as their primary source of entertainment and follow gaming content online. 3. “Recreational Gamers” are defined as gamers who view gaming as one of a few equivalent options for entertainment, or gamers who view gaming as their primary source of entertainment but do not follow gaming content online. 4. “Occasional Gamers” are defined as gamers who only view gaming as an entertainment option when other options are not available, or gamers who view gaming as one of a few equivalent options for entertainment but do not follow gaming content online. 5. “Multi-platform gamers” are defined as gamers who currently play video games across two or more platforms (i.e. mobile, PC, console). Sources: Activate analysis, Activate 2022 Consumer Technology & Media Research Study (n = 4,001) Have a household income of $100K or greater Are male Are aged 18-34 GAMING AND ESPORTS
  • 84.
    2 3 4 Participationin Social Activities Within Games SOCIAL ACTIVITIES WITHIN GAMES INCLUDE: Socializing with friends/family or meeting new people; attending educational classes, work-related meetings, networking events, or live in-game performances; watching in-game movies, TV shows, or previews; traveling to virtual versions of real-world locations Participation in Creation Activities Within Games CREATION ACTIVITIES WITHIN GAMES INCLUDE: Creating/personalizing characters/avatars, items, places, maps, or new games/levels Participation in Transactional Activities Within Games TRANSACTIONAL ACTIVITIES WITHIN GAMES INCLUDE: Purchasing game skins, emotes, and other in-game personalization content/ items; purchasing virtual versions of brand-name items; selling virtual goods/ items to other players; completing jobs in games in exchange for money from other players; offering money to other players in exchange for completing jobs; investing, lending, or borrowing money; betting/gambling; owning virtual land 13% 23% 19% 55% 67% 58% 85% 86% 85% % Habitual Gamers % Recreational Gamers % Occasional Gamers Habitual Gamers will be the earliest adopters of the Metaverse as they already take advantage of opportunities for immersive activities within games today  83 76% of Habitual Gamers2 participated in all three types of activities within games in the last 12 months 1. “Gamers” are defined as adults aged 18+ who currently play video games. 2. “Habitual Gamers” are defined as gamers who view gaming as their primary source of entertainment and follow gaming content online. 3. “Recreational Gamers” are defined as gamers who view gaming as one of a few equivalent options for entertainment, or gamers who view gaming as their primary source of entertainment but do not follow gaming content online. 4. “Occasional Gamers” are defined as gamers who only view gaming as an entertainment option when other options are not available, or gamers who view gaming as one of a few equivalent options for entertainment but do not follow gaming content online. Sources: Activate analysis, Activate 2022 Consumer Technology & Media Research Study (n = 4,001) PARTICIPATION IN SELECT METAVERSE ACTIVITIES WITHIN GAMES BY GAMER1 SEGMENT, U.S., 2022, % GAMERS1 BY SEGMENT GAMING AND ESPORTS
  • 85.
    The top-performing PCand console game titles of the last year offer cross-platform, multiplayer, and open-world features to enable creative and connected experiences for gamers  84 TOP-EARNING PAID PC AND CONSOLE VIDEO GAME TITLES, U.S., 2021 1. Multiplayer mode is expected to launch on Oct. 28, 2022. Sources: Activate analysis, Company sites, NPD Group NINTENDO SWITCH PLAYSTATION XBOX DESKTOP/LAPTOP MARVEL'S SPIDER-MAN: MILES MORALES MARIO KART 8 RESIDENT EVIL: VILLAGE1 MLB: THE SHOW 21 SUPER MARIO 3D WORLD CALL OF DUTY: VANGUARD CALL OF DUTY: BLACK OPS COLD WAR MADDEN NFL 22 POKEMON: BRILLIANT DIAMOND / SHINING PEARL BATTLEFIELD 2042 2 3 4 5 1 7 8 9 10 6 Includes Open World (i.e. ability to freely explore and interact with environment) Includes Multiplayer (i.e. ability to play with others) GAMING AND ESPORTS
  • 86.
    MOBILE GAMING TITLE REVENUE3SOCIAL FEATURES/REWARDS In-Game Chat Feature Ability to Connect to Social Media Ability to Form Teams $2.8B • Ability to share highlights and results via chat • Ability to invite and compete with players from the same region $2.8B • Cooperative play with five people • Integrations with social or messaging platforms (e.g. WeChat, QQ) Genshin Impact $1.8B • Ability to invite others to online cooperative mode • Built-in chat system to communicate within server — $1.3B • Ability to invite others to specific servers • Increasing in-game payouts based on engagement $1.3B • Bonuses for linking to social media accounts (e.g. Facebook) • In-game rewards for inviting friends $1.2B • Ability to send in-game gifts to others • Bonuses based on tiered “Friendship Levels” Announced The top-earning mobile game titles offer integrated social features and unique rewards for playing online with friends, suggesting that gaming is increasingly a community-driven behavior  85 TOP-EARNING1 MOBILE GAME TITLES, GLOBAL, 20212, BILLIONS USD 1. Top-earning mobile games on the Google Play Store and Apple App Store. Excludes third-party app stores. 2. Between Jan. 1, 2021 and Dec. 14, 2021. Sources: Activate analysis, Company sites, Sensor Tower TOP MOBILE GAMES ENCOURAGE PLAYERS TO ENGAGE SOCIALLY WITH OTHERS GAMING AND ESPORTS
  • 87.
    Games Expansions/ Add-Ons Performance Items (e.g. weapon upgrades, characterattribute boosts) Non-Performance Items (e.g. clothes, skins, stickers, dances, poses) 22% 8% 15% 35% 43% 35% 44% 70% 57% 37% 54% 79% % Habitual Gamers % Recreational Gamers % Occasional Gamers Gamers on average are spending more than ever as content offerings become more varied — Habitual Gamers are especially eager to spend on add-ons and items to enhance their experiences  86 AVERAGE MONTHLY SPEND PER GAMER1, U.S., 2019-2022E, USD PER MONTH GAMING PURCHASES BY PURCHASE TYPE AND GAMER1 SEGMENT, U.S., 2022, % GAMERS1 WHO SPEND ON GAMING CONTENT BY SEGMENT 2019 2020 2021 2022E $23.87 $19.93 $17.10 $19.04 2 3 4 1. “Gamers” are defined as adults aged 18+ who currently play video games. 2. “Habitual Gamers” are defined as gamers who view gaming as their primary source of entertainment and follow gaming content online. 3. “Recreational Gamers” are defined as gamers who view gaming as one of a few equivalent options for entertainment, or gamers who view gaming as their primary source of entertainment but do not follow gaming content online. 4. “Occasional Gamers” are defined as gamers who only view gaming as an entertainment option when other options are not available, or gamers who view gaming as one of a few equivalent options for entertainment but do not follow gaming content online. Sources: Activate analysis, Activate 2019 Consumer Technology & Media Research Study (n = 4,006), Activate 2020 Consumer Technology & Media Research Study (n = 4,003), Activate 2021 Consumer Technology & Media Research Study (n = 4,018), Activate 2022 Consumer Technology & Media Research Study (n = 4,001) 2019-2022E CAGR: 8% GAMING AND ESPORTS
  • 88.
    In-game advertising capturesconsumer attention in exchange for free in-game content; Habitual Gamers are most receptive to in-game advertising, especially on mobile  87 WILLINGNESS TO VIEW IN-GAME ADVERTISEMENTS IN EXCHANGE FOR FREE IN-GAME CONTENT BY PLATFORM, U.S., 2022, % GAMERS1 WHO USE EACH PLATFORM BY SEGMENT 27% 24% 40% 43% 41% 50% 69% 72% 77% % Habitual Gamers % Recreational Gamers % Occasional Gamers CONSOLE MOBILE PC 2 3 4 Extremely or very willing to view in-game ads for free in-game content on… 1. “Gamers” are defined as adults aged 18+ who currently play video games. 2. “Habitual Gamers” are defined as gamers who view gaming as their primary source of entertainment and follow gaming content online. 3. “Recreational Gamers” are defined as gamers who view gaming as one of a few equivalent options for entertainment, or gamers who view gaming as their primary source of entertainment but do not follow gaming content online. 4. “Occasional Gamers” are defined as gamers who only view gaming as an entertainment option when other options are not available, or gamers who view gaming as one of a few equivalent options for entertainment but do not follow gaming content online. Sources: Activate analysis, Activate 2022 Consumer Technology & Media Research Study (n = 4,001) GAMING AND ESPORTS
  • 89.
    Gaming IP isincreasingly leveraged in all forms of media and entertainment as studios capitalize on increased consumer affinity and demand  88 SONIC THE HEDGEHOG 2 APRIL 2022 Sonic the Hedgehog 2 became the top- grossing video game movie of all time, earning $331M at the box office The Sonic the Hedgehog game series sold ~5M units in 2022, quadrupling from 2021 THE WITCHER DECEMBER 2021 Netflix released Season 2 of The Witcher, a fantasy drama TV series Following the release, The Witcher video game spiked to 71,000 concurrent players UNCHARTED FEBRUARY 2022 Uncharted became the fifth-highest-grossing video game movie of all time The movie had a budget of $120M and starred Tom Holland and Mark Wahlberg HALO: THE SERIES MARCH 2022 This science fiction series was developed for Paramount+ Halo is now the streaming service’s second-most-watched original series Sources: Activate analysis, Company press releases, Company sites SELECT TV/FILM ADAPTATIONS OF GAMING IP GAMING AND ESPORTS
  • 90.
    Technology companies areincreasingly taking a full-stack approach to build out capabilities in the gaming space as consumer demand grows NETFLIX NINTENDO VALVE GAME PUBLISHER VIRTUAL WORLD CONSOLE3 AR/VR DEVICE CLOUD APP STORE SUBSCRIPTION SERVICE GAMING AS VIDEO 1. Information as of Oct. 2022. Does not include areas in which company is a majority stakeholder. 2. Engine created by Valve and game eventually published by Valve, but independently developed by Garry Newman and Facepunch Studios. 3. Excludes devices with a primary purpose other than gaming (e.g. Apple TV). 4. Co-developed by Logitech and Tencent. 5. Meta does not offer a standalone cloud service but allows streaming of select games through Facebook on Android and web. The standalone Facebook Gaming app for iOS and Android will be shut down in Oct. 2022 but gaming features will remain available in the main Facebook app. 6. Only available through a bundle with Xbox Game Pass Ultimate. 7. On a game-by-game basis, not as a subscription or service. Sources: Activate analysis, Company press releases, Company sites  89 SELECT COMPANIES’ PRESENCE IN GAMING1 EGAME Announced, not yet released * * 5 * 7 4 * 5 * 2 6 6 Store GAMING AND ESPORTS
  • 91.
    Major technology companiesare leveraging their scale to acquire game publishers in pursuit of full-stack gaming capabilities — this is only the beginning for M&A in the gaming space, as we expect industry consolidation to continue  90 ACQUIRING COMPANY TARGET COMPANY DATE OF ANNOUNCEMENT ACQUIRING COMPANY MARKET CAP1 REPORTED TRANSACTION VALUE RATIONALE Microsoft Activision Jan. 2022 $1,830B $68.7B Provide building blocks for the Metaverse Take-Two Zynga Jan. 2022 $20.6B $12.7B Expand into mobile gaming Sony Bungie Jan. 2022 $80.5B $3.6B Expand live service game offerings Embracer Group Asmodee Dec. 2021 $5.47B $3.0B Improve player experience Savvy Gaming Group ESL / FACEIT Jan. 2022 Undisclosed $1.5B Improve capabilities and resources in esports Embracer Group Square Enix Western Studios May 2022 $5.47B $0.3B Create new installments from original IP Stillfront Group 6waves Jan. 2022 $1.26B $0.2B Strengthen presence in free- to-play gaming and the Japanese market Sony Savage Game Studios Aug. 2022 $80.5B UNDISCLOSED Expand to additional platforms 1. Market capitalizations as of Oct. 24, 2022. Sources: Activate analysis, Company press releases RECENT ACQUISITIONS OF GAMING STUDIOS GAMING AND ESPORTS
  • 92.
    1. “Esports viewers”(2019) are defined as adults aged 18+ who have watched an esports competition at any point in time. 2. “Esports viewers” (2022) are defined as adults aged 18+ who have watched or attended an esports competition within the last 12 months. 3. Figures do not sum to 100% due to rounding. 4. “Gamers” are defined as adults aged 18+ who currently play video games. 5. “Occasional Gamers” are defined as gamers who only view gaming as an entertainment option when other options are not available, or gamers who view gaming as one of a few equivalent options for entertainment but do not follow gaming content online. 6. “Recreational Gamers” are defined as gamers who view gaming as one of a few equivalent options for entertainment, or Gamers who view gaming as their primary source of entertainment but do not follow gaming content online. 7. “Habitual Gamers” are defined as gamers who view gaming as their primary source of entertainment and follow gaming content online. Sources: Activate analysis, Activate 2019 Consumer Technology & Media Research Study (n = 4,006), Activate 2022 Consumer Technology & Media Research Study (n = 4,001), U.S. Census Bureau 2019 2022E 64M 39M There are over 64M esports viewers in the U.S. today — while the majority of esports viewers are also gamers, there are key differences in the populations the two spaces attract  91 ESPORTS VIEWERSHIP, U.S., 2019 VS. 2022E, MILLIONS ESPORTS VIEWERS1,2 ESPORTS VIEWERS2 BY GAMER SEGMENT3, U.S., 2022, % ESPORTS VIEWERS2 ESPORTS VIEWER2 AND GAMER4 DEMOGRAPHICS, U.S., 2022, % ESPORTS VIEWERS2 VS. % GAMERS4 Have a household income of $100K or greater 2 4 Are male 32% 43% 53% 68% % Esports Viewers % Gamers 40% 57% Are aged 18-34 2019-2022E CAGR: 18% Esports Viewers 7% 3% 30% 59% Habitual Gamers7 Recreational Gamers6 Occasional Gamers5 Non-Gamers4 2 3% 7% GAMING AND ESPORTS
  • 93.
    The global esportsaudience has already surpassed half a billion viewers and will continue to grow as the space develops  92 ESPORTS VIEWERSHIP, GLOBAL, 2022E-2026E, MILLIONS ESPORTS VIEWERS Sources: Activate analysis, Activate 2022 Consumer Technology & Media Research Study (n = 4,001), Newzoo 2022E 2023E 2024E 2025E 2026E 722M 679M 638M 600M 564M ACTIVATE FORECAST 2022E-2026E CAGR: 6% GLOBAL ESPORTS AUDIENCE GAMING AND ESPORTS
  • 94.
    The future ofesports will be driven by media rights and distribution to capture incremental audiences  93 ESPORTS REVENUE BY TYPE, GLOBAL, 2022E VS. 2026E, BILLIONS USD Sources: Activate analysis, Activate 2022 Consumer Technology & Media Research Study (n = 4,001), Company press releases, Newzoo, Omdia, PricewaterhouseCoopers 2022E 2026E $6.1B $4.1B $2.1B $1.4B $4.0B $2.7B B2B Spend (e.g. sponsorships, advertising, media rights) Consumer Spend (e.g. tickets, merchandise, betting) 2022E-2026E CAGR: 10.5% 10.9% SELECT DEVELOPMENTS IN ESPORTS MEDIA RIGHTS CS:GO esports series BLAST Premier has agreed to 35 media deals for the broadcast of its 2022 season G4, the exclusive media rights partner to ESL Gaming, has partnered with Pluto TV to distribute its content through ad-supported free streaming 10.8% GAMING AND ESPORTS
  • 95.
     94 Growing esports marketswill have an amplified impact across technology and media, enabling a broad set of other digital activities Esports followers1 are… Have Bought/Sold/Created NFTs2 Have Used/Acquired Cryptocurrency2 Own Connected Fitness Equipment3 Use VR Headsets2 Listen to Podcasts Watch Live Sports2 Listen to Music Use Social Media …as non-esports followers1 1. “Esports followers” are defined as adults aged 18+ who have attended esports events or watched, listened to, or read esports content (e.g. highlights, news, competitions) in the last 12 months. 2. Based on behaviors in the last 12 months. 3. “Connected fitness equipment” is defined as internet-connected exercise equipment with social / live-class capabilities. Ownership is defined at the household level. Sources: Activate analysis, Activate 2022 Consumer Technology & Media Research Study (n = 4,001) 17.7x 7.9x 7.8x 6.5x as likely to as likely to as likely to as likely to 3.4x 1.6x 1.3x 1.3x as likely to as likely to as likely to as likely to MEDIA BEHAVIORS, U.S., 2022, ESPORTS FOLLOWERS1 INDEXED TO NON-ESPORTS FOLLOWERS1 GAMING AND ESPORTS
  • 96.
    www.activate.com  95 CONTENTS PAGE $420BGlobal Technology and Media Growth Dollars Up for Grabs 4 Consumer Technology and Media Time and Attention 9 Super Users: The Critical Segment for Technology and Media Companies 15 eCommerce and Marketplaces: Growth will Continue Across Categories With Major Consumer Trends Serving as Tailwinds 29 Video: Streaming and Social Drive Growth 47 Gaming and Esports: A Mainstream Behavior and Precursor to The Metaverse 78 NFTs: Past the Hype Cycle, Towards Tangible Use Cases 95 Metaverse: Time for Practical Applications 108 Audio: Digital Audio Will Drive More Consumer Time and Spend 138 Sports and Sports Betting: Younger Next-Gen Sports Fans Drive Growth 152 Digital Fitness: Consumer Adoption Will Continue to Grow 167
  • 97.
    In 2022, NFTspassed their peak hype, making way for more tangible use cases  96 “HYPE CYCLE”1 FOR NFTS AND RELATED TOPICS, U.S., SEPT. 2022 1. “Hype cycle” is defined as a visual representation of the path from initial interest to widespread adoption of a new technology / technology application over time. 2. ”Hype" is derived from average Google Trends search frequency. Sources: Activate analysis, Google Trends, PitchBook HYPE 2 PHASE ACTIVATE “HYPE CYCLE”1 INITIAL INTEREST HYPE BUBBLE DISSATISFACTION BACKLASH PRACTICAL APPLICATION DEVELOPMENT WIDESPREAD ADOPTION Decentralized Autonomous Organization Web3 Cryptocurrencies Decentralized Finance • Past peak hype bubble • Hype to decline further as NFT landscape matures • Continued Blockchain and Web3 innovation to provide tailwinds driving NFT utility NFTS’ POSITION IN “HYPE CYCLE”1 ACTIVATE POINT OF VIEW The end of excessive NFT hype is making way for a new set of more tangible use cases rooted in established technology and media behaviors (e.g. commerce, social) Moving forward, these use cases will focus on problems that NFTs have a strong rationale for solving, such as community building and rewarding loyal brand users User rationale for purchasing NFTs has also changed, moving away from investment use cases and towards displaying and collecting NFT companies have continued to be attractive targets for investors and have grown substantially in the last 12 months, reflecting continued interest in the NFT market (despite falling cryptocurrency values driving down NFT prices) 1 2 3 4 NFTs
  • 98.
    NFT usage isstill a relatively nascent behavior, with less than one third of the population aware of what NFTs are and relatively younger and more affluent consumers leading the way  97 1. “Aware of NFTs” is defined as knowing what NFTs are. 2. “NFT market participants” are defined as those who researched/ discussed, browsed, bid on, purchased, displayed, sold, or created NFTs in the last 12 months. Sources: Activate analysis, Activate 2021 Consumer NFT Research Study (n = 1,040), Activate 2022 Metaverse & NFT Consumer Research Study (n = 3,078) NFT AWARENESS1 AND PARTICIPATION2, U.S., 2021 VS. 2022, % ADULTS AGED 18+ NFT MARKET PARTICIPANT2 DEMOGRAPHICS, U.S., 2022, % NFT MARKET PARTICIPANTS2 AGED 18+ 18% 32% 12% 27% 2021 2022 Aware of NFTs1 NFT Market Participants2  97 Less than $25K $25K-$50K $50K-$100K $100K+ NFT MARKET PARTICIPANTS2 BY HOUSEHOLD INCOME 15% 17% 25% 43% Aged 18-44 Aged 45+ NFT MARKET PARTICIPANTS2 BY AGE GROUP 25% 75% NFTs
  • 99.
    Consumers are movingaway from primarily buying NFTs as investments and towards other tangible use cases, such as displaying and collecting digital items  98 1. Consumers were asked to select up to two top reasons. 2. “NFT purchasers” are defined as adults 18+ who have purchased NFTs in the last 12 months. Sources: Activate analysis, Activate 2021 Consumer NFT Research Study (n = 1,040), Activate 2022 Metaverse & NFT Consumer Research Study (n = 3,078) INVESTMENT DISPLAY OF DIGITAL ITEMS COLLECTION OF DIGITAL ITEMS INNOVATIVENESS/ NOVELTY SUPPORT FOR FAVORITE ARTISTS/ ATHLETES 2021 2022 -25pp 14% 20% 22% 33% 51% 12% 32% 18% 14% 76% +19pp -12pp +4pp +2pp TOP REASONS1 FOR PURCHASING NFTS,U.S., 2021 VS. 2022, % NFT PURCHASERS2 NFTs
  • 100.
    Moving forward, NFTscan add the most value through creating exclusive digital communities and rewarding loyal customers Sources: Activate analysis, Company sites Community Building: NFTs enable digital communities to form around the ownership of scarce collectibles • Sellers: Enables the leveraging of a community vs. a one-off sale • Buyers: Provides outlet for connection and feelings of belonging in digital spaces Bored Ape Yacht Club’s success hinges upon scarcity; there are only 10,000 unique Bored Ape NFTs in existence, so membership is limited and exclusive, similar to physical membership clubs (e.g. Soho House) Rewarding Loyal Users: NFTs can function as a way to reward loyal customers with perks and connections to the brand •Sellers: Develops a more engaged customer base •Buyers: Allows customers to connect with, support, and invest in the brand in novel ways Starbucks plans to create a series of branded NFT collections, which will allow members to access exclusive experiences and rewards (e.g. espresso martini-making class, exclusive artwork)  99 SELECT NFT USE CASES NFTs
  • 101.
    Community Building: ManyNFT projects are finding success online through Discord, beginning with the development of a project server and eventually growing into a global community  100 Sources: Activate analysis, Chain Debrief, Company sites, Cyber Scrilla, Token Minds, Wealth Quint ORIGINATION PROMOTION COMMUNITY FORMATION MAINTAINING POPULARITY NFT teams begin initial project development by creating a Discord server, where investors, artists, digital developers, businesses, and fans come together in a community chat to collaborate and discuss new ideas Next, teams begin promotion of the project through methods such as inviting users via social media, sharing the Community Server link through existing channels, and making the platform settings public and discoverable to all users Teams then develop a community by engaging in conversation with followers, maintaining standard rules, hosting frequent Q&A sessions and competitions, and offering whitelist memberships, guaranteeing early access to NFT minting Finally, teams maintain this following through large-scale initiatives like collaboration with other NFT teams, one- time NFT giveaways or exclusive line drops, and partnering with NFT / social media influencers 1 1 2 2 3 3 4 4 NFT PROJECT GROWTH PROCESS ON DISCORD NFTs
  • 102.
    Sources: Activate analysis,Company sites INSTAGRAM Description: Instagram allows users to integrate their digital wallet into their profile to display their NFT collection Activate Perspective: The ability to integrate NFTs seamlessly into profiles will be critical for NFT use in social media TIKTOK Description: TikTok released three one-of-one and limited-edition drop NFTs of viral videos through TikTok Top Moments, but faced issues releasing more due to waning user interest Activate Perspective: Social media companies must provide a clear utility to users when launching NFT projects to achieve success TWITTER Description: Twitter launched support for NFT profile pictures, which take on a distinct hexagonal shape Activate Perspective: The ability to signal membership in exclusive clubs remains the major use case for NFTs in social media Community Building: Social media companies are integrating features to support users who want to display NFTs as part of a community identification  101 EXAMPLE NFT USE CASES IN SOCIAL MEDIA NFTs
  • 103.
    Rewarding Loyal Users:eCommerce Brands will use NFTs that are redeemable for physical goods as a rewards system for their most loyal customers  102 EXAMPLE NFT USE CASES IN ECOMMERCE Sources: Activate analysis, Company sites LOYALTY Description: Existing brands can offer NFTs to reward their most engaged clients, which can include attaching physical perks to digital collectibles Example: Clinique ran a competition for its loyalty program members, offering a limited-edition NFT to three winners, which gave them access to exclusive products each year for the next decade Activate Perspective: The most successful innovators with NFTs will be able to provide consumers with tangible benefits (e.g. physical product counterparts, exclusive product launches, influence on future products) PRODUCT CONTRIBUTION Description: Emerging brands are using NFTs as part of their customer rewards strategy, promising collectibles as incentives for early adopters Example: Try Your Best is a Web3 platform designed to help consumer goods brands offer their most loyal customers incentives to share their feedback and preferences in exchange for collectible NFTs, physical products, and the ability to influence product choices (e.g. packaging colors) See full wallet Joggy We’re picking packaging colors. Help us choose! Earn a Joggy Doggy collectible NFTs
  • 104.
    PROMOTIONS/ LOYALTY Being gifted NFT(s)for free as part of a promotion/loyalty program from a brand/artist PURCHASES Paying for NFT(s) EXCHANGES Receiving NFT(s) in exchange for a non-monetary action (e.g. leaving a review) GAMES Earning NFT(s) through playing a game Rewarding Loyal Users: Promotional/loyalty campaigns are the most common pathway to NFT ownership as companies look for new ways to reward their loyal customers  103 METHODS OF NFT ACQUISITION IN THE LAST 12 MONTHS, U.S., 2022, % NFT OWNERS AGED 18+ Sources: Activate analysis, Activate 2022 Metaverse & NFT Consumer Research Study (n = 3,078), Insider, The Verge 33% 35% 38% 46% PROMOTION/ LOYALTY EXAMPLES BURGER KING, “KEEP IT REAL MEALS” NFT CAMPAIGN: QR CODE LEADING TO DIGITAL COLLECTIBLE ON NEARLY SIX MILLION MEAL BOXES. REWARDS INCLUDED: • WHOPPER SANDWICHES FOR A YEAR • AUTOGRAPHED GOODS • PHONE CALL WITH ONE OF THE CAMPAIGN’S CELEBRITIES NFL, COMPLIMENTARY NFTS FOR SELECT GAMES: THE LEAGUE DISTRIBUTED MORE THAN 500,000 COMPLIMENTARY VIRTUAL COMMEMORATIVE TICKET NFTS TO FANS NFTs
  • 105.
    While NFT salesgrowth has slowed recently, overall sales volume has already exceeded $23B in 2022, underscoring continued consumer interest  104 $23.0B $15.1B YTD Aug. 2021 YTD Aug. 2022 $1.1B $1.3B $1.4B $3.0B $4.0B $2.6B $3.8B $5.8B $3.8B $3.7B $4.1B $4.3B $6.2B $1.7B $0.9B $2.5B $1.5B $1.1B $0.9B $0.1B 2021 2022 Jan. Feb. Mar. Apr. May June July Aug. Sept. Oct. Nov. Dec. Jan. Feb. Mar. Apr. May June July Aug. 2022 YoY Change -82% 57% 18% 164% 126% 309% >5000% 2022 YoY Change 53% Part of this spike can be attributed to the launch of the Mutant Apes collection by Bored Ape Yacht Club’s NFT project There is significant NFT sales volume in 2022, with a positive YoY growth rate for every month except July and August -24% TOTAL SALES OF NFTS1, GLOBAL, 2021-YTD AUG. 2022, USD BILLIONS 1. Includes primary and secondary market sales. 95% of the sales from LooksRare is excluded due to wash trading. Wash trading is an act where a trader sells an asset belonging to them to another wallet controlled by them (often to game platform financial incentives). Sources: Activate analysis, Bloomberg, CryptoSlam, DappRadar NFTs
  • 106.
    Jan. Feb. Mar.Apr. May June July Aug. Sept. 0% 50% 100% 150% 200% NFT Sales Ethereum Price Recent trends in the NFT market have mirrored those in cryptocurrency, given the overlap of users and dependencies on cryptocurrency for purchasing  105 1. Includes primary and secondary market sales for the trailing one month period. 2. Relative to USD for the trailing one month period. 3. Refers to minted (i.e. created), verified, and tracked NFTs. Sources: Activate analysis, Activate 2022 Metaverse & NFT Consumer Research Study (n = 3,078), Company sites, CryptoSlam, DappRadar, NonFungible • Ethereum is the underlying blockchain for over 86% of current NFTs3 • As a general rule, consumers can only purchase NFTs using cryptocurrency, typically Ethereum • There is a significant overlap of purchasers for NFTs and cryptocurrency, with over two thirds of NFT purchasers also purchasing cryptocurrency • Given this, when cryptocurrency prices (especially Ethereum) decline, it has a direct impact on NFT sales value when expressed in fiat currency (e.g. USD) 2 1 Pak’s “Clock” sells for $53M; CryptoPunks nets $30M in four days Bored Ape Yacht Club sales eclipse $200M in one week RATIONALE FOR COMPARING NFT SALES TO ETHEREUM PRICE AVERAGE NFT SALES1 AND ETHEREUM PRICE2, GLOBAL, YTD SEPT. 2022, % INDEXED TO JAN. 1, 2022 NFTs
  • 107.
    Significant growth infunding for NFT-related ventures in 2022 will further support NFT use cases, especially those related to Gaming and Marketplaces, which have made up more than 70% of all investments  106 TOP NFT INVESTMENT CATEGORIES BY FUNDING SIZE1, GLOBAL, SEPT. 2020-SEPT. 2022, MILLIONS USD CATEGORY PRIMARY FOCUS EXAMPLES GAMING Building NFT-native games NFT MARKETPLACES Functioning as a place to buy and sell third-party NFTs TECHNOLOGY Developing technology to enable specific advancements in NFT projects INVESTING Creating investment vehicles for funding other NFT projects MEDIA Generating narrative storytelling media content around NFT projects MUSIC Supporting monetization of musical content and performances through NFTs $126M $177M $190M $855M $1,109M $1,733M $87M $42M $56M $46M $294M $573M Sept. 2020-Sept. 2021 Sept. 2021-Sept. 2022 1. Data is based on the 50 largest investments made in NFT projects between Sept. 8, 2020 and Sept. 7, 2021 and the 50 largest investments made in NFT projects between Sept. 8, 2021 and Sept. 7, 2022. Sources: Activate analysis, PitchBook NFTs
  • 108.
    More than 80%of NFTs are part of the Ethereum blockchain and the majority of them go through the OpenSea marketplace  107 1. Includes primary and secondary market sales. 2. 95% of the sales from LooksRare is excluded due to wash trading. Wash trading is an act where a trader sells an asset belonging to them to another wallet controlled by them (often to game platform financial incentives). 3. Figures do not sum due to rounding. 4. Decline in “Other” is mainly due to the decline of Ronin NFT sales. Sources: Activate analysis, BeinCrypto, CryptoSlam, DappRadar SHARE OF NFT SALES1 BY BLOCKCHAIN, GLOBAL, 2021 VS. YTD AUG. 2022, % NFT SALES1 SHARE OF NFT SALES1 BY MARKETPLACE2,3, GLOBAL, 2021 VS. YTD AUG. 2022, % NFT SALES1 2021 YTD Aug. 2022 7% 30% 86% 66% Other4 2021-YTD Aug. 2022 Change in Share: +20pp +3pp -23pp Other 2021-YTD Aug. 2022 Change in Share: -2pp +3pp +12pp -13pp 12% 4% 7% NFTs 2021 YTD Aug. 2022 7% 20% 12% 75% 77% 2% 6%
  • 109.
    www.activate.com  108 CONTENTS PAGE $420BGlobal Technology and Media Growth Dollars Up for Grabs 4 Consumer Technology and Media Time and Attention 9 Super Users: The Critical Segment for Technology and Media Companies 15 eCommerce and Marketplaces: Growth will Continue Across Categories With Major Consumer Trends Serving as Tailwinds 29 Video: Streaming and Social Drive Growth 47 Gaming and Esports: A Mainstream Behavior and Precursor to The Metaverse 78 NFTs: Past the Hype Cycle, Towards Tangible Use Cases 95 Metaverse: Time for Practical Applications 108 Audio: Digital Audio Will Drive More Consumer Time and Spend 138 Sports and Sports Betting: Younger Next-Gen Sports Fans Drive Growth 152 Digital Fitness: Consumer Adoption Will Continue to Grow 167
  • 110.
    We believe thatthe Metaverse has just passed its peak hype cycle; now is when companies need to begin sustained development and investment  109 METAVERSE 1. Google Trends captures interest in a topic on a scale of 1-100 over time, with 100 representing the peak interest. Sources: Activate analysis, Google Trends TIME 2021 2022 2000 GOOGLE SEARCH INTEREST1 IN THE METAVERSE, U.S., JAN. 2021-OCT. 2022, INDEXED TO PEAK INTEREST 100 50 0 SUSTAINED DEVELOPMENT AND INVESTMENT Companies need to identify the opportunities and begin sustained development FOUNDATIONS OF THE METAVERSE: 20+ YEARS IN THE MAKING Early forms of virtual worlds were developed via social communities, simulations, and games PEAK OF THE HYPE CYCLE Rush of interest initially triggered during the pandemic and heightened by substantial investments from major industry players
  • 111.
     110 Note: Not exhaustive.1. Previously Android Market. Rebranded to Google Play in Mar. 2012. 2. CryptoPunks is an early NFT project developed on the Ethereum blockchain. 3. Lens Studio is Snap’s AR platform available on mobile devices. 4. Previously Uplay+, Ubisoft+ is a game subscription service that allows access to 100+ games. 5. Not exhaustive. Other Metaverse concerts include but are not limited to Ariana Grande in Fortnite, Charli XCX in Roblox, BLACKPINK in PUBG, and BTS in Minecraft. 6. Top Shot is a collection of NFTs that showcase memorable NBA moments. 7. Rebranded from Oculus Quest 2. 8. Microsoft Mesh became available for limited preview in Mar. 2022. Initially announced in Mar. 2021. 9. As of Oct. 24, 2022. 10. Unreal Engine 5 released in 2022. Unreal Engine originally released in 1998. 11. 6G projected in the coming years. 12. Apple AR glass rumored. 13. PlayStation VR2 expected to launch in early 2023. 14. Unity Metacast to offer interactive 3D sports experiences. Sources: Activate analysis, Company press releases, Company sites TECHNOLOGY INNOVATIONS METAVERSE EVENTS/PLATFORMS Mesh = virtual world platforms 2000-2005 2006-2010 2011-2016 2017-2018 2019 2020 2021 FIRST NFTS FORTNITE CONCERT FORTNITE CONCERT 20229 IPO CHANGES NAME TO HORIZON WORLDS CONCERT PATENTS TECHNOLOGY METAVERSE THEME PARK RAISES $2B TO FUND METAVERSE EXPANSION ANNOUNCES INTENT TO ACQUIRE Beyond 10 METACAST 14 11 AR GLASS 12 13 5 5 2 6 3 ACQUIRES 4 Pro METAVERSE EMERGENCE OF PRACTICAL APPLICATIONS (CONSUMER AND ENTERPRISE) 8 COACHELLAVERSE 1 7 The foundation for the Metaverse has been in development for the last 20 years through games, virtual experiences, and technologies; going forward we will see the emergence of practical applications (consumer and enterprise) 5
  • 112.
     111 Source: Activate analysis METAVERSE TheMetaverse is already here (not years away): virtual worlds, experiences, large scale user bases, functionality, IP, user agency, and social activities largely exist inside of video games today and will provide the foundation for the future Video games already offer connected immersive experiences at scale Consumers are participating in non-gaming activities and demonstrating social behaviors inside of video games User creation, co-creation, and building are established behaviors (e.g. user- generated activities, games, experiences, virtual goods, environments, worlds) Players control their identity Users can customize a digital persona in a virtual world distinct from their real-world identity, for use in virtual platforms Digital twins as mirrors of the real world (e.g. virtual representations of real-world spaces/ objects) Established IP and relatable contexts and characters Technology, game engines, and platforms already in wide use (e.g. game mechanics, concurrency, social, AR/VR integration, security, identity, content moderation) Large-scale, established global economies
  • 113.
    Eventually, all digitalbehavior and many daily activities will be in Metaverse platforms; many of these take place in games today SOCIAL ENTERPRISE Communication Social Networks Messaging Workplace and Productivity Browsing Search Telephony Dating/ Relationships Shopping and Marketplaces Events/ Performances/ Exhibits Learning Experience and Content Creation Sex and Pornography NFTs and Other Digital Goods Real Estate and Land Ownership Video Music Video Games Advertising/ Sponsorships/ Partnerships Trading and Finance Payments and Currency Gambling News Sports ECONOMIES MEDIA EXPERIENCES  112 METAVERSE Source: Activate analysis WWW
  • 114.
    Our research showsthat the majority of gamers participate in non- gaming, Metaverse-like activities inside of games  113 METAVERSE 1. “Gamers” are defined as adults aged 18+ who currently play video games. Sources: Activate analysis, Activate 2022 Consumer Technology & Media Research Study (n = 4,001), Activate 2022 Metaverse & NFT Consumer Research Study (n = 3,078), U.S. Census Bureau PARTICIPATION IN NON-GAMING ACTIVITIES OR EVENTS WITHIN VIDEO GAMES IN THE LAST 12 MONTHS, U.S., 2022, % GAMERS1 77% of gamers1 have participated in non- gaming activities within games in the last 12 months PARTICIPATION IN NON-GAMING ACTIVITIES OR EVENTS WITHIN VIDEO GAMES IN THE LAST 12 MONTHS, U.S., 2022, % GAMERS1 Watching movies, TV shows, and previews Socializing / meeting new people Creating/personalizing a virtual character/avatar Creating/personalizing virtual items Creating/personalizing virtual places or maps Purchasing virtual goods Betting/gambling Creating new games/levels Trading or gifting items Purchasing physical goods 18% 19% 21% 21% 24% 24% 30% 34% 47% 48% 100% = 148M U.S. Gamers1
  • 115.
    10:12 10:06 10:25 202M 140M 81M 27M 20M Other 4 2 1 3 5 Today, there areover 300M people globally who spend a great part of their lives in the major virtual world Metaverse games  114 METAVERSE 1. Estimate. 2. As of Aug. 2021. 3. As of June 2020. 4. Includes MAUs for all Blizzard Entertainment games as of June 2022. 5. As of Mar. 2022. Users predominantly in China, Japan, and South Korea. 6. Includes France, Germany, UK, and U.S. Sources: Activate analysis, Company filings, Company press releases, DappRadar, Naver, Newzoo, RTrack, Yahoo GLOBAL MAUs AVERAGE TIME SPENT PER MONTH BY METAVERSE GAME, SELECT COUNTRIES6, 2022, HOURS:MINUTES
  • 116.
    Media and TechnologySuper Users are Metaverse Natives; over 80% of Super Users have used a Metaverse platform in the last 12 months  115 ROBOTO BOLD 16PT, ROBOTO REGULAR 16 PT METAVERSE 1. “Metaverse platforms” are defined as platforms with immersive virtual worlds, within which consumers can explore with a personalized character/avatar, interact with other users, and participate in a range of activities (e.g. online concerts, online games, online work meetings). 2. “Super Users” are a segment who over-index on daily time spent with technology and media (18:55 vs. 9:21 for all other users). Sources: Activate analysis, Activate 2022 Consumer Technology & Media Research Study (n = 4,001) (78% OF POPULATION) (22% OF POPULATION) SEE SUPER USERS SECTION FOR DETAILED DEFINITION AND ANALYSIS Super Users All Other Users 21% 81% EXAMPLE METAVERSE PLATFORMS1 USAGE OF METAVERSE PLATFORMS1 IN THE LAST 12 MONTHS, U.S., 2022, % ADULTS AGED 18+ 2
  • 117.
    Super Users –the most important user segment for all technology and media businesses – will be critical for the growth of Metaverse platforms CREATION ACTIVITIES IN THE METAVERSE Creating/personalizing a virtual character/avatar or virtual items Creating/personalizing virtual places or maps SOCIAL ACTIVITIES IN THE METAVERSE Attending live performances, sporting events, or esports events Socializing with friends/family or meeting new people Traveling to virtual versions of real-world locations Attending educational classes, work-related meetings, or networking events TRANSACTIONAL ACTIVITIES IN THE METAVERSE Purchasing or selling virtual goods Purchasing or selling physical goods Investing, lending, or borrowing money  116 INTEREST IN PARTICIPATING IN SELECT METAVERSE ACTIVITIES IN THE NEXT 12 MONTHS, U.S., 2022, % ADULTS AGED 18+ METAVERSE 1. “Super Users” are a segment who over-index on daily time spent with technology and media (18:55 vs. 9:21 for all other users). Sources: Activate analysis, Activate 2022 Consumer Technology & Media Research Study (n = 4,001) 10% 17% 15% 19% 21% 20% 25% 14% 20% 57% 69% 71% 66% 71% 72% 73% 67% 76% % Super Users % All Other Users EXTREMELY OR VERY INTERESTED IN… (78% OF POPULATION) (22% OF POPULATION) 1 SEE SUPER USERS SECTION FOR DETAILED DEFINITION AND ANALYSIS
  • 118.
    We see eightfoundational elements of the Metaverse and proof points for each of these elements today  117 METAVERSE Source: Activate analysis IMMERSIVE EXPERIENCES MIXED REALITY VIRTUAL OWNERSHIP ECONOMY CREATION AND AGENCY IDENTITY DIGITAL TWINS SOCIAL INTERACTIONS • Immersive virtual worlds • Interactive digital overlays in physical spaces • Persistent digital content anchored to real-world locations • Virtual goods ownership and usage • Authenticated ownership of digital/ physical assets • Marketplaces • Branding and advertising • In-game experience creation • Design and development tools • Personalized avatars enabling self-expression • Persistent identity • Digital counterparts to physical spaces/objects with real-time synchronization • Immersive social communities and experiences • Enterprise collaboration / distributed work • Interactive gameplay in virtual worlds • Presence in simulated environments ELEMENTS OF THE METAVERSE
  • 119.
    IMMERSIVE EXPERIENCES ✔︎ ✔︎✔︎ ✔︎ ✔︎ IDENTITY ✔︎ ✔︎ ✔︎ ✔︎ ✔︎ CREATION & AGENCY ✔︎ ✔︎ ✔︎ ✔︎ ✔︎ DIGITAL TWINS ✔︎ ✔︎ ✔︎ SOCIAL INTERACTIONS ✔︎ ✔︎ ✔︎ ✔︎ ✔︎ VIRTUAL OWNERSHIP ✔︎ ✔︎ ✔︎ ✔︎ ✔︎ ECONOMY ✔︎ ✔︎ ✔︎ ✔︎ ✔︎ MIXED REALITY ✔︎ ✔︎ Virtual world video games already include most of the eight foundational Metaverse elements  118 ROBOTO BOLD 16PT, ROBOTO REGULAR 16 PT METAVERSE Note: Information as of Oct. 20, 2022. Includes early-stage indicators for Metaverse applications (e.g. ability to create environments that mirror the real world, ability to create personalized avatars, ability to purchase virtual goods). Sources: Activate analysis, Company sites ✔︎ FEATURE/CAPABILITY AVAILABLE SELECT VIRTUAL WORLDS AND METAVERSE ELEMENTS METAVERSE ELEMENTS MAJOR VIRTUAL WORLD GAMES
  • 120.
    EXPLORE WORLD OFWARCRAFT’S OPEN-GAME WORLD, COMPLETE QUESTS, AND INTERACT WITH OTHER PLAYERS ATTEND A LIVE VIRTUAL MUSIC PERFORMANCE WITH FRIENDS IN SOUNDSCAPE VR PARTICIPATE IN A 3D VIRTUAL KARAOKE EXPERIENCE IN XRSPACE PARTYON BATTLE OTHER USERS IN REC ROOM’S LASER TAG ARENA Shared immersive experiences will be the foundation for Metaverse platforms  119 METAVERSE Sources: Activate analysis, Company sites EXAMPLES OF IMMERSIVE EXPERIENCES WITHIN THE METAVERSE ACTIVATE PERSPECTIVE Immersive experiences in the Metaverse will: • Grow in variety and number as the Metaverse develops • Provide opportunities to meet people through both structured activities (e.g. sports, games, concerts) and non-structured activities (e.g. open space exploration) • Increasingly replicate real-life activities and experiences as Metaverse participation becomes a more mainstream behavior • Evolve in complexity, detail, and functionality to offer virtual experiences with greater similarity to physical world activities IMMERSIVE EXPERIENCES
  • 121.
    SPEND TIME WITHFRIENDS IN FORTNITE’S PARTY WORLDS PARTY WITH PARIS HILTON AT CRYPTOWEEN IN ROBLOX AND THE SANDBOX PLAY GAMES OF PICKUP BASKETBALL IN NBA 2K22 “THE NEIGHBORHOOD” CELEBRATE A VIRTUAL WEDDING IN ANIMAL CROSSING Social experiences and interactions will increasingly take place in Metaverse platforms  120 METAVERSE Sources: Activate analysis, Company sites EXAMPLES OF SOCIAL INTERACTIONS WITHIN THE METAVERSE ACTIVATE PERSPECTIVE Social interactions in the Metaverse will: • Include the ability to engage with real-life friends and meet new people in virtual worlds (e.g. open spaces, events, meetings) • Enhance activities with live user-to-user interaction (e.g. virtual gameplay) • Develop additional applications as more activities become available (e.g. dating, attending festivals, professional networking) • Supplement or even replace an increasing number of real- world social events over time (e.g. parties, weddings, sports games) SOCIAL INTERACTIONS
  • 122.
    DEVELOP AND SHAREIDEAS REMOTELY IN CUSTOMIZED, FLEXIBLE ROOMS WITH HORIZON WORKROOMS BUILD IMMERSIVE WORKSPACES TO GATHER WITH COWORKERS AND ATTEND MEETINGS WITH MESH FOR TEAMS Metaverse workplace collaboration platforms will provide a more immersive vehicle for virtual interaction and an expansion of video conferencing technologies  121 ROBOTO BOLD 16PT, ROBOTO REGULAR 16 PT METAVERSE Sources: Activate analysis, Company sites Mesh EXAMPLES OF EARLY METAVERSE WORKPLACE COLLABORATION ACTIVATE PERSPECTIVE Collaboration in the Metaverse will: • Enable deeper levels of immersion over time • Leverage avatars to create a sense of presence and provide users with agency over their own representation • Include a broadening set of tools and resources to facilitate immersive collaboration (e.g. virtual conference rooms, shared whiteboards, spatial audio) • Allow users to collaborate directly on files/projects as if in person together (e.g. object manipulation, 3D physical objects, interoperability of files across platforms) SOCIAL INTERACTIONS
  • 123.
    Digital twins willprovide a bridge between the real world and virtual worlds  122 EXAMPLES OF EARLY METAVERSE DIGITAL TWINS METAVERSE Sources: Activate analysis, Company sites BuildTheEarth is an open- contribution effort to recreate the world at a 1:1 scale in Minecraft Currently, BuildTheEarth has over 4,700 ongoing build projects across more than 7,000 square kilometers Real estate giant Jamestown and digital assets investor Digital Currency Group partnered to recreate One Times Square in Decentraland The build area spans 170 LAND parcels and was launched on New Year’s Eve with the MetaFest 2022 global party HDR, Inc. and Seattle City Light developed a digital twin model of Diablo Dam down to a 2cm visual accuracy through high-res photography The model incorporates data from additional technologies for a holistic view of the dam (e.g. piezometers, seepage/ leakage detectors, ground- penetrating radar) ACTIVATE PERSPECTIVE Digital twins in the Metaverse will: • Serve as digital replications of a growing number of real-world systems, objects, and locations • Develop to be larger, more complex, and more synchronized with their real- world counterparts • Incorporate a range of data types beyond visual inputs (e.g. spatial data, performance data, health data) • Become increasingly accessible for public viewing, usage, and contribution • Feature two-way synchronization, more closely linking the physical and digital worlds (e.g. products, changes, ownership) DIGITAL TWINS
  • 124.
    AZURE DIGITAL TWINS: Allowsusers to create digital models of buildings, factories, energy networks, railways, cities, and more NVIDIA OMNIVERSE DIGITAL TWINS: Enables users to develop physically accurate, AI-enabled virtual simulations of real world environments GE DIGITAL TWIN SOFTWARE: Allows users to create digital twins that represent an individual asset, an integrated system of assets, or a fleet of assets Example Applications: Ansys, Bentley Systems, Bosch, ICONICS, Samsung, and Willow use Azure Digital Twins in their software applications Example Applications: BMW uses NVIDIA’s Omniverse platform to build digital twins for 31 different factories; individual creators and developers can download, use, and contribute to NVIDIA Omniverse for free Example Applications: Chevron uses GE’s Digital Twin software for predictive maintenance in its oil fields and refineries The tools to build digital twins are becoming accessible to enterprise and SMBs to create their own digital models of environments  123 ROBOTO BOLD 16PT, ROBOTO REGULAR 16 PT METAVERSE Sources: Activate analysis, Company sites EXAMPLES OF DIGITAL TWINS WITH ENTERPRISE AND SMB USE CASES ACTIVATE PERSPECTIVE Digital twins in the Metaverse will: • Be applied to a greater set of enterprise use cases and leveraged across a widening set of businesses • Become increasingly accessible to SMBs and consumers, in addition to enterprises, as tools for building and using digital twins become more user-friendly • Evolve to support systems with greater size and complexity as technology improves DIGITAL TWINS
  • 125.
    Interoperability (i.e. use thesame avatar in separate platforms and environments) Personalization (i.e. customize how one wants to be perceived in a virtual world through self-expression) Authentication (i.e. establish procedures for identify verification to ensure security and build trust between users) Privacy (i.e. provide users the choice over how their personal data and digital identity is used) People will have an expansive set of options to define their Metaverse identity – either as themselves today, an idealized version, or entirely new person  124 IMPORTANCE OF IDENTITY IN THE METAVERSE METAVERSE Sources: Activate analysis, Company sites KEY ELEMENTS FOR IDENTITY IN THE FUTURE STATE OF THE METAVERSE ALTSPACEVR CUSTOMIZABLE AVATARS GENIES DIGITAL 3D AVATARS IDENTITY WILL BE CORE TO THE METAVERSE • Personalized identities will allow people to reinvent themselves, reflecting who they are and want to be • The ability to use a consistent identity across platforms will serve to unify the Metaverse across separate systems • Building the infrastructure and systems to ensure security, privacy, and protections for participants will be critical to the development of the Metaverse IDENTITY
  • 126.
    CREATING/PERSONALIZING AN AVATAR CREATING/PERSONALIZING VIRTUAL ITEMS CREATING/PERSONALIZING VIRTUALPLACES OR MAPS CREATING NEW GAMES OR LEVELS User creation and agency will be critical to the full development of Metaverse platforms; people will expect to create and build themselves (not just accept a world created for them)  125 METAVERSE 1. “Interested” includes consumers who are extremely or very interested in participating in the future. Sources: Activate analysis, Activate 2022 Consumer Technology & Media Research Study (n = 4,001) 35% OF U.S. ADULTS ARE INTERESTED1 IN PERSONALIZING THEIR METAVERSE EXPERIENCES THROUGH CREATION-BASED ACTIVITIES 29% 27% 26% 23% INTEREST1 IN CREATION ACTIVITIES IN THE METAVERSE, U.S., 2022, % ADULTS AGED 18+ CREATION AND AGENCY
  • 127.
    User creation andagency are core to today’s major Metaverse platforms and games  126 ROBOTO BOLD 16PT, ROBOTO REGULAR 16 PT METAVERSE Sources: Activate analysis, Company filings, Company press releases, Company sites • Roblox experiences are built almost entirely by users and developers • Roblox has more than 10M developers globally who have built over 29M virtual experiences • In 2021, Roblox paid out over $500M in in-game currency to developers and creators, up by 52% from 2020 — 2,200 creators earned over $10K, and 500 creators earned over $100K • Rec Room enables users to build, create, and play games in rooms, with over 12M rooms created as of Dec. 2021 • Rec Room also offers community programs to educate and connect creators • During Q1 2021, Rec Room paid creators $1M for their contributions to the platform • Fortnite allows players to make unique islands and games to share with friends through its Creative Mode • Fortnite also features new games on their discovery page to encourage exploration of user- generated content • Over 50% of playtime among Fortnite users is spent with content made by other players • Minecraft users can build worlds in Creative Mode and develop story-based games in Adventure Mode • Users can monetize creations through the Minecraft Marketplace (e.g. maps, mini games, skins) • As of Q3 2021, creators have generated over $350M in revenue for Minecraft from over 1B downloads of mods, add- ons, and experiences EXAMPLES OF USER-GENERATED CONTENT AND CREATOR ECONOMIES WITHIN THE METAVERSE ACTIVATE PERSPECTIVE • The Metaverse will be built by both professional developers and everyday users • User-generated creation will lead to a rapid proliferation of virtual content and Metaverse experiences • Tools for content creation will become more intuitive, widely available, and easy to use, allowing for greater participation, creation, and sharing of unique experiences (e.g. A.I.-enhanced hyper- personalization of avatars, drag-and-drop tools for in-game creation and customization, and stable diffusion to create original and explicit image and video content) • The development of Metaverse economies, virtual ownership, and content monetization will create an ecosystem that fosters user-led creation CREATION AND AGENCY
  • 128.
    Unity’s ProBuilder isa hybrid design tool with tutorials for beginners and a consumer- friendly interface, providing easy access to world generation and object modeling Adobe Substance 3D Modeler, available on desktop and in VR with a free trial, allows users to create 3D models Consumers of all design backgrounds can create in Meta Horizon Worlds by leveraging templates and tutorials in build mode Everyday users can leverage Microsoft Mesh’s simple menu of creative actions to quickly build collaborative spaces for free Roblox Studio is a free immersive creation engine that users can access on their own Windows or Mac devices Creative mode in Minecraft is free and simple, and enables users to generate custom content across all platforms Unreal Engine is free for all creators, and the Blueprints Visual Scripting system allows beginners to create game elements without writing any code Consumerization of development tools will fuel expanded Metaverse creation and participation  127 ROBOTO BOLD 16PT, ROBOTO REGULAR 16 PT METAVERSE Sources: Activate analysis, Company sites EXAMPLES OF CREATOR TOOLS WITHIN THE METAVERSE ACTIVATE PERSPECTIVE Developer tools will evolve to include: • Increasingly accessible versions for everyday consumers (e.g. user-friendly interfaces, project templates, free pricing) • More complex capabilities and toolsets available to expand the possibilities of creation • More comprehensive integration of data, analytics, and AI services to fuel creation in the Metaverse • Ability to import content from third-party tools and other platforms, further enabling user creativity and unifying content across otherwise siloed experiences CREATION AND AGENCY
  • 129.
    Virtual economies, createdby companies and users, will become increasingly sophisticated and expansive; we expect that a substantial number of people will make their entire living in the Metaverse Zepeto users can design and sell clothes to other users on the platform, earning a revenue share with in-game currency In The Sandbox, users can purchase, sell, and rent land to other users, including through secondary markets (e.g. OpenSea, Rarible) Second Life players can generate income from designing and selling goods on the platform (e.g. homes, furniture, vehicles) and can hire other players to fulfill certain roles (e.g. shop attendants, security agents, real estate agents) Developers on Roblox can earn money by designing and selling access to games, experiences, and virtual items, with Roblox paying out over $500M to developers in 2021  128 EXAMPLES OF VIRTUAL ECONOMIES WITHIN THE METAVERSE METAVERSE Sources: Activate analysis, Company press releases, Company sites ACTIVATE PERSPECTIVE • Building blocks of the Metaverse economy will include: - Digital goods/services (e.g. skins for avatars, virtual fashion, virtual makeup) - eCommerce (e.g. shopping for physical goods in a virtual environment) - Advertising (e.g. showrooms, product testing, product placement) • Brands will utilize both virtual and real-world storefronts to engage with customers - Digital outfits from Balenciaga, Prada, and Thom Browne are coming to Meta's soon-to-be-unveiled Avatar Store ECONOMY
  • 130.
    One world willnot be enough: brands will need to build a presence in multiple Metaverse platforms and virtual worlds  129 ROBOTO BOLD 16PT, ROBOTO REGULAR 16 PT METAVERSE Sources: Activate analysis, Company sites Visit Ralph Lauren’s Winter Escape in Roblox to enjoy winter activities and discover exclusive Ralph Lauren styles Participate in Puma Mania in NBA 2K22 The City, receiving bonus XP for playing games while wearing Puma gear Unlock Star Wars skins in Fortnite and wield signature lightsabers and blaster rifles in combat Play as Die Hard’s John McClane in Call of Duty: Warzone and complete special quests inside Die Hard- themed locations EXAMPLES OF IN-GAME BRAND PLACEMENTS ECONOMY
  • 131.
    Fortnite partnered withthe NBA to celebrate the NBA’s 75th anniversary by offering a collection of transactable in-game character skins modeled after NBA team apparel and uniforms Nike partnered with Roblox to create a Nike-branded virtual world called Nikeland where users can buy virtual goods from Nike, which has reached over 21M visitors as of Sept. 2022 Decentraland users can display owned 2D NFTs on the platform, including displaying virtual art galleries in owned spaces Zara partnered with Zepeto in Mar. 2022 to launch a limited- edition fashion collection for users’ avatars, including a range of apparel, makeup, and accessories Virtual ownership will be more than just virtual goods; it will be about self-expression, prestige, personalization, and the fundamental need to belong  130 EXAMPLES OF OWNING VIRTUAL GOODS WITHIN THE METAVERSE METAVERSE Sources: Activate analysis, Company press releases, Company sites ACTIVATE PERSPECTIVE • Virtual ownership will become more mainstream as platforms make items more attainable, a wider range of items become available, and a greater number of brands and users participate • Virtual goods will hold value for consumers (e.g. self- expression, status, exclusivity, personalization, ability to trade) • Platforms will explore select circumstances in which consumers can access owned virtual goods from other platforms • Physical items will be paired with ownership of digital items (e.g. ownership of real-world items will be reflected on virtual platforms) VIRTUAL OWNERSHIP
  • 132.
    Mixed reality willsignificantly enhance immersion but will not be critical to the growth of the Metaverse; we forecast that VR and AR headset sales will fall short in reaching the great majority of potential Metaverse users  131 METAVERSE 2021 2022E 2023E 2024E 2025E 2026E 44.4M 35.5M 27.9M 21.9M 16.2M 12.3M 29.0M 25.9M 22.6M 19.1M 15.5M 11.9M 0.4M 0.7M 2.8M 5.2M 9.6M 15.4M Augmented Reality (AR) Virtual Reality (VR) ACTIVATE FORECAST 1. Excludes Google Cardboard and other headsets with no built-in technology. Figures do not sum due to rounding. Sources: Activate analysis, AR Insider, Company press releases, Company sites, eMarketer, IDC, Morgan Stanley Research, Omdia, PricewaterhouseCoopers, Road to VR, Sensor Tower, Statista, Steam Spy, Strategy Analytics, SuperData, VGChartz 2021-2026E CAGR: 107% 20% 29% AR AND VR HEADSET UNIT SALES1, GLOBAL, 2021-2026E, MILLIONS UNITS MIXED REALITY
  • 133.
    Actual usage ofVR headsets for non-gaming/Metaverse activities has far exceeded the original purchase intent for the headset Video games Virtual tours or travel Entertainment videos / documentaries Social interactions Live event streaming Educational purposes Therapeutic activities Shopping Job training / job-related activities 33% 35% 37% 40% 42% 43% 47% 48% 49% 19% 19% 25% 23% 25% 25% 28% 28% 46% Reason for purchasing Currently using VR for this purpose  132 REASONS FOR PURCHASING AND USING VR HEADSETS, U.S., 2022, % VR HEADSET USERS METAVERSE 1. “Gamers” are defined as adults aged 18+ who currently play video games. Sources: Activate analysis, Activate 2022 Metaverse & NFT Consumer Research Study (n = 3,078) 91% of VR users are gamers1, and 78% of VR users use VR for non- gaming activities MIXED REALITY
  • 134.
    Over the nextyears, companies building the Metaverse will be part of an extensive ecosystem  133 METAVERSE Note: Not exhaustive. Sources: Activate analysis, Company sites WEIBO TELEGRAM EXAMPLES OF COMPANIES POWERING THE METAVERSE ECOSYSTEM DECENTRALAND FACEBOOK FACEBOOK SNAP INC. PINDUODUO DEVELOPERS/ PUBLISHERS DIGITAL PROPERTY & NFTs CRYPTO & PAYMENTS ECOMMERCE MEDIA AR/VR SOCIAL & MESSAGING COMMUNICATION & COMPUTING GAMES & VIRTUAL SPACES
  • 135.
    The major technologyand gaming companies will build out their capabilities across each element of the Metaverse  134 METAVERSE Note: Not exhaustive. Information as of Oct. 20, 2022. Categorization reflective of forward-looking indicators for Metaverse applications (e.g. NFTs for virtual ownership, real-time synchronization for digital twins). Sources: Activate analysis, Company sites Immersive Experiences Mixed Reality: AR Mixed Reality: VR Social Interactions Roblox Chat & Community Space Creation & Agency Identity Digital Twins Economy Game Shop Virtual Ownership Roblox Avatars Roblox Studio VR Unreal Engine Google Chrome Avatar Google Lens Google Maps Live View Google Earth VR Google Play YouTube VR Google Cloud: Supply Chain Twin and Pulse YouTube VR NFT Sharing with Verified Ownership on Instagram/Facebook Meta 3D Avatar Instagram Messenger Gaming Azure Digital Twins Mesh NFTs in Windows 11 Microsoft Store Teams Altspace VR MY APP Tencent Cloud Magic Core (No longer issuing new NFTs) QQ (Series D Investment) PlayStation Store PlayStation Plus Partnership PlayStation ARKit Apple NFT Trading Cards (Rumored) RoomPlan Build NFT Applications IoT TwinMaker AR View Luna Teams and Mesh Avatars Fortnite Avatars Reality Scan Unreal Engine Reality Composer (Rumored) Pro Robux Mesh Mesh iMessage Store Mesh Enable NFT Games via Epic Games Store (e.g. Blankos Block Party) Co-development Guardian Creation (Series D Investment)
  • 136.
    We expect tosee significant and sustained investment in innovation over the next years  135 METAVERSE Note: Not exhaustive. Companies listed by primary category but may have capabilities in other categories listed. Information as of Oct. 24, 2022. Sources: Activate analysis, Company press releases, Company sites EXAMPLE INVESTORS IMMERSIVE EXPERIENCES MIXED REALITY SOCIAL INTERACTIONS CREATION & AGENCY IDENTITY DIGITAL TWINS ECONOMY VIRTUAL OWNERSHIP GRAVVITY JADU AR
  • 137.
    Interoperability between Metaverseplatforms will take place through third-party companies and applications, creating significant opportunities for all businesses to capitalize on the potential of the Metaverse  136 ROBOTO BOLD 16PT, ROBOTO REGULAR 16 PT METAVERSE Source: Activate analysis INTEROPERABILITY LAYERS OF THE METAVERSE PAYMENTS (e.g. single digital wallet, virtual currencies, credit) SOCIAL (e.g. Discord, VRChat, AltspaceVR) MARKETING (e.g. branding, sponsorship, advertising) ECONOMIES/ BUSINESS (e.g. virtual goods and services, commerce, reselling) CONSUMER COMMUNICATION (e.g. advanced messaging, immersive video conferencing, virtual collaboration) EMBEDDED MEDIA (e.g. audio, video, live) USER IDENTITY (e.g. profile, user data, credentials)
  • 138.
    The Metaverse willbe the user interface for Web3, similar to the role the browser played with the internet  137 METAVERSE Source: Activate analysis A digitally native world in which we will spend our time working, socializing, and engaging in all types of activities Metaverse The Metaverse will provide a unified, user-friendly interface that can integrate complex Web3 elements A set of decentralized protocols and technologies that can be used to build parts of the Metaverse and secure the new communities and economies that it will enable WEB3 NFTs Decentralized Infrastructure Blockchain Cryptocurrencies Decentralized Finance (DeFi) Decentralized Identity Decentralized Autonomous Organizations (DAOs) Artificial Intelligence Immersive Experiences Social Interactions Digital Twins Identity Creation and Agency Economy Virtual Ownership Mixed Reality The Metaverse and Web3 are two separate concepts • Metaverse interfaces will be the user-friendly way to interact with Web3 • Web3 will set the future standards and technology foundations for Metaverse experiences • Developments in both will be required to fully realize the potential of the Metaverse ACTIVATE PERSPECTIVE
  • 139.
    www.activate.com  138 CONTENTS PAGE $420BGlobal Technology and Media Growth Dollars Up for Grabs 4 Consumer Technology and Media Time and Attention 9 Super Users: The Critical Segment for Technology and Media Companies 15 eCommerce and Marketplaces: Growth will Continue Across Categories With Major Consumer Trends Serving as Tailwinds 29 Video: Streaming and Social Drive Growth 47 Gaming and Esports: A Mainstream Behavior and Precursor to The Metaverse 78 NFTs: Past the Hype Cycle, Towards Tangible Use Cases 95 Metaverse: Time for Practical Applications 108 Audio: Digital Audio Will Drive More Consumer Time and Spend 138 Sports and Sports Betting: Younger Next-Gen Sports Fans Drive Growth 152 Digital Fitness: Consumer Adoption Will Continue to Grow 167
  • 140.
    Consumer audio timewill continue to increase and shift to digital; by 2026, 63% of audio time will be digital, up from 51% in 2019  139 AVERAGE DAILY AUDIO TIME PER ADULT AGED 18+ BY TYPE1, U.S., 2019-2022E VS. 2026E, HOURS:MINUTES AUDIO 1. Figures do not sum due to rounding. 2. “Digital audio” includes audio streamed via mobile and desktop/laptop. 3. “Radio” excludes digital radio. 4. “Music listeners” are defined as adults aged 18+ who spend any time listening to music. 5. “Music services” include free and paid services used for listening to music through any format excluding terrestrial radio. Sources: Activate analysis, Activate 2022 Consumer Technology & Media Research Study (n = 4,001), eMarketer, GWI, Music Biz -1.9% 2019 2020 2021 2022E 2026E Digital Audio2 ACTIVATE FORECAST 2:51 1:11 1:40 0.6% 2022E-2026E CAGR: 1:06 1:50 2:55 Radio3 Terrestrial & Satellite 88% of music listeners4 use a free or paid music service5 at least once per month 64% of music listeners4 use multiple music services5 at least once per month Music listeners4 are now more likely to use a smartphone or tablet to listen to music than any other device CORE BEHAVIORS DRIVING INCREASED TIME SPENT WITH DIGITAL AUDIO2 1:14 1:30 1:11 1:37 2:43 2:44 2:48 2.3% 63% 37% 1:23 51% 1:20 49%
  • 141.
    2021 2022E 2023E2024E 2025E 2026E $41.9B $38.3B $35.1B $32.2B $29.7B $27.4B $51.9B $51.7B $51.5B $51.4B $51.3B $51.4B Significant growth in the global music industry will continue in the coming years, reaching $94B in revenue by 2026, driven almost entirely by digital audio  140 MUSIC REVENUE BY TYPE (EXCLUDING LIVE MUSIC)1, GLOBAL, 2021-2026E, BILLIONS USD 1. Figures do not sum due to rounding. 2. “Digital” is defined as revenue generated from paid digital downloads of any licensed recorded music and from subscriptions and advertising on music streaming platforms, including platforms that offer podcasts (e.g. Spotify). 3. “Non-Digital” is defined as revenue generated from the use of music in other media (e.g. television), paying record companies for the right to play their music publicly, any purchase of physical audio formats (e.g. vinyl), satellite radio subscriptions and advertising (including non-music content such as talk and sports), and AM/FM radio stations and networks (including non-music content such as talk and sports). Sources: Activate analysis, Goldman Sachs, Grand View Research, IFPI, Omdia, PricewaterhouseCoopers, Recording Industry Association of America, SiriusXM, Statista 2021-2026E CAGR: ACTIVATE FORECAST $93.8B $90.0B $86.6B $83.6B $81.0B $78.7B Share of growth dollars from digital, 2021-2026E: 96% Digital2 Non-Digital3 Digital will account for 45% of music revenue (excluding live music) by 2026 3.6% 8.9% 0.2% 35% $27.4B 65% $51.4B 45% $41.9B 55% $51.9B AUDIO
  • 142.
    More listeners thanever are using multiple free and paid music services  141 NUMBER OF FREE OR PAID MUSIC SERVICES1 USED AT LEAST ONCE PER MONTH, U.S., 2019-2022, % MUSIC LISTENERS2 1. “Music services” include free and paid services used for listening to music through any format excluding terrestrial radio. 2. “Music listeners” are defined as adults aged 18+ who spend any time listening to music. 3. “No services” includes those who do not use music services (e.g. only listen through terrestrial radio, CDs, vinyl). 4. Figures do not sum due to rounding. Sources: Activate analysis, Activate 2019 Consumer Technology & Media Research Study (n = 4,006), Activate 2020 Consumer Technology & Media Research Study (n = 4,003), Activate 2021 Consumer Technology & Media Research Study (n = 4,018), Activate 2022 Consumer Technology & Media Research Study (n = 4,001) 2019 2020 2021 2022 40% 38% 33% 20% 24% 21% 22% 24% 24% 26% 29% 39% 12% 15% 16% 17% 1 Service 2 Services 3+ Services No Services3 64% of music listeners2 use multiple music services1 per month, up from 43%4 in 2019 AUDIO
  • 143.
    YouTube is themost used music service among music listeners, followed by Spotify and Amazon Music  142 FREE OR PAID MUSIC SERVICES1 USED AT LEAST ONCE PER MONTH, U.S., 2022, % MUSIC LISTENERS2 5% 5% 5% 5% 6% 10% 15% 19% 21% 23% 35% 35% 61% / 3 1. “Music services” include free and paid services used for listening to music through any format excluding terrestrial radio. 2. “Music listeners” are defined as adults aged 18+ who spend any time listening to music. 3. Includes consumers who use Amazon Music through their Amazon Prime subscription, as well as consumers who use the standalone Amazon Music service. Sources: Activate analysis, Activate 2022 Consumer Technology & Media Research Study (n = 4,001) AUDIO
  • 144.
     143 1. “Music listeners”are defined as adults aged 18+ who spend any time listening to music. 2. Includes using headphones. Sources: Activate analysis, Activate 2021 Consumer Technology & Media Research Study (n = 4,018), Activate 2022 Consumer Technology & Media Research Study (n = 4,001) PAID MUSIC SUBSCRIPTION OWNERSHIP, U.S., 2021 VS. 2022, % MUSIC LISTENERS1 MUSIC LISTENER1 DEMOGRAPHICS AND BEHAVIORS, U.S., 2022, % MUSIC LISTENERS1 2021 2022 35% 34% 65% 66% Do not own a paid music subscription Own a paid music subscription 55% 29% 22% 39% 48% 49% % Non-Owners of Paid Music Subscriptions % Owners of Paid Music Subscriptions Are aged 55+ Have a household income of less than $50K Listen to music directly through a smartphone or tablet2 In 2021 and 2022, over a third of music listeners did not pay for a music service, presenting an opportunity to serve them via ad-supported offerings; these listeners are older, less affluent, and less likely to use mobile devices for music AUDIO
  • 145.
    17% 17% 29% 37% 42% 54% 54% 8% 8% 15% 19% 20% 24% 25% % Non-TikTok Users %TikTok Users TikTok has helped fuel consumer engagement with music; its users are significantly more likely to participate in music-related activities  144 PARTICIPATION IN MUSIC-RELATED ACTIVITIES IN THE LAST 12 MONTHS, U.S., 2022, % MUSIC LISTENERS1 1. “Music listeners” are defined as adults aged 18+ who spend any time listening to music. 2. “TikTok users” are defined as adults aged 18+ who use TikTok at least once per month. 3. “Music services” include free and paid services used for listening to music through any format excluding terrestrial radio. Sources: Activate analysis, Activate 2022 Consumer Technology & Media Research Study (n = 4,001) Followed an artist on social media Heard a new song on social media & sought it out on a music streaming service Discovered an artist that is now a favorite Shared an artist’s music or content on social media Purchased an artist’s merchandise Attended the same concert more than once Met an artist in person TikTok users2 are 1.5x as likely to attend concerts as non- users2 TikTok users2 spend 2.1x as much money on music and music services3 as non-users2 TikTok users2 use 1.8x as many music services3 as non- users2 2 2 AUDIO
  • 146.
    TikTok’s discovery featureshelp spur consumer interest in new artists and genres, further deepening engagement  145 SELECT TIKTOK DISCOVERY FEATURES 1. Only available for select songs. Sources: Activate analysis, TikTok Discover music by listening to songs on an artist’s profile Listen to full songs with Apple Music integration1 Use the in-app search feature to discover new music and sounds by artist, genre, or popularity AUDIO
  • 147.
    Nearly 40% ofmusic listeners create music or are interested in creating music, driving demand for creation and distribution tools that best serve the needs of independent creators  146 1. “Music listeners” are defined as adults aged 18+ who spend any time listening to music. Sources: Activate analysis, Activate 2022 Consumer Technology & Media Research Study (n = 4,001), Company press releases, Company sites MUSIC CREATION AND INTEREST IN MUSIC CREATION, U.S., 2022, % MUSIC LISTENERS1 19% 17% Create music Do not create music but are interested in creating music MAJOR MUSIC AND TECHNOLOGY COMPANIES ARE INVESTING IN CREATOR DISTRIBUTION TOOLS Gives independent artists distribution tools to share their music on major music streaming services, as well as marketing support to help promote their songs Enables creators to distribute their music on TikTok and all major music streaming services, providing artists with an opportunity to leverage TikTok as a major promotional channel Provides monthly grants of up to $100K to independent artists and helps them distribute their music through Snapchat Sounds Creator Fund X AUDIO
  • 148.
    The live musicindustry will surpass pre-COVID-19 levels by 2023, with high participation expected across age groups  147 1. Figures do not sum due to rounding. 2. “Sponsorship” includes revenue from sponsorship of live music events (advertising spending). 3. “Ticket sales” include revenue from consumer spend on tickets to live music events. Does not include revenue from merchandise or concessions. 4. “Music listeners” are defined as adults aged 18+ who spend any time listening to music. Sources: Activate analysis, Activate 2022 Consumer Technology & Media Research Study (n = 4,001), Omdia, PricewaterhouseCoopers, Statista 2.8% 2.9% 3.0% 2019-2026E CAGR: 2019 2020 2021 2022E 2023E 2024E 2025E 2026E $35.5B $33.8B $32.4B $30.8B $26.5B $11.9B $6.7B $29.1B $7.5B $7.1B $6.8B $6.4B $5.5B $2.5B $1.4B $6.1B $28.0B $26.7B $25.6B $24.4B $21.1B $9.5B $5.4B $23.1B Ticket Sales3 Sponsorship2 $1.4B Aged 18-34 58% Aged 35-54 57% IN-PERSON LIVE MUSIC REVENUE BY TYPE1, GLOBAL, 2019-2026E, BILLIONS USD INTENT TO ATTEND AN IN-PERSON CONCERT OR MUSIC FESTIVAL IN THE NEXT 12 MONTHS BY AGE GROUP, U.S., 2022, % MUSIC LISTENERS4 ACTIVATE FORECAST AUDIO
  • 149.
    While virtual eventattendance is down from 2021, consumers increasingly see virtual as a complement to, rather than a replacement for, in-person events, especially given the uniquely immersive experiences virtual events offer  148 EXAMPLES OF VIRTUAL LIVE MUSIC EVENT VR/AR TECHNOLOGY VR AND METAVERSE CONCERTS AR-ENHANCED STREAMING Artists are increasingly performing in VR and Metaverse concerts, in which users can watch artists through VR headsets or as avatars in virtual worlds With AR, artists are able to provide viewers at home with a differentiated experience compared to in-person live music events For Megan Thee Stallion’s 2022 VR tour, attendees were given VR headsets in select theaters for a more immersive concert experience Using AR technology, Flume provided at-home viewers of his 2022 Coachella performance with a unique set of visuals that were overlaid onto the YouTube livestream Grimes performed in her avatar form for the Metaverse Fashion Week in Decentraland Beyond Live, an online paid concert platform, leverages augmented reality to create visual experiences optimized for online audiences, such as integrating 3D graphics into performances ATTENDED A VIRTUAL LIVE MUSIC EVENT 1. “Music listeners” are defined as adults aged 18+ who spend any time listening to music. 2. Figures do not sum due to rounding. Sources: Activate analysis, Activate 2021 Consumer Technology & Media Research Study (n = 4,018), Activate 2022 Consumer Technology & Media Research Study (n = 4,001), ARPost, Company press releases, Company sites, TIME, Zero Density ATTENDED BOTH AN IN-PERSON AND VIRTUAL LIVE MUSIC EVENT 2021 2022 26% 22% 2021 2022 27% 30% YoY Change: -3pp YoY Change: +3pp2 LIVE MUSIC EVENT ATTENDANCE, U.S., 2021 VS. 2022, % MUSIC LISTENERS1 AUDIO
  • 150.
    Podcast listening isa core behavior for audio platforms to address, with significant potential for further user growth  149 MONTHLY PODCAST LISTENERS1, U.S., 2020-2022E VS. 2026E, MILLIONS LISTENERS AGED 12+ 1. “Podcast listeners” are defined as adults aged 12+ who spend any time listening to podcasts. 2. “Music services” include free and paid services used for listening to music through any format excluding terrestrial radio. Sources: Activate analysis, Activate 2019 Consumer Technology & Media Research Study (n = 4,006), Activate 2021 Consumer Technology & Media Research Study (n = 4,018), AdExchanger, Apple World Today, Apple WWDC 2018, Automotive News, Car & Driver, Cox Automotive, Digital Trends, Edison Research, eMarketer, Nielsen, Omdia, Pew Research Center, PricewaterhouseCoopers, Scarborough Research, TechCrunch, U.S. Bureau of Economic Analysis, U.S. Census Bureau, The Verge 2020 2021 2022E 2026E 159M 134M 123M 112M DRIVERS OF PODCAST GROWTH INTEGRATION OF PODCASTS INTO MUSIC STREAMING SERVICES Most major music services2 now allow users to listen to podcasts, providing consumers with a single platform for multiple audio behaviors INCREASING VALUE OF AD SPOTS IN PODCASTS Dynamic ad insertion will drive up the value of ad spots in podcasts — major acquisitions in adtech (e.g. Chartable and Podsights) have signaled a continued push into targeted advertising SOCIAL MEDIA PLATFORMS’ PUSH INTO THE PODCAST SPACE Social media companies are increasingly integrating podcasts into their platforms, driving new modes of podcast discovery and consumption 2022E-2026E CAGR: 4.4% ACTIVATE FORECAST AUDIO
  • 151.
    Most music andpodcast listeners use the same service to listen to both types of content; music services will continue to acquire and produce major podcast titles to drive consumer engagement  150 FREE OR PAID SERVICES USED AT LEAST ONCE PER MONTH FOR BOTH MUSIC AND PODCASTS, U.S., 2022, % MUSIC/PODCAST LISTENERS1 1. “Music/podcast listeners” are defined as adults aged 18+ who spend any time listening to both music and podcasts. Sources: Activate analysis, Activate 2022 Consumer Technology & Media Research Study (n = 4,001), Apple Podcasts, Billboard, Company press releases, Company sites, The Hollywood Reporter, iHeartMedia, TechCrunch, Variety SELECT PODCAST TITLES ACQUIRED BY MAJOR AUDIO PLATFORMS AUDIO PLATFORM PODCASTS of music/podcast listeners1 use the same service to listen to both music and podcasts 81% 2% 3% 5% 5% 8% 9% 12% 14% 30% 37% 39% SERVICES USED FOR BOTH MUSIC AND PODCASTS THE JOE ROGAN EXPERIENCE ARCHETYPES MORBID HELP! I SUCK AT DATING WITH DEAN, JARED & … SUAVE CONAN O’BRIEN NEEDS A FRIEND CALL HER DADDY AUDIO
  • 152.
    Consumers are highlyreceptive to podcast advertising; ad unit improvements, such as targeting and dynamic ad insertion, will continue to drive up the value of podcast inventory in the future  151 PODCAST AD RECEPTIVITY, U.S., 2022, % PODCAST LISTENERS1 1. “Podcast listeners” are defined as adults aged 18+ who spend any time listening to podcasts. 2. “Likely” is defined as extremely, very, somewhat, or slightly likely. Sources: Activate analysis, Activate 2022 Consumer Technology & Media Research Study (n = 4,001), Castos, Company press releases, Company sites, Digiday, RiversideFM 82% of podcast listeners1 are likely2 to look into a product/service being advertised during a podcast DYNAMIC AD INSERTION (2022) (2020) (2022) (2021) (2021) (2020) KEY ACQUISITIONS Ad spots increase in value as a result of the increased targeting and measurement capabilities dynamic ad insertion enables Advertisers can deliver advertisements on-demand into ad slots, as opposed to advertisements being “baked-in” as permanent, pre-recorded components of a podcast Advertisers can deliver different advertisements tailored to listeners based on their individual traits (e.g. geography, demographics) AUDIO
  • 153.
    www.activate.com  152 CONTENTS PAGE $420BGlobal Technology and Media Growth Dollars Up for Grabs 4 Consumer Technology and Media Time and Attention 9 Super Users: The Critical Segment for Technology and Media Companies 15 eCommerce and Marketplaces: Growth will Continue Across Categories With Major Consumer Trends Serving as Tailwinds 29 Video: Streaming and Social Drive Growth 47 Gaming and Esports: A Mainstream Behavior and Precursor to The Metaverse 78 NFTs: Past the Hype Cycle, Towards Tangible Use Cases 95 Metaverse: Time for Practical Applications 108 Audio: Digital Audio Will Drive More Consumer Time and Spend 138 Sports and Sports Betting: Younger Next-Gen Sports Fans Drive Growth 152 Digital Fitness: Consumer Adoption Will Continue to Grow 167
  • 154.
    We expect threemajor trends to drive sports revenue growth in 2023 and beyond  153 SPORTS & SPORTS BETTING Source: Activate analysis 1 2 3 EMERGENCE OF NEXT-GEN SPORTS FANS TRANSITION OF LIVE SPORTS TO STREAMING CONTINUED GROWTH OF SPORTS BETTING A younger generation of sports fans will drive growth in: • Live sports streaming • Non-live game content consumption • Participation in sports-related activities • Media companies will continue to transition live sports to streaming • Technology companies will increasingly enter live sports • Fans will adopt sports-focused streaming services • A growing number of states will pursue legalization • Overall consumer participation in sports betting will increase
  • 155.
    SPORTS FAN1 SEGMENT AGE GROUP % OF SPORTS FANS1 TOTAL POPULATION NEXT-GEN FANS2 LEGACYFANS3 There is a growing divergence in behavior between Next-Gen and Legacy Fans that will impact the future of the sports ecosystem  154 SPORTS FANS1 VS. NON-SPORTS FANS1, U.S., 2019-2022, % ADULTS AGED 18+ 2019 2020 2021 2022 30% 30% 37% 29% 70% 70% 63% 71% -8pp +7pp 0pp Sports Fans1 Non-Sports Fans1 18-34 32% 58M 35+ 68% 122M 1. “Sports fans” are defined as adults aged 18+ who followed at least one sport in the last 12 months (e.g. those attending live games in person, watching live games or game highlights, reading articles or statistics). 2. “Next-Gen Fans” are defined as sports fans aged 18-34. 3. “Legacy Fans” are defined as sports fans aged 35 or older. Sources: Activate analysis, Activate 2019 Consumer Technology & Media Research Study (n = 4,006), Activate 2020 Consumer Technology & Media Research Study (n = 4,003), Activate 2021 Consumer Technology & Media Research Study (n = 4,018), Activate 2022 Consumer Technology & Media Research Study (n = 4,001), U.S. Census Bureau SPORTS & SPORTS BETTING
  • 156.
    Live sports streamingcontinues to grow in 2022, driven by Next- Gen Fans who are avoiding the Pay TV bundle  155 LIVE SPORTS VIEWERSHIP BY VIEWING METHOD, U.S., 2019 VS. 2022, % SPORTS FANS1 2019 2022 29% 6% Paid video streaming service NEXT-GEN FANS2 ARE 25% LESS LIKELY TO WATCH LIVE SPORTS THROUGH PAY TV4… …AND 36% MORE LIKELY TO WATCH THROUGH A PAID VIDEO STREAMING SERVICE THAN LEGACY FANS3 In the last 12 months, I have watched live sports through… 1. “Sports fans” are defined as adults aged 18+ who followed at least one sport in the last 12 months (e.g. those attending live games in person, watching live games or game highlights, reading articles or statistics). 2. “Next-Gen Fans” are defined as sports fans aged 18-34. 3. “Legacy Fans” are defined as sports fans aged 35 or older. 4. “Pay TV” includes traditional Pay TV (i.e. TV delivered through a set-top box) and virtual Pay TV (i.e. TV delivered through the internet without a set-top box). 5. Value does not include viewership of Thursday Night Football on Amazon Prime. Sources: Activate analysis, Activate 2019 Consumer Technology & Media Research Study (n = 4,006), Activate 2022 Consumer Technology & Media Research Study (n = 4,001) 2019 2022 52% 67% Pay TV -15pp 4 29%5 +23pp 6% SPORTS & SPORTS BETTING
  • 157.
    NFL Case Study:Live sports streaming will continue to grow in 2023, as technology and media companies increasingly provide access to premier sports properties through their paid services  156 U.S. NFL LIVE SPORTS PROGRAMMING ACCESS FOR THE 2022-2023 SEASON 1. Value reflects NFL’s new contract term beginning in 2022. 2. “Pay TV” includes traditional Pay TV (i.e. TV delivered through a set-top box) and virtual Pay TV (i.e. TV delivered through the internet without a set-top box). Sources: Activate analysis, Bloomberg, Company sites, Fierce Video, MoffettNathanson, Sportico, The Sports Business Journal BROADCAST PARTNER FOX DISNEY PARAMOUNT COMCAST AMAZON The September 15th debut of Thursday Night Football on Prime Video averaged 13 million viewers, demonstrating to major leagues that streaming exclusives can reach a mass audience EST. ANNUAL CONTRACT VALUE1 $2.0B $2.7B $2.1B $2.0B $1.2B PROPERTY PAY TV2 CHANNEL FOX LOGO ESPN LOGO CBS LOGO NBC LOGO N/A INCLUDES DIGITAL RIGHTS STREAMING OPTION No digital streaming option Alternative broadcast on Digital simulcast full slate on Digital simulcast full slate on Exclusive rights on FIRST YEAR OF FULL STREAMING AVAILABILITY N/A 2021 2022 2022 2022 For the first time, 3 out of 5 major NFL broadcast properties will be fully available via streaming for the 2022-2023 season SPORTS & SPORTS BETTING
  • 158.
    Technology companies areincreasingly competing with traditional media companies for live rights, driving contract values to new heights  157 2018 2022E 2026E $29B $21B $18B ESTIMATED TOTAL ANNUAL VALUE OF LIVE SPORTS BROADCAST RIGHTS1, U.S., 2018 VS. 2022E VS. 2026E, BILLIONS USD PROPERTY PREVIOUS DEAL NEW DEAL DATA AS OF OCTOBER 2022 VALUE INCREASE Rights Owners Est. Annual Value2 Rumored Bidders3 Rights Owners Est. Annual Value2 $1.5B $2.5B 1.7X $0.7B $1.2B 1.8X $90M $250M 2.8X $5M $83M 17X SELECT EXAMPLES OF RISING CONTENT RIGHTS VALUATIONS DRIVEN BY EMERGENCE OF TECHNOLOGY COMPANIES INTO SPORTS Rumored 2022E-2026E CAGR: 8% 2018-2022E CAGR: 5% Technology company Traditional media company 1. Includes spend by U.S. TV networks and streaming services on rights to major U.S. leagues (i.e. MLB, NBA, NFL, NHL), international leagues (e.g. English Premier League, Formula 1), top leagues in other major sports (e.g. golf, motor racing, pro wrestling, soccer, tennis, UFC), college sports, and the Olympics. 2. Based on total value and length of contract. 3. “Rumored Bidders” excludes new rights owners. Sources: Activate analysis, The Athletic, Bloomberg, The Guardian, MoffettNathanson, The New York Times, Sports Business Journal, Variety, The Wall Street Journal SPORTS & SPORTS BETTING
  • 159.
    Next-Gen Fans aremore likely to use sports-focused streaming services and will fuel the continued growth of these services going forward  158 NUMBER OF SPORTS-FOCUSED STREAMING SERVICES USED1, U.S., 2022, % SPORTS FANS2 BY SEGMENT 1 SERVICE 2 SERVICES 3+ SERVICES HAVE NOT USED A SERVICE 1.6 AVERAGE # SPORTS-FOCUSED VIDEO STREAMING SERVICES USED 0.9 ON AVERAGE, NEXT-GEN4 FANS USE 1.8X AS MANY SERVICES 14% 29% 7% 13% 13% 16% 65% 42% Next-Gen Fans3 Legacy Fans4 EXAMPLE SPORTS-FOCUSED VIDEO STREAMING SERVICES 1. “Usage” is defined as having watched live sports through a sports-focused streaming service when the sport they follow was in season. 2. “Sports fans” are defined as followers (e.g. those attending live games in person, watching live games or game highlights, reading articles or statistics) of at least one sport in the last 12 months. 3. “Next-Gen Fans” are defined as sports fans between the ages of 18-34. 4. “Legacy Fans” are defined as sports fans aged 35 or older. Sources: Activate analysis, Activate 2022 Consumer Technology & Media Research Study (n = 4,001) SPORTS & SPORTS BETTING
  • 160.
    RSN subscriptions havedeclined faster than overall Pay TV subscriptions due to traditional and virtual Pay TV providers reducing carriage — the future role of RSNs in live sports is uncertain  159 TOTAL SUBSCRIPTIONS TO TOP 50 RSNs VS. PAY TV SUBSCRIPTIONS1, U.S., 2018-2022E, MILLIONS 2018 2019 2020 2021 2022E 80M 85M 89M 93M 97M 109M 125M 140M 158M 180M RSN Subscriptions Pay TV Subscriptions 2018-2022E CAGR: -12% 2018-2022E CAGR: -5% 1. “Pay TV subscriptions” are defined as total subscriptions to traditional and virtual Pay TV. 2. “Pay TV” includes traditional Pay TV (i.e. TV delivered through a set-top box) and virtual Pay TV (i.e. TV delivered through the internet without a set-top box). Sources: Activate analysis, Company sites, eMarketer, Fierce Video, MoffettNathanson, Nielsen, S&P Global, The Sports Business Journal, Stratechery, The Streamable, U.S. Census Bureau, Wells Fargo 1,2 RSN EXAMPLES KEY INSIGHT RSNs are declining faster than Pay TV1, as traditional and virtual Pay TV providers reduce RSN carriage or exclude them from the bundle INDUSTRY INSIGHTS • RSNs drive significant costs for traditional and virtual Pay TV providers — they are among the most expensive in the Pay TV bundle (top RSNs average $5-$8 in monthly affiliate revenue per subscriber) • Consumers are watching less live-game content on RSNs (e.g. the majority of RSNs saw year-over-year MLB ratings decline in the 2021-2022 season, regular-season NHL games on RSNs saw 23% ratings declines in 2021-2022) • To adapt to a shifting landscape, RSNs will increasingly go direct-to-consumer (e.g. Bally Sports+, NESN 360) • To be viable long-term, DTC services likely need to bundle SPORTS & SPORTS BETTING
  • 161.
    Next-Gen Fans consumean outsized share of non-live-game content compared to Legacy Fans – they spend significantly more time engaged with digital-native sports content via social media, YouTube, and podcasts  160 SHARE OF TIME SPENT CONSUMING SPORTS CONTENT BY CONTENT TYPE, U.S., 2022, % SPORTS FANS1 BY SEGMENT Next-Gen Fans Legacy Fans 29% 40% 71% 60% Non-Live- Game Sports Content Live-Game Sports Content CONSUMPTION OF NON-LIVE-GAME SPORTS CONTENT, U.S., 2022, % SPORTS FANS1 BY SEGMENT 34% 28% 18% 15% 30% 25% 16% 18% Engaging with social media content Watching YouTube Researching team/player statistics Listening to podcasts Watching docuseries Listening to radio shows Reading publications Watching talk/ highlight shows DIGITAL-NATIVE TRADITIONAL 1.8x 1.2x 1.6x 0.9x 0.9x 0.9x 1.2x 1.6x 11% 18% 15% 18% 18% 21% 24% 32% NEXT-GEN FANS LEGACY FANS 1. “Sports fans” are defined as followers (e.g. those attending live games in person, watching live games or game highlights, reading articles or statistics) of at least one sport in the last 12 months. 2. “Next-Gen Fans” are defined as sports fans between the ages of 18-34. 3. “Legacy Fans” are defined as sports fans aged 35 or older. Sources: Activate analysis, Activate 2022 Consumer Technology & Media Research Study (n = 4,001) 2 3 2 3 SPORTS & SPORTS BETTING
  • 162.
    Pay for asports editorial subscription Purchase access to a pay-per-view event Bet real money on fantasy sports Purchase sports collectibles/memorabilia Bet real money on sports3 Use a sports-focused streaming service Purchase sports merchandise Purchase a ticket to a live sporting event Next-Gen Fans are more likely to participate in sports-related spending activities — technology and media companies are diversifying their offerings to capture a greater share of Next-Gen Fan spend and attention  161 SPORTS-RELATED SPENDING BEHAVIORS IN THE LAST 12 MONTHS, U.S., 2022, NEXT-GEN FANS1 INDEXED TO LEGACY FANS2 1. “Next-Gen Fans” are defined as sports fans between the ages of 18-34. 2. “Legacy Fans” are defined as sports fans aged 35 or older. 3. Does not include fantasy sports leagues, contests, or office pools. Sources: Activate analysis, Activate 2022 Consumer Technology & Media Research Study (n = 4,001), Bloomberg, Company press releases, Company sites, Sports Business Journal 1.3X 1.3X 1.7X 1.8X 1.9X 2.0X 2.3X 2.3X Announced plans to launch a sports betting platform by the end of 2022 Grew its pay-per-view (PPV) platform Rough N’ Rowdy, averaging 60,000 PPV units sold per event in 2022 In 2022, announced its new OTT service FanDuel+ Purchased online subscription-based sports editorial site The Athletic in early 2022 Launched its NFT Marketplace in late 2021, enabling users to buy and sell digital collectibles In 2022, announced plans to enter the sports betting space in partnership with DraftKings NEXT-GEN FANS ARE MORE LIKELY TO… SPORTS & SPORTS BETTING
  • 163.
    Sports betting continuesto surge in the U.S., with total wagers nearly doubling year-over-year to reach $47B in the first half of 2022  162 Note: Sports betting excludes fantasy sports and horse racing. Florida passed a gaming compact that legalized sports betting, but the compact has been vacated as of late 2021. 1. “Live states” are defined as states in which sports betting is legal and currently operational as of Sept. 2022. Includes Washington, D.C. as a state. Includes states in which sports betting is only legal and currently operational in tribal gaming venues via tribal-state compact. 2. “Geofenced online & retail” states are defined as states in which online sports betting is legal and live, but permitted only within the physical boundaries of a retail-licensed sports betting operator (e.g. sports venues, casinos, hotels, restaurants). 3. Online sports betting is legal in MD, but not live. 4. Both retail and online sports betting are legal in MA, ME, and OH, but not live. Retail sports betting is legal in NE, but not live. Sources: Activate analysis, Legal Sports Report, State regulator sites SPORTS BETTING MARKET LIVE STATES1 BY CHANNEL, U.S., SEPT. 2022 TOTAL SPORTS BETTING WAGERS BY MONTH, U.S., AUG. 2019-JUNE 2022, BILLIONS USD # States: ◼︎ Online & Retail 22 Geofenced Online & Retail2 4 ◼︎ Online Only 1 ◼︎ Retail3 Only 5 ◼︎ Not Live4 19 2019 2000 4000 6000 8000 10000 $8B $6B $4B $2B 2020 2021 PEAK MONTHLY WAGERS JAN. 2022: $9.8B H1 2022: $47B 94% YoY Change $10B Washington, D.C. 32 Live States1 2022 SPORTS & SPORTS BETTING
  • 164.
    We forecast thatthe total sports betting amount wagered will reach $210B by 2026 as sports betting becomes legal in a growing number of states  163 TOTAL SPORTS BETTING AMOUNT WAGERED1, U.S., 2021-2026E, BILLIONS USD 2021 2022E 2023E 2024E 2025E 2026E $210B $192B $171B $149B $99B $58B 30% 32 36 38 40 41 NUMBER OF STATES WITH LEGAL SPORTS BETTING2: 45 2021-2026E CAGR: ACTIVATE FORECAST 1. Projection assumes 45 states will legalize (but not necessarily launch) sports betting by 2026. 2. Projected number of states that have legalized (but not necessarily launched) betting by the end of the stated year. Includes Washington D.C., as a state. Sources: Activate analysis, Action Network, Legal Sports Report, State regulator reports, U.S. Bureau of Economic Analysis SPORTS & SPORTS BETTING
  • 165.
    We expect thatU.S. sports betting direct revenues will reach $15B by 2026  164 DIRECT SPORTS BETTING REVENUE1, U.S., 2021-2026E, BILLIONS USD 1. “Direct sports betting revenue” is defined as revenue calculated as a share of the total amount wagered and depends on odds, type of wager, and individual sportsbooks. 2. State tax income is generated as a share of the total amount wagered, a share of gross gaming revenue (ranges depending on the state and type of betting), and by gaming licensing fees. Sources: Activate analysis, Eilers & Krejcik Gaming, Legal Sports Report, The Lines, Nevada Gaming Control Board, U.S. Bureau of Economic Analysis 2021 2022E 2023E 2024E 2025E 2026E $15.0B $13.6B $12.0B $10.3B $6.8B $4.3B ACTIVATE FORECAST ONLINE SPORTSBOOKS CASINOS/RACETRACKS STATES2 DIRECT SPORTS BETTING REVENUE1 GOES TO: 2021-2026E CAGR 29% SPORTS & SPORTS BETTING
  • 166.
    Next-Gen Fans aremore likely to participate in and spend more on sports betting than Legacy Fans  165 SPORTS FAN1 PARTICIPATION AND SPEND IN SPORTS BETTING, U.S., 2022, % SPORTS FANS BY SEGMENT 1. “Sports fans” are defined as followers (e.g. those attending live games in person, watching live games or game highlights, reading articles or statistics) of at least one sport in the last 12 months. 2. “Next-Gen Fans” are defined as sports fans between the ages of 18-34. 3. “Legacy Fans” are defined as sports fans aged 35 or older. 4. As of Aug. 2022. Sources: Activate analysis, Activate 2022 Consumer Technology & Media Research Study (n = 4,001) Next-Gen Fans2 Legacy Fans3 10% 17% 42% Under $150/mo 58% Over $150/mo 50% Over $150/mo 50% Under $150/mo Next-Gen Fans2 will define the trajectory of the U.S. sports betting market, already representing over half of U.S. aggregate total wagers year-to-date4 SPORTS FAN1 PARTICIPATION IN SPORTS BETTING NEXT-GEN FAN2 MONTHLY SPEND LEGACY FAN3 MONTHLY SPEND SPORTS & SPORTS BETTING
  • 167.
    The largest stateshave yet to reach maturity or legalize sports betting — legislative battles in these states will be instrumental in determining the full U.S. market potential  166 1. Figures do not sum due to rounding. Aggregate gross amount wagered. 2. “Maturity” is defined as when all states reach a steady-state average aggregate total wagers per capita. Excludes “betting never” states. 3. YTD June 2022 aggregate total wagers annualized. 4. “Launch date” is defined as the year in which sports betting became / will become operational (online or retail) in the state. 5. Florida signed legislation authorizing retail and online sports betting into law in Apr. 2021, but the tribal- state gaming compact ratified by the legislation was invalidated in Nov. 2021. Sources: Activate analysis, Action Network, Legal Sports Report, Nevada Gaming Control Board, State legislature reports, State regulator reports, U.S. Bureau of Economic Analysis, U.S. Census Bureau All Other States: $195B TOTAL VALUE $385B Top States: $190B STATE CURRENT VALUE (2022E3) VALUE AT MATURITY2 LAUNCH DATE4 California N/A $55B 2026 (estimated) Texas N/A $39B 2025 (estimated) New York $17B $28B 2019 Florida5 N/A $22B 2026 (estimated) Illinois $9B $17B 2020 Pennsylvania $7B $15B 2018 Ohio N/A $13B 2023 (estimated) TOTAL SPORTS BETTING AMOUNT WAGERED AT MARKET MATURITY1,2 BY STATE, U.S., BILLIONS USD Not Launched in State Launched & Currently Live in State ACTIVATE FORECAST SPORTS & SPORTS BETTING
  • 168.
    www.activate.com  167 CONTENTS PAGE $420BGlobal Technology and Media Growth Dollars Up for Grabs 4 Consumer Technology and Media Time and Attention 9 Super Users: The Critical Segment for Technology and Media Companies 15 eCommerce and Marketplaces: Growth will Continue Across Categories With Major Consumer Trends Serving as Tailwinds 29 Video: Streaming and Social Drive Growth 47 Gaming and Esports: A Mainstream Behavior and Precursor to The Metaverse 78 NFTs: Past the Hype Cycle, Towards Tangible Use Cases 95 Metaverse: Time for Practical Applications 108 Audio: Digital Audio Will Drive More Consumer Time and Spend 138 Sports and Sports Betting: Younger Next-Gen Sports Fans Drive Growth 152 Digital Fitness: Consumer Adoption Will Continue to Grow 167
  • 169.
    1. Figures donot sum due to rounding. 2. Includes revenue from both subscriptions and in-app purchases. 3. Includes B2C revenue only. Sources: Activate analysis, Activate 2019 Consumer Technology & Media Research Study (n = 4,006), Activate 2022 Consumer Technology & Media Research Study (n = 4,001), Canaccord Genuity, Centers for Disease Control and Prevention, CFRA, Cisco, Company sites, Crunchbase, data.ai, eMarketer, Euromonitor, Gallup, Gartner, IDC, Morgan Stanley, National Telecommunications and Information Administration, Oppenheimer, Piper Sandler, S&P Global, Statista, Truist Securities, U.S. Census Bureau, U.S. Department of Health & Human Services, William Blair Health and fitness technology and services will reach a combined market value of $30B by 2026  168 HEALTH AND FITNESS MOBILE APP , CONNECTED FITNESS EQUIPMENT, AND WEARABLE DEVICE REVENUE1, U.S., 2019 VS. 2022E VS. 2026E, BILLIONS USD 2019 2022E 2026E $30B $23B $9B $5.5B $5.2B $1.4B $23.1B $17.2B $7.1B ACTIVATE FORECAST HEALTH AND FITNESS MOBILE APPS2 Workout/training, diet/nutrition tracking, mindfulness/meditation, and sleep tracking mobile apps for iOS and Android WEARABLE DEVICES Accessories or clothing embedded with electronics, software, or sensors (excludes headphones and AR/VR headsets) CONNECTED FITNESS EQUIPMENT3 Internet-connected exercise equipment with social / live class capabilities 2022E-2026E CAGR: 6% 11% 2% 8% $1.1B 2019-2022E CAGR: 38% 26% 55% 34% $0.7B $0.4B $1.4B DIGITAL FITNESS
  • 170.
    2019 2022 40% 24% 2019 2022 26% 11% 20192022 36% 23% Consumer adoption of digital fitness technologies has significantly increased since the COVID-19 outbreak, with wearable devices having the largest penetration among consumers today  169 USAGE OF HEALTH AND FITNESS SERVICES/APPS1, U.S., 2019 VS. 2022, % ADULTS AGED 18+ OWNERSHIP OF CONNECTED FITNESS EQUIPMENT2, U.S., 2019 VS. 2022, % ADULTS AGED 18+ OWNERSHIP OF WEARABLE DEVICES3, U.S., 2019 VS. 2022, % ADULTS AGED 18+ +13pp +15pp +16pp 1. “Health and fitness services/apps” are defined as workout/training, diet/nutrition tracking, mindfulness/meditation, and sleep tracking services/apps. 2. “Connected fitness equipment" is defined as internet-connected exercise equipment with social / live class capabilities. Ownership is defined at the household level. 3. “Wearable devices” are defined as accessories or clothing embedded with electronics, software, or sensors. Excludes headphones and AR/VR headsets. Sources: Activate analysis, Activate 2019 Consumer Technology & Media Research Study (n = 4,006), Activate 2022 Consumer Technology & Media Research Study (n = 4,001) DIGITAL FITNESS
  • 171.
    There is highconsumer overlap with these behaviors; over one third of digital fitness participants use all three digital fitness types  170 DIGITAL FITNESS PARTICIPANTS1, U.S., 2022, % ADULTS AGED 18+ 135M ADULTS AGED 18+ ARE DIGITAL FITNESS PARTICIPANTS1 52% Digital Fitness Participants1 48% Non-Digital Fitness Participants1 15% 4% 4% Health and Fitness Service/App2 Users 14% Wearable Device4 Owners 21% Connected Fitness Equipment3 Owners 5% 36% OVERLAP BETWEEN DIGITAL FITNESS TYPES5 1. “Digital fitness participants” are defined as adults aged 18+ who use health and fitness services/apps, are in a household that owns connected fitness equipment, or own a wearable device. 2. “Health and fitness services/apps” are defined as workout/training, diet/nutrition tracking, mindfulness/meditation, and sleep tracking services/apps. 3. “Connected fitness equipment” is defined as internet-connected exercise equipment with social / live class capabilities. Ownership is defined at the household level. 4. “Wearable devices” are defined as accessories or clothing embedded with electronics, software, or sensors. Excludes headphones and AR/VR headsets. 5. Figures do not sum to 100% due to rounding. Sources: Activate analysis, Activate 2022 Consumer Technology & Media Research Study (n = 4,001), U.S. Census Bureau DIGITAL FITNESS
  • 172.
    SMART RINGS SMART CLOTHING/SHOES CHESTHEART RATE MONITORS SMARTWATCHES / FITNESS TRACKERS HEALTH AND FITNESS SERVICES/APPS1 WEARABLE DEVICES3 CONNECTED FITNESS EQUIPMENT2 As consumer interest has grown, a broad set of companies have entered the digital health and fitness space  171 WORKOUT/TRAINING DIET/NUTRITION TRACKING SLEEP TRACKING MINDFULNESS/MEDITATION Workouts & Fitness Plans STATIONARY BIKES TREADMILLS ELLIPTICALS ROWERS MIRRORS/SCREENS PUNCHING/BOXING EQUIPMENT Note: As of Sept. 2022. 1. “Health and fitness services/apps” are defined as workout/training, diet/nutrition tracking, mindfulness/meditation, and sleep tracking services/apps. 2. “Connected fitness equipment" is defined as internet-connected exercise equipment with social / live class capabilities. 3. “Wearable devices” are defined as accessories or clothing embedded with electronics, software, or sensors. Excludes headphones and AR/VR headsets. Sources: Activate analysis, Company sites, data.ai DIGITAL FITNESS
  • 173.
    47M 48M 55M 65M 79% 80% 59% 25% 21% 20% 41% 75% Workout/Training Diet/Nutrition TrackingMeditation/Mindfulness Sleep Tracking Top apps/ services by % adults aged 18+ who subscribe2 While workout/training apps currently have the highest penetration, we forecast that the next wave of consumer growth will come from diet, meditation, and sleep services/apps  172 1. “Health and fitness subscriptions” are defined as paid subscriptions to workout/training, diet/nutrition tracking, mindfulness/ meditation, and sleep tracking services/apps. 2. Defined at the household level. 3. “Intend” is defined as extremely or very likely to purchase a subscription in the next 12 months. Sources: Activate analysis, Activate 2022 Consumer Technology & Media Research Study (n = 4,001), U.S. Census Bureau CURRENT AND INTENDED OWNERSHIP OF DIGITAL HEALTH AND FITNESS SUBSCRIPTIONS1, U.S., 2022, % ADULTS AGED 18+ WHO SUBSCRIBE2 TO OR INTEND3 TO SUBSCRIBE TO EACH TYPE OF DIGITAL HEALTH AND FITNESS SERVICE/APP Adults aged 18+ who currently subscribe2 or intend3 to subscribe Intend to Subscribe (Extremely or very likely to purchase a subscription in the next 12 months) Currently Subscribe DIGITAL FITNESS
  • 174.
    Our consumer researchshows that interest in connected fitness equipment is driven by convenience  173 INTENDED1 OWNERSHIP OF CONNECTED FITNESS EQUIPMENT2, U.S., 2022, % ADULTS AGED 18+ TOP REASONS3 FOR PURCHASING CONNECTED FITNESS EQUIPMENT2, U.S., 2022, % ADULTS AGED 18+ WHO OWN4 CONNECTED FITNESS EQUIPMENT To exercise at any time To exercise alone (e.g. not with others at a gym/studio) To save time (e.g. time spent traveling to the gym) To save money on traditional gym/studio memberships To track exercise performance and metrics (e.g. active minutes, exercise frequency) To access a specific type of exercise/workout that I would not be able to access otherwise To stay accountable to health/fitness goals To connect socially (e.g. competing or taking live classes with friends) To access professional guidance/instruction To avoid gyms/studios due to health concerns To replace gyms/studios that have closed due to COVID-19 restrictions 24% of consumers are extremely or very interested in purchasing connected fitness equipment in the next 12 months 9% 11% 12% 12% 13% 14% 16% 16% 18% 26% 27% 1. “Intend” is defined as extremely or very likely to purchase connected fitness equipment in the next 12 months. 2. “Connected fitness equipment" is defined as internet-connected exercise equipment with social / live class capabilities. 3. Consumers were asked to select up to two top reasons. 4. Ownership is defined at the household level. Sources: Activate analysis, Activate 2022 Consumer Technology & Media Research Study (n = 4,001) DIGITAL FITNESS
  • 175.
    Millennials are twiceas likely as all other age groups to own a wearable device and also the most likely to purchase one in the future; the main use case across all consumers is tracking daily activity  174 1. “Intend” is defined as extremely or very likely to purchase a wearable device in the next 12 months. Includes both current owners and non-owners who intend to purchase. 2. “Wearable devices” are defined as accessories or clothing embedded with electronics, software, or sensors. Excludes headphones and AR/VR headsets. 3. Consumers were asked to select up to two top reasons. Sources: Activate analysis, Activate 2022 Consumer Technology & Media Research Study (n = 4,001) CURRENT AND INTENDED1 OWNERSHIP OF WEARABLE DEVICES2 BY AGE GROUP, U.S., 2022, % ADULTS AGED 18+ TOP REASONS3 FOR PURCHASING A WEARABLE DEVICE, U.S. 2022, % ADULTS AGED 18+ WHO OWN A WEARABLE DEVICE2 To track daily activity (e.g. daily steps, daily calories burned) To monitor health information (e.g. heart rate, blood oxygen levels) To track exercise performance and metrics (e.g. active minutes, distance run) To access smartphone capabilities (e.g. to check notifications, to answer a call, to play music, to make cardless payments) To monitor and track sleep habits (e.g. hours slept, quality of sleep) To connect socially (e.g. to enter competitions or share activity with friends/family) To access safety-related functionality (e.g. to be able to send SOS distress signals) 13% 13% 19% 25% 29% 31% 43% Aged 18-24 Aged 25-34 Aged 35-44 Aged 45-54 Aged 55-64 Aged 65+ 6% 8% 21% 52% 49% 37% 21% 20% 39% 60% 61% 45% Intend to Purchase (Extremely or very likely to purchase in the next 12 months) Currently Own Adults aged 25-44 are 2X as likely to own a wearable device as all other age groups DIGITAL FITNESS
  • 176.
    Immersive VR fitness gamethat provides a variety of workouts (e.g. cardio, meditation, stretching) set in virtual locations A wide range of different types of VR exercise classes (e.g. HIIT, boxing, dance) guided by instructors and paired with music VR rhythm game in which players hold virtual sabers and slash objects to the beat of music VR app that allows users to do a wide variety of workouts (e.g. rowing, running, HIIT) with the option to connect to home fitness equipment Virtual reality fitness games will enhance the digital fitness experience through a combination of wearables, connected devices, and subscription services; potentially a precursor to more advanced Metaverse experiences  175 1. “Digital fitness participants” are defined as adults aged 18+ who use health and fitness services/apps, are in a household that owns connected fitness equipment, or own a wearable device. 2. Used in the last 12 months. Sources: Activate analysis, Activate 2022 Consumer Technology & Media Research Study (n = 4,001), Company sites, eMarketer, Everyday Health, The Gamer, Meta Quest Store, Muscle and Health, Steam, The Wall Street Journal DIGITAL FITNESS PARTICIPANTS1 ARE 5X AS LIKELY TO HAVE USED2 A VR HEADSET THAN NON-DIGITAL FITNESS PARTICIPANTS1 DIGITAL FITNESS
  • 177.
    Our 2023 datapartners  176 ACTIVATE DATA PARTNERS ENTERTAINMENT STRATEGY GUY
  • 178.
    Activate growth. Own thefuture. Technology. Internet. Media. Entertainment. These are the industries we’ve shaped, but the future is where we live. Activate Consulting helps technology and media companies drive revenue growth, identify new strategic opportunities, and position their businesses for the future. As the leading management consulting firm for these industries, we know what success looks like because we’ve helped our clients achieve it in the key areas that will impact their top and bottom lines. Together, we can help you grow faster than the market and smarter than the competition. New York 212 316 4444 www.activate.com GET IN TOUCH: Seref Turkmenoglu seref@activate.com Michael J. Wolf michael@activate.com Samuel Studnia sam@activate.com Edward Doueihi edward@activate.com Donovan Rose donovan@activate.com Anthony Aguila anthony@activate.com David Howard david@activate.com
  • 179.
    Activate’s capabilities toposition companies for growth GROWTH STRATEGY REVENUE OPTIMIZATION AND ENGINEERING IDENTIFY OPPORTUNITIES AND BUILD TECHNOLOGY- ENABLED BUSINESSES IMPLEMENTATION AND EXECUTION MANAGEMENT PRINCIPAL AND PRIVATE EQUITY INVESTORS • Work with CEOs, Founders, and senior executives to build the strategic roadmap for growth and value creation • Identify new market opportunities (business areas, new products/ services, M&A) • Create pragmatic growth initiatives to capture the opportunities • Go-to-market • Customer acquisition • Loyalty, retention, and reactivation • Sales activation • Customer insight and segmentation • Marketing optimization • Pricing • Identify major new opportunities • Evaluate through consumer and market research • Build the content, experience, functionality, distribution technology, and business plan • Define the execution roadmap • Create major initiatives • Set revenue targets • Create roadmap/ timeline and ensure delivery • Build organization and team • Define and specify technology architecture • Integration • Build capabilities and enabling technology • Strategic due diligence • Value creation programs and strategies • Publicly-traded company opportunities • Opportunity identification • Sell-side diligence and market evaluation www.activate.com
  • 180.
    CREATED BY THE ACTIVATECONSULTING TEAM: Activate Technology & Media Outlook 2023 Michael Wolf Seref Turkmenoglu Samuel Studnia Edward Doueihi Donovan Rose Anthony Aguila David Howard Allison Brito Ellis Bowen Çigdem Binal Ryan Muldowney Marlee Melendy Lily Silva Mark Manley Griffin Glenn Kyler Meehan George Levy Karinya Ghiara Rachel Lunsford Jonathan Homidan Joe Sileo Malcolm Bowman Brigid Lynch Cansu Seckin Rebecca Federman Taylan Tuncata Danielle Koterbay Leah Kochendoerfer Ann Dockery Justine Paolini Max Wills Ryan Bush Aeron Davies Ahmad Yousef Ashkan Vafai Gyana Singh Madison Restivo Max Sanson Bert Li Kate Buchholz Leo deSouza Nate Robards Alexia Buchholz Noah Sugerman Tamara Levi Laura Miller Annik Wolf Frank Noto Denise Shea Stephen Corsello David Wish Cassie Wat Gbemi Adesanya Leah Collins Sydney Frame www.activate.com
  • 181.
    Thank you! Digital version ofthis report: www.activate.com/#outlook Mobile version: www.activate.com 11 Madison Square North New York, NY 10010 @activateinc