Download to read offline

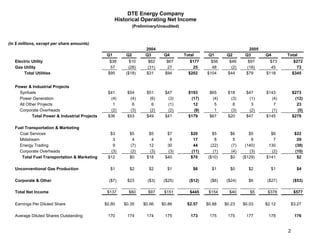
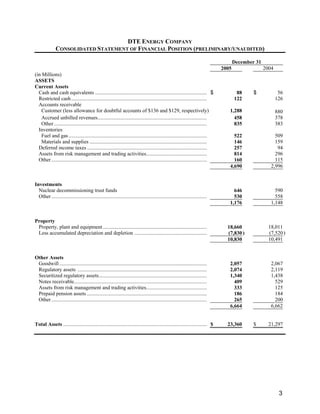
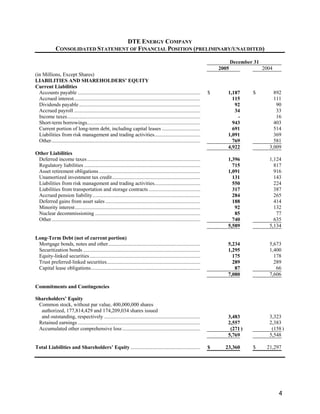
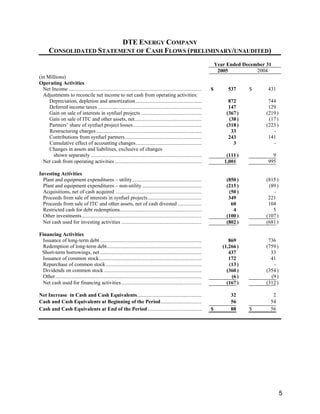
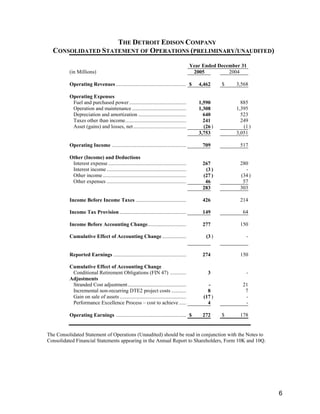
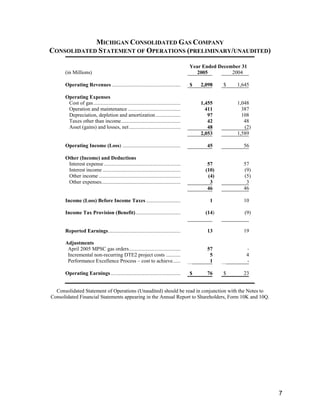
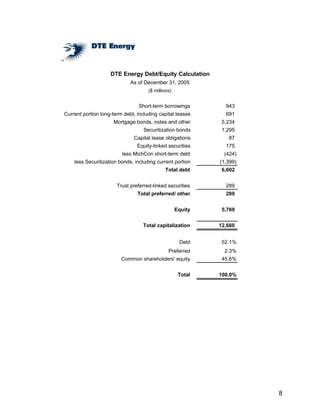
The document provides financial information for DTE Energy Company and its subsidiaries for the fourth quarter and full year of 2005. It includes statements of operating income, financial position, cash flows, and debt to equity calculations. For the quarter, DTE Energy reported net income of $378 million compared to $151 million in the prior year. For the full year, net income was $577 million compared to $445 million in 2004. Total assets as of December 31, 2005 were $23.36 billion with total debt of $6.6 billion and shareholders' equity of $5.55 billion.