This document describes the development of a numerical model to analyze the cracking behavior of alkali-activated slag concrete (AASC) beams subjected to restrained shrinkage. The model accounts for the time-dependent properties of different concrete mixtures, including shrinkage, elastic modulus, creep, and tensile strength. Experimental data on these properties was used to develop time-dependent relationships in the model. The model aims to better understand the contributions of these parameters to cracking risk by comparing model results to experimental cracking data from restrained beam tests of various concrete mixtures.

![596 ACI Materials Journal/September-October 2000
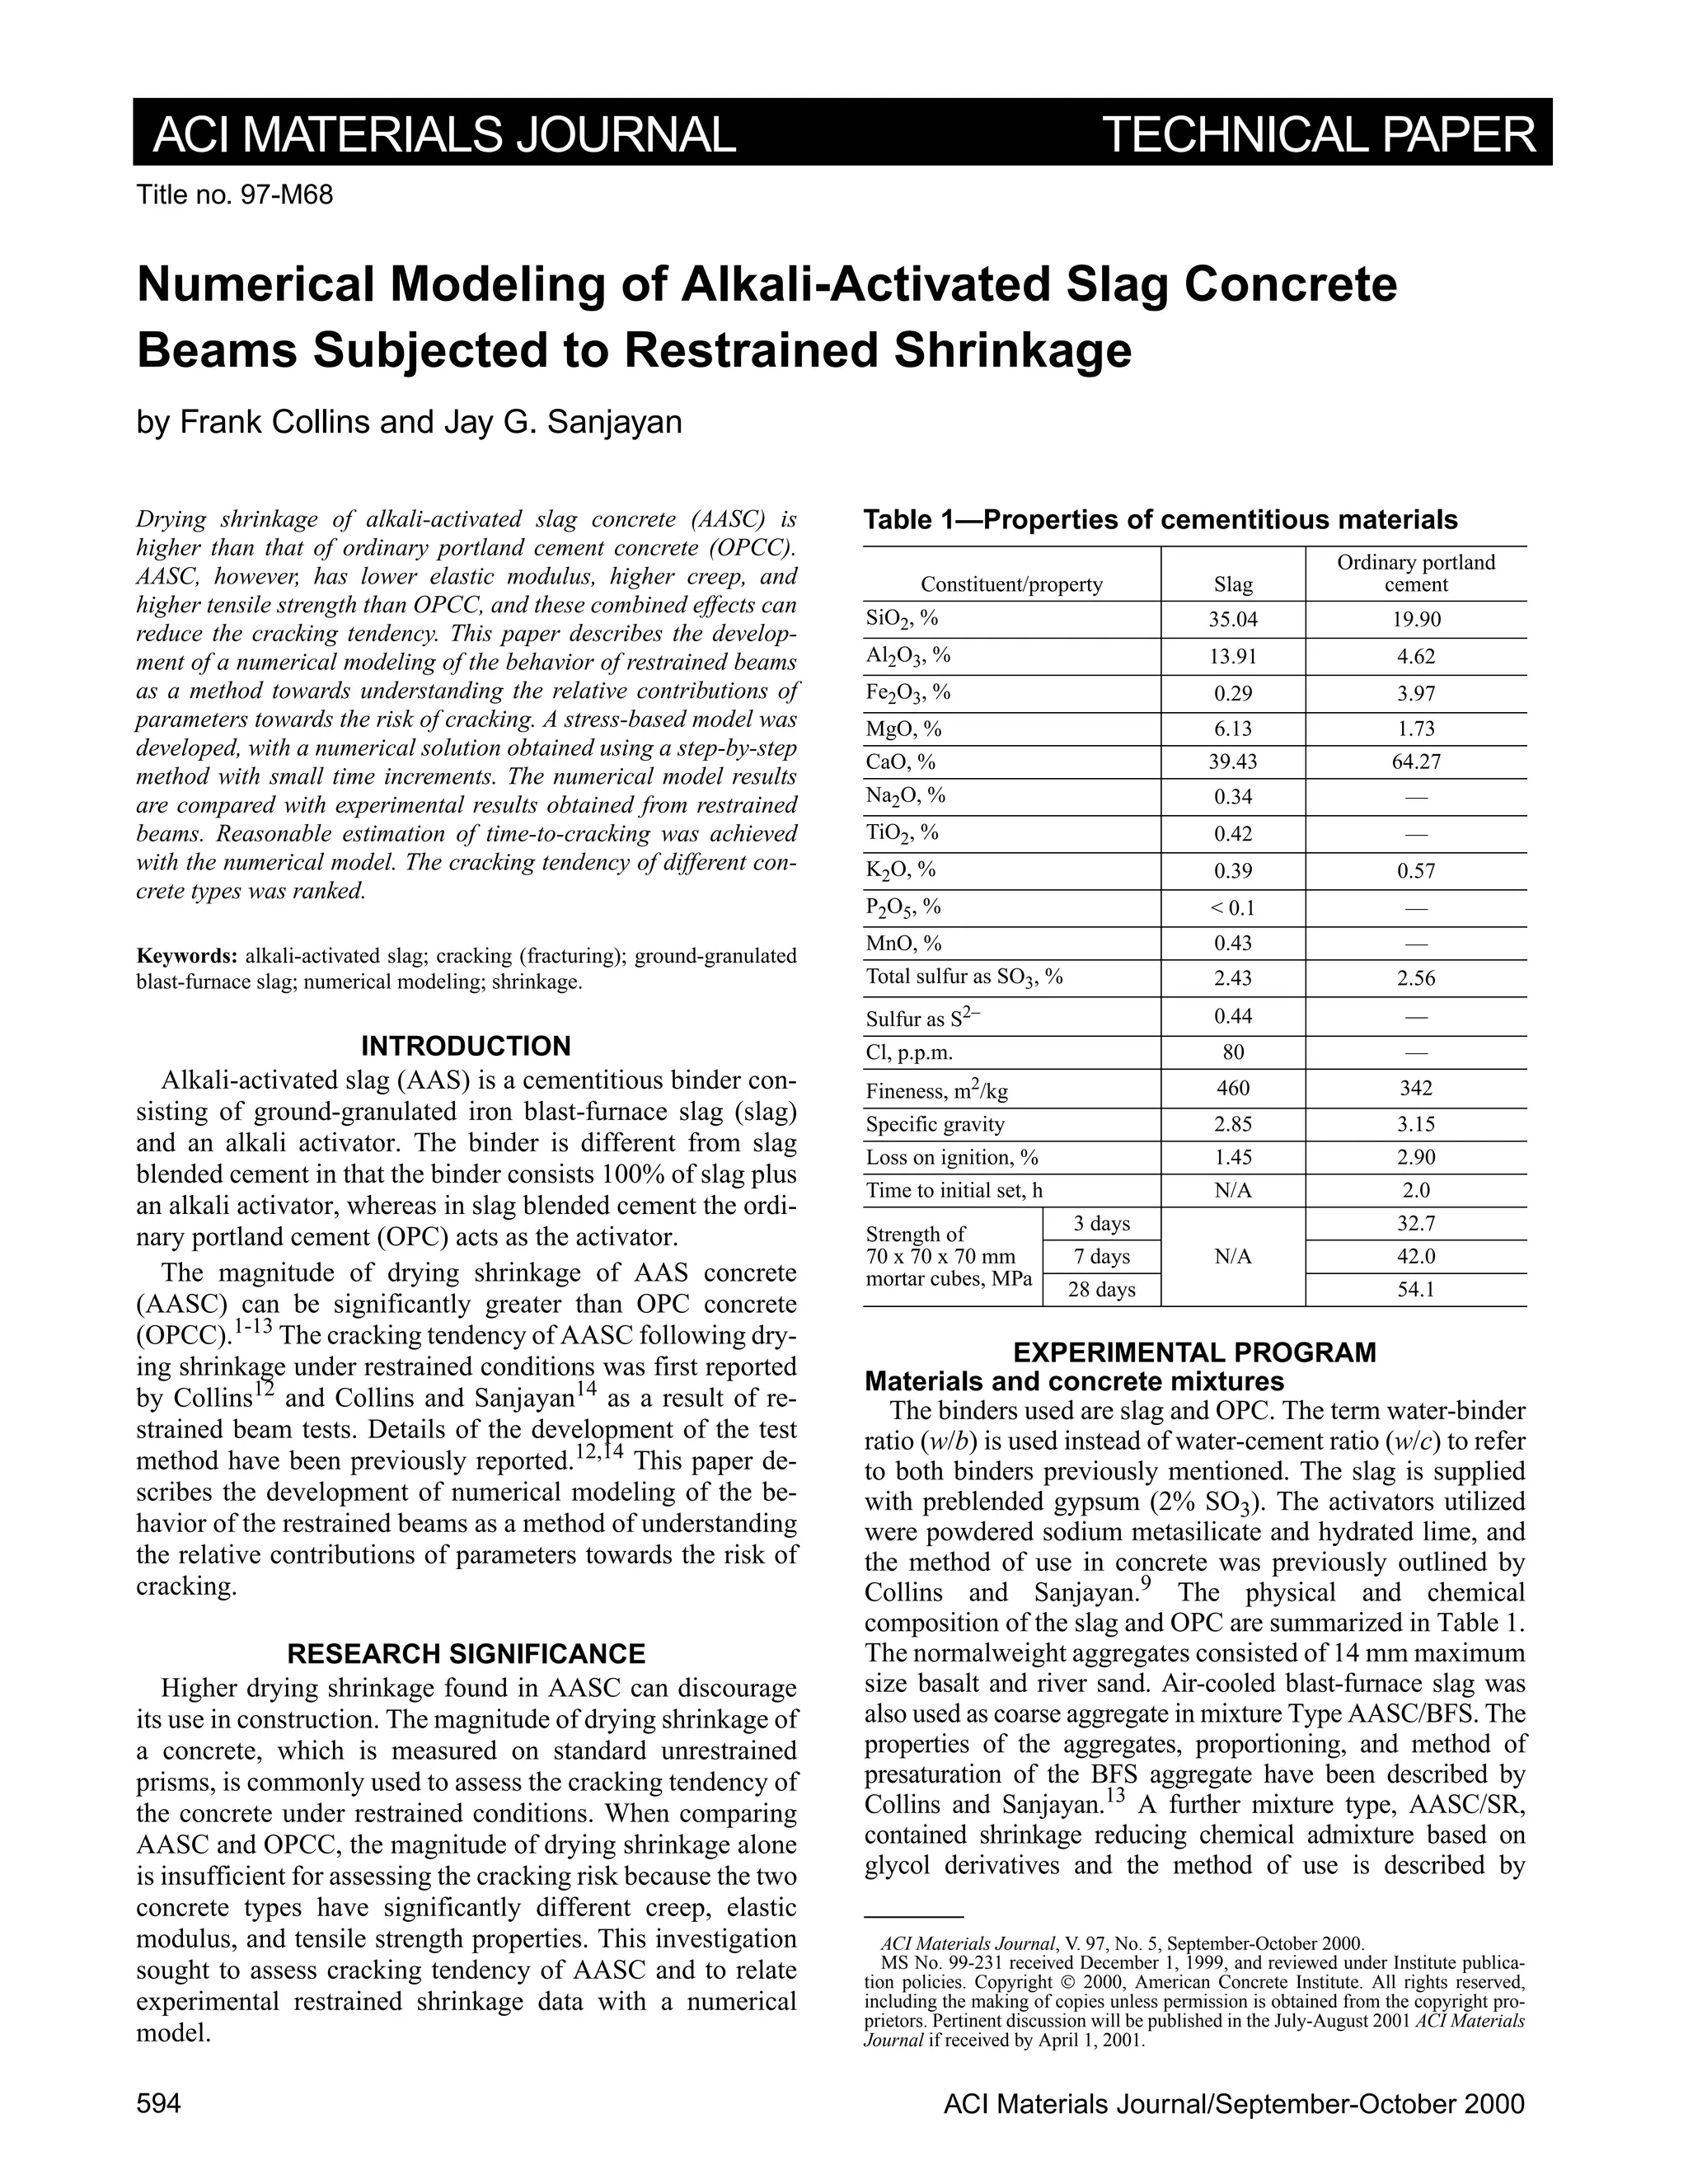
Figure 2 shows the relationship between the induced
strains following restraint of a beam subjected to drying
shrinkage. The PVC sheathed steel reinforcing rods are un-
bonded along the length of the beam; however, they are sub-
ject to end anchorage by threaded ends with nuts.
The unrestrained shrinkage contraction of the beam is
L.εsh, as shown in Fig. 2(b), where εsh is the amount of free
shrinkage at time t, and L is the length of the beam. Due to
the partial restraints provided by the steel rods, the free
shrinkage contraction is shared by extension of concrete L.εc
and compression of steel rods L.εst, as shown in Fig. 2(c).
Therefore
(1)
Because the length of concrete and the steel rods are the
same, the strains are independent of the length of the beam L
(2)
where
εsh(t) = shrinkage strain at time t;
εst(t) = strain in steel rods; and
εc(t) = concrete strain.
It should be noted that the shrinkage strains and steel strains
are in compression (or contraction) while concrete strains are
in tension (expansion).
The strain developed in the concrete εc is composed of
creep and elastic components, both of which are functions of
the stress developed in the concrete. The stresses developed
in the concrete beam are not uniform, due to the stress mag-
nifier plate embedded in the middle. The stress near the mid-
dle is much higher and concentrated in the outer regions of
the cross section, whereas, in regions away from the middle,
the stresses are more uniform across the cross section.
A finite elemental analysis was conducted to study the ex-
tent of the nonuniformity of stress distribution in the beam.12
From the stress distribution analysis, the disturbance created
by the stress magnifier plate was found to extend approxi-
mately 80 mm from the center of the beam and the average
stress developed in the model was found to be very close to
the stress in the beam estimated without the stress magnifier
plate. Therefore, in the following derivation and calcula-
tions, the uniform stress away from the stress magnifier plate
is used for creep and elastic deformation calculations. The
highest value of stress, which is found where the stress mag-
nifier plate is located, determines the cracking tendency.
A relationship between the two concrete stresses and the
stress in the steel can be formulated based on equilibrium of
forces
(3)
where
σcMag = magnified stress at the stress magnifier plate
section;
σc = uniform stress away from the plate;
Ac = cross-sectional area of the concrete in the beam;
Ap = cross-sectional area of the stress magnifier
plate; and
Ast = total cross-sectional area of all the steel rods.
L.εsh t( ) L.εc t( ) L.εst t( )+=
εsh t( ) εc t( ) εst t( )+=
σcMag t( ). Ac Ap–[ ] σc t( ).Ac σst t( ).Ast= =
Because the elastic modulus and stresses are changing
with time, the elastic strain in concrete at time t is given in
Eq. (4)
/Ec(t).dσc(t)/dt.dt (4)
where Ec(t) = elastic modulus at time t. Equation (4) can be
written as in Eq. (5)
(5)
The total creep strain at time t is given in Eq. (6)
εcreep(t) = /Ec(τ).dσc(τ)/dτ.φ(t,τ).dτ (6)
where φ(t, τ) = creep coefficient at time t due to a stress ap-
plied at time τ.
Equation (6) can be written in series form as in Eq. (7)
εcreep(t) = ∆σc(τ0)/Ec(τ0).φ(t,τ0) + (7)
∆σc(τ1)/Ec(τ1).φ(t,τ1) + + ∆σc(τi)/Ec(τi).φ(t,τi) +
+ ∆σc(τn)/Ec(τn).φ(t,τn)
The expansion of concrete due to creep and elastic strain
combined with the contraction in steel accommodates the
shrinkage of concrete, as described in Eq. (2)
εe(t) + εcreep(t) + εst(t) = εsh(t) (8)
The strain in steel can be written as a function of concrete
stress using Eq. (3)
εst(t) = σst(t)/Es = Ac/Ast.σc(t)/Es (9)
Substituting Eq. (9) into Eq. (8)
σc(t) = Es.Ast/Ac.[εst(t) − εe(t) − εcreep(t)] (10)
The strains εe(t) and εcreep(t) are functions of σc(t) and, by
substituting Eq. (4) and Eq. (6) into Eq. (10), a single equa-
tion with σc(t) as the only variable can be obtained. This dif-
ferential equation may be theoretically solved. In this study,
however, a numerical solution is obtained using a step-by-
step method, assuming the elastic and creep strains at time t
+ ∆t is the same at time t. This assumption does not introduce
any significant error as long as the time steps are small
σc(t + ∆t) = Es.Ast/Ac.[εsh(t + ∆t) − εe(t) − εcreep(t)] (11)
εe t( ) 1
t 0=
t t=
∫=
εe t( ) ∆σc t0( ) Ec t0( ) ∆σc t1( ) Ec t1( ) ……+ +⁄+⁄=
∆σc tn( ) Ec tn( )⁄
1
τ 0=
τ t=
∫
……
……](https://image.slidesharecdn.com/3a5b5a32-5266-4cd4-9882-07073e89b386-161031023020/85/ACIMaterialsJournalV97-5-3-320.jpg)
![ACI Materials Journal/September-October 2000 597
The concrete stress σc(t + ∆t) is then used to calculate the
elastic and creep strains (Eq. (5) and Eq. (7)) at time t + ∆t.
This method is similar to the method described in Gilbert.1
The magnified stress at the middle section is then calculated
using Eq. (3) as follows
σcMag(t) = [Ac/(Ac − Ap)].σc(t) (12)
where
Ac = concrete cross-sectional area; and
Ap = cross-sectional area of the plate.
When σcMag(t) ft(t), cracking would occur, where ft(t) is
the tensile strength of concrete at time t.
DEVELOPMENT OF EMPIRICAL FUNCTIONS
Drying shrinkage
For the drying shrinkage data obtained in this investiga-
tion, the functions that provided the best-fit estimation of
drying shrinkage with time were
εsh(t) = [tα/(f + tα)].εshu (13)
where
α, f = constants; and
εshu = ultimate shrinkage strain.
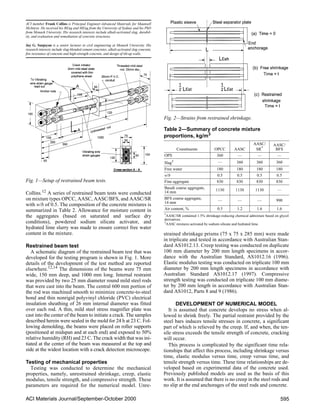
The functions that best describe drying shrinkage for each
of the concrete types are summarized in Table 3 and Fig. 3.
For the data collected in this investigation, best-fit curves
were obtained by setting α = 1.0. Table 3 also shows the
standard error estimate s of the best-fit presented (see Nota-
tions for the formula used for calculating the values of s).
The standard errors for this best-fit are within the acceptable
range as they are not significantly different from the expected
experimental accuracy of measuring shrinkage.
Inclusion of shrinkage reducing chemical admixture re-
duces the magnitude of εshu for AASC, however, the rate of
early age strain development is greater than AASC. AASC
containing BFS aggregate has considerably lower rate of
strain development than for AASC, however, the magnitude
of εshu is high.
Creep
For this investigation, compressive creep was assumed to be
equal to tensile creep. There is some debate, however, as to
whether the magnitude of creep in compression is equal to the
magnitude of creep in tension.16 At low stress levels, Koyana-
gi et al. 17 determined that the unit creep strains in compres-
sion and tension are approximately the same and the stress/
strength ratio does not affect tensile creep behavior at low
stress. Brooks and Neville,18
Neville,19
and Brooks et al.,20
however, found that for mass concrete, creep in uniaxial ten-
sion can be 20 to 30% higher than compressive creep. For con-
crete loaded at a later age, Brooks and Neville19 found less
total creep in tension than total creep in compression.
The Australian Standard, AS3600 (1994) proposes a creep
function as given in Eq. (14)
φ(t,τ) = k2.k3.φcc,b (14)
where
φ(t,τ) = creep factor at time t, when loaded at time τ;
φcc,b = basic creep factor;
k2 = a parameter that depends on the section geometry,
relative humidity, and duration of loading; and
k3 = a parameter that depends on the age of the concrete
at the time of loading τ, and is a function of the
strength ratio, fc(τ)/fc(28).
The parameter k2, as given in the charts in AS 3600
(1994), can be fitted by the formula15 as given in Eq. (15)
k2 = (k7.k8.t0.7)/(t0.7 + k9) (15)
where
t = time in days;
k7 = 0.76 + 0.9e–0.008th;
th = hypothetical thickness of the structural member,
in mm = (2 x gross cross-sectional area)/(exposed
perimeter of the member cross section);
k8 = 1.37 – 0.011h, where h is the relative humidity
(%); and
k9 = 0.15th.
The parameter k3 is a function of strength ratio fc(τ)/fc(28),
as described in Eq. (16), (17), and (18)
k3 = 1.9 – 0.8.(fc(τ)/fc(28)) for 0.5 fc(τ)/fc(28) 1.0 (16)
Table 3—Best-fit parameters
Property
Equation
no. Parameter
Concrete type
OPCC AASC
AASC/
SR
AASC/
BFS
Drying
shrinkage 13
f 10 30 12 150
εshu
(× 10–6
)
575 1850 735 2000
s (× 10–6
) 33 39 25 24
Creep 14
φcc,b 1.75 1.55 — —
s (× 10–6) 29 32 — —
Compres-
sive
strength
21
α 1.0 1.1 2.1 0.45
β 0.94 1.0 0.95 0.96
fc(28) 41.1 40.1 45.6 41.4
s (× 10–6) 2.8 1.8 4.4 4.9
Elastic
modulus
22
k 1030 16,400 — —
x 0.95 0.1 — —
s (× 10–6
) 1226 973 — —
Tensile
strength
23
α 1.25 2.3 1.8 2.0
β 1.0 0.97 1.02 1.0
ft(28) 3.95 4.32 3.98 4.74
s (× 10–6
) 0.12 0.41 0.49 0.51
Fig. 3—Drying shrinkage versus time.](https://image.slidesharecdn.com/3a5b5a32-5266-4cd4-9882-07073e89b386-161031023020/85/ACIMaterialsJournalV97-5-4-320.jpg)
![598 ACI Materials Journal/September-October 2000
k3= 1.6 – 0.5.(fc(τ)/fc(28)) for 1.0 fc(τ)/fc(28) 1.4 (17)
k3 = 0.9 for fc(τ)/fc(28) 1.4 (18)
The creep specimens were concrete cylinders with 100 mm
diameter and 200 mm length, and hence th is 50 mm and the
constants k7 and k9 become 1.363 and 7.5. The test condi-
tions at the time of loading were 50% RH and, therefore, the
constant k8 is 0.82, so, the Parameter k2 becomes as given in
Eq. (19)
k2 = 1.118t0.7/(t0.7 + 7.5) (19)
Because the samples were loaded at 28 days, the constant k3
is 1.1. The estimated creep strain was calculated as in Eq. (20)
εcreep = [0.4fc(28)/E28].k2.k3.φcc,b (20)
where E28 = 28-day elastic modulus under standard moist
curing conditions when tested to the Australian Standard,
AS1012.17 (1997). The value of φcc,b was chosen to obtain
the best fit creep strain function to the test data.
The 28-day elastic moduli were 41,700 and 36,700 MPa
for OPCC and AASC, respectively. The 28-day compressive
strengths were 46.1 and 51.3 MPa for OPCC and AASC, re-
spectively. The best-fit value of φcc,b was 1.75 and 1.55 for
OPCC and AASC, respectively, as shown in Fig. 4. The stan-
dard errors for the best-fits are 29 and 32 microstrains, which
are within the acceptable limits.
Compressive strength
Best-fit functions for compressive strength were derived
to assist in the calculation of the creep constant k3 and also
for the purpose of estimating elastic modulus. The general-
ized function used for the estimation of compressive strength
with time was as given in Eq. (21)
fc(t) = [t/(α + βt)].fc(28) (21)
where
α, β = constants; and
fc(28) = 28-day compressive strength (exposed curing from
Day 1 onwards).
The values of α and β were adjusted iteratively until best-
fit curves were achieved and the values are summarized in
Table 3 along with the standard error estimates s. Best-fit
functions are summarized in Fig. 5. The standard error esti-
mates for OPCC and AASC best-fits are within acceptable
limits. The s values of AASC/SR and AASC/BFS best-fits,
however, are excessive and mainly caused by the large devi-
ation of 1-day strengths.
OPCC and AASC show similar strength gain, as reflected
by the values of α and β. AASC/SR shows considerably lower
1-day strength than OPCC and AASC, whereas the 28-day
strength of AASC /SR exceeds both OPCC and AASC. This
is reflected in the higher value of α for AASC/SR. In contrast
with AASC/SR, AASC/BFS shows better initial strength
than OPCC and AASC and this is reflected by a lower value
of α.
Elastic modulus
An empirical function of elastic modulus was utilized as
given in Eq. (22)
Ec(t) = k.( fc)x (22)
where
Ec(t) = elastic modulus at time t;
k, x = constants; and
fc = compressive strength at time t, derived from Eq. (22).
Samples of OPCC and AASC were tested in triplicate at 3,
7, and 28 days. The values of k and x were adjusted iteratively
until best-fit curves were achieved. The k and x constants that
showed the best fit were 1030 and 0.95 for OPCC and 16,400
and 0.1 for AASC. The measured and best-fit functions are
Fig. 4—Creep versus time.
Fig. 5—Compressive strength versus time.
Fig. 6—Elastic modulus versus time.](https://image.slidesharecdn.com/3a5b5a32-5266-4cd4-9882-07073e89b386-161031023020/85/ACIMaterialsJournalV97-5-5-320.jpg)
![ACI Materials Journal/September-October 2000 599
shown in Fig. 6. The standard error estimates s are 1226 and
973 MPa for OPCC and AASC, respectively, which are
within the acceptable limits.
Tensile strength
To enable the estimation of the time of cracking, a func-
tion of tensile strength versus time was developed. The base
function used for the fitting of tensile strength data with time
was as given in Eq. (23)
ft(t) = [t/(α + βt)].ft(28) (23)
where
α, β = constants;
ft(28) = 28-day tensile strength (exposed curing from Day 1
onwards); and
t = time in days.
The values of α and β were adjusted iteratively until best-fit
curves were achieved. The functions, which best describe ten-
sile strength for each of the concrete types, and the standard er-
ror estimates are summarized in Table 3 and Fig. 7. The s
values are less than 0.5 MPa, which is within acceptable limits.
The higher value of α for each activated slag concrete re-
flects the significantly lower tensile strength at 1 day when
compared with OPCC.
METHODS OF CALCULATION AND
ASSUMPTIONS
Cross-sectional area of concrete
It was assumed that the area of concrete Ac, which affects
the majority of the restrained beam, is the cross-sectional
area of the beam minus the area of the restraining steel rods.
This area was used to calculate the stresses and creep and
elastic strains developing within the beam. At the midpoint
of the beam where the stress magnifier plate is located, how-
ever, the tensile stress in the concrete is magnified by a factor
Ac/(Ac − Ap). The magnified stress is designated as σcMag, as
in Eq. (12).
Calculation of creep in restrained beams
Because the restrained beams are subject to shrinkage
strains from Day 1 onwards, the beam becomes incrementally
loaded with time. Rather than load being applied at one con-
crete age, the stress increases as the concrete progressively
shrinks. The value of k2 and subsequent creep strain εcreep
was calculated for each time increment. Therefore, the esti-
mated creep strain at any given time is the aggregate sum of
the creep strains incrementally developed as the tensile load-
ing increases with time.
Values of k3 were calculated using Eq. (16), (17), and (18)
for fc(τ)/fc(28) 0.5. At very early ages of concrete, for
fc(τ)/fc(28) 0.5, no guidance is provided by Australian
Standard AS3600 (1994) for the calculation of k3. The Pa-
rameter k3 takes into account the age of concrete at the time
of loading. The behavior of k3 at very early ages of concrete
is unknown and extremely difficult to measure by direct
tests. Therefore, the strain measurements obtained from the
vibrating wire strain gages (VWGs) at very early ages are
used to back calculate the values of k3. The VWGs were lo-
cated in the concrete away from the stress magnifier plate.
The strains recorded in the VWGs (εVWG) would be the
shrinkage strain in concrete minus the expansion of concrete
due to tensile stress and creep, as shown in Eq. (24)
εVWG = εsh(t) - [εe(t) + εcreep(t)] (24)
The values of k3 were chosen such that the calculated
strains of εVWG using Eq. (24) obtain the best fit with the
measured strains. Figure 8 shows the best fit between the ex-
perimental and calculated strains for OPCC. Values of k3
that provided the best-fit were k3 = 4.0 and 1.8 at time = 0.4
and 0.8 days, respectively. Beyond this time, the calculation
of k3 followed Eq. (16), (17), and (18).
For creep calculations, elastic modulus was calculated uti-
lizing Eq. (22) considering the elastic modulus versus time
variation to account for the progressive nature of the beam
loading.
Calculation of concrete stress from VWG data
The concrete stress was calculated by utilizing the VWG
strain data for the strain gages located away from the center
of the beam. Comparison of Eq. (8) and (24) shows that the
strains measured in the VWG are the same as the strains ex-
perienced by the steel rods. Therefore, substituting εVWG in
place of εst in Eq. (9), the stress in the concrete can be calcu-
lated as follows
σc = (Ast/Ac).Es.εVWG (25)
where
εVWG = strain measured within the VWG strain gages that
were embedded within the beams;
Ast = total cross-sectional area of the steel in the beam;
Ac = cross-sectional area of concrete in the beam; and
Es = elastic modulus of steel.
Fig. 7—Tensile strength versus time.
Fig. 8—Best-fit curve for steel strain achieved by choosing
k3 parameter at 0.4 and 0.8 days.](https://image.slidesharecdn.com/3a5b5a32-5266-4cd4-9882-07073e89b386-161031023020/85/ACIMaterialsJournalV97-5-6-320.jpg)
![ACI Materials Journal/September-October 2000 601
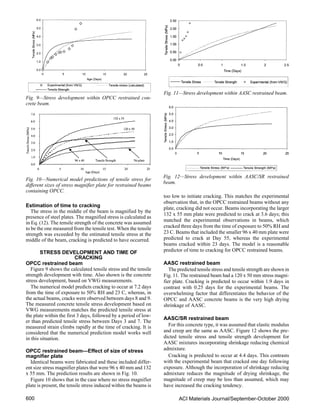
AASC/BFS restrained beam
For this concrete type, it was assumed that elastic modulus
and creep are the same as AASC. This follows work by
Ashby21
that showed OPCC behaved similarly with respect
to creep and elastic modulus when comparing concrete com-
posed of normal and BFS aggregates. Figure 13 shows the
predicted tensile stress and tensile strength development for
the AASC/BFS mixture that incorporated BFS as the coarse
aggregate.
Cracking was predicted to occur at 24.8 days, whereas the
experimental beams showed hairline cracking at Day 10.
The hairline cracking was difficult to define and has not
grown. The difference in calculated and experimental values
may be for the same reason as explained for the AASC/SR
beam; that is, the creep may also be reduced along with the
shrinkage that it needs to be taken into account in the calcu-
lation. The cracking tendency behavior of the AASC/BFS
beams is significantly better than both AASC and OPCC and
this can be explained by the following reasons:
1. AASC/BFS has lower magnitude of drying shrinkage
than AASC, as shown in the data presented earlier;
2. Higher tensile strength of AASC/BFS. The 28 day ten-
sile strength of AASC/BFS is 10% greater than AASC and
20.3% higher than OPCC; and
3. The BFS aggregate may be less stiff than the basalt thus
accommodating more strain than concrete composed with
normalweight aggregate.
CONCLUSIONS
A numerical model has been developed to describe the be-
havior of the restrained beams to assist the understanding of
the relative contributions of parameters towards the risk of
cracking. The key outcomes were as follows:
1. A stress-based model was utilized, with a numerical so-
lution obtained using a step-by-step method with small time
increments;
2. The various parameters affecting cracking tendency, in-
cluding drying shrinkage, creep, elastic modulus, and tensile
strength were described by developing best-fit functions to
the test data;
3. Finite elemental analysis of the stresses within the beam
showed the crack initiation plate magnifies the stress at the
center of the beam; however, the region of influence extends
only approximately 80 mm, beyond which the stress distri-
bution is essentially uniform;
4. In the case of OPCC, the numerical model produced rea-
sonable estimation of time to cracking;
5. The estimated time to cracking for AASC was longer
than the experimental observation; however, it was consid-
erably lower than OPCC to enable reasonable ranking of
the two binders; and
6. The numerical model over-estimated the time to crack-
ing in the cases of AASC/SR and AASC/BFS and this may
be due to creep and elastic modulus properties of these con-
crete types that were not measured in this investigation.
The effect of wet-curing on reducing the cracking tendency
is significant,12 however, numerical modeling has not been
used herein to analyze that factor.
ACKNOWLEDGMENTS
The financial support for this project was jointly provided by Independent
Cement and Lime Pty Ltd., Blue Circle Southern Cement Ltd., and Australian
Steel Mill Services. The authors thank the sponsors, especially Alan Dow, Tom
Wauer, Katherine Turner, Wayne James, Paul Ratcliff, John Ashby, and Ihor
Hinczak for their guidance and support. The enthusiastic participation of final
year students Lee Tuan Kuan and Eric Tan in this project is very much appre-
ciated. The efforts and assistance with the laboratory work provided by Jeff
Doddrell, Roger Doulis, and Peter Dunbar are also gratefully acknowledged.
CONVERSION FACTORS
NOTATIONS
A = cross-sectional area
Ac = cross-sectional area of concrete in restrained beam
Ap = cross-sectional area of stress magnifier plate in restrained
beam
Ast = total cross-sectional area of all steel rods in restrained beam
AAS = alkali-activated slag
AASC = alkali-activated slag concrete, with slag activator consist-
ing of powdered sodium silicate plus hydrated lime
AASC/BFS = identical to AASC, except coarse aggregate consists of air
cooled blast-furnace slag aggregate
AASC/SR = identical to AASC, except shrinkage reducing chemical
admixture has been included in mixture
E28 = elastic modulus of concrete at 28 days
Ec = elastic modulus of concrete
Ec(t) = elastic modulus of concrete at time t
Es = elastic modulus of steel
f = constant used for best-fit estimation of drying shrinkage
fc(28) = compressive strength of concrete at 28 days
fc(τ) = compressive strength of concrete when loaded at time τ
ft(t) = concrete tensile strength at time t
h = relative humidity for creep calculations
k = constant for best-fit estimation of concrete elastic modulus
k1 = shrinkage strain coefficient based on relative humidity,
theoretical thickness, and age
k2 = creep parameter dependent upon section geometry, rela-
tive humidity, and duration of loading
k3 = creep parameter dependent upon age of concrete at time of
loading τ and obtained from strength ratio fc(τ)/fc(28)
k7, k9 = creep parameter dependent upon hypothetical thickness of
structural member
k8 = creep parameter dependent upon relative humidity
L = length of sample; length of restrained beam
Ms = silicate modulus of sodium silicate activator, SiO2/Na2O
OPC = ordinary portland cement
OPCC = ordinary portland cement concrete with w/b = 0.5
RH = relative humidity
s = standard error estimate
= √[(experimental values − predicted values)2
/number of
points]
t = time
th = hypothetical thickness of structural member
= (2 × gross cross-sectional area)/(exposed perimeter of
member cross section)
VWG = vibrating wire strain gage
w/b = water-binder ratio
1 kg/m3
= 1.685 lb/yd3
1 mm = 0.039 in.
1 mm2
= 0.00152 in.2
1 MPa = 145 psi
Fig. 13—Stress development within AASC/BFS restrained
beam.](https://image.slidesharecdn.com/3a5b5a32-5266-4cd4-9882-07073e89b386-161031023020/85/ACIMaterialsJournalV97-5-8-320.jpg)