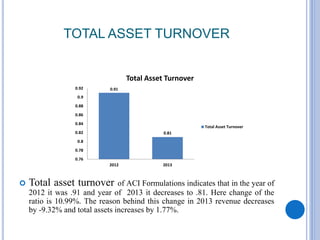
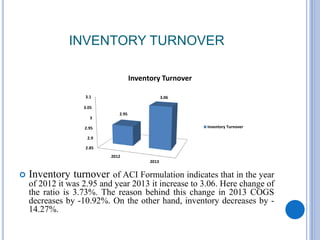
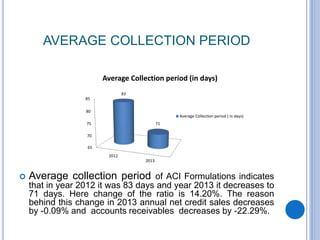
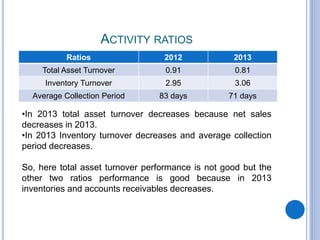
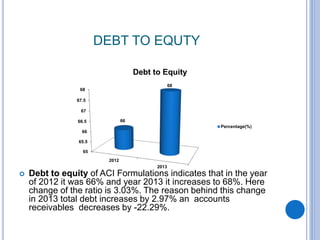
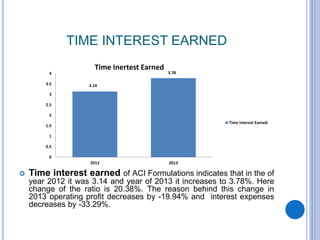
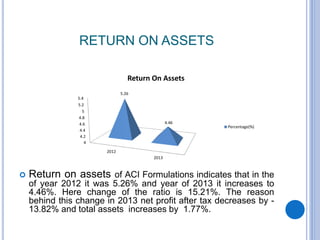
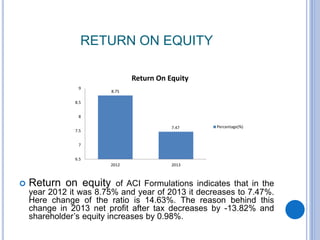
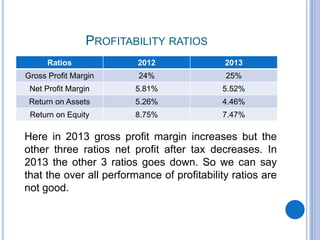
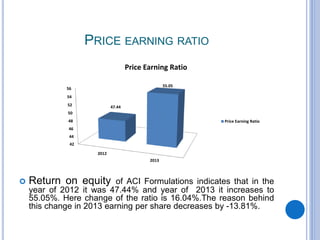
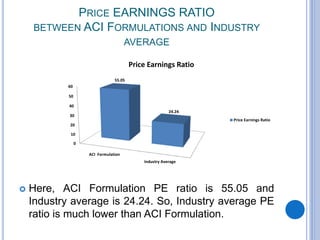
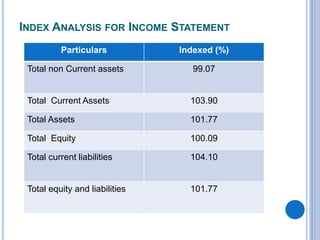
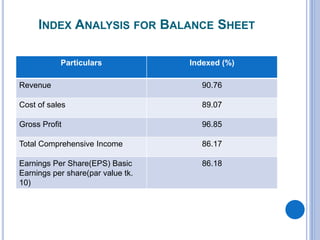
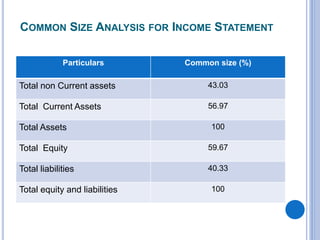
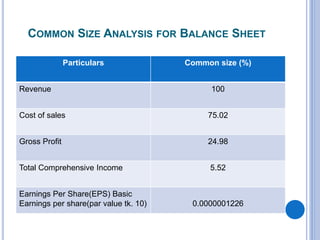
WORKING CAPITAL MANAGEMENT PROCEDURE(A Study on ACI Ltd.)Romana Aktar Anyka
A company cannot be fully evaluated only by over viewing the cash, accounts receivables, inventory, short-term security and short-term liabilities management procedures. Other types of financial performance indicators such as profitability ratios, debt ratios, activity ratios and market ratios etc should also be considered when assessing and appraising the performance of a company – and this is also true for ACI Ltd.
Comparisons should also be made:
between companies
between industries
between different time periods for one company
between a single company and its industry average
Financial trend analysis is based on income statement and balance sheet of the company.
For the analysis i have taken the data of 2013-2015. and calculate the ratios and also describing them and comparing them by putting into graphs.
Kossan's Financial Evaluation based on their annual financial statement from 2013 to 2015. We evaluate based on theory or formula from subject FIN745 (Financial Management). We also compare the result with Top Glove performance as Industry average.
Analyzing promotional strategies on ACI pure salt (internship report)Jamil Ahmed AKASH
It is complete internship report to prepare on the period of 3 months when I work as a market auditor. It can help to other intern to prepare a report.
Internship presentation on Measuring and Evaluating Bank performance: A Case...MohiUddin49
This internship report is based on the three months long internship program in Al-Arafah
Islami Bank Limited. In my internship period, I worked in General Banking. It was a great
opportunity to experience and gather knowledge different types of banking operations.
My faculty supervisor helped me to choose the topic-“Measuring and Evaluating Bank
Performance: A case study of Al-Arafah Islami Limited”.
How to Make a Field invisible in Odoo 17Celine George
It is possible to hide or invisible some fields in odoo. Commonly using “invisible” attribute in the field definition to invisible the fields. This slide will show how to make a field invisible in odoo 17.
The French Revolution, which began in 1789, was a period of radical social and political upheaval in France. It marked the decline of absolute monarchies, the rise of secular and democratic republics, and the eventual rise of Napoleon Bonaparte. This revolutionary period is crucial in understanding the transition from feudalism to modernity in Europe.
For more information, visit-www.vavaclasses.com
This is a presentation by Dada Robert in a Your Skill Boost masterclass organised by the Excellence Foundation for South Sudan (EFSS) on Saturday, the 25th and Sunday, the 26th of May 2024.
He discussed the concept of quality improvement, emphasizing its applicability to various aspects of life, including personal, project, and program improvements. He defined quality as doing the right thing at the right time in the right way to achieve the best possible results and discussed the concept of the "gap" between what we know and what we do, and how this gap represents the areas we need to improve. He explained the scientific approach to quality improvement, which involves systematic performance analysis, testing and learning, and implementing change ideas. He also highlighted the importance of client focus and a team approach to quality improvement.
Read| The latest issue of The Challenger is here! We are thrilled to announce that our school paper has qualified for the NATIONAL SCHOOLS PRESS CONFERENCE (NSPC) 2024. Thank you for your unwavering support and trust. Dive into the stories that made us stand out!
Welcome to TechSoup New Member Orientation and Q&A (May 2024).pdfTechSoup
In this webinar you will learn how your organization can access TechSoup's wide variety of product discount and donation programs. From hardware to software, we'll give you a tour of the tools available to help your nonprofit with productivity, collaboration, financial management, donor tracking, security, and more.
Operation “Blue Star” is the only event in the history of Independent India where the state went into war with its own people. Even after about 40 years it is not clear if it was culmination of states anger over people of the region, a political game of power or start of dictatorial chapter in the democratic setup.
The people of Punjab felt alienated from main stream due to denial of their just demands during a long democratic struggle since independence. As it happen all over the word, it led to militant struggle with great loss of lives of military, police and civilian personnel. Killing of Indira Gandhi and massacre of innocent Sikhs in Delhi and other India cities was also associated with this movement.
How to Split Bills in the Odoo 17 POS ModuleCeline George
Bills have a main role in point of sale procedure. It will help to track sales, handling payments and giving receipts to customers. Bill splitting also has an important role in POS. For example, If some friends come together for dinner and if they want to divide the bill then it is possible by POS bill splitting. This slide will show how to split bills in odoo 17 POS.
Students, digital devices and success - Andreas Schleicher - 27 May 2024..pptxEduSkills OECD
Andreas Schleicher presents at the OECD webinar ‘Digital devices in schools: detrimental distraction or secret to success?’ on 27 May 2024. The presentation was based on findings from PISA 2022 results and the webinar helped launch the PISA in Focus ‘Managing screen time: How to protect and equip students against distraction’ https://www.oecd-ilibrary.org/education/managing-screen-time_7c225af4-en and the OECD Education Policy Perspective ‘Students, digital devices and success’ can be found here - https://oe.cd/il/5yV
The Roman Empire A Historical Colossus.pdfkaushalkr1407
The Roman Empire, a vast and enduring power, stands as one of history's most remarkable civilizations, leaving an indelible imprint on the world. It emerged from the Roman Republic, transitioning into an imperial powerhouse under the leadership of Augustus Caesar in 27 BCE. This transformation marked the beginning of an era defined by unprecedented territorial expansion, architectural marvels, and profound cultural influence.
The empire's roots lie in the city of Rome, founded, according to legend, by Romulus in 753 BCE. Over centuries, Rome evolved from a small settlement to a formidable republic, characterized by a complex political system with elected officials and checks on power. However, internal strife, class conflicts, and military ambitions paved the way for the end of the Republic. Julius Caesar’s dictatorship and subsequent assassination in 44 BCE created a power vacuum, leading to a civil war. Octavian, later Augustus, emerged victorious, heralding the Roman Empire’s birth.
Under Augustus, the empire experienced the Pax Romana, a 200-year period of relative peace and stability. Augustus reformed the military, established efficient administrative systems, and initiated grand construction projects. The empire's borders expanded, encompassing territories from Britain to Egypt and from Spain to the Euphrates. Roman legions, renowned for their discipline and engineering prowess, secured and maintained these vast territories, building roads, fortifications, and cities that facilitated control and integration.
The Roman Empire’s society was hierarchical, with a rigid class system. At the top were the patricians, wealthy elites who held significant political power. Below them were the plebeians, free citizens with limited political influence, and the vast numbers of slaves who formed the backbone of the economy. The family unit was central, governed by the paterfamilias, the male head who held absolute authority.
Culturally, the Romans were eclectic, absorbing and adapting elements from the civilizations they encountered, particularly the Greeks. Roman art, literature, and philosophy reflected this synthesis, creating a rich cultural tapestry. Latin, the Roman language, became the lingua franca of the Western world, influencing numerous modern languages.
Roman architecture and engineering achievements were monumental. They perfected the arch, vault, and dome, constructing enduring structures like the Colosseum, Pantheon, and aqueducts. These engineering marvels not only showcased Roman ingenuity but also served practical purposes, from public entertainment to water supply.
2. COMPANY OVERVIEW
ACI Formulations Limited (ACI FL) is a subsidiary of
ACI limited
ACI FL was started its business 1995 as a private limited
company.
Located at Gazipur.
The principle activities of the company are
manufacturing and marketing of a number of
agrochemical and consumer products.
The company became a publicity listed company with
Dhaka Stock Exchange and Chittagong Stock Exchange
Limited.
4. LIQUIDITY RATIOS
Liquidity ratios shows a firm’s ability to cover its
current liabilities with its current assets.
5. CURRENT RATIO
Current ratio of ACI Formulations indicates that in the year of 2012 it
was 1.5 but in the year of 2013, it decreases to 1.49. Here change of the
ratio is -0.67%. It is a very little change. The reason behind this change is
the current asset of the company increases 3.91% and current liability
increases 4.11%.
1.484
1.486
1.488
1.49
1.492
1.494
1.496
1.498
1.5
2012
2013
1.5
1.49
Current Ratio
Current Ratio
6. QUICK RATIO
Quick ratio of ACI Formulations indicates that in the year of 2012 it was .87 and
year of 2013 it increases to .98. Here change of the ratio is 12.64%. The reason
behind this change is the cash increases by 49.36%, Inter-company receivables
increases by 125.46%, Advance income tax increases by 97.21%; Advances, deposits,
prepayments increases by 5.97%, Other receivables increases by 100%, Trade
receivables increases by 23.47%. Here in 2013 inventories decreases by -14.27% and
current liabilities increases 4.11%.
0.8
0.9
1
2012
2013
0.87
0.98
Quick Ratio
Quick Ratio
7. LIQUIDITY RATIOS
Ratios 2012 2013
Current ratio 1.50 1.49
Quick ratio .87 .98
Here current ratio is almost same in both of the
year. But the quick ratio is getting stronger in
2013.So, we can say the overall performance of
liquidity ratios are good for the company.
10. TOTAL ASSET TURNOVER
Total asset turnover of ACI Formulations indicates that in the year of
2012 it was .91 and year of 2013 it decreases to .81. Here change of the
ratio is 10.99%. The reason behind this change in 2013 revenue decreases
by -9.32% and total assets increases by 1.77%.
0.91
0.81
0.76
0.78
0.8
0.82
0.84
0.86
0.88
0.9
0.92
2012 2013
Total Asset Turnover
11. INVENTORY TURNOVER
Inventory turnover of ACI Formulation indicates that in the year
of 2012 it was 2.95 and year 2013 it increase to 3.06. Here change of
the ratio is 3.73%. The reason behind this change in 2013 COGS
decreases by -10.92%. On the other hand, inventory decreases by -
14.27%.
2.85
2.9
2.95
3
3.05
3.1
2012
2013
2.95
3.06
Inventory Turnover
Inventory Turnover
12. AVERAGE COLLECTION PERIOD
Average collection period of ACI Formulations indicates
that in year 2012 it was 83 days and year 2013 it decreases to
71 days. Here change of the ratio is 14.20%. The reason
behind this change in 2013 annual net credit sales decreases
by -0.09% and accounts receivables decreases by -22.29%.
65
70
75
80
85
2012
2013
83
71
Average Collection period (in days)
Average Collection period ( in days)
13. ACTIVITY RATIOS
Ratios 2012 2013
Total Asset Turnover 0.91 0.81
Inventory Turnover 2.95 3.06
Average Collection Period 83 days 71 days
•In 2013 total asset turnover decreases because net sales
decreases in 2013.
•In 2013 Inventory turnover decreases and average collection
period decreases.
So, here total asset turnover performance is not good but the
other two ratios performance is good because in 2013
inventories and accounts receivables decreases.
16. DEBT TO EQUTY
Debt to equity of ACI Formulations indicates that in the year
of 2012 it was 66% and year 2013 it increases to 68%. Here
change of the ratio is 3.03%. The reason behind this change
in 2013 total debt increases by 2.97% an accounts
receivables decreases by -22.29%.
65
65.5
66
66.5
67
67.5
68
2012
2013
66
68
Debt to Equity
Percentage(%)
17. TIME INTEREST EARNED
Time interest earned of ACI Formulations indicates that in the of
year 2012 it was 3.14 and year of 2013 it increases to 3.78%. Here
change of the ratio is 20.38%. The reason behind this change in
2013 operating profit decreases by -19.94% and interest expenses
decreases by -33.29%.
3.14
3.78
0
0.5
1
1.5
2
2.5
3
3.5
4
2012 2013
Time Inertest Earned
Time interest Earned
18. FINANCIAL LEVERAGE RATIOS
ratios 2012 2013
Debt to Equity 66% 68%
Time Interest Earned 3.14 3.78
Here, both the ratios are increased in 2013. So, the
company’s ability to financed by debt is increasing.
20. GROSS PROFIT MARGIN
Gross Profit Margin of ACI Formulations indicates that in
the year of 2012 it was 24% and year of 2013 it increases to
25%. Here change of the ratio is 4.17%. The reason behind
this change in 2013 gross profit decreases by -4.15% and net
sales decreases by -9.32%.
23.4
23.6
23.8
24
24.2
24.4
24.6
24.8
25
2012
2013
24
25
Gross Profit Margin
Percentage(%)
22. NET PROFIT MARGIN
Net Profit Margin of ACI Formulations indicates that in the
year of 2012 it was 5.81% and year of 2013 it increases to
5.52%. Here change of the ratio is 4.99%. The reason behind
this change in 2013 net profit after tax decreases by -13.82%
and net sales decreases by -9.32%.
5.3
5.4
5.5
5.6
5.7
5.8
5.9
2012
2013
5.81
5.52
Net Profit Margin
Percentage(%)
23. RETURN ON ASSETS
Return on assets of ACI Formulations indicates that in the
of year 2012 it was 5.26% and year of 2013 it increases to
4.46%. Here change of the ratio is 15.21%. The reason
behind this change in 2013 net profit after tax decreases by -
13.82% and total assets increases by 1.77%.
4
4.2
4.4
4.6
4.8
5
5.2
5.4
2012
2013
5.26
4.46
Return On Assets
Percentage(%)
24. RETURN ON EQUITY
Return on equity of ACI Formulations indicates that in the
year 2012 it was 8.75% and year of 2013 it decreases to 7.47%.
Here change of the ratio is 14.63%. The reason behind this
change in 2013 net profit after tax decreases by -13.82% and
shareholder’s equity increases by 0.98%.
8.75
7.47
6.5
7
7.5
8
8.5
9
2012 2013
Return On Equity
Percentage(%)
25. PROFITABILITY RATIOS
Ratios 2012 2013
Gross Profit Margin 24% 25%
Net Profit Margin 5.81% 5.52%
Return on Assets 5.26% 4.46%
Return on Equity 8.75% 7.47%
Here in 2013 gross profit margin increases but the
other three ratios net profit after tax decreases. In
2013 the other 3 ratios goes down. So we can say
that the over all performance of profitability ratios are
not good.
26. PRICE EARNING RATIO
Return on equity of ACI Formulations indicates that in the
year of 2012 it was 47.44% and year of 2013 it increases to
55.05%. Here change of the ratio is 16.04%.The reason behind
this change in 2013 earning per share decreases by -13.81%.
42
44
46
48
50
52
54
56
2012
2013
47.44
55.05
Price Earning Ratio
Price Earning Ratio
28. PRICE EARNINGS RATIO
BETWEEN ACI FORMULATIONS AND INDUSTRY
AVERAGE
Here, ACI Formulation PE ratio is 55.05 and
Industry average is 24.24. So, Industry average PE
ratio is much lower than ACI Formulation.
0
10
20
30
40
50
60
ACI Formulation
Industry Average
55.05
24.24
Price Earnings Ratio
30. REQIRED RATE OF RETURN
Required rate of return
Here,
Ri = required rate of return
Rf = risk free rate, which is 0.11
βi = firm’s beta, which is 0.79
Rm - Rf= market risk premium, which is 0.084
So, Ri = Rf + βi (Rm - Rf)
= 0.11 + 0.79 (.084)
= 17.64%
32. RECOMMENDATION
If we compare the PE ratio between ACI
Formulations and Industry average then we can
see that the industry average is 24.24 and ACI
Formulation is 55.05. So, The company PE ratio
is more higher than the industry average. So, the
investor should not buy the stock.
33. INDEX ANALYSIS FOR INCOME STATEMENT
Particulars Indexed (%)
Total non Current assets 99.07
Total Current Assets 103.90
Total Assets 101.77
Total Equity 100.09
Total current liabilities 104.10
Total equity and liabilities 101.77
34. INDEX ANALYSIS FOR BALANCE SHEET
Particulars Indexed (%)
Revenue 90.76
Cost of sales 89.07
Gross Profit 96.85
Total Comprehensive Income 86.17
Earnings Per Share(EPS) Basic
Earnings per share(par value tk.
10)
86.18
35. COMMON SIZE ANALYSIS FOR INCOME STATEMENT
Particulars Common size (%)
Total non Current assets 43.03
Total Current Assets 56.97
Total Assets 100
Total Equity 59.67
Total liabilities 40.33
Total equity and liabilities 100
36. COMMON SIZE ANALYSIS FOR BALANCE SHEET
Particulars Common size (%)
Revenue 100
Cost of sales 75.02
Gross Profit 24.98
Total Comprehensive Income 5.52
Earnings Per Share(EPS) Basic
Earnings per share(par value tk. 10) 0.0000001226