This document summarizes a presentation given at the 2003 American Society for Engineering Education Annual Conference on utilizing Excel to solve structural analysis problems. The presentation discusses using Excel spreadsheets to analyze determinate and indeterminate beams by deriving and solving the relevant equations for shear, moment, slope, and deflection. Sample problems are worked through to demonstrate the process. Excel offers advantages over other analysis software by being inexpensive, widely available, and easier for students to learn.
Advantages and Disadvantages of Using MATLAB/ode45 for Solving Differential E...CSCJournals
The present paper demonstrates the route used for solving differential equations for the engineering applications at UAEU. Usually students at the Engineering Requirements Unit (ERU) stage of the Faculty of Engineering at the UAEU must enroll in a course of Differential Equations and Engineering Applications (MATH 2210) as a prerequisite for the subsequent stages of their study. Mainly, one of the objectives of this course is that the students practice MATLAB software package during the course. The aim of using this software is to solve differential equations individually and as a system of equation in parallel with analytical mathematics trends. In general, mathematical models of the engineering systems like mechanical, thermal, electrical, chemical and civil are modeled and solve to predict the behavior of the system under different conditions. The paper presents the technique which is used to solve DE using MATLAB. The main code that utilized and presented is MATLAB/ode45 to enable the students solving initial value DE and experience the response of the engineering systems for different applied conditions. Moreover, both advantages and disadvantages are presented especially the student mostly face in solving system of DE using ode45 code
An integration of uml use case diagram and activity diagram with Z language f...IJECEIAES
Unified Modeling Language (UML) is the effective standard for modeling object-oriented software systems. However, the ambiguity of semantics and the absence of consistency among UML diagrams lead to lack of precisely defining the requirements of a system. On the other hand, formal methods are techniques and tools use the mathematical notations, and they involve the precise syntax and semantics of the unambiguous software requirements specification. It applied in early stages of Software Development Life Cycle (SDLC). Therefore, an integrated between UML specification and formal specification is required to reduce the requirements' ambiguity and error, and to improve the quality and security of software systems. This paper proposes an approach involves the combining UML use-case diagram and activity diagrams with Z language for formalization of Library Management System (LMS). The focus of this paper is on consistency between the UML diagrams to Z Schema, and then verified by using the Z / EVEs tool.
RANDOM TESTS COMBINING MATHEMATICA PACKAGE AND LATEX COMPILERijseajournal
This paper presents a competent and useful way to elaborate random exams by using Mathematica and
LATEX. With these two tools, the authors suggest how to generate, in an easy way, different PDF
documents containing different models of exams. The main idea is to provide a support to professors who
have to manage groups of large number of students that should take different exams along the term, or even
though not being groups of numerous students, it may be useful when different models of exams want to be
provided to the students. The underlying advantage in this paper is the use of the Mathematica package for
this purpose in a simple way, similarly as it has been done with alternative software. We present in this
paper, some models of exams produced in the context in which the authors work.
In this paper we present an approach of Model Versioning and Model Repository in context of Living
Models view. The idea of Living Models is a step forward from Model Based Software Development
(MBSD) in a sense that there is tight coupling between various artifacts of software development process.
These artifacts include System Models, Test Models, Executable artifacts etc. We explore the issues of
storage (import/export) of model elements into repository, inputs of cross link information, version
management and system analysis. The modeling environment in which these issues will be discussed is a
heterogeneous modeling environment, where different models types and different modeling tools are used
in the development process. An overview of the tool architecture is also presented..
The object-oriented class is, in general, the most utilized element in programming and modeling. It is employed throughout the software development process, from early domain analysis phases to later maintenance phases. A class diagram typically uses elements of graph theory, e.g., boxes, ovals, lines. Many researchers have examined the class diagram layout from different perspectives, including visibility, juxtaposability, and aesthetics. While software systems can be incredibly complex, class diagrams represent a very broad picture of the system as a whole. The key to understanding of such complexity is use of tools such as diagrams at various levels of representation. This paper develops a more elaborate diagrammatic description of the class diagram that includes flows of attributes, thus providing a basic representation for specifying behavior and control instead of merely listing methods.
Here we are trying to describe the UML diagrams. Those are Use-Case diagram, Activity Diagram, Sequence Diagram, Er Diagram, Class Diagram, Data-Flow Diagram. We describe the details figure of those diagrams.
https://www.youtube.com/channel/UChC0cB2n_-n27-STBvGP2NQ
#SURANA_COLLEGE_BENGALURU
Unified Modeling Language (UML) is a general purpose modelling language. The main aim of UML is to define a standard way to visualize the way a system has been designed. It is quite similar to blueprints used in other fields of engineering.
UML is not a programming language, it is rather a visual language. We use UML diagrams to portray the behavior and structure of a system. UML helps software engineers, businessmen and system architects with modelling, design and analysis. The Object Management Group (OMG) adopted Unified Modelling Language as a standard in 1997. Its been managed by OMG ever since. International Organization for Standardization (ISO) published UML as an approved standard in 2005. UML has been revised over the years and is reviewed periodically.
Here, we talk about various relational algebra operations like select, project, union, intersection, minus, cartesian product, and join in database management systems.
Towards a semantic for uml activity diagram based on institution theory for i...csandit
In this article, we define an approach for model transformation. We use the example of UML
Activity Diagram (UML AD) and Event-B as a source and a target formalism. Before doing the
transformation, a formal semantic is given to the source formalism. We use the institution
theory to define the intended semantic. With this theory, we gain a algebraic specification for
this formalism. Thus, the source formalism will be defined in its own natural semantic meaning
without any intermediate semantic. Model transformation will be performed by a set of
transformation schema which preserve the semantic expressed in the source model during the
transformation process. The generated model expressed in Event-B language will be used for
the formal verification of the source model. As a result, some model expressed in a precise
formalism, the verification of this model can be seen as the verification of the Event-B model
semantically equivalent to the source model. Then, in the present work we combine the
institution theory, Event-Bmethod and graph grammar to develop an approach supporting the
specification, the transformation and the verification of UML AD.
Welcome to my series of articles on Unified Modeling Language. This is "Session 3 – Class Diagram" of the series.
Please view my other documents where I have covered each UML diagram with examples
AN E XAMINATION OF T HE E FFECTIVENESS OF T EACHING D ATA M ODELLING C ONCEPTSijdms
The effective teaching of data modelling concepts i
s very important; it constitutes the fundament of d
ata-
base planning methods and the handling of databases
with the help of database management languages,
typically SQL. We examined three courses. The stude
nts of two courses prepared for the exam by solving
tests, while the students of the third course prepa
red by solving tasks from a printed exercise book.
The
number of task for the second course was 2.5 times
more than the number of task for the first course.
The
main purpose of our examination was to determine th
e effectiveness of the teaching of data modelling c
on-
cepts, and to decide if there is a significant diff
erence between the results of the three courses. Ac
cording to
our examination, with increasing the number of test
tasks and with the use of exercise book, the resul
ts
became significantly better
Development of Computer Aided Learning Software for Use in Electric Circuit A...drboon
Presently, instructors are required to teach more students with the same resources, thereby reducing the amount of time instructors have with their students. Because of this, examples may be omitted to be able to make it through all of the required material. This can be problematic with electric circuit analysis courses and other courses used as prerequisites. A lack of understanding in these classes will likely continue in future classes. While software is often used in these classes, often it is analysis software not meant to teach concepts. Teaching software does exist, but may have only a preset number of problems or only provide the solution. Others provide a ‘limitless’ number of problems by changing component values, but each ends up being the same basic problem. This paper introduces new learning software that addresses these shortcomings. The software provides a practically limitless number of problems by varying component values and circuit structure. Moreover, it provides both an answer and an explanation. Finally, it is designed so that students who need more help can get it, while those who do not can move on.
Interior Dual Optimization Software Engineering with Applications in BCS Elec...BRNSS Publication Hub
Interior optimization software and algorithms programming methods provide a computational tool with
a number of applications. Theory and computational demonstrations/techniques were primarily shown
in previous articles. The mathematical framework of this new method, (Casesnoves, 2018–2020), was
also proven.The links among interior optimization, graphical optimization (Casesnoves, 2016–7), and
classical methods in non-linear equations systems were developed. This paper is focused on software
engineering with mathematical methods implementation in programming as a primary subject. The
specific details for interior optimization computational adaptation on every specific problem, such as
engineering, physics, and electronics physics, are explained. Second subject is electronics applications
of software in the field of superconductors. It comprises a series of new BCS equation optimization
for Type I superconductors, based on previous research for other different Type I superconductors
previously published. A new dual optimization for two superconductors is simulated. Results are
acceptable with low errors and imaging demonstrations of the interior optimization utility.
Engineering Sketching: A Valuable Teaching Tool in Construction EngineeringLeonhard Bernold
Sketching in general engineering and science has been “outmanoeuvred” by computer graphics while still holding on in architectural engineering as a tool to think about spatial relationships, allowing the students to develop conceptual designs quicker than any CAD. Moreover, a recent paper reported that sketching helped students in geology develop critical thinking skills. Based on students’ feedback, it was concluded that it led to a deeper understanding of important concepts. Should it surprise us that psychological research shows that sketching facilitates inference, discovery and learning? This paper presents a model for creating and assessing assignments that uses engineering sketching to teach and learn in a second year civil engineering course.
Proposal of a similarity measure for unified modeling language class diagram ...IJECEIAES
The unified modeling language (UML) represents an essential tool for modeling and visualizing software systems. UML diagrams provide a graphical representation of a system's components. Comparing and processing these diagrams, for instance, can be complicated, especially as software projects grow in size and complexity. In such contexts, deep learning techniques have emerged as a promising solution for solving complex problems. One of these crucial problems is the measurement of similarity between images, making it possible to compare and calculate the differences between two given diagrams. The present work intends to build a method for calculating the degree of similarity between two UML class diagrams. With a goal to provide teachers a helpful tool for assessing students' UML class diagrams.
Computational Aptitude of Handheld Calculatormathsmasters
A Manuscript entitled "Computational Aptitude of Handheld Calculator" can be found at:
This is useful for solving problems in:
Thermodynamics, Mass and Heat Transfer, Engineering Analysis, Accounting and Economics and so on. It has been found useful in Undergraduate and Post graduate level courses. Kindly share with your younger ones.
Excel could be used in real classroom instructions:
construct a pictograph with Excel, which is a graph that uses pictures to represent the values being graphed; create time-lines with Excel to help students visualize and understand trends; use Microsoft Excel to analyze survey data.
Very useful instructional tool!
E NHANCED S PREADSHEET C OMPUTING W ITH F INITE - D OMAIN C ONSTRAINT S ATI...ijpla
The spreadsheet application is among the most widel
y used computing tools in the modern society. It
provides great usability and usefulness, and it eas
ily enables a non-programmer to perform programming
-
like tasks in a visual tabular “pen and paper” appr
oach. However, due to its mono-directional dataflow
,
spreadsheets are mostly limited to bookkeeping-like
applications. This paper shows how the spreadsheet
computing paradigm is extended to break through thi
s limitation for solving constraint satisfaction
problems. We present an enhanced spreadsheet system
where finite-domain constraint solving is well
supported in a visual environment. A spreadsheet-sp
ecific constraint language is constructed for gener
al
users to specify constraints among data cells in a
declarative and scalable way. The new spreadsheet
system significantly simplifies the development of
many constraint-based applications using a visual
tabular interface. Examples are given to illustrate
the usability and usefulness of the extended sprea
dsheet
paradigm.
In the last few decades the field of Information and Communication Technology (ICT) has made a swift progress. The growing role of computers in education is beyond doubt and has become essential for higher educational institutions for teaching and instructional purposes to improve the quality and efficiency of both teaching and learning
Succeeding in Business with Microsoft Excel 2010 A Problem Solving Approach 1...KeithRomeros
Full download : https://alibabadownload.com/product/succeeding-in-business-with-microsoft-excel-2010-a-problem-solving-approach-1st-edition-gross-solutions-manual/ Succeeding in Business with Microsoft Excel 2010 A Problem Solving Approach 1st Edition Gross Solutions Manual , Succeeding in Business with Microsoft Excel 2010 A Problem Solving Approach,Gross,1st Edition,Solutions Manual
INTEGRATION OF LATEX FORMULA IN COMPUTER-BASED TEST APPLICATION FOR ACADEMIC ...IJCSES Journal
LaTeX is a free document preparation system that handles the typesetting of mathematical expressions
smoothly and elegantly. It has become the standard format for creating and publishing research articles in
mathematics and many scientific fields. Computer-based testing (CBT) has become widespread in recent
years. Most establishments now use it to deliver assessments as an alternative to using the pen- paper
method. To deliver an assessment, the examiner would first add a new exam or edit an existing exam using
a CBT editor. Thus, the implementation of CBT should comprise both support for setting and administering
questions. Existing CBT applications used in the academic space lacks the capacity to handle advanced
formulas, programming codes, and tables, thereby resorting to converting them into images which takes a
lot of time and storage space. In this paper, we discuss how we solvde this problem by integrating latex
technology into our CBT applications. This enables seamless manipulation and accurate rendering of
tables, programming codes, and equations to increase readability and clarity on both the setting and
administering of questions platforms. Furthermore, this implementation has reduced drastically the sizes of
system resources allocated to converting tables, codes, and equations to images. Those in mathematics,
statistics, computer science, engineering, chemistry, etc. will find this application useful.
Electronic Keno Project 3 Overview and Rationale.docxShiraPrater50
Electronic Keno
Project 3
Overview and Rationale
This assignment is designed to provide you with hands-on experience in using discrete and
continuous probability distributions. In this assignment you will use technology to
generate random samples and explore the samples’ relationship with the underlying
population. Finally, you will have an opportunity to apply the Central Limit Theorem to
inferential statistics.
Course Outcomes
This assignment is directly linked to the following key learning outcomes from the course
syllabus:
CO2: Create distributions and graphical representation based on given data and identify
which distribution models best fit the data
CO3: Apply the theory of probability to calculate events’ likelihoods, understanding the
differences between experimental and theoretical probabilities (the Law of Large
Numbers), and calculate posterior probabilities by using the Bayes’ Law with emphasis on
applications
CO7: Interpret meaningful relationships and patterns in the data in relation to a given
business question
Assignment Summary
Read the scenario below and follow the instructions in the project description below (Parts
1 and 2) to analyze the data presented in the Excel workbook (Module 3
Project_Keno_v1.xlsx). Complete all parts in the designated Excel workbook. Submit both
the report and the Excel workbook. The Excel workbook contains all statistical work. The
report should include all your findings along with important analysis.
Project Description
The game of Keno: keno is an ancient Chinese game that has become popular in recent
years. In one electronic version of this game, a player selects 20 numbers from the set of
numbers 1 through 100. The computer then randomly draws another set of 20 numbers
from the set 1 through 100, and the player is rewarded according to how many of his
selected numbers have been matched by the 20 numbers drawn by the computer.
Part 1
Let X be the number of matches between a player’s 20 selected numbers and the 20
numbers drawn by the computer. Then X may range from 0 (no match) to 20 (all match)
and follows a hyper-geometric probability distribution.
Complete all of the following steps (a – j) in worksheet Part 1 of the Excel workbook
provided. All cells should contain formulas.
a. Construct a tabular probability distribution for X in column E of the worksheet.
b. Construct a tabular cumulative probability distribution for X in column F of the
worksheet.
c. Create a graphical probability distribution for X.
d. Create a graphical cumulative probability distribution for X.
e. Calculate the theoretical expected value (mean), the theoretical variance, and the
theoretical standard deviation of X in the spaces provided for those quantities. Interpret
those values in your Word report
f. In column M of the worksheet, use the Excel function “=RAND()” to generate 1000
random values according to the standard uniform ...
The Excel power user training courses by G Com Solutions are designed to transform any competent Excel user into a power user. Delegates are shown how to leverage the most powerful tools in Excel; tools which are no more difficult to learn than Excel’s mainstream features.
1. Proceedings of the 2003 American Society for Engineering Education Annual Conference & Exposition
Copyright 2003, American Society for Engineering Education
Session 3560
Utilization of EXCEL in Solving Structural Analysis Problems
Shahnam Navaee
Georgia Southern University
Abstract
Engineering educators are always searching for new and effective tools to speed up their
computations, enhance their teaching, and elevate student learning. Currently, several different
approaches in teaching structural engineering concepts are being investigated by the author. In
this paper, the use of EXCEL spreadsheet software in analyzing structures is discussed
employing several classical structural engineering methods. Using the developed spreadsheets in
this project, the instructor can quickly generate and analyze a variety of problems with ease
during the lecture to enhance student course comprehension. These spreadsheets can also be
provided for the students to allow them verify the accuracy of their developed hand-solutions.
Note that it is much more difficult to achieve the objectives described above using other
commercial structural engineering software, since these packages are often quite expensive,
more complex, and harder to work with. Many civil engineering and civil engineering
technology faculty can neither afford to acquire this type of software in their institutions, nor
they have time to teach the students how to use the software. The use of EXCEL spreadsheet
package might be one easy solution to remedy these problems. This relatively inexpensive
software is a component of the Microsoft Office suite which is already preinstalled in many
computers when purchased, and is already available in many educational institutions through a
site-license. Using this software many of the classical approaches associated with analyzing
structurally determinate as well as indeterminate structures can be formulated with ease. The
purpose of the presented paper is to illustrate some of the capabilities of this software package
related to solving structural engineering problems through presenting and discussing the solution
for two sample problems.
I. Introduction
In an earlier work of the author the utilization of MATLAB software in complementing a
structural engineering course was investigated. The paper based on this investigation was
published in the Proceeding of the 2002 ASEE Annual Conference1
, and was presented at the
ASEE/SEFI/TUB International Colloquium in Berlin, Germany in October of 2002. Although
this method of complementing a course offers a number of great advantages in terms of
enhancing the understanding and capabilities of the students in analyzing structures, this method
has two main drawbacks. Familiarizing students with the MATLAB programming principles,
concepts, and tools requires additional time and effort. The instructors teaching the course may
not have enough time to adequately teach the students about all the needed skills in formulating
the solutions for the problems. The other main shortcoming of this approach has to do with the
availability of the MATLAB software to the students. The students may not afford to purchase
2. Proceedings of the 2003 American Society for Engineering Education Annual Conference & Exposition
Copyright 2003, American Society for Engineering Education
this software or readily have access to it on their campuses. At Georgia Southern University,
where the author is currently teaching, only limited licenses for MATLAB are available in three
computer labs on campus. These labs have restricted access and are accessible to the students
only during certain hours. Utilization of the Excel software circumvents the shortcomings
pointed out above. Excel is an affordable software that can run on inexpensive computers and is
readily accessible to the students. Another great advantage of using Excel is the relative ease
with which the tools and features of this software can be utilized in solving a variety of
problems. There are a number of publications that describe the general utility of Excel. One
particular publication which focuses on the use of this software in solving engineering related
problems is listed in the bibliography of the paper2
.
The author of the submitted paper has developed the instructional material needed to teach the
students about all the important features and tools of Excel in two 2-hour lab periods. The
developed material has been successfully utilized in the last few semesters in teaching a course
entitled as the Computing for Engineers course (ENGR 1631) at the Engineering Studies
Program at Georgia Southern University. The instructions provided in these labs are deemed
sufficient in enabling the students to use the tools in Excel to analyze a variety of structures.
In this paper the procedure for utilization of Excel in solving structural analysis problems are
discussed through presenting the sample solutions for a statically determinate, as well as, a statically
indeterminate beam. This method of analysis can be used as an effective tool in enhancing and
complementing the traditional approaches for teaching structural analysis courses. The Excel
Workbook files similar to the ones presented in the paper can be utilized in enhancing the teaching
effectiveness of the instructors and elevating the students learning in the following fashion. The
instructor can utilize these workbooks during lectures to demonstrate and discuss the behavior of
different beams subjected to various loading conditions. This can be accomplished by simply
changing the beam and load parameters placed in appropriate cells. The developed Excel
workbooks can also be placed on a web server to allow students access to these files. The students
can further enhance their understanding of the course topics by exploring these files themselves at a
time and pace suitable for them. The students can also modify these files to analyze other classes of
problems, and use the files to perform a check on the validity and accurateness of their developed
hand solutions.
II. Analysis of a Statically Determinate Beam
In this section of the paper the procedure for determining the shear and moment diagrams and
plotting the variation of the slope and deflection of the beam using Excel is discussed. This
procedure is illustrated through presenting the solution for a sample beam and loading condition
shown in Figure 1(a).
3. Proceedings of the 2003 American Society for Engineering Education Annual Conference & Exposition
Copyright 2003, American Society for Engineering Education
Figure 1. Free Body Diagrams for the Beam
Writing the force and moment equilibrium equations for the free body diagrams of the two
sections of the beam shown at the bottom of Figure 1, the following expressions for the shear
force V and bending moment M can be established.
Upon substituting for the moments M1 and M2 in the differential equations for the two segments
of the beam shown below:
the following two specific equations are obtained for the beam under consideration. In these
expressions E, and I are respectively the modulus of elasticity and moment of inertia of the
beam. All other parameters in the equations are as defined in Figure 1.
L a
x
A
B
RA RB
RA
M1 M2
x
L+a-x
V1 V2
(a)
(c)(b)
w
C
C
w
aLxL +≤≤Lx ≤≤0
11 MvEI =′′ 22 MvEI =′′
Lx ≤≤0 aLxL +≤≤
wxLa
L
w
V −−
−
= )(
2
22
1
xLa
L
wwx
M )(
22
22
2
1 −−
−
=
)(2 xaLwV −+=
2
)( 2
2
xaLw
M
−+−
=
w
(1)
(2)
(3)
(4)
(5) (6)
4. Proceedings of the 2003 American Society for Engineering Education Annual Conference & Exposition
Copyright 2003, American Society for Engineering Education
Upon employing the method of successive integration and enforcing the boundary conditions:
and the continuity equations:
the following equations are obtained for the slope v′ and deflection v for the two segments of the
beam. Note that the boundary conditions and continuity equations listed above respectively
indicate that there is no deflection at the pin and roller supports, and that at the roller support
there should only be one single value for the slope and one single value for the deflection.
aLxL +≤≤
[ ])2()(2
24
2222223
1 LaLxLaLx
EIL
wx
v −−−+
−
=
[ ])44()44()(
24
322443234
2 LaaLLaxaLaLxaL
EI
w
v ++−−−−−−+
−
=
[ ])2()(64
24
2222223
1 LaLxLaLx
EIL
w
v −−−+
−
=′
[ ])44()(4
24
3233
2 aLaLxaL
EI
w
v −−−−+−
−
=′
0)(2 == Lxv0)0(1 ==xv
)()( 21 LxvLxv =′==′)()( 21 LxvLxv ===
Lx ≤≤0 aLxL +≤≤
xLa
L
wwx
vEI )(
22
22
2
1 −−
−
=′′
2
)( 2
2
xaLw
vEI
−+−
=′′
Lx ≤≤0
(7) (8)
(9) (10)
(11)
(13)
(14)
(15)
(16)
(12)
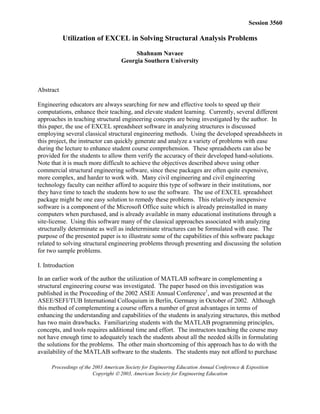
5. Proceedings of the 2003 American Society for Engineering Education Annual Conference & Exposition
Copyright 2003, American Society for Engineering Education
The Excel workbook developed for solving this problem is presented in Figure 2 for the specific
case when w= 0.2 kip/ft, E = 29000 ksi, I = 100 in4
, L =20 ft, and a= 10 ft. In this spreadsheet to
compute the values of shear, moment, slope, and deflection along the length of the beam in
columns B through E, the equations 1-4 and equations 13-16 are used in the following fashion.
Using these equations, four Excel formulas are first developed in cells B4 through E4 that are
capable of computing the correct values of shear, moment, slope and deflection for any particular
value of x. These formulas are then copied down each of the columns B through E to calculate
the values corresponding to all the values of x listed in column A. Note that the developed
formulas are capable of detecting for each selected value of x whether to use the set of equations
for the first segment or the second segment of the beam. One sample Excel formula developed
for computing the deflection in cell E4 corresponding to the case when x = 0 is shown inside the
formula-bar at the top of the spreadsheet presented in Figure 2. It should be stated that the
parameters used in this formula are set up to serve as “named cells”. These “named cells” are
assigned to point to cells or range of cells that contain the actual values of the parameters used in
this problem. By creating and employing this special type of cells, descriptive names rather than
cell addresses are used to obtain formulas that are more pleasing to the eye and easier to manage.
The procedure for creating “named cells” is discussed in a variety of publications that describe
the features of Excel. One such publication is listed in the bibliography of this paper2
.
Once the spreadsheet is completed using the procedure described above, various powerful Excel
plotting tools can be employed to plot the distributions of shear, moment, slope, and deflection
along the length of the beam as shown in Figure 2. To further aid in the readability and
documentation of the problem, various other Excel formatting and drawing tools can be utilized
to sketch the beam and loading conditions and to place gridlines and shading on the spreadsheet.
The utility of these tools has also been illustrated in Figure 2.
The method described above for the beam and loading condition depicted in Figure 1 can be
utilized to analysis beams subjected to other loading conditions. The results from each of these
loadings can also then be added using the superposition method to yield the results for other
combined loading cases. In the presented paper, the results for a beam subjected to a
concentrated end load, and a beam acted upon by a combined distributed and concentrated end
loads are presented in Figures 3 and 4. In computing the results for the concentrated end load in
Figure 3 the following equations were utilized. These equations can be derived using the same
type of analysis performed previously.
Lx ≤≤0 aLxL +≤≤
PV =2
)(2 xaLPM −+−=
(17) (21)
(18) (22)
L
Pax
M
−
=1
L
Pa
V
−
=1
6. Proceedings of the 2003 American Society for Engineering Education Annual Conference & Exposition
Copyright 2003, American Society for Engineering Education
One sample Excel formula for computing the value of deflection corresponding to the case when
x = 0 is shown inside the formula-bar at the top of each of the spreadsheets in Figures 3 and 4.
Examining Figures 2-4, it can be noted that the results for different loadings are placed on
successive sheets of the same Excel Workbook. The results in these sheets can be accessed by
clicking on the tabs created at the bottom of the presented workbook. These tabs are
appropriately labeled as “Distributed Load”, “Concentrated Load”, and “Combined Load” to
indicate the type of results that these sheets contain. The formula in Figure 4 demonstrates how
the results from the “Distributed Load” sheet and “Concentrated Load” sheet can be added to
yield the results for the combined loading case.
Additional provisions can easily be made in the developed spreadsheets to also compute the
stresses acting on the beam to make sure that these values are not exceeding the allowed limits.
The developed workbook can serve as a great tool for the designing beams.
III. Analysis of a Statically Indeterminate Beam
The development of an Excel Workbook file in regards to analyzing a statically indeterminate
beam is described in this section of the paper through providing the solution for a sample
problem. This problem is taken from the textbook4
of a Structural Analysis course taught at
Georgia Southern University. The beam used in this problem is depicted at the top of the
spreadsheet in Figure 5. The procedure implemented is based on the “Moment-Distribution
Method”, a widely used and well-established method developed by Hardy Cross3
in 1930.
Details in regards to the development and utilization of this method can be found in various
structural analysis text4-7
. A brief description of this method is provided below to enable the
reader to understand the basic concepts and the steps involved in developing the Excel solution
for the problem.
The application of the moment-distribution method requires that the stiffness factor (K) and the
distribution factor (DF) and the fixed-end-moments (FEM) of the beam spans to be computed
first. For the sample beam under consideration, these factors and moments are computed next
for the specific beam and load data presented at the bottom of the spreadsheet in Figure 5.
)3(
6
22
1 aLax
EIL
P
v −
−
=′
)(
6
22
1 Lx
EIL
Pax
v −
−
= [ ])23()23()(
6
223
2 LaLaaxLaaxaL
EI
P
v −−−+++−+
−
=
[ ])23()(3
6
2
2 LaaxaL
EI
P
v ++−+−
−
=′(19)
(20)
(23)
(24)
7. Proceedings of the 2003 American Society for Engineering Education Annual Conference & Exposition
Copyright 2003, American Society for Engineering Education
Figure 2. Screen-shot of an Excel Workbook Developed for a Beam Subjected to a
Uniformly Distributed Load
8. Proceedings of the 2003 American Society for Engineering Education Annual Conference & Exposition
Copyright 2003, American Society for Engineering Education
Figure 3. Screen-shot of an Excel Workbook Developed for a Beam Subjected to a
Concentrated End Load
9. Proceedings of the 2003 American Society for Engineering Education Annual Conference & Exposition
Copyright 2003, American Society for Engineering Education
Figure 4. Screen-shot of an Excel Workbook Developed for a Beam Subjected to a
Combined Uniformly Distributed Load and a Concentrated End Load
10. Proceedings of the 2003 American Society for Engineering Education Annual Conference & Exposition
Copyright 2003, American Society for Engineering Education
In the above equations E, I, w, and P are respectively the modulus of elasticity, moment of
inertia, distributed load, and concentrated end load. Also note that LAB, LBC, and LCD refer to the
length of spans AB, BC, and CD.
The procedure for determining the moment at the end of each span of the beam using the method
of moment-distribution can be summarized in the following four steps4
. Note that these steps are
followed in the Excel spreadsheet provided in Figure 5 to obtained the moments at the joints A,
B, and C of the beam.
Moment-Distribution Steps:
1. The ends of the beam spans are first assumed clamped and the fixed-end moments are used to
determine counterbalancing moment needed to keep the joint in equilibrium (e.g., the
counterbalancing moment for joint B is 26.667 k.ft).
2. The ends of the beam spans are then unclamped to allow them to rotate. The
counterbalancing moment computed in step 1 is now distributed to the spans of the beam
connecting to the same joint using the distributions factors (e.g., distributed moment for span
BA is 26.667 x 0.5=13.333 k.ft. This value is shown in cell D9).
3. The distributed moments computed at each joint of the beam is step 2 is then carried over to
the opposite end of each span by multiplying these moments by the corresponding carry-over
factors (e.g., carry-over-moment to joint A is 13.333 x 0.5 =6.667 k.ft. This value is shown
in cell C10).
ftk
wL
FEM BC
BC .667.26
12
)20)(8.0(
12
22
−=
−
=
−
=
ftk
wL
FEM C
CB .667.26
12
)20)(8.0(
12
22
+=== B
ftkPLFEM CDCD .5.7)15)(5.0( −=−=−=
EI
EI
L
EI
K
AB
AB 2.0
20
44
===
EI
EI
L
EI
K
BC
BC 2.0
20
44
===
0=ABDF
5.0=
+
=
BCAB
BC
BA
KK
K
DF
5.0=BCDF
(25)
(26)
(27)
(28)
(29)
(30)
(31)
(32)
11. Proceedings of the 2003 American Society for Engineering Education Annual Conference & Exposition
Copyright 2003, American Society for Engineering Education
4. The process of clamping and unclamping of the joints and distributing and carrying-over of
the moments as described in the previous three steps should be repeated over several cycles
until sufficiently small values for the distributed moments are yielded. At this point the
procedure can be stopped and the tabulated values of fixed-end moment (FEM), distributed
moment (DM), and carry-over moment (COM) can be added to yield the net values of the
moments at each joint.
When computing the distributed moments (DM) and carry-over-moments (COM) in the
spreadsheet in Figure 5, the Excel formulas are only developed once for rows 9 and 10 and then
simply copied down each column to produce the moment values for the rest of the remaining
cycles. Note that when these formulas are copied, the cell references used in the formulas will
be automatically adjusted to refer to the appropriate cell locations to produce the correct moment
values. One such formula for computing the distributed moment for member BA (in cell D9) is
shown in the formula-bar at the top of the screen-shot of the spreadsheet. Summing the values of
the FEM, DM, and COM in each of the columns C through G, the final values of moment at the
end of each span are computed. These values are circled on the spreadsheet. Once these
moments are obtained, free-body-diagrams can be drawn for each span and the shear and
moment diagrams for the beam can easily be established. These diagrams have not been
included on the workbook.
The spreadsheet developed in Figure 5 can also easily be modified to analyze the beam subjected
to other loading conditions. This can be accomplished by modifying the formulas placed in row
8 to compute the fixed-end-moments (FEMs). The spreadsheets similar to the one presented can
serve as a great tool for understanding and predicting the behavior of beams subjected to various
loading conditions.
IV. Summary and Conclusion
In the submitted paper, a procedure for complementing a structural analysis course utilizing
Excel was discussed. This method of analysis can be utilized as an added measure to further
elevate the students’ course comprehension and enhance the instructor’s effectiveness. Using
the special features and powerful tools of this affordable and easy-to-learn and easy-to-use
software, workbooks can be developed based on many of the classical approaches available for
analyzing structures. In the presented paper, a solution for a statically determinate, as well as, a
statically indeterminate beam were presented to clearly establish the power of this method of
analysis. The instructor can effectively utilize the developed workbooks during the lectures to
quickly generate different scenarios for in-class discussions. The students can also use these
files themselves to further enhance their own understanding of the course topics and learn more
about the behavior of structures subjected to various beam, support, and loading conditions. As
mentioned previously, the student can also utilize this workbook to perform a check on the
validity of their developed hand-solutions.
12. Proceedings of the 2003 American Society for Engineering Education Annual Conference & Exposition
Copyright 2003, American Society for Engineering Education
Figure 5. Screen-shot of an Excel Workbook Developed for a Statically Indeterminate Beam
Final Moments
13. Proceedings of the 2003 American Society for Engineering Education Annual Conference & Exposition
Copyright 2003, American Society for Engineering Education
Bibliography
1. Navaee, S., Das, N.K., “Utilization of MATLAB in Structural Analysis,” Proceedings of the ASEE Annual
Conference, Montreal, Canada, 2002.
2. Larsen, R. W., “Engineering with Excel,” Prentice Hall, 2002.
3. Cross, H., “Analysis of Continuous Frames by Distributing Fixed-End Moments,” Proceedings of the ASCE,
1930.
4. Hibbeler, R.C., Structural Analysis, Third Edition, Prentice Hall, 1995.
5. McCormac, J., Elling, R.E., Structural Analysis, Harper Collins, 1988.
6. West, H.H., Fundamentals of Structural Analysis, John Wiley, 1993.
7. Laursen, H.I., Structural Analysis, Second Edition, McGRaw Hill, 1978
SHAHNAM NAVAEE
Shahnam Navaee is currently an Associate Professor in the Engineering Studies Program at Georgia Southern
University where his primary responsibility is teaching freshman and sophomore level courses to engineering
transfer students. Dr. Navaee received his B.S. and M.S. degrees in Civil Engineering from Louisiana State
University in 1980 and 1983 and his Ph.D. degree from the Department of Civil Engineering at Clemson University
in 1989.