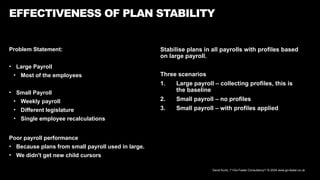
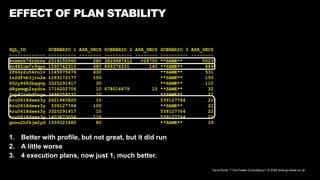
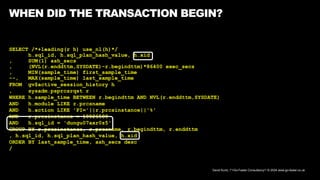
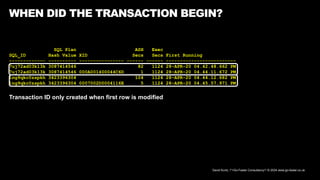
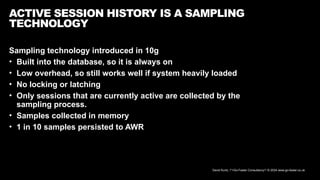
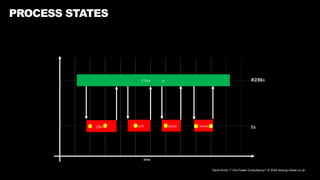
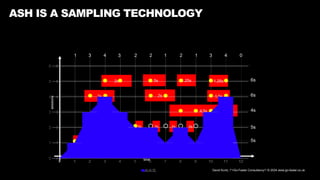
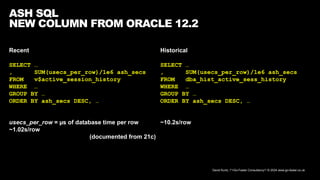
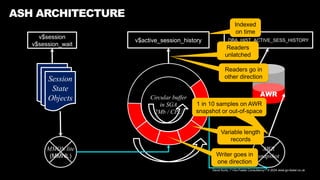
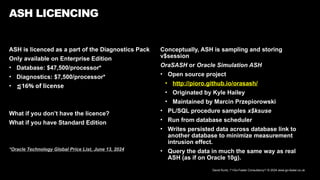
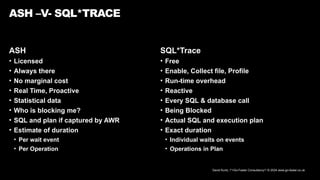
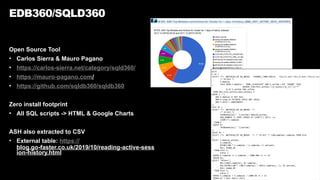
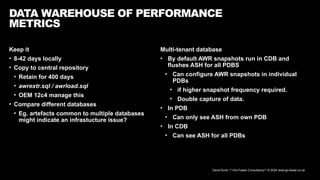
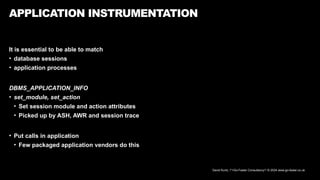
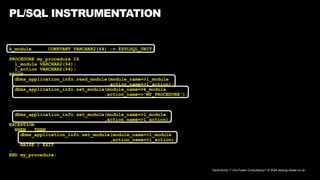
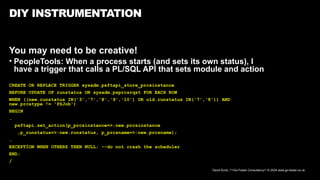
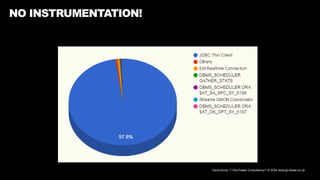
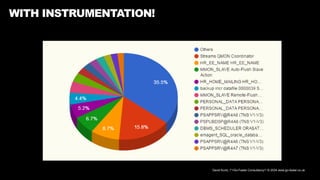
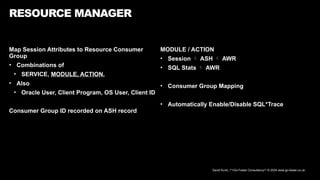
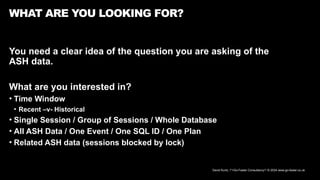
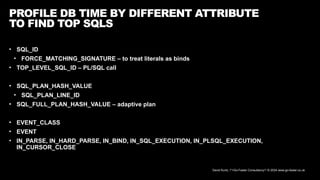
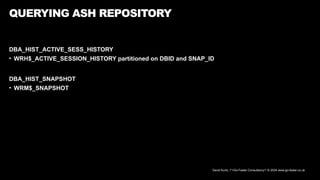
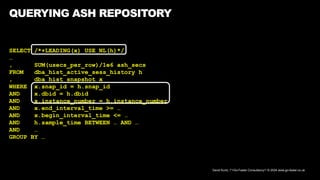
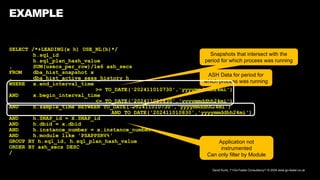
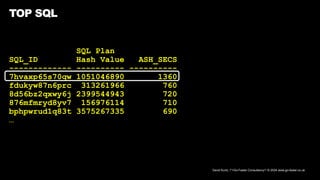
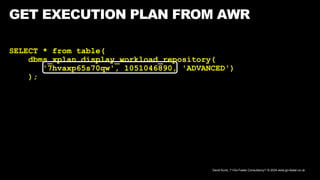
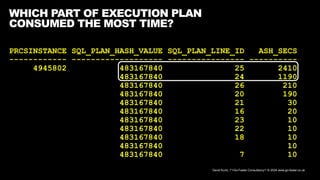
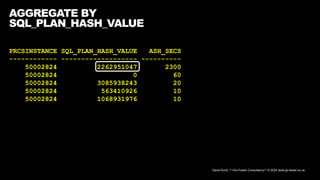
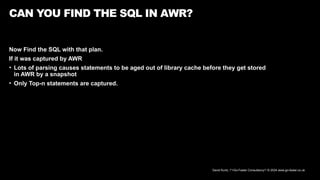
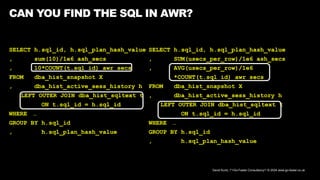
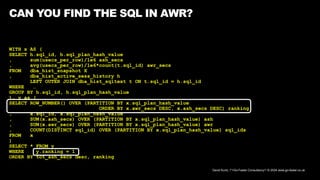
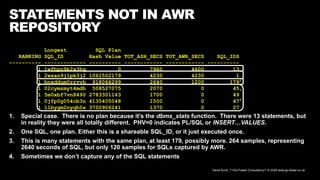
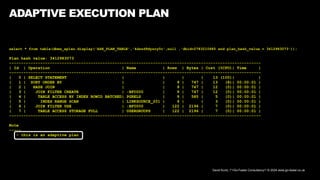
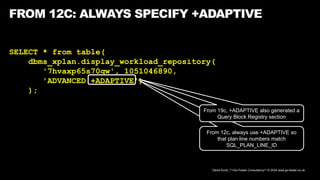
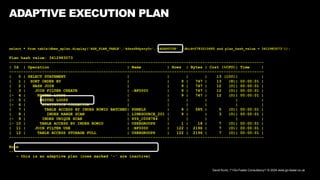
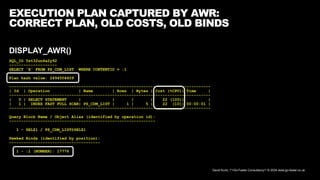
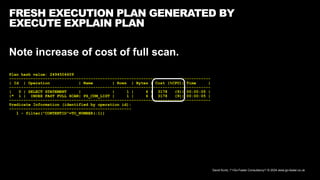
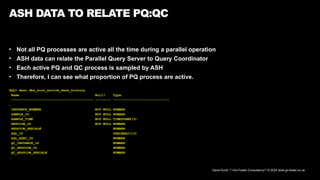
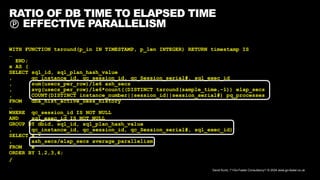
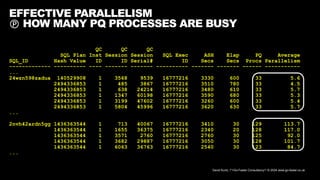
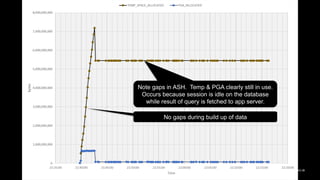
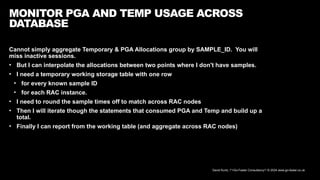
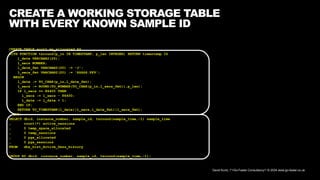
The document discusses the practical use of Active Session History (ASH) for database performance tuning, highlighting its low-overhead sampling technology built into Oracle databases. It covers various aspects of ASH, including data collection methods, usage scenarios, and SQL queries for data retrieval, while also mentioning tools and licensing considerations. Additionally, it emphasizes the importance of instrumentation and effective querying strategies for analyzing performance metrics.


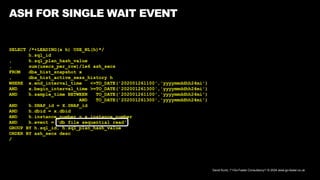


![David Kurtz, /*+Go-Faster Consultancy*/ © 2024 www.go-faster.co.uk
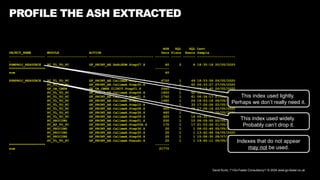
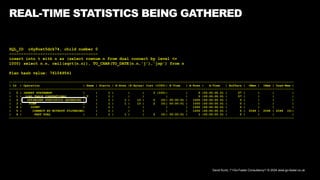
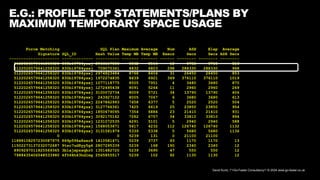
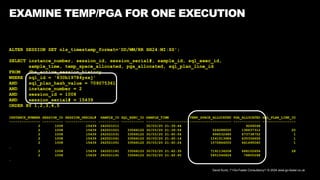
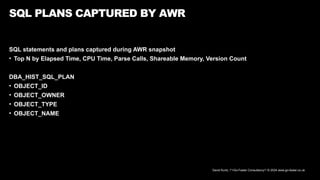
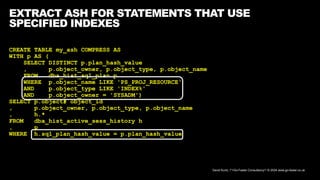
PROFILE THE ASH EXTRACTED
WITH h AS (
SELECT object_name
, CASE WHEN h.module IS NULL THEN REGEXP_SUBSTR(h.program,'[^.@]+',1,1)
WHEN h.module LIKE 'PSAE.%' THEN REGEXP_SUBSTR(h.module,'[^.]+',1,2)
ELSE REGEXP_SUBSTR(h.program,'[^.@]+',1,1)
END as module
, CASE WHEN h.action LIKE 'PI=%' THEN NULL
ELSE h.action
END as action
, CAST(sample_time AS DATE) sample_time
, sql_id, sql_plan_hash_value, sql_exec_id
FROM my_ash h
)
SELECT object_name, module, action
, sum(usecs_per_row)/1e6 ash_secs
, COUNT(DISTINCT sql_plan_hash_value) sql_plans
, COUNT(DISTINCT sql_id||sql_plan_hash_value||sql_exec_id) sql_execs
, MAX(sample_time) max_sample_time
FROM h
WHERE NOT lower(module) IN('oracle','toad','sqlplus','sqlplusw')
AND NOT lower(module) LIKE 'sql%'
GROUP BY object_name, module, action
ORDER BY object_name, object_name, ash_secs desc](https://image.slidesharecdn.com/practicalash-ukoug2024-241126223757-d81c5e10/85/The-Practical-Use-of-Active-Session-History-139-320.jpg)