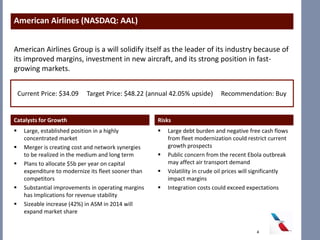
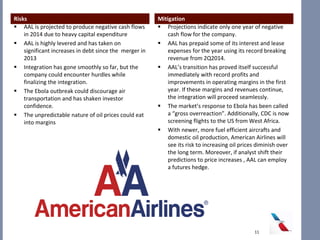
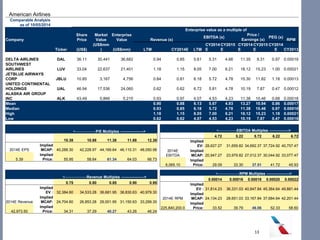
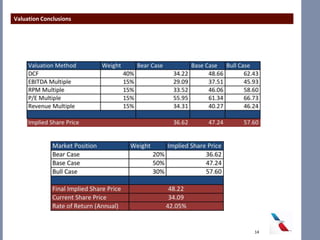
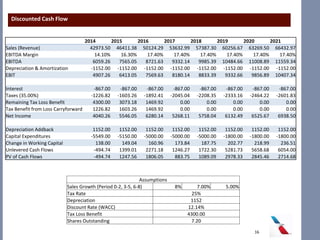
AMERICAN AIRLINES
Arvind Viswanathan, Nakul Karnik & Daniel Dorchuck
1
Table of Contents
I. Investment Thesis
I. Industry Outlook
II. Company Profile
I. Financials & Valuation
2
INVESTMENT THESIS
3
Catalysts for Growth
 Large, established position in a highly
concentrated market
 Merger is creating cost and network synergies
to be realized in the medium and long term
 Plans to allocate $5b per year on capital
expenditure to modernize its fleet sooner than
competitors
 Substantial improvements in operating margins
has Implications for revenue stability
 Sizeable increase (42%) in ASM in 2014 will
expand market share
Risks
 Large debt burden and negative free cash flows
from fleet modernization could restrict current
growth prospects
 Public concern from the recent Ebola outbreak
may affect air transport demand
 Volatility in crude oil prices will significantly
impact margins
 Integration costs could exceed expectations
American Airlines (NASDAQ: AAL)
Current Price: $34.09 Target Price: $48.22 (annual 42.05% upside) Recommendation: Buy
American Airlines Group is a will solidify itself as the leader of its industry because of
its improved margins, investment in new aircraft, and its strong position in fast-
growing markets.
4
INDUSTRY OUTLOOK
5
Airline Demand Outlook
Worldwide GDP has shown consistent growth and
is projected to continue growing
 GDP growth is directly linked to disposable
income and consumer spending
Scheduled air traffic is strongly tied to economic
output
 Passenger traffic growth has historically
exceeded GDP growth
 Airline demand and traffic have doubled every
15 years and are expected to double by 2028
Emerging markets are leading GDP growth and air
traffic growth
 Emerging markets are projected to outpace
developed economies in economic growth
 These markets are driving air traffic growth
since air traffic is linked to regional economic
growth
 The middle class in expanding regions is
projected to increase from 1.413 billion to
2.782 billion by 2023
GDP Growth
Revenue Passenger Miles (RPM) Growth
6
Real crude oil prices are expected to decline over
the next 10 years
 Jet fuel is the largest cost for airline companies
accounting for up to 40% of operating costs
 Crack spread has narrowed further decreasing
fuel costs
 Industry margins will widen as input prices
decrease
 Firms are decreasing fuel hedging exposures in
reaction to decreasing prices and volatility,
further lowering costs
5-Year Historical Return on Airlines
Crude Oil Prices
Airline equities have historically outperformed
the market
 Airline stocks have provided a premium of
approximately 100% over the S&P 500 for a 5-
year period
 Investor confidence in the airline industry has
been steadily improving
 Airline companies have increasingly begun to
pay dividends to reward shareholders
7
COMPANY PROFILE
8
Competitive Advantages
 Industry leader in in both revenue passenger
miles and cost per available seat: highest capacity
and lowest cost per seat
 Superior presence in high-growth cities and
regions: largest share of Latin American market
for US airlines plus large presence in London,
Dallas, & Washington D.C.
 Most liquid airline in 1Q2014 (cash over last
year’s revenue)
 AA’s frequent flier program is the largest of any
competitor and was named the most generous
Effective Strategies
 Through its capital deployment program, AAL has
prepaid debt & leases, funded employee
benefits, bought back shares, and returned a
quarterly dividend.
 Capital expenditure will give AAL the youngest,
most fuel efficient fleet in North America in
roughly 5 years time
 International expansion through OneWorld
Alliance
 New routes (direct DFW to Beijing & Seattle to
Haneda) will tap the Asian markets
9
RISKS AND MITIGATION
10
Risks
 AAL is projected to produce negative cash flows
in 2014 due to heavy capital expenditure
 AAL is highly levered and has taken on
significant increases in debt since the merger in
2013
 Integration has gone smoothly so far, but the
company could encounter hurdles while
finalizing the integration.
 The Ebola outbreak could discourage air
transportation and has shaken investor
confidence.
 The unpredictable nature of oil prices could eat
into margins
Mitigation
 Projections indicate only one year of negative
cash flow for the company.
 AAL has prepaid some of its interest and lease
expenses for the year using its record breaking
revenue from 2Q2014.
 AAL’s transition has proved itself successful
immediately with record profits and
improvements in operating margins in the first
year. If these margins and revenues continue,
the integration will proceed seamlessly.
 The market’s response to Ebola has been called
a “gross overreaction”. Additionally, CDC is now
screening flights to the US from West Africa.
 With newer, more fuel efficient aircrafts and
domestic oil production, American Airlines will
see its risk to increasing oil prices diminish over
the long term. Moreover, if analyst shift their
predictions to price increases , AAL can employ
a futures hedge.
11
VALUATION
12
American Airlines
Comparable Analysis
as of 10/05/2014
Enterprise value as a multiple of
Company
Share
Price
Market
Value
Enterprise
Value Revenue (x)
EBITDA (x)
Price /
Earnings (x)
PEG (x)
RPM
Ticker (US$)
(US$mm
) (US$mm) LTM CY2014E LTM
CY2014
E
CY2015
E
CY2014
E
CY2015
E
CY2014
E CY2013
DELTA AIRLINES DAL 36.11 30,441 36,682 0.94 0.85 5.61 5.31 4.66 11.35 9.31 0.97 0.00019
SOUTHWEST
AIRLINES LUV 33.04 22,637 21,401 1.18 1.15 8.05 7.00 6.21 18.12 15.23 1.00 0.00021
JETBLUE AIRWAYS
CORP JBLU 10.85 3,167 4,756 0.84 0.81 6.18 5.72 4.78 15.30 11.82 1.18 0.00013
UNITED CONTINENTAL
HOLDINGS UAL 46.94 17,536 24,060 0.62 0.62 6.72 5.81 4.78 10.19 7.87 0.47 0.00012
ALASKA AIR GROUP
INC ALK 43.49 5,866 5,215 0.93 0.97 4.07 4.53 4.23 11.38 10.46 0.68 0.00018
Mean 0.90 0.88 6.13 5.67 4.93 13.27 10.94 0.86 0.00017
Median 0.93 0.85 6.18 5.72 4.78 11.38 10.46 0.97 0.00018
High 1.18 1.15 8.05 7.00 6.21 18.12 15.23 1.18 0.00021
Low 0.62 0.62 4.07 4.53 4.23 10.19 7.87 0.47 0.00018
<----------------P/E Multiples ------------------>
10.38 10.88 11.38 11.88 12.38
2014E EPS
Implied
MCAP: 40,288.30 42,228.97 44,169.64 46,110.31 48,050.98
5.39
Implied
Price: 55.95 58.64 61.34 64.03 66.73
<--------------EBITDA Multiples --------------->
4.72 5.22 5.72 6.22 6.72
Implied
EV: 28,627.27 31,659.82 34,692.37 37,724.92 40,757.47
2014E
EBITDA
Implied
MCAP: 20,947.27 23,979.82 27,012.37 30,044.92 33,077.47
6,065.10
Implied
Price: 29.09 33.30 37.51 41.72 45.93
<-----------------Revenue Multiples ------------------>
0.75 0.80 0.85 0.90 0.95
Implied
EV : 32,384.60 34,533.28 36,681.95 38,830.63 40,979.30
2014E Revenue
Implied
MCAP: 24,704.60 26,853.28 29,001.95 31,150.63 33,299.30
42,973.50
Implied
Price: 34.31 37.29 40.27 43.26 46.24
<-----------------RPM Multiples ------------------>
0.00014 0.00016 0.00018 0.00020 0.00022
Implied
EV : 31,814.23 36,331.03 40,847.84 45,364.64 49,881.44
2014E RPM
Implied
MCAP: 24,134.23 28,651.03 33,167.84 37,684.64 42,201.44
225,840,200.0
Implied
Price: 33.52 39.79 46.06 52.33 58.60
13
Valuation Conclusions
14
APPENDIX
15
Discounted Cash Flow
2014 2015 2016 2017 2018 2019 2020 2021
Sales (Revenue) 42973.50 46411.38 50124.29 53632.99 57387.30 60256.67 63269.50 66432.97
EBITDA Margin 14.10% 16.30% 17.40% 17.40% 17.40% 17.40% 17.40% 17.40%
EBITDA 6059.26 7565.05 8721.63 9332.14 9985.39 10484.66 11008.89 11559.34
Depreciation & Amortization -1152.00 -1152.00 -1152.00 -1152.00 -1152.00 -1152.00 -1152.00 -1152.00
EBIT 4907.26 6413.05 7569.63 8180.14 8833.39 9332.66 9856.89 10407.34
Interest -867.00 -867.00 -867.00 -867.00 -867.00 -867.00 -867.00 -867.00
Taxes (35.00%) -1226.82 -1603.26 -1892.41 -2045.04 -2208.35 -2333.16 -2464.22 -2601.83
Remaining Tax Loss Benefit 4300.00 3073.18 1469.92 0.00 0.00 0.00 0.00 0.00
Tax Benefit from Loss Carryforward 1226.82 1603.26 1469.92 0.00 0.00 0.00 0.00 0.00
Net Income 4040.26 5546.05 6280.14 5268.11 5758.04 6132.49 6525.67 6938.50
Depreciation Addback 1152.00 1152.00 1152.00 1152.00 1152.00 1152.00 1152.00 1152.00
Capital Expenditures -5549.00 -5150.00 -5000.00 -5000.00 -5000.00 -1800.00 -1800.00 -1800.00
Change in Working Capital 138.00 149.04 160.96 173.84 187.75 202.77 218.99 236.51
Unlevered Cash Flows -494.74 1399.01 2271.18 1246.27 1722.30 5281.73 5658.68 6054.00
PV of Cash Flows -494.74 1247.56 1806.05 883.75 1089.09 2978.33 2845.46 2714.68
Assumptions
Sales Growth (Period 0-2, 3-5, 6-8) 8% 7.00% 5.00%
Tax Rate 25%
Depreciation 1152
Discount Rate (WACC) 12.14%
Tax Loss Benefit 4300.00
Shares Outstanding 7.20
16

AAL FINAL

  • 1.
    AMERICAN AIRLINES Arvind Viswanathan,Nakul Karnik & Daniel Dorchuck 1
  • 2.
    Table of Contents I.Investment Thesis I. Industry Outlook II. Company Profile I. Financials & Valuation 2
  • 3.
  • 4.
    Catalysts for Growth Large, established position in a highly concentrated market  Merger is creating cost and network synergies to be realized in the medium and long term  Plans to allocate $5b per year on capital expenditure to modernize its fleet sooner than competitors  Substantial improvements in operating margins has Implications for revenue stability  Sizeable increase (42%) in ASM in 2014 will expand market share Risks  Large debt burden and negative free cash flows from fleet modernization could restrict current growth prospects  Public concern from the recent Ebola outbreak may affect air transport demand  Volatility in crude oil prices will significantly impact margins  Integration costs could exceed expectations American Airlines (NASDAQ: AAL) Current Price: $34.09 Target Price: $48.22 (annual 42.05% upside) Recommendation: Buy American Airlines Group is a will solidify itself as the leader of its industry because of its improved margins, investment in new aircraft, and its strong position in fast- growing markets. 4
  • 5.
  • 6.
    Airline Demand Outlook WorldwideGDP has shown consistent growth and is projected to continue growing  GDP growth is directly linked to disposable income and consumer spending Scheduled air traffic is strongly tied to economic output  Passenger traffic growth has historically exceeded GDP growth  Airline demand and traffic have doubled every 15 years and are expected to double by 2028 Emerging markets are leading GDP growth and air traffic growth  Emerging markets are projected to outpace developed economies in economic growth  These markets are driving air traffic growth since air traffic is linked to regional economic growth  The middle class in expanding regions is projected to increase from 1.413 billion to 2.782 billion by 2023 GDP Growth Revenue Passenger Miles (RPM) Growth 6
  • 7.
    Real crude oilprices are expected to decline over the next 10 years  Jet fuel is the largest cost for airline companies accounting for up to 40% of operating costs  Crack spread has narrowed further decreasing fuel costs  Industry margins will widen as input prices decrease  Firms are decreasing fuel hedging exposures in reaction to decreasing prices and volatility, further lowering costs 5-Year Historical Return on Airlines Crude Oil Prices Airline equities have historically outperformed the market  Airline stocks have provided a premium of approximately 100% over the S&P 500 for a 5- year period  Investor confidence in the airline industry has been steadily improving  Airline companies have increasingly begun to pay dividends to reward shareholders 7
  • 8.
  • 9.
    Competitive Advantages  Industryleader in in both revenue passenger miles and cost per available seat: highest capacity and lowest cost per seat  Superior presence in high-growth cities and regions: largest share of Latin American market for US airlines plus large presence in London, Dallas, & Washington D.C.  Most liquid airline in 1Q2014 (cash over last year’s revenue)  AA’s frequent flier program is the largest of any competitor and was named the most generous Effective Strategies  Through its capital deployment program, AAL has prepaid debt & leases, funded employee benefits, bought back shares, and returned a quarterly dividend.  Capital expenditure will give AAL the youngest, most fuel efficient fleet in North America in roughly 5 years time  International expansion through OneWorld Alliance  New routes (direct DFW to Beijing & Seattle to Haneda) will tap the Asian markets 9
  • 10.
  • 11.
    Risks  AAL isprojected to produce negative cash flows in 2014 due to heavy capital expenditure  AAL is highly levered and has taken on significant increases in debt since the merger in 2013  Integration has gone smoothly so far, but the company could encounter hurdles while finalizing the integration.  The Ebola outbreak could discourage air transportation and has shaken investor confidence.  The unpredictable nature of oil prices could eat into margins Mitigation  Projections indicate only one year of negative cash flow for the company.  AAL has prepaid some of its interest and lease expenses for the year using its record breaking revenue from 2Q2014.  AAL’s transition has proved itself successful immediately with record profits and improvements in operating margins in the first year. If these margins and revenues continue, the integration will proceed seamlessly.  The market’s response to Ebola has been called a “gross overreaction”. Additionally, CDC is now screening flights to the US from West Africa.  With newer, more fuel efficient aircrafts and domestic oil production, American Airlines will see its risk to increasing oil prices diminish over the long term. Moreover, if analyst shift their predictions to price increases , AAL can employ a futures hedge. 11
  • 12.
  • 13.
    American Airlines Comparable Analysis asof 10/05/2014 Enterprise value as a multiple of Company Share Price Market Value Enterprise Value Revenue (x) EBITDA (x) Price / Earnings (x) PEG (x) RPM Ticker (US$) (US$mm ) (US$mm) LTM CY2014E LTM CY2014 E CY2015 E CY2014 E CY2015 E CY2014 E CY2013 DELTA AIRLINES DAL 36.11 30,441 36,682 0.94 0.85 5.61 5.31 4.66 11.35 9.31 0.97 0.00019 SOUTHWEST AIRLINES LUV 33.04 22,637 21,401 1.18 1.15 8.05 7.00 6.21 18.12 15.23 1.00 0.00021 JETBLUE AIRWAYS CORP JBLU 10.85 3,167 4,756 0.84 0.81 6.18 5.72 4.78 15.30 11.82 1.18 0.00013 UNITED CONTINENTAL HOLDINGS UAL 46.94 17,536 24,060 0.62 0.62 6.72 5.81 4.78 10.19 7.87 0.47 0.00012 ALASKA AIR GROUP INC ALK 43.49 5,866 5,215 0.93 0.97 4.07 4.53 4.23 11.38 10.46 0.68 0.00018 Mean 0.90 0.88 6.13 5.67 4.93 13.27 10.94 0.86 0.00017 Median 0.93 0.85 6.18 5.72 4.78 11.38 10.46 0.97 0.00018 High 1.18 1.15 8.05 7.00 6.21 18.12 15.23 1.18 0.00021 Low 0.62 0.62 4.07 4.53 4.23 10.19 7.87 0.47 0.00018 <----------------P/E Multiples ------------------> 10.38 10.88 11.38 11.88 12.38 2014E EPS Implied MCAP: 40,288.30 42,228.97 44,169.64 46,110.31 48,050.98 5.39 Implied Price: 55.95 58.64 61.34 64.03 66.73 <--------------EBITDA Multiples ---------------> 4.72 5.22 5.72 6.22 6.72 Implied EV: 28,627.27 31,659.82 34,692.37 37,724.92 40,757.47 2014E EBITDA Implied MCAP: 20,947.27 23,979.82 27,012.37 30,044.92 33,077.47 6,065.10 Implied Price: 29.09 33.30 37.51 41.72 45.93 <-----------------Revenue Multiples ------------------> 0.75 0.80 0.85 0.90 0.95 Implied EV : 32,384.60 34,533.28 36,681.95 38,830.63 40,979.30 2014E Revenue Implied MCAP: 24,704.60 26,853.28 29,001.95 31,150.63 33,299.30 42,973.50 Implied Price: 34.31 37.29 40.27 43.26 46.24 <-----------------RPM Multiples ------------------> 0.00014 0.00016 0.00018 0.00020 0.00022 Implied EV : 31,814.23 36,331.03 40,847.84 45,364.64 49,881.44 2014E RPM Implied MCAP: 24,134.23 28,651.03 33,167.84 37,684.64 42,201.44 225,840,200.0 Implied Price: 33.52 39.79 46.06 52.33 58.60 13
  • 14.
  • 15.
  • 16.
    Discounted Cash Flow 20142015 2016 2017 2018 2019 2020 2021 Sales (Revenue) 42973.50 46411.38 50124.29 53632.99 57387.30 60256.67 63269.50 66432.97 EBITDA Margin 14.10% 16.30% 17.40% 17.40% 17.40% 17.40% 17.40% 17.40% EBITDA 6059.26 7565.05 8721.63 9332.14 9985.39 10484.66 11008.89 11559.34 Depreciation & Amortization -1152.00 -1152.00 -1152.00 -1152.00 -1152.00 -1152.00 -1152.00 -1152.00 EBIT 4907.26 6413.05 7569.63 8180.14 8833.39 9332.66 9856.89 10407.34 Interest -867.00 -867.00 -867.00 -867.00 -867.00 -867.00 -867.00 -867.00 Taxes (35.00%) -1226.82 -1603.26 -1892.41 -2045.04 -2208.35 -2333.16 -2464.22 -2601.83 Remaining Tax Loss Benefit 4300.00 3073.18 1469.92 0.00 0.00 0.00 0.00 0.00 Tax Benefit from Loss Carryforward 1226.82 1603.26 1469.92 0.00 0.00 0.00 0.00 0.00 Net Income 4040.26 5546.05 6280.14 5268.11 5758.04 6132.49 6525.67 6938.50 Depreciation Addback 1152.00 1152.00 1152.00 1152.00 1152.00 1152.00 1152.00 1152.00 Capital Expenditures -5549.00 -5150.00 -5000.00 -5000.00 -5000.00 -1800.00 -1800.00 -1800.00 Change in Working Capital 138.00 149.04 160.96 173.84 187.75 202.77 218.99 236.51 Unlevered Cash Flows -494.74 1399.01 2271.18 1246.27 1722.30 5281.73 5658.68 6054.00 PV of Cash Flows -494.74 1247.56 1806.05 883.75 1089.09 2978.33 2845.46 2714.68 Assumptions Sales Growth (Period 0-2, 3-5, 6-8) 8% 7.00% 5.00% Tax Rate 25% Depreciation 1152 Discount Rate (WACC) 12.14% Tax Loss Benefit 4300.00 Shares Outstanding 7.20 16