Download to read offline
![L. Alnufaie Int. Journal of Engineering Research and Application www.ijera.com
ISSN : 2248-9622, Vol. 5, Issue 6, ( Part -1) June 2015, pp.01-03
www.ijera.com 3 | P a g e
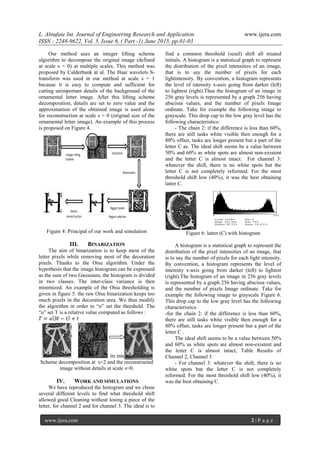
Table: Results of Channel 2, Channel 3
Shift of
Seuil
Value of
Seuil
channel 2 channel 3
40% 205
50% 213
60% 221
70% 229
80% 237
V. CONCLUSION
In this article, an original method segmentation
method for ornamental lettershas been proposed. This
method consists in a coarse to fine segmentation with
progressive improvements. The atomic step of the
process is composed of a modified Otsu binarization,
followed by a selection of the biggest onnected
component. This image represents the seed of a
morphological reconstruction. Our multiresolution
approach offers a very good separation of letter
information and decoration information. The Results
are very good even on difficult images composed of
many decorations of various sizes which are the most
difficult images to process in such kind of image
analysis problems.
REFERENCES
[1] J. Zhang and J. Hu, Image, Segmentation
Based on 2D Otsu Method with Histogram
Analysis, International Conference on
Computer Science and Software
Engineering, IEEE 2008.
[2] W. Hongzhi and D. Ying, An Improved
Image Segmentation Algorithm Based on
Otsu Method, International Symposium on
Photoelectronic Detection and Imaging
2007, Related Technologies and
Applications, ( 6625), 2008.
[3] J. Roerdink and Arnold Meijster, The
Watershed Transform: De_nitions,
Algorithms and Parallelization Strategies
Fundamenta Informaticae (IOS Press, 2001).
[4] R. Gonzalez and R. Woods, Digital Image
Processing, (Third edition, PHI publication,
2008).
[5] J.-Y. Ramel and S. Leriche. Segmentation
en analyse interactives de documents
anciens imprimés. Traitement du Signal,
22(3),2005, 209–222
[6] S. Uttama, J.-M. Ogier, and P. Loonis, Top-
down segmentation of ancient graphical
drop caps, lettrines, In Proceedings of 6th
IAPR International Workshop on Graphics
Recognition, HongKong, pages 87–96,
August 2005.
[7] E. Baudrier, F. Nicolier, G. Millon, and S.
Ruan. Binaryimage comparison with local-
dissimilarity quantification.Pattern
Recognition, 41(5), 2008, 1461–1478,.
[8] K. Ersahin, I. Cumming, and R. Ward,
Segmentation and classification of
polarimetric SAR data using spectral graph
partitioning, IEEE Trans. Geos. Remote
Sens, 48(1), 2010, 164-174
[9] N. Senthilkumaran and R. Rajesh, Edge
Detection Techniques for Image
Segmentation – A Survey of Soft Computing
Approaches, International Journal of Recent
Trends in Engineering, 2(1), 2009.
[10] J.-M. Ogier and K. Tombre. Madonne,
Document image analysis techniques for
cultural heritage documents. In International
Conference on Digital Cultural Heritage,
2006.
[11] J. Ramel, S. Leriche, M.-L. Demonet, and S.
Busson. Userdriven page layout analysis of
historical printed books. International
Journal on Document Analysis and
Recognition (IJDAR), 9(2–4), 2007, 243–
267.
[12] N. Salman, Image Segmentation Based on
Watershed and Edge Detection Techniques,
The International Arab Journal of
Information Technology, 2(3), 2006.
[13] I. Patel and S. Garg, Robust Face Detection
using Fusion of Haar and Daubechies
Orthogonal Wavelet Template, International
Journal of Computer Applications, 46(6),
2012,38-44.
[14] I. Patel and R. Patel,Robust Face
Recognition Using Distance Matrice,
International Journal of Computer and
Electrical Engineering, 5( 4), 2013, 401-
404.
[15] D. Saraf, D. Sisodia, A. Sinhal and N. Gupta
, Comparisons of wavelets based image
compression methods, World Journal of
Science and Technology, 2(3)2012, 2231 –
2587](https://image.slidesharecdn.com/a56010103-150802112014-lva1-app6892/85/Extract-the-ancient-letters-from-decorated-3-320.jpg)

This article presents a method for analyzing ornamental letters in document images, utilizing wavelet transformation and segmentation techniques to enhance recognition. The process involves removing background details while preserving the letter's shape, followed by binarization to maintain letter pixels and eliminate decorative elements. The proposed method demonstrates efficacy in extracting and reconstructing letters from complex images, offering significant advancements in the analysis of historical printed materials.